Giant dust particles at Nevado Illimani: a proxy of summertime deep convection over the Bolivian Altiplano - The Cryosphere
←
→
Page content transcription
If your browser does not render page correctly, please read the page content below
The Cryosphere, 15, 1383–1397, 2021
https://doi.org/10.5194/tc-15-1383-2021
© Author(s) 2021. This work is distributed under
the Creative Commons Attribution 4.0 License.

Giant dust particles at Nevado Illimani: a proxy of summertime
deep convection over the Bolivian Altiplano
Filipe G. L. Lindau1 , Jefferson C. Simões1,2 , Barbara Delmonte3 , Patrick Ginot4 , Giovanni Baccolo3 ,
Chiara I. Paleari3 , Elena Di Stefano3 , Elena Korotkikh2 , Douglas S. Introne2 , Valter Maggi3 , Eduardo Garzanti3 , and
Sergio Andò3
1 Centro Polar e Climático, Universidade Federal do Rio Grande do Sul, Porto Alegre, 91501-970, Brazil
2 Climate Change Institute, University of Maine, Orono, ME 04469, USA
3 Department of Environmental and Earth Sciences, University of Milano-Bicocca, 20126 Milan, Italy
4 Univ. Grenoble Alpes, CNRS, IRD, Grenoble INP, IGE, 38000 Grenoble, France

Correspondence: Filipe G. L. Lindau (filipelindau@hotmail.com)

Received: 14 February 2020 – Discussion started: 8 April 2020
Revised: 5 February 2021 – Accepted: 12 February – Published: 16 March 2021

Abstract. A deeper understanding of past atmospheric cir-          1   Introduction
culation variability in the Central Andes is a high-priority
topic in paleoclimatology mainly because of the necessity to
validate climate models used to predict future precipitation       Climate variability in the Central Andes and the Bolivian Al-
trends and to develop mitigation and/or adaptation strategies      tiplano has a strong link with atmospheric circulation and
for future climate change scenarios in this region. Within this    rainfall anomalies over the rest of tropical South America
context, we here investigate an 18-year firn core drilled at       (e.g., Vuille, 1999). Over the Altiplano, a semiarid plateau
Nevado Illimani in order to interpret its mineral dust record      in the Central Andes with a mean elevation of 3800 m above
in relation to seasonal processes, in particular atmospheric       the sea level (a.s.l.; Fig. 1), climate variations have a direct
circulation and deep convection. The core was dated by an-         effect on the availability of water resources with severe eco-
nual layer counting based on seasonal oscillations of dust,        nomic and social impacts (Garreaud and Aceituno, 2001).
calcium, and stable isotopes. Geochemical and mineralogi-          The recent retreat of Andean glaciers due to global climate
cal data show that dust is regionally sourced in winter and        change (Rabatel et al., 2013) poses issues not only for water
summer. During austral summer (wet season), an increase in         availability (Soruco et al., 2015) but also for the preserva-
the relative proportion of giant dust particles (∅ > 20 µm) is     tion of glaciers as natural archives that could soon be lost.
observed, in association with oscillations of stable isotope       For example, in the period between the years 1963 and 2009,
records (δD, δ 18 O). It seems that at Nevado Illimani both the    Nevado Illimani (Fig. 1) lost approximately 35 % (9.49 km2 )
deposition of dust and the isotopic signature of precipitation     of its total area (Ribeiro et al., 2013). On the Quelccaya Ice
are influenced by atmospheric deep convection, which is also       Cap (13◦ 540 S, 70◦ 480 W; 5670 m a.s.l.; Fig. 1), the seasonal
related to the total amount of precipitation in the area. This     variations in stable isotopes began to deteriorate because of
hypothesis is corroborated by regional meteorological data.        the percolation of meltwater through firn, affecting the record
The interpretation of giant particle and stable isotope records    corresponding to the latter half of the 20th century, although
suggests that downdrafts due to convective activity promote        the seasonality of the dust record is still preserved (Thomp-
turbulent conditions capable of suspending giant particles in      son et al., 2017).
the vicinity of Nevado Illimani. Giant particles and stable iso-      Precipitation on the Bolivian Altiplano is largely concen-
topes, when considered together, can be therefore used as a        trated in the summer months (Garreaud et al., 2003) in re-
new proxy for obtaining information about deep convective          sponse to the peak phase of the South American summer
activity in the past.                                              monsoon (SAMS). During summer (December–January–
                                                                   February, DJF), the intensification and southward displace-

Published by Copernicus Publications on behalf of the European Geosciences Union.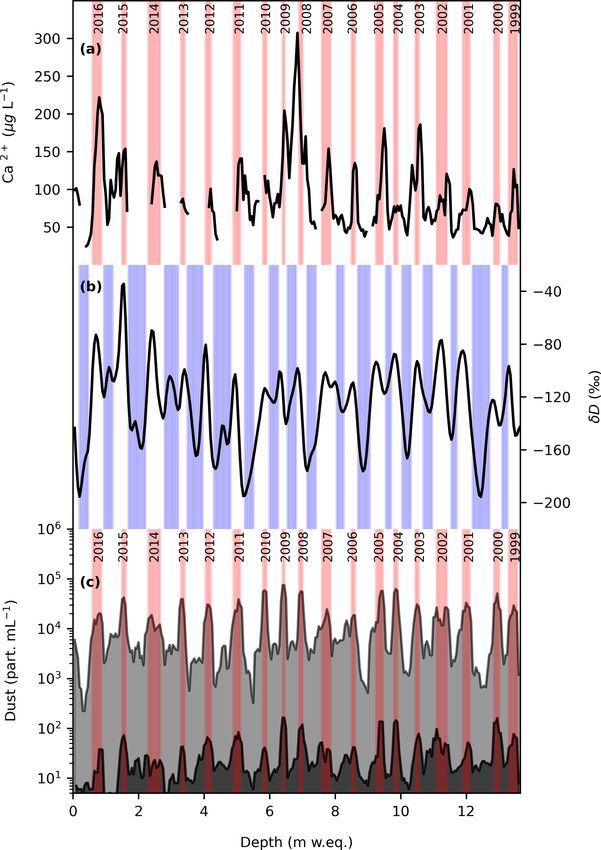
1384 F. G. L. Lindau et al.: Giant dust particles at Nevado Illimani
Besides seasonal variability, year-to-year climate over the
Altiplano is also influenced by conditions in the tropical Pa-
cific Ocean. During the warm phase of the El Niño–Southern
Oscillation (ENSO), the Altiplano climate is dry. Dry sum-
mers associated with El Niño events in the tropical Pacific
are characterized by enhanced westerly flow over the tropical
Andes inhibiting moisture advection from the Amazon Basin
(Knüsel et al., 2005; Thompson et al., 2013). Conversely, wet
summers associated with a cooling of the tropical Pacific (La
Niña events) promote further ingression of humid easterly air
masses from the Amazon Basin.
Developing an annually resolved ice core record from the
Altiplano is an opportunity to enhance our knowledge about
present and past climate variability in the tropical Andes re-
gion. Previous ice core studies from the Central Andes (Cor-
reia et al., 2003; Knüsel et al., 2005; Osmont et al., 2019)
reveal that the aerosol content of ice is dominated by local
(i.e., glacier basins from Nevado Illimani) and regional (the
Altiplano area) mineral dust during the winter when black
carbon from biomass burning in the Amazon Basin is also
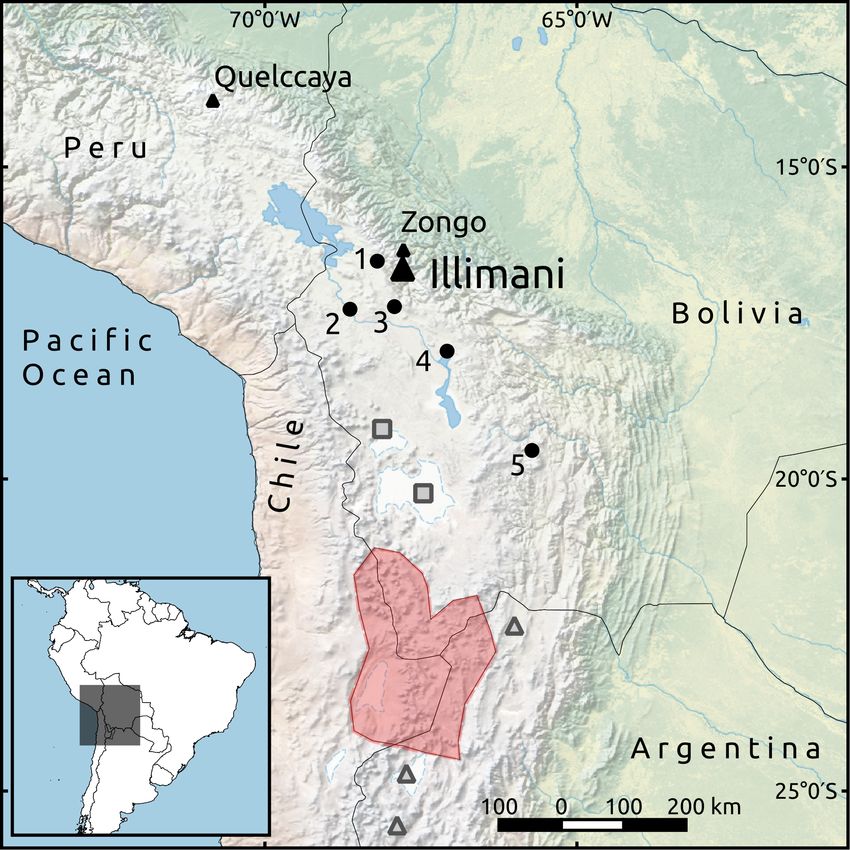
Figure 1. Location of Nevado Illimani, the Zongo Valley, and the present. During the summer, conversely, the concentration of
Quelccaya Ice Cap. The numbers indicate the location of the me- aerosol and particulate matter is much lower, while impuri-
teorological stations used for comparison with our results: 1 – El ties of anthropogenic origin (e.g., Cu, As, and Cd) are ob-
Alto; 2 – Calacoto; 3 – Patacamaya; 4 – Oruro; and 5 – Potosi.
served in higher proportions (Correia et al., 2003).
The red area indicates the Altiplano-Puna Volcanic Complex (Lind-
say et al., 2001). The gray squares and gray triangles denote po-
With the aim of enhancing our knowledge about past and
tential dust source areas in the salars of the Altiplano and in the present climate variability in the tropical Andes region, a new
Puna, respectively (Gaiero et al., 2013). The land basemap was de- shallow firn core (23.8 m long) was drilled on Nevado Illi-
rived from satellite data (Natural Earth I with shaded relief from mani (eastern Cordillera, Central Andes) as an integration
http://www.naturalearthdata.com, last access: 12 October 2020). of the Ice Memory project (https://www.ice-memory.org, last
access: 5 February 2021). In this study, we investigate min-
eral dust aerosol variability and provenance in this firn core
ment of the Bolivian anticyclone (hereafter referred as Boli- through the analysis of dust concentration, grain size, geo-
vian high) promote strong easterly winds and a turbulent en- chemistry, and mineralogy. The very pronounced seasonal
trainment of easterly air masses over the Andean ridge. In ad- variations in the analyzed proxies allowed for the develop-
dition, the upward motion over the western Amazon, which is ment of a precise chronology, which covers the 1999–2017
part of the meridional circulation between the tropical North period, and for the investigation of the correlation between
Atlantic and western tropical South America, leads to in- dust records and other proxies. Dust particles entrapped in
creased convection and reduced tropospheric stability over firn samples seem to originate from regional sources during
the Central Andes (Segura et al., 2020). Such an atmospheric both winter and summer despite minor mineralogical differ-
context favors the establishment of an eastward upslope air- ences between the two seasons being observed.
flow and the advection of moisture from the Amazon Basin An interesting result concerns the presence of giant dust
toward the Andes (Zhou and Lau, 1998). Accordingly, sum- particles (presenting a diameter larger than 20 µm) whose rel-
mer precipitation is strongly associated with deep convective ative variability (compared to the smaller particles) is corre-
activity and is enhanced by high amounts of water vapor in lated to the stable isotope record. Very large mineral dust par-
the boundary layer which destabilize the tropospheric col- ticles were generally neglected in climate studies and under-
umn over the Altiplano (Garreaud, 1999). Precipitation dur- represented or not represented in global climate models be-
ing the rest of the year is scarce; during winter months (June– cause of their generally local origin with respect to the sam-
July–August, JJA), the Altiplano is generally very dry, the pling site and their relatively low number concentration (Al-
advection of dry air from the Pacific region is promoted, and bani et al., 2014; Adebiyi and Kok, 2020). The recent obser-
advection of moist air from the east is suppressed. Strong vation of such large dust grains even at a great distance from
winter westerly winds and dry conditions allow massive lo- the source puts into question the physical models used to es-
cal transport and deposition of dust over the Central Andean timate settling velocities and suggests some additional mech-
glaciers, and for this reason, a high seasonal contrast exists anisms such as strong turbulence and upper-level outflow are
between wet summer and dry winter snow layers in terms of needed to keep these dust particles aloft (van der Does et al.,
dust and aerosol content (Knüsel et al., 2005). 2018). As a consequence, there is now a growing interest
The Cryosphere, 15, 1383–1397, 2021 https://doi.org/10.5194/tc-15-1383-2021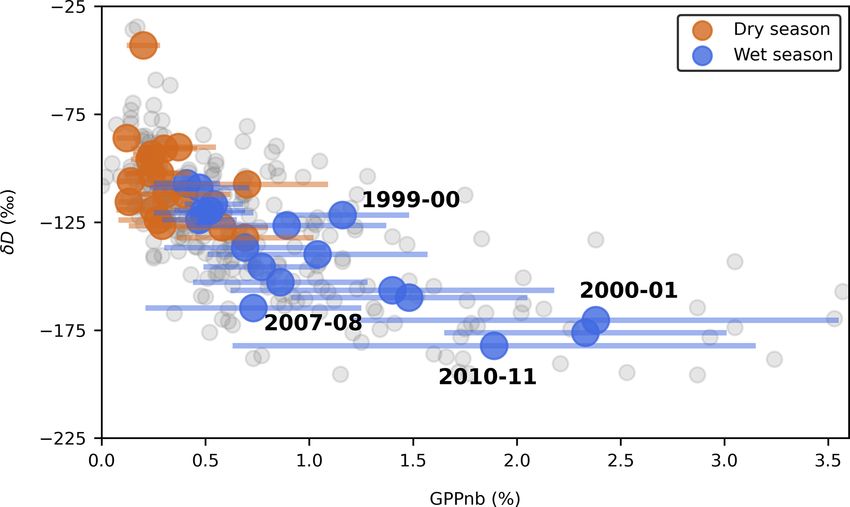
F. G. L. Lindau et al.: Giant dust particles at Nevado Illimani                                                               1385

in such relatively less abundant but volumetrically important          The core (diameter of 10 cm), consisting of 24 sections
dust grains which can play an important role in biogeochem-         of approximately 1 m length, was transported by mountain
ical cycles, in cloud microphysics, in the ocean carbon cycle,      porters from the drilling site to the base camp during the
and in the atmospheric radiation budget (van der Does et al.,       night in order to prevent melting. Once at the base camp,
2018; Ryder et al., 2019). A few studies have also considered       the core sections were immediately transported to a refriger-
large mineral particles in snow and ice, obtaining interesting      ated container located in La Paz where the temperature was
results in particular related to the relationships existing be-     set at −20 ◦ C. After the drilling campaign, the container was
tween coarse particles and the atmospheric patterns respon-         shipped to the Institut des Géosciences de l’Environnement
sible for their deflation, transport, and deposition (Kutuzov       (IGE; Université Grenoble Alpes, France) where the core
et al., 2016; Wu et al., 2009, 2010; Simonsen et al., 2019).        sections were weighed and cut longitudinally using a vertical
   Our data show that the proportion of giant dust particles        band saw in a cold room (at −15 ◦ C). The stratigraphy of the
into firn is correlated with local meteorological observations      firn core shows ∼1 to ∼5 cm thick layers with greater den-
and in particular with atmospheric deep convection over the         sity (visually detected) distributed throughout it. They may
Bolivian Altiplano during summer. This study shows for the          be ice layers and/or wind crusts, and the cause of each layer is
first time that climatic processes control the presence of gi-      difficult to investigate by visual stratigraphy alone (Kinnard
ant dust particles in Andean firn and ice. We found clear ev-       et al., 2008; Inoue et al., 2017). Thus, these features proba-
idence that the convective activity over the Altiplano, recon-      bly indicate events such as meltwater percolation, potentially
structed through the analysis of giant particles, is enhanced       affecting the core record by post-depositional changes. Ice
during summer periods, which is in agreement with obser-            and crust layers were counted and logged, being present in
vations concerning atmospheric circulation anomalies in the         37 % of the 464 samples produced for dust analysis. Sup-
area (Vuille, 1999). From this perspective, this study demon-       plement Fig. S1 shows the distribution of the ice and crust
strates the great potential of giant particle records which         layers observed in the firn core along with the records of the
are strongly influenced by climatic and meteorological pro-         giant particle percentage in terms of number (GPPnb; defined
cesses at high-altitude continental glaciers. This is a first ex-   in Sect. 2.2) and δD. These layers show no clear correspon-
ploratory work; analysis of a longer ice core would be de-          dence with the depth intervals where peak values and/or re-
sirable in the future to investigate the relationships between      duced seasonality in both records are observed. Depth inter-
giant dust particle deposition, atmospheric deep convection,        vals with multiple ice and crust layers show a similar vari-
and periodic climatic phenomena (La Niña).                          ability for both GPPnb and δD when compared with intervals
                                                                    showing few of these layers (Fig. S1). Thus, we consider that
                                                                    post-depositional processes related to the formation of ice
                                                                    and crust layers had little influence on the proxies registered
2     Material and method                                           in the firn core.
                                                                       One quarter of the original core was dedicated to dust anal-
2.1    Field campaign and firn core sampling                        yses and was transported for this purpose to the EUROCOLD
                                                                    facility of the University of Milano-Bicocca (Italy). There,
Nevado Illimani (16◦ 370 S, 67◦ 460 W; 6438 m a.s.l.) is lo-        firn sections were transversely cut at 5 cm using a horizon-
cated 50 km southeast of the Bolivian capital, La Paz, and          tal band saw with a cobalt steel blade, and 464 samples were
180 km southeast of Lake Titicaca (Fig. 1). Its approxi-            obtained. These were manually decontaminated by mechani-
mate dimensions are 10 km by 4 km with some peaks above             cal scraping with a clean ceramic knife inside a laminar flow
6000 m a.s.l. Nevado Illimani consists of a granodiorite plu-       high-efficiency particle air (HEPA) ISO 5 class bench located
ton of Late Oligocene age, with a short belt formed by a co-        in an ISO 6 class cold room. Once decontaminated, the sam-
eval dacitic flow located near the southwestern border of the       ples were put into clean Corning® centrifuge tubes and kept
pluton (McBride et al., 1983; Jiménez and López-Velásquez,          frozen until the measurements.
2008). In June 2017, a 23.8 m firn core (corresponding to
13.75 m w.e., water equivalent) was drilled at an altitude of       2.2   Coulter counter analysis
6350 m a.s.l. on the saddle between the two Nevado Illimani
summits, approximately where two deep ice cores were re-            Samples were melted at room temperature, and a ∼ 10 mL
covered in June 1999 (Knüsel et al., 2003). The expedition          aliquot from each was transferred to an Accuvette Beckman
was coordinated by a French, Russian, Bolivian, and Brazil-         Coulter vial previously washed with Millipore Q-POD® Ele-
ian team and was integrated in the Ice Memory project (Uni-         ment ultra-pure water (in an ISO 5 class laminar flow bench
versité Grenoble Alpes Foundation). An EM-100-1000 elec-            located inside an ISO 6 class clean laboratory). Each sam-
tromechanical ice core drill (Cryosphere Research Solutions,        ple was treated following standardized protocols (Delmonte
Columbus, Ohio, USA) was used for the drilling, and three           et al., 2002). A Beckman Coulter Multisizer 4 equipped with
cores were extracted: two down the bedrock (136 and 134 m)          a 100 µm orifice was used to measure dust concentration and
and the core for this study (23.8 m).                               grain size (400 size channels within the 2–60 µm interval of

https://doi.org/10.5194/tc-15-1383-2021                                                  The Cryosphere, 15, 1383–1397, 2021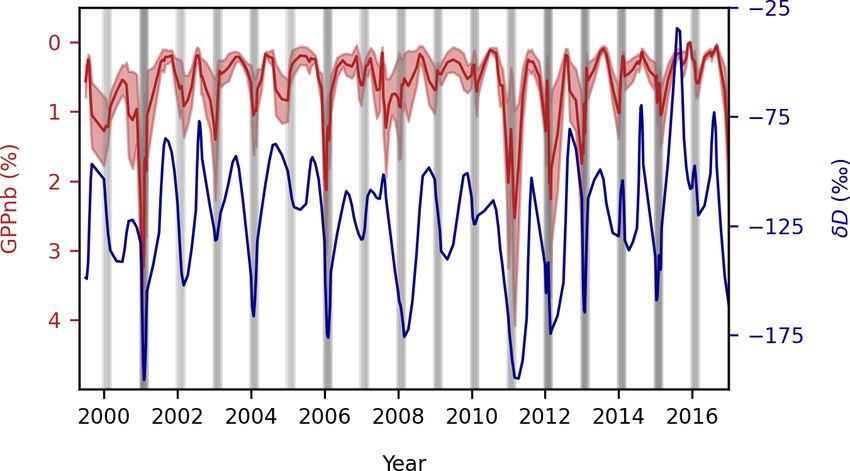
1386                                                             F. G. L. Lindau et al.: Giant dust particles at Nevado Illimani

equivalent spherical diameter). Samples were continuously               The masses of the elements in each sample were deter-
stirred until the moment of the analysis as the larger parti-        mined by comparing spectra related to standards and samples
cles tend to settle rapidly. Systematic analysis of ultra-pure       (Baccolo et al., 2016). In order to compare different spectra,
water blanks allows us to estimate a mean signal to noise ra-        the time of acquisition, the radionuclide decay constant, the
tio around 97. Each sample was measured twice, consuming             cooling time, and a factor considering radioactive decay dur-
0.5 mL per measurement. The mean relative standard devi-             ing the acquisition were kept in account. The detection limits
ation (RSD) between these two measurements considering               were calculated considering 3 times the standard deviation of
both the number and the mass of particles was 7 % and 29 %,          the blank signal. The uncertainties for each element were cal-
respectively.                                                        culated based on the mass measurements, the adjustment for
   The higher deviation for the mass in comparison to the to-        the spectrum, the subtraction of the blanks, and the standard
tal number of particles was expected due to the presence of          concentration uncertainties. Errors for the elemental concen-
heavy giant particles having diameters > 20 µm (coarse silt),        trations in our samples ranged from 3 % for La to 17 % for
for which small differences in size estimation lead to higher        Cs, and the detection limits ranged from 0.1 µg g−1 of dust
uncertainties. Indeed, when considering only the giant parti-        for Sm to 7 µg g−1 for Ce (Table S2). Full analytical details
cles, the mean RSDs were 55 % and 63 % for the number and            can be found in Baccolo et al. (2016).
mass distributions, respectively. Thus, the proportion (%) of           The enrichment factor (EF) normalization was calculated
giant particles (GPPnb), as well as total particle concentra-        for each element considering as a reference the mean com-
tion, was calculated from the number size distribution. Ap-          position of the upper continental crust (UCC) (Rudnick and
proximately 14 % of the samples showed very large uncer-             Gao, 2003). Scandium (Sc) was chosen as the crustal refer-
tainties (RSD > 100 %) for GPPnb and were discarded. The             ence element following Eq. (1):
mean RSD for GPPnb was 45 %.
                                                                                [X]

                                                                                [Sc] sample
2.3    Instrumental neutron activation analysis                      EF(x) =                .                                 (1)
                                                                                 [X]
                                                                                 [Sc] UCC
A set of 10 samples was dedicated to instrumental neutron            Scandium was chosen as the reference element because
activation analysis (INAA). Samples were selected from dif-          it is poorly affected by processes altering its mobility in
ferent depth intervals along the core (see Table 1, “N” se-          hosting minerals, and its biogeochemical cycle is almost
ries, and Table S1 for precise depths) in order to be repre-         unaffected by anthropogenic activities (Sen and Peucker-
sentative of both the dry and the wet seasons. The samples           Ehrenbrink, 2012). In addition, Sc is highly correlated with
were filtered using © PTFE Millipore membranes (0.45 µm              other lithogenic elements, such as Ce (r = 0.997) which was
pore size, 11.3 mm diameter) previously rinsed in an ultra-          used by Eichler et al. (2015) as a crustal reference for the
pure 5 % solution of bi-distilled HNO3 , according to the            Nevado Illimani samples, and La (r = 0.989). The choice of
procedures adopted by Baccolo et al. (2015). The filtration          Sc has also been determined by its easy and precise determi-
took place in an ISO 5 class laminar flow bench. Two blank           nation through INAA.
membranes that underwent the same cleaning procedures
were prepared by filtering 300 mL of Milli-Q (© Millipore)           2.4   Micro-Raman spectroscopy
water. For calibration and quality control, we used certi-
fied solid standards: USGS AGV2 (ground andesite), USGS              We used single-grain Raman spectroscopy to identify the
BCR2 (ground basalt), NIST SRM 2709a (San Joaquin soil),             mineralogy of dust particles having a diameter smaller than
and NIST SRM 2710a (Montana soil). In addition, stan-                5 µm. Because this kind of analysis was carried out for prove-
dard acid solutions for each analyzed element were pre-              nance purposes, particles that were expected to travel over
pared with concentrations on the order of micrograms per             longer distances were considered. A set of four samples (see
gram (µg g−1 ). Blanks for the empty flask and for the ultra-        Table 1, “R” series, and Table S1) was prepared follow-
pure acid solution used to prepare the liquid standards were         ing the procedure described in previous studies (Delmonte
also measured. Samples, standards, and blanks were irra-             et al., 2017; Paleari et al., 2019) specifically developed for
diated at the Applied Nuclear Energy Laboratory (LENA;               small dust grains. Two samples are representative of min-
University of Pavia, Italy) by a TRIGA Mark II reactor of            eral dust deposited in the dry season (high dust concentra-
250 kW. The “Lazy Susan” channel, neutron flux equal to              tion), whereas two represent dust from the wet season (low
2.40 ± 0.24 × 10¹² s−1 cm−2 , was used to identify Ce, Cs,           dust concentration or “background”). Measurements were
Eu, Hf, La, Sc, Sm, Th, and Yb. Samples were successively            performed by using an inVia Renishaw micro-Raman spec-
transferred at the Radioactivity Laboratory of the Univer-           trometer (Nd:YAG laser source, λ = 532 nm) available at the
sity of Milano-Bicocca in order to acquire gamma spectra             Laboratory for Provenance Studies (UNIMIB). We identified
by means of a high-purity germanium detector HPGe (OR-               the mineralogy of more than 630 grains, excluding organic
TEC, GWL series) following the standardized procedure de-            particles possibly related to contamination and particles with
veloped for low-background INAA (Baccolo et al., 2016).              an undetermined spectrum or with no signal.

The Cryosphere, 15, 1383–1397, 2021                                                     https://doi.org/10.5194/tc-15-1383-2021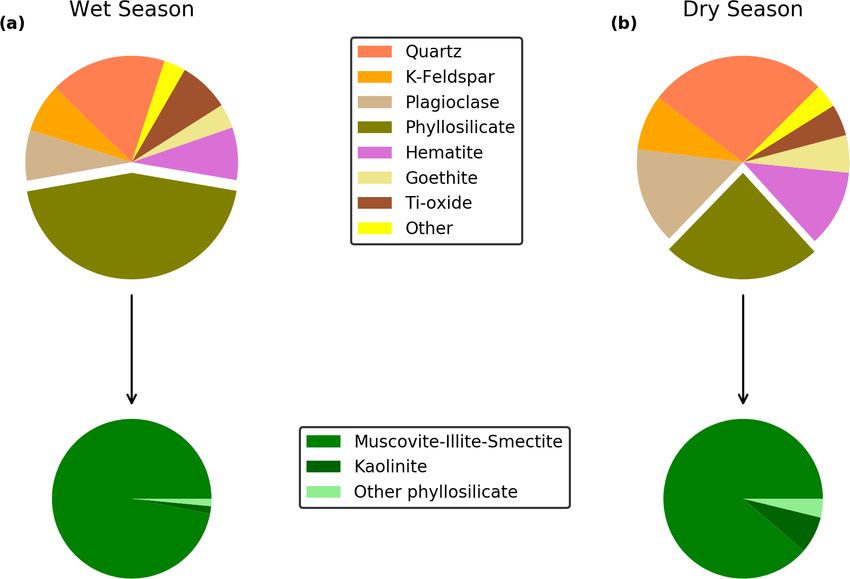
F. G. L. Lindau et al.: Giant dust particles at Nevado Illimani                                                                   1387

Table 1. Characterization of the Nevado Illimani samples analyzed for elemental (N1 to N10) and mineralogical (R1 to R4) composition.

                                Sample     Year          Season       Dust (part. mL−1 )   GPPnb ( %)
                                N1         2016          Dry                      14 737           0.1
                                N2         2015–2016     Wet                       7283            0.2
                                N3         2013–2014     Wet – dry                 6340            0.3
                                N4         2012          Dry                      30 405           0.2
                                N5         2010–2011     Wet                       2605            1.3
                                N6         2008          Dry                      25 816           0.7
                                N7         2007–2008     Wet – dry                 6424            1.0
                                N8         2003          Dry                      29 923           0.2
                                N9         2002          Dry                      21 057           0.2
                                N10        2000–2001     Wet                       4180            1.9
                                R1         2010          Dry                      17 409           0.1
                                R2         2009–2010     Wet                       8234            0.2
                                R3         2004          Dry                      86 918           0.2
                                R4         2003–2004     Wet                       2303            0.9

2.5   Stable isotope and ion chromatography analyses                  are defined in Sect. 3.1 as “wet”, “dry”, and “transition”.
                                                                      Based on the statistical random distribution of GPPnb and
The dust analyses described above used one quarter of the             δD, values above 3 standard deviations were considered to be
longitudinally cut firn core. A second quarter was shipped in         outliers. As the resulted GPPnb random component was not
a frozen state to the Climate Change Institute (CCI; Univer-          normally distributed, a Spearman’s rank correlation was used
sity of Maine, USA) for ion chromatography (IC) and stable            to assess the correlation (implemented in the SciPy library
water isotope analysis.                                               of numerical routines for the Python programming language;
   At the CCI in a cold room set at −20 ◦ C, we cut longitudi-        Virtanen et al., 2020). The confidence interval (CI) was ob-
nal sections of the core with a vertical band saw to separate         tained using a block bootstrap resampling method, follow-
an inner and an outer part. The latter was sampled by trans-          ing Mudelsee (2014). This method produces simulated time
verse cuts approximately every 12 cm using a stainless-steel          series of the same length and calculates correlation coeffi-
handsaw (resulting in 190 samples) and stored in plastic bot-         cients for each simulation. By resampling blocks of the ran-
tles for stable isotope ratio determination. Decontamination          dom components data, persistence over the block length was
of the inner part was performed by scraping with a clean ce-          preserved. An optimal block length was calculated consider-
ramic knife under a laminar flow HEPA bench inside the cold           ing a first-order autoregressive persistence model in which
room. Then, the decontaminated inner part was sampled for             a realization of the random process depends on just the
IC analysis by a continuous melter system (Osterberg et al.,          value of an earlier time step. The CI was calculated from
2006) also in an ISO 6 class clean room. The mean sample              2000 bootstrap simulations (run by the Recombinator Python
resolution was 3 cm, resulting in 767 samples. We measured            package; https://pypi.org/project/recombinator/, last access:
Ca2+ concentration using a Thermo Scientific™ Dionex™                 20 January 2021) and then obtained using Fisher’s transfor-
ICS-6000 ion chromatograph analytical system fitted with              mation.
suppressed conductivity detectors and a Dionex AS-HV au-
tosampler. The method detection limit (MDL) was defined as
3 times the standard deviation of the blank samples (Milli-Q          3     Results and discussion
water, 10 blank samples). The detection limit for Ca2+ was
                                                                      3.1    Seasonal variability in proxies and firn core
21.05 µg L−1 .
                                                                             chronology
   The δD and the δ 18 O were determined using a Picarro
L2130-i wavelength-scanned cavity ring-down spectroscopy              We established a chronology for the Nevado Illimani firn
instrument (Picarro Inc., USA) with a precision of 0.1 ‰.             core based on annual layer counting (ALC) and consider-
                                                                      ing the pronounced seasonal oscillation of dust concentra-
2.6   Correlation evaluation                                          tion, calcium, and stable water isotopes (Fig. 2). Dust con-
                                                                      centration variations, which are recognized for being useful
The correlation between GPPnb and δD was examined using               for ALC in tropical and continental ice cores (Ramirez et al.,
their random components which were obtained by extracting             2003; Kutuzov et al., 2019), span about 2 orders of magni-
both their seasonality and outliers. The annual cycles were           tude between the summer and the winter. Dust concentration
removed by subtracting the averages for each season, which            varies from ∼ 2000 particles mL−1 (hereafter part. mL−1 )

https://doi.org/10.5194/tc-15-1383-2021                                                     The Cryosphere, 15, 1383–1397, 2021
1388 F. G. L. Lindau et al.: Giant dust particles at Nevado Illimani
during the wetter season to ∼ 10 000 part. mL−1 during the
dryer season (median values). The two size distributions
shown in Fig. S2 illustrate this variability. When considering
extreme values, the variation range exceeds 3 orders of mag-
nitude, 150 part. mL−1 being the lowest concentration during
the wet season and 140 000 part. mL−1 the highest one dur-
ing the dry season. Our results are in agreement with average
dust concentrations from the Quelccaya Ice Cap during the
20th century: ∼ 10 000 and ∼ 25 000 part. mL−1 for the size
ranges of 1.6–16 and 0.6–20 µm, respectively (Thompson
et al., 1986, 2013). By considering just the giant particles, we
also observed a seasonal pattern with median concentrations
of 15 part. mL−1 during the wet season and 30 part. mL−1
during the dry season. The well-defined oscillatory pattern of
dust concentration variability reflects the extreme seasonality
of precipitation of both local and regional dust sources and
the succession of dry and wet conditions. Sublimation has a
limited influence on this seasonality (Ginot et al., 2002).
Dust concentration is in accordance with the Ca2+ record
and also with literature studies (Knüsel et al., 2005). How-
ever, both records show differences in particular during the
dry season when they are not significantly correlated at the
95 % level. Considering our high temporal sampling reso-
lution, this might be associated with slight changes in dust
mineralogy possibly affecting the amount of calcium to be
solubilized. Ionic calcium can be primarily associated with
calcium sulfate (CaSO4 ) and/or calcium carbonate (CaCO3 )
(Kutuzov et al., 2019). Because a scarcity of calcium car-
bonates was revealed by mineralogical analyses (Fig. 4; see
below), we argue that most of the ionic calcium observed in
Figure 2. Dating of the Nevado Illimani firn core by annual layer
firn samples is present as a soluble species, probably CaSO4 , counting (ALC) based on different proxies discussed in the text:
and not detectable through Raman spectroscopy on single (a) ionic calcium, (b) δD, and (c) total and giant dust particle con-
insoluble particles. However, we consider the possibility of centrations (light and dark gray, respectively; both are in logarith-
calcium carbonate depletion due to scavenging during dust mic scale). Red and blue shaded vertical bands correspond respec-
transport and/or dissolution during the melting of the sam- tively to the dry and wet season for each calendar year. All data
ples, as discussed by Wu et al. (2016) based on ice core are reported as the 3-point running average of data resampled at
samples from the Tibetan Plateau. In addition, we cannot ex- 0.05 m w.e.
clude that Ca-bearing aerosols might have been initially a
mixture of pure gypsum and calcium carbonates that succes-
sively reacted with atmospheric H2 SO4 in the atmosphere or tion in the snowpack because of increased precipitation and
within the snowpack as the result of post-depositional pro- reduced regional dust mobilization derived from wetter soil
cesses (Röthlisberger et al., 2000; Iizuka et al., 2008). conditions. Conversely, during winter (JJA) months, condi-
The regular succession of dry dusty periods and wet peri- tions over the Altiplano are typically dry, leading to higher
ods can be associated with the seasonal onset and decay of dust availability. At that time of the year, the winter westerly
the Bolivian high, a high pressure system which is well de- flow over the entire region promotes eastward dust transport
veloped and centered over Bolivia (Lenters and Cook, 1997). towards Nevado Illimani, leading to significantly higher dust
When the Bolivian high is particularly strong and displaced deposition in the firn layers representing, on average, about
southward of its climatological position, easterly flow in the 85 % of the total annual dust particles there deposited.
high troposphere is enhanced, as well as moisture advection Seasonal variations in the stable water isotopes in snow
from the interior of the continent to the Altiplano. This mois- precipitated over the Andes are also useful for dating. How-
ture transport from the Amazon Basin toward the Altiplano ever, the Andean isotopic signal led to divergent interpreta-
induces a notable amount of precipitation over the Altiplano tions (Vimeux et al., 2009). Whereas in polar ice cores the
(wet season) associated with strong summer convection. The water isotopic signature is chiefly related to temperature (Ue-
relatively low dust concentration found in the Illimani snow mura et al., 2012), the isotopic composition of tropical pre-
during the summer period is therefore related to particle dilu- cipitation can be affected by a larger number of factors (Hoff-
The Cryosphere, 15, 1383–1397, 2021 https://doi.org/10.5194/tc-15-1383-2021F. G. L. Lindau et al.: Giant dust particles at Nevado Illimani 1389
accumulation rate can be estimated on the order of approx-
imately 750 mm w.e. per year, slightly higher than the one
inferred by Knüsel et al. (2003). In addition, data were clas-
sified by season following the procedures in Correia et al.
(2003) by individually grouping the samples into three cat-
egories (“dry”, “wet”, “transition”) according to concentra-
tion levels of dust, Ca2+ , and stable isotopes. The samples
belonging to the depth intervals in the red (blue) areas of
Fig. 2 were classified as dry (wet) season samples. All other
samples were classified as belonging to the transition season.
Interestingly, we note a close correspondence between the
variability in stable isotopes and the proportion of giant par-
Figure 3. Relationship over the 18-year record between the percent- ticles in firn (Fig. 3); oscillations of the stable isotope record
age of giant particles with respect to the total dust particle number (δD) closely follow the percentage of giant dust particles
(GPPnb, reverse scale) and the δD. Gray shaded vertical bands cor- (GPPnb). During the dry season, giant particles are pro-
respond to the wet season for each calendar year. Uncertainties for portionally less abundant (average GPPnb 0.5 %), whereas
each GPPnb value (expressed by the red shaded area) are relative to the isotopic composition of snow is less negative (average
the standard deviation between Coulter counter measurements. All −113 ‰ for δD; −15 ‰ for δ 18 O). Conversely, during the
data are reported as the 3-point running average of the data previ- wet season when giant dust particles are at their annual maxi-
ously resampled at 0.05 m w.eq.
mum (average GPPnb 1 %), the isotopic composition of snow
is more depleted (−141 ‰ for δD, −18 ‰ for δ 18 O), reach-
ing its minimum. We found a significant correlation between
mann et al., 2003). It is well known that the so called “amount GPPnb and δD at the 95 % level (r = −0.53, p < 0.001,
effect” leads to an anti-correlation between the amount of n = 263). The CI for r was [−0.35, −0.67], being inside the
precipitation and the proportion of heavier isotopes in the 95 % level significance range. Considering the absolute con-
precipitation. This effect is in turn related to an ensemble of centrations of dust and giant particles, they showed weaker
physical and microphysical processes producing a robust sig- correlations with δD: 0.14 [−0.03, 0.31], −0.11 [−0.28,
nal on the isotopic composition of precipitation (Dansgaard, 0.08], respectively. Only this first correlation is significant
1964; Vuille et al., 2003; Risi et al., 2008). In this context, at the 95 % level.
deep atmospheric convection also plays a role in stable iso-
tope composition (Vimeux et al., 2005). Along the Zongo 3.2 Dust provenance: mineralogy and geochemistry
Valley (Fig. 1; located near Nevado Illimani), in particular
during the summer season, the cumulative rainfall along air The mineralogical composition of fine dust (1390 F. G. L. Lindau et al.: Giant dust particles at Nevado Illimani Figure 4. Changes in dust mineralogy between (a) the wet and (b) the dry seasons. The lower plots highlight the mineralogy of the phyl- losilicates. is typical in regions dominated by arid conditions or where with the geochemical signature of sources in the Altiplano a prolonged warm and dry season is followed by a shorter (Gili et al., 2017), supporting the hypothesis that dust de- and wetter period (Journet et al., 2014). Accessory miner- posited at Nevado Illimani is sourced from sediments present als include carbonate and tourmaline and very rarely pyrox- in the southern Altiplano and northern Puna areas. enes (Table S3). Such a mineralogical composition is coher- The EFs of Ce, La, Sm, Eu, and Yb are similar be- ent with the felsic to intermediate plutonic volcanic source tween samples with a higher percentage of giant particles rocks, suggesting that most of the dust deposited at Nevado (GPPnb > 1 %, characteristic for the wet season) and sam- Illimani has a local/regional provenance both in the wet and ples with background GPPnb (Fig. 5b). This corroborates in the dry seasons. what was observed in relation to the mineralogical composi- Low-background INAA analyses allowed us to determine tion of the samples from the wet and dry seasons. However, the EFs for different rare earth elements (REEs) which are two important exceptions to this pattern occur in relation to non-mobile and therefore widely used as provenance trac- Hf and Cs. Samples with high GPPnb show anomalous en- ers (McLennan, 1989; Moreno et al., 2006; Gabrielli et al., richment of Hf when compared to background samples. A 2010). In Fig. 5a, the Yb/La and the Eu/Sm elemental ratios similar feature was also observed in Saharan dust samples are used to compare dust samples retrieved from the Nevado (Castillo et al., 2008) and attributed to the presence of de- Illimani firn and literature data concerning geological sam- trital zircon (Zr, Hf)SiO4 in samples showing the coarsest ples from the Altiplano-Puna Volcanic Complex (APVC; Ort grain sizes. Following Vlastelic et al. (2015), the Hf enrich- et al., 1996; Lindsay et al., 2001) and potential source ar- ment observed in samples where the GPPnb is higher may eas (PSAs) in South America (Gaiero et al., 2004, 2013). be related to the presence of a few silt-sized zircon grains, The Yb/La ratio can be used to appreciate whether heavy which in turn would require high energy (turbulence) to lift and light REEs are enriched or depleted with respect to each and keep them suspended in the atmosphere. However, zir- other, whereas the Eu/Sm ratio is a proxy for the europium con grains were not detected by Raman Spectroscopy in this anomaly, usually calculated considering Gd, which was not study. The mineralogical analysis indicated a greater abun- detected by our analytical method. The comparison reveals dance of phyllosilicates in the dust deposited during the wet that the Nevado Illimani dust has a composition similar to summer season. Thus, the Hf enrichment in these samples APVC crystal-rich ignimbrites, pointing to a correspondence might be related to tiny zircon inclusions within phyllosil- with samples from the northern Puna region and not with icate particles. In accordance, the Cs enrichment in sam- samples from the salt lakes present in the Altiplano (Uyuni ples with a higher GPPnb may also be related to a greater and Coipasa salars). These pieces of evidence agree with pre- abundance of phyllosilicates during the summer. In the inter- vious analyses of strontium and neodymium isotopes in the layer sites of illite–muscovite minerals, the Cs−K exchange Nevado Illimani ice core dust (Delmonte et al., 2010) and is very common (Cremers et al., 1988; Rosso et al., 2001). The Cryosphere, 15, 1383–1397, 2021 https://doi.org/10.5194/tc-15-1383-2021
F. G. L. Lindau et al.: Giant dust particles at Nevado Illimani                                                                    1391

We conclude that the geochemical variability between sam-
ples with high and background GPPnb seems to be mainly
related to the variability in phyllosilicate concentration. In
turn, the variability in these minerals is related to scavenging
and therefore precipitation.

3.3   Relationship between the giant particles and deep
      convection

The absolute concentration of dust in firn and ice cores
depends on many factors, including the snow accumula-
tion rate, the dust source strength (which includes soil arid-
ity/wetness, vegetation cover, and any other factor influenc-
ing the quantity of particles available for deflation), and
transport processes which also affect the residence time of
particles in the atmosphere (mainly in the case of long-
range transport) (Delmonte et al., 2004). In the case of Il-
limani where dust is mostly locally and regionally sourced
(Sect. 3.2), we believe that dust concentration is primarily
modulated by the seasonally varying source strength, mainly
depending on source aridity and humidity, and by accumula-
tion rate. Indeed, we observe a pronounced decrease in dust
concentration during the wet season when convective activ-
ity reduces the source strength and increases the snow ac-
cumulation. Interestingly, during the wet season, the relative
number of giant particles in the firn core increases (Fig. 3). In
addition, the variability in both GPPnb and δD during the wet
season shows a significant correlation (Fig. 6): r = −0.69
[−0.58, −0.79], p < 0.001, and n = 123. As a more depleted
isotopic composition of precipitation is caused by a more in-
tense summer convection, this also seems to lead to a higher
GPPnb (data located in the bottom right corner of Fig. 6).
   Convective activity is known to significantly affect the iso-    Figure 5. Geochemical signature of the Nevado Illimani firn sam-
topic composition of tropical precipitation. Intense regional       ples. (a) Relationship between the REE (normalized considering the
convection leads to more isotopically depleted precipitation        UCC composition; Rudnick and Gao, 2003) from the Nevado Illi-
(e.g., Risi et al., 2008). A proposed mechanism is that con-        mani firn core (this work) and sediments and soils from potential
vective downdraft promotes the subsidence of higher-level           dust sources (corresponding to < 63 µm grain size for top soils).
water vapor, causing the isotopic depletion of low-level vapor      Data from northern Puna and Uyuni and Coipasa salars are from
crossing the eastern Cordillera of the Central Andes (Vimeux        Gaiero et al. (2013). Data from Patagonia are from Gaiero et al.
                                                                    (2004). Data for the APVC refer to geological samples from Lind-
et al., 2011). This downdraft is generated by the cooling of
                                                                    say et al. (2001) and Ort et al. (1996). (b) Enrichment factors (EFs)
air due to the reevaporation of the falling precipitation, which
                                                                    for different elements and standard deviations. Samples with a high
is favored by the often dry (unsaturated) conditions over the       GPPnb (blue circles) show anomalous enrichment for Hf and to a
Central Andes. Conversely, the δD variability during the win-       lesser extent for Cs (see text).
ter responds mainly to the intense reevaporation processes
occurring in that dry atmosphere which features low convec-
tive activity (Vimeux et al., 2011). Convective downdrafts,
as observed during the wet season, are often associated with        not observed any significant correlation between δD and the
density currents, offering an efficient mechanism for dust lift-    absolute concentration of giant particles, we must consider
ing (Flamant et al., 2007). Indeed, the leading edge of the         that the effect of convection on giant particle concentration
density current is characterized by strong turbulent winds          might be twofold. During the summer, it favors turbulent
that can mobilize dust and mix it through a deep layer (Knip-       conditions for the suspension of giant particles but also pro-
pertz et al., 2007). In accordance, events of giant dust par-       vides heavy precipitation, reducing the source strength in the
ticle suspension and transport, as detected by aircraft mea-        sources of giant particles and increasing the accumulation.
surements in north Africa, were related to the occurrence of        In fact, the absolute concentration of giant particles is lower
convective systems (Ryder et al., 2013). Although we have           during the wet season than during the dry season by a factor

https://doi.org/10.5194/tc-15-1383-2021                                                    The Cryosphere, 15, 1383–1397, 2021
1392 F. G. L. Lindau et al.: Giant dust particles at Nevado Illimani
Table 2. Spearman’s correlations between giant particle percent-
age (GPPnb), rainfall observations, and outgoing longwave radia-
tion (OLR). All data refer to the wet season (December–January–
February). The annual cycle of the meteorological data was re-
moved by subtracting the monthly means. Outliers were also re-
moved. Correlation coefficients (r) that are significant at the 95 %
level are shown in bold. The P values for each correlation, as well
as the number of data points (n), are also shown.
Wet season GPPnb
r P value n
El Alto 0.22 0.390 18
Calacoto 0.07 0.798 18
Patacamaya 0.80 < 0.001 16
Figure 6. Seasonal mean GPPnb and δD for the dry seasons (or-
Oruro 0.48 0.044 18
ange circle) and the wet season (blue circle). Error bars (horizontal
Potosi 0.07 0.785 18
bands) for GPPnb are based on the mean relative standard devia-
OLR −0.70 0.001 18
tion for the samples integrating each season. Light gray dots in the
background are raw data. The La Niña events discussed in the text
(1999–2000, 2000–2001, 2007–2008, and 2010–2011) are reported.
uary 2021). These datasets had their annual cycle removed by
subtracting the monthly averages over the period 1999–2017.
of 2 (Fig. 2). Thus, the major source areas of giant particles, Then, they were resampled into DJF (December to Febru-
probably local (but this would require a specific provenance ary) and JJA (June to August) time series and compared with
study for giant particles), might be strengthened during dry the random components of our seasonally resolved GPPnb
conditions. Our finding is that summer deep convective activ- series. For each wet and dry season, defined according to
ity leads to a lower dust concentration in the firn core and also dust concentration, Ca2+ , and δD records (Sect. 3.1), a mean
to a relatively lower reduction in the concentration of giant GPPnb was obtained.
particles. Therefore, the relative number of giant particles on In Table 2, we show the results of a Spearman’s corre-
the Nevado Illimani glacier can be reasonably used as a proxy lation analysis between seasonal GPPnb and meteorologi-
for deep summer convective precipitation. Given the size of cal data. No significant correlation at the 95 % level was
these particles and the dust geochemical and mineralogical observed during the dry season; therefore, only the wet
fingerprint, we confidently associate the giant particles with season correlations are shown. Table 2 clearly shows that
local and regional convective activity. during the wet season, GPPnb is positively correlated (at
In order to test the hypothesis of a relationship between 95 % level) with DJF precipitation at Patacamaya (17.2◦ S,
giant particles and convective precipitation, we analyzed 67.9◦ W; 4498 m a.s.l.). Rainfall variability over the Alti-
monthly precipitation from five meteorological stations lo- plano is strongly dependent on the intensity of the moisture
cated in the central Andes (Fig. 1) and monthly outgoing transport over the eastern slope of the eastern Cordillera but
longwave radiation (OLR) centered at 17.5◦ S, 70◦ W. Low also depends on the local amount of near-surface water vapor
OLR values correspond to cold and high clouds which de- (Garreaud, 2000). This later responds to the complex topog-
note enhanced convection. It is estimated that deep convec- raphy of the Central Andes, resulting in differences between
tion provides 65 % of the precipitation over this region as the precipitation records of Altiplano’s meteorological sta-
the orographic lifting of moisture from the Amazon Basin tions (Aceituno, 1996). Thus, it is expected that only precip-
through Andes trigger condensation, latent heat release, and itation data from stations in the closest vicinity of Nevado
strong convective updrafts during the summer (Insel et al., Illimani show good correspondence with glaciological data.
2010). In agreement, OLR shows strong negative correla- In agreement, Knüsel et al. (2005) observed that the Pata-
tions with regional rainfall observations over the Bolivian camaya precipitation record was better correlated (compared
Altiplano (Garreaud and Aceituno, 2001). Furthermore, both to El Alto) with the dust-related ion record from Nevado Il-
OLR and precipitation data provided similar results when limani, suggesting that the precipitation regime in the area
linking δD and regional convection in the Zongo Valley south of Nevado Illimani influences its dust record.
(Vimeux et al., 2011). Precipitation data were provided by As convective clouds are formed over the eastern
SENAMHI, Bolivia (http://www.senamhi.gob.bo/sismet, last Cordillera, the reevaporation of precipitation falling through
access: 15 January 2021), whereas monthly OLR data on the dry atmospheric boundary layer on its western slope leads
a 2.5◦ × 2.5◦ grid box (Liebmann and Smith, 1996) were to a downward flow of cold air over the highly complex ter-
obtained from NOAA/OAR/ESRL PSD, Boulder, Colorado, rain. This is driven by differences in density in relation to the
USA (https://www.esrl.noaa.gov/psd/, last access: 15 Jan- environment, which is similar to the mechanism proposed by
The Cryosphere, 15, 1383–1397, 2021 https://doi.org/10.5194/tc-15-1383-2021F. G. L. Lindau et al.: Giant dust particles at Nevado Illimani 1393
Knippertz et al. (2007). The leading edge of this density cur- et al., 2020). Thus, we propose a new approach for future
rent is characterized by strong turbulent winds, suggesting studies in tropical Andean glaciers based on giant particles
giant dust particles mobilization over areas in the vicinity and stable isotopes of snow. This can be used as a comple-
of Nevado Illimani where these particles are also deposited. ment to a number of other climate proxies and modeling ex-
In accordance, GPPnb is negatively correlated with the DJF periments, providing insights into past atmospheric circula-
OLR centered over the Altiplano (Table 2), indicating that tion over tropical South America.
deep convection increases giant particle entrainment and sus-
pension, humidity, and precipitation over the region. Curi-
ously, we found no significant correlations between GPPnb Data availability. Dust (concentration, grain size, geochemistry,
and wind speeds at the meteorological stations. This might and mineralogy), stable water isotope, and calcium data can be
be due to the short lifetimes of the density currents related made available for scientific purposes upon request to the authors
to convection, observed to be on the order of a few hours (contact filipelindau@hotmail.com, jefferson.simoes@ufrgs.br or
barbara.delmonte@unimib.it).
(Knippertz et al., 2007). Considering our seasonal resolution
analysis, we suggest that these high turbulence events had a
low influence on the mean DJF wind speed.
Supplement. The supplement related to this article is available on-
We conclude that the more intense summer convection is,
line at: https://doi.org/10.5194/tc-15-1383-2021-supplement.
the higher the relative number of giant dust particles sus-
pended in the atmosphere is and the more depleted the δD is.
Different from the wet season when the major control of δD Author contributions. FGLL, JCS, BD, and GB wrote the original
variability in Zongo (and therefore probably in Illimani) is paper. JCS and BD designed the research. PG designed and led the
the progressive depletion of water vapor by unsaturated con- drilling campaign. FGLL and PG sampled the core. FGLL, BD, GB,
vective downdrafts, the δD variability in the winter responds CIP, and EDS conducted dust analyses. EK and DSI carried out
mainly to the intense reevaporation processes that occur in a the ionic and the isotopic measurements, respectively. BD, EG, SA,
dry atmosphere with low convective activity (Vimeux et al., GB, and CIP advised on data collection and interpretation. VM, CIP,
2011). The rare winter convection seems also to have a low PG, EG, and SA provided comments on the original paper. VM, EG,
influence on GPPnb variability, as indicated by its lack of and SA provided analytical resources.
significant correlations with both JJA precipitation and OLR.
Figure 6 shows that over the 18-year period analyzed in
this work, the summer seasons of 2000–2001 and 2010– Competing interests. The authors declare that they have no conflict
of interest.
2011 showed intense levels of convection (considering both
GPPnb and δD). Both correspond to La Niña periods, as
indicated by their DJF Oceanic Niño Index (ONI) of −0.7
Acknowledgements. We thank the drillers, Stanislav Kutuzov, Luc
and −1.4, respectively. It is well known that the El Niño–
Piard, and Bruno Jourdain, and all the operation team and the sup-
Southern Oscillation phenomenon has a significant impact port of the IRD office in Bolivia. Operations at Illimani were part
on climate over the Altiplano, especially during the summer of the Ice Memory project financed by IRD, Université Grenoble
season. In particular, meteorological data show that La Niña Alpes, CNRS, IPEV, and UMSA, and by a sponsorship from the
conditions intensify the meridional pressure gradient on the Université Grenoble Alpes Foundation. This research was partially
northern side of the Bolivian high, leading to stronger high funded by NSF project 1600018, by the Brazilian CAPES project
troposphere easterly winds, increased eastward upslope flow, 88887.136384/2017-00, and by a research grant from the Brazil-
and enhanced moisture transport (Garreaud, 1999; Vuille, ian National Council for Scientific and Technological Development
1999). However, the strong DJF La Niña events of 1999– (CNPq 465680/2014-3). Filipe Gaudie Ley Lindau thanks CNPq for
2000 (ONI = −1.7) and 2007–2008 (−1.6) do not show his scholarship (processes 141013/2015-0 and 200496/2017-4). We
are grateful to one anonymous reviewer, Karl Kreutz, and the editor
higher GPPnb or more depleted δD compared to other val-
for their suggestions for improving the paper.
ues of the wet season (Fig. 6). We believe this was due to
competing mechanisms controlling moisture transport from
the Amazon Basin to the Altiplano. In addition to the role Financial support. This research has been supported by the
played by the upper troposphere easterly winds, the merid- CAPES (grant no. 88887.136384/2017-00), the CNPq (grant no.
ional circulation between the tropical North Atlantic Ocean 465680/2014-3), and the NSF (grant no. 1600018).
and western tropical South America also influences the DJF
precipitation over the Central Andes, especially in the last 2
decades (Segura et al., 2020). Evidence based on reanaly- Review statement. This paper was edited by Joel Savarino and re-
sis data indicates that when this meridional circulation is en- viewed by Karl Kreutz and one anonymous referee.
hanced, the atmospheric stability between the middle and the
upper troposphere over the Altiplano is reduced, resulting in
increased moisture transport from the Amazon Basin (Segura
https://doi.org/10.5194/tc-15-1383-2021 The Cryosphere, 15, 1383–1397, 20211394 F. G. L. Lindau et al.: Giant dust particles at Nevado Illimani
References Delmonte, B., Andersson, P. S., Schöberg, H., Hansson, M., Pe-
tit, J. R., Delmas, R., Gaiero, D. M., Maggi, V., and Frez-
zotti, M.: Geographic provenance of aeolian dust in East Antarc-
Aceituno, P.: Elementos del clima en el altiplano sudamericano, Re- tica during Pleistocene glaciations: preliminary results from
vista Geofisica, 44, 37–55, 1996. Talos Dome and comparison with East Antarctic and new
Adebiyi, A. A. and Kok, J. F.: Climate models miss most Andean ice core data, Quaternary Sci. Rev., 29, 256–264,
of the coarse dust in the atmosphere, Sci. Adv., 6, 1–10, https://doi.org/10.1016/j.quascirev.2009.05.010, 2010.
https://doi.org/10.1126/sciadv.aaz9507, 2020. Delmonte, B., Paleari, C. I., Andò, S., Garzanti, E., Andersson,
Albani, S., Mahowald, N. M., Perry, A. T., Scanza, R. A., Zen- P. S., Petit, J. R., Crosta, X., Narcisi, B., Baroni, C., Sal-
der, C. S., Heavens, N. G., Maggi, V., Kok, J. F., and Otto- vatore, M. C., Baccolo, G., and Maggi, V.: Causes of dust
Bliesner, B. L.: Improved dust representation in the Commu- size variability in central East Antarctica (Dome B): Atmo-
nity Atmosphere Model, J. Adv. Model. Earth Sy., 6, 541–570, spheric transport from expanded South American sources dur-
https://doi.org/10.1002/2013MS000279, 2014. ing Marine Isotope Stage 2, Quaternary Sci. Rev., 168, 55–68,
Baccolo, G., Maffezzoli, N., Clemenza, M., Delmonte, B., Prata, https://doi.org/10.1016/j.quascirev.2017.05.009, 2017.
M., Salvini, A., Maggi, V., and Previtali, E.: Low-background Eichler, A., Gramlich, G., Kellerhals, T., Tobler, L., and
neutron activation analysis: a powerful tool for atmospheric min- Schwikowski, M.: Pb pollution from leaded gasoline in South
eral dust analysis in ice cores, J. Radioanal. Nucl. Ch., 306, 589– America in the context of a 2000-year metallurgical history,
597, https://doi.org/10.1007/s10967-015-4206-2, 2015. Sci. Adv., 1, e1400196, https://doi.org/10.1126/sciadv.1400196,
Baccolo, G., Clemenza, M., Delmonte, B., Maffezzoli, N., Nastasi, 2015.
M., Previtali, E., Prata, M., Salvini, A., and Maggi, V.: A new Flamant, C., Chaboureau, J. P., Parker, D. J., Taylor, C. M.,
method based on low background instrumental neutron activation Cammas, J. P., Bock, O., Timouk, F., and Pelon, J.: Air-
analysis for major, trace and ultra-trace element determination in borne observations of the impact of a convective system on
atmospheric mineral dust from polar ice cores, Anal. Chim. Acta, the planetary boundary layer thermodynamics and aerosol dis-
922, 11–18, https://doi.org/10.1016/j.aca.2016.04.008, 2016. tribution in the inter-tropical discontinuity region of the West
Bonnaveira, H.: Etude des Phenomenes de depot et post-depot de African Monsoon, Q. J. Roy. Meteor. Soc., 133, 1175–1189,
la neige andine sur un ste tropical d’altitude (Illimani – Bo- https://doi.org/10.1002/qj.97, 2007.
livie – 6340 m) en vue de l’interpretation d’une carote de glace, Gabrielli, P., Wegner, A., Petit, J. R., Delmonte, B., De Deck-
PhD thesis, Université Joseph Fourier, Grenoble, France, 303 pp., ker, P., Gaspari, V., Fischer, H., Ruth, U., Kriews, M., Boutron,
2004. C., Cescon, P., and Barbante, C.: A major glacial-interglacial
Bony, S., Risi, C., and Vimeux, F.: Influence of convec- change in aeolian dust composition inferred from Rare Earth
tive processes on the isotopic composition (δ18O and Elements in Antarctic ice, Quaternary Sci. Rev., 29, 265–273,
δD) of precipitation and water vapor in the tropics: 1. https://doi.org/10.1016/j.quascirev.2009.09.002, 2010.
Radiative-convective equilibrium and Tropical Ocean-Global Gaiero, D. M., Depetris, P. J., Probst, J. L., Bidart, S. M., and Le-
Atmosphere-Coupled Ocean-Atmosphere Response Experi- leyter, L.: The signature of river- and wind-borne materials ex-
ment (TOGA-COARE), J. Geophys. Res.-Atmos., 113, 1–21, ported from Patagonia to the southern latitudes: A view from
https://doi.org/10.1029/2008JD009942, 2008. REEs and implications for paleoclimatic interpretations, Earth
Castillo, S., Moreno, T., Querol, X., Alastuey, A., Cuevas, E., Her- Planet. Sci. Lett., 219, 357–376, https://doi.org/10.1016/S0012-
rmann, L., Mounkaila, M., and Gibbons, W.: Trace element vari- 821X(03)00686-1, 2004.
ation in size-fractionated African desert dusts, J. Arid Environ., Gaiero, D. M., Simonella, L., Gassó, S., Gili, S., Stein, A. F., Sosa,
72, 1034–1045, https://doi.org/10.1016/j.jaridenv.2007.12.007, P., Becchio, R., Arce, J., and Marelli, H.: Ground/satellite obser-
2008. vations and atmospheric modeling of dust storms originating in
Correia, A., Freydier, R., Delmas, R. J., Simões, J. C., Taupin, J.- the high Puna-Altiplano deserts (South America): Implications
D., Dupré, B., and Artaxo, P.: Trace elements in South America for the interpretation of paleoclimatic archives, J. Geophys. Res.
aerosol during 20th century inferred from a Nevado Illimani ice Atmos., 118, 3817–3831, https://doi.org/10.1002/jgrd.50036,
core, Eastern Bolivian Andes (6350 m asl), Atmos. Chem. Phys., 2013.
3, 1337–1352, https://doi.org/10.5194/acp-3-1337-2003, 2003. Garreaud, R., Vuille, M., and Clement, A. C.: The climate
Cremers, A., Elsen, A., De Preter, P., and Maes, A.: Quantitative of the Altiplano: Observed current conditions and mecha-
analysis of radiocaesium retention in soils, Nature, 335, 247– nisms of past changes, Palaeogeogr. Palaeocl., 194, 5–22,
249, https://doi.org/10.1038/335247a0, 1988. https://doi.org/10.1016/S0031-0182(03)00269-4, 2003.
Dansgaard, W.: Stable isotopes in precipitation, Tellus A, 16, 436– Garreaud, R. D.: Multiscale Analysis of the Summertime
468, https://doi.org/10.3402/tellusa.v16i4.8993, 1964. Precipitation over the Central Andes, Mon. Weather
Delmonte, B., Petit, J., and Maggi, V.: Glacial to Holocene im- Rev., 127, 901–921, https://doi.org/10.1175/1520-
plications of the new 27000-year dust record from the EPICA 0493(1999)1272.0.CO;2, 1999.
Dome C (East Antarctica) ice core, Clim. Dynam., 18, 647–660, Garreaud, R. D.: Intraseasonal variability of moisture and
https://doi.org/10.1007/s00382-001-0193-9, 2002. rainfall over the South American Altiplano, Mon. Weather
Delmonte, B., Petit, J. R., Andersen, K. K., Basile-Doelsch, I., Rev., 128, 3337–3346, https://doi.org/10.1175/1520-
Maggi, V., and Lipenkov, V. Y.: Dust size evidence for oppo- 0493(2000)1282.0.CO;2, 2000.
site regional atmospheric circulation changes over east Antarc- Garreaud, R. D. and Aceituno, P.: Interannual rainfall
tica during the last climatic transition, Clim. Dynam., 23, 427– variability over the South American Altiplano, J. Cli-
438, https://doi.org/10.1007/s00382-004-0450-9, 2004.
The Cryosphere, 15, 1383–1397, 2021 https://doi.org/10.5194/tc-15-1383-2021You can also read