Trade Discrimination The Disproportionate, Underreported Damage to U.S. Black and Latino Workers From U.S. Trade Policies - Public Citizen
←
→
Page content transcription
If your browser does not render page correctly, please read the page content below
Trade Discrimination The Disproportionate, Underreported Damage to U.S. Black and Latino Workers From U.S. Trade Policies
PUBLIC CITIZEN                                                     Trade Discrimination

Published January 2021 by Public Citizen’s Global Trade Watch

Acknowledgments: This report was written by Daniel Rangel and Lori Wallach. Thanks to
Matthew Groch, Sarah Grace Spurgin, Mariana Lopez and Garrett O’Brien for thorough research
assistance. Melanie Foley edited the text. Sally King and JaRel Clay designed the report. We also
want to thank colleagues from various organizations and universities who reviewed the report or
helped us track down obscure data. Their perspectives, assistance and feedback improved this work
in important ways. Errors and omissions are the responsibility of the authors.

Additional copies of this document are available from:
Public Citizen’s Global Trade Watch
215 Pennsylvania Ave SE, Washington, DC
20003 (202) 546-4996

Public Citizen is a nonprofit consumer advocacy organization that champions the public
interest in the halls of power. We defend democracy, resist corporate power and fight to
ensure that government works for the people – not for big corporations. Founded in 1971,
we now have 500,000 members and supporters throughout the country. We don’t
participate in partisan political activities or endorse candidates for elected office. We take
no government or corporate money, which enables us to remain fiercely independent and
call out bad actors – no matter who they are or how much power and money they have. We
use every tool at our disposal to take on big fights – and win. We mobilize activists to grow
democratic movements, watchdog Congress, sue the government when it fails to do its job,
petition regulatory agencies to safeguard the public and engage in cutting-edge research
that effects change. We have six policy groups: Access to Medicines, Congress Watch,
Energy, Global Trade Watch, Health Research Group and Litigation Group. Visit our web
page: www.citizen.org.

Public Citizen’s Global Trade Watch fights to ensure that in this era of hyperglobalization,
a majority can have the opportunity to enjoy economic security; a clean environment and
livable planet; safe food, medicines and products; access to quality affordable services such
as health care; and the exercise of democratic decision-making about the matters that affect
our lives. Global Trade Watch has led the fight against corporate-rigged “trade”
agreements that provide special powers for Big Pharma to raise medicine prices, empower
corporations to attack our laws before international tribunals, incentivize the outsourcing
of jobs to low-wage countries and undermine the food safety and other safeguards on
which our families rely. For decades, we have fought for progressive alternatives that
benefit people and the planet. For more information on Public Citizen’s trade and
globalization work, visit the homepage of Public Citizen’s Global Trade Watch:
www.tradewatch.org.
                                                                                                    1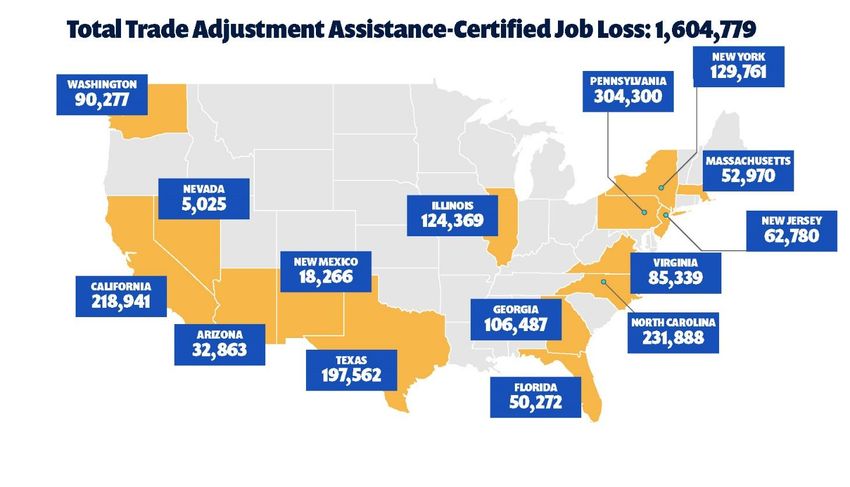
PUBLIC CITIZEN                                                   Trade Discrimination

                   Other Recent Titles by Public Citizen’s Global Trade Watch:

     Promises Made, Workers Betrayed: Trump’s Bigly Broken Promise to Stop Job Offshoring
                                       (October 2020)

Hyperglobalization Undermines Response to COVID-19 Crisis (June 2020, updated November 2020)

                            NAFTA’s Legacy Series (September 2019):
                          Lost Jobs, Lower Wages, Increased Inequality
                   Expanding Corporate Power to Attack Public Interests Laws
                                Empty Promises for U.S. Farmers
               Economic Displacement, Lower Wages for Most, Increased Migration
                      Failed Policy That Drove Millions From Their Homes

         Analysis of the NAFTA 2.0 Text Relative to the Essential Changes We Have Demanded to
                           Stop NAFTA’s Ongoing Damage (July 2019)

         Key Findings of the ITC Report on the Revised NAFTA: Modest Projections Do Not Alter
                             Pact’s Prospects in Congress (April 2019)

                      NAFTA at 25: Promises Versus Reality (January 2019)

      Fracaso: NAFTA’s Disproportionate Damage to U.S. Latino and Mexican Working People
                                        (December 2018)

    NAFTA 2.0 and Investor-State Dispute Settlement (ISDS): U.S.-Canada ISDS Is Terminated,
 Expansive Investor Rights Eliminated and New Review Procedures Mostly Replace ISDS Between
                                 U.S. and Mexico (October 2018)

 To Date, a Critical Tool to Address Currency Manipulation and Stem Record-Setting Trade Deficits
                               Has Been Underutilized (October 2018)

Termination of Bilateral Investment Treaties Has Not Negatively Affected Countries’ Foreign Direct
                                 Investment Inflows (April 2018)

Follow the Money: Did Administration Officials’ Financial Entanglements With China Delay Trump’s
                      Promised Tough-on-China Trade Policy? (March 2018)

                                                                                                    2
PUBLIC CITIZEN                                                                                        Trade Discrimination

                                               Table of Contents
Executive Summary ...................................................................................................................... 4

Introduction ................................................................................................................................... 9

1. U.S. Trade Policy Has Increased the Economic
Insecurity of Many Black and Latino Families ........................................................................ 13

   1.1 The Decline of Manufacturing Due to Trade Harms
   Black and Latino Families......................................................................................................... 13

   1.2 Manufacturing Job Loss and Wage Stagnation Is Concentrated
   in Economic Sectors With Significant Black and Latino Employment .................................... 15

   1.3 Trade-Related Job Loss Is Concentrated in States With
   Greatest Black and Latino Populations ..................................................................................... 19

   1.4 Black and Latino Workers Are Overrepresented Among Those Whose
   Wages Have Stagnated and Economic Fortunes Declined Since NAFTA ............................... 24

2. Overall Trend of Increasing Inequality, Concentration of
Wealth Impacts Black and Latino Americans More Severely ................................................ 29

Conclusion.................................................................................................................................... 31

Endnotes....................................................................................................................................... 32

                                                                                                                                                     3
PUBLIC CITIZEN Trade Discrimination
Executive Summary
The damage caused by the corporate-led hyperglobalization that has been implemented over
the past decades by “trade” agreements such as the North American Free Trade Agreement
(NAFTA), the World Trade Organization (WTO) and NAFTA-style free trade agreements
(FTAs) has been well documented — from mass job offshoring to unreliable supply chains to
downward pressure on wages to weakened consumer and environmental protections.
In his 2016 presidential campaign, Donald Trump hijacked progressives’ critique of corporate
globalization and job offshoring, but reframed it into a narrative of resentment with racialized
appeals to target white working-class voters.
This followed on the “China Shock” research conducted by Massachusetts Institute of
Technology Professor David Autor and others that showed the lasting impact on specific
regions of the country from the loss of millions of U.S. jobs related to trade with China.
Prominent press coverage of Autor’s work and Trump’s 2016 election focused on white non-
college educated workers as the main victims of corporate-led hyperglobalization.
That conventional wisdom is challenged by the data presented in this report. The trade-related
decline of U.S. manufacturing had a dire impact on racial minorities, particularly African
Americans. In many ways, the damage has fallen disproportionately on people of color in the
United States.
As Donald Trump failed to deliver on his promises to stop job offshoring or to create a
“manufacturing boom” by “bringing back” or creating millions of new manufacturing jobs, in
2020 a surge in union voters and voters who earn $50,000 or less in key swing states ousted
Trump, initial exit poll analyzes show. Whether these working-class voters of diverse races
and ethnicities will stick with the Democratic Party depends on whether their lives and
livelihoods measurably improve over the next four years. And that relies on the Biden
administration enacting economic policies designed to do just that, which means breaking
from the trade policy supported by Republican and Democratic presidents alike over the past
few decades.
While decades of such corporate-rigged trade policies have harmed many American workers
of all races and ethnicities, Black and Latino workers who lost jobs and experienced wage
stagnation from NAFTA, the agreements enforced by the WTO, and the “China Shock”
following China’s entry into the WTO — all policies enacted during the Clinton
administration — have assumed a disproportionately large share of the harm inflicted by
these deals. U.S. government data — despite shortcomings as to the recognition of the
4PUBLIC CITIZEN Trade Discrimination
complexities of race and ethnicityi — show that these two groups were overrepresented in the
industries and concentrated in the regions that were hit hardest.
The findings in this report on relative wage levels and wealth also show that U.S. structural,
race-based social and economic inequities that undermine the economic and social welfare of
people of color have been further exacerbated by dislocations caused by U.S. trade policies.
This report expands on the U.S. aspect of the research we published in late 2018 about
NAFTA’s negative impact on working people in Mexico and on U.S. Latinos and the grim
scenario facing the many Mexicans who migrated to the United States for work after NAFTA
destroyed their livelihoods to now face increasingly precarious work conditions and racist,
hateful attacks from Donald Trump.1 This report shows that among U.S. workers hurt by
decades of corporate-designed trade policies, Black and Latino workers have suffered
disproportionate injury:
• Black and Latino workers were disproportionately represented in nine out of the 10
manufacturing industries that have been hit hardest by import competition. While
Latinos comprised 8.9% of the labor force, they represented 12.3% of workers in the
manufacturing of fabricated metals, 11.4% of furniture and 10.5% of plastics and rubber.
While Black workers comprised 10.6% of the overall labor force in 1995, they represented
13.5% of the workforce in paper manufacturing, 11.4% in chemicals, 11.3% in
transportation equipment and 11.1% in primary metals. African Americans and Latinos
represented 13% and 15.4%, respectively, of the workforce in the beverages industry.
▪ According to the U.S. Bureau of Labor Statistics, Black workers have lost nearly half
a million manufacturing jobs (494,000) during the NAFTA-WTO era. Black workers’
manufacturing losses were evenly spread across many subsectors that suffered
significant trade-related job loss. For instance, in the automotive sector, by 2010, in
just the first 15 years of NAFTA, Black workers had lost 56,524 jobs. Black workers
were disproportionately represented in the primary metals manufacturing sector hit
by the NAFTA-WTO era with a loss of 53,800 jobs. Black workers have also lost 22,100
jobs in the paper manufacturing industry and 18,600 jobs in the beverages and tobacco
industry during the NAFTA-WTO era, two more sectors where Black workers were
overrepresented relative to their general share of the workforce.
▪ Latino workers also experienced job losses in sectors where they were
overrepresented when the NAFTA and WTO went into effect. Latinos lost 123,000
jobs in the decline in the U.S. electrical equipment and appliances industry, and
iFor instance, the data do not recognize the overlap between categories such as Black and Latino or that African
American might not encompass all of the Black population in the country.
5PUBLIC CITIZEN Trade Discrimination
during the last 25 years, 182,700 Latino jobs in the United States have been lost in
textiles, apparel and leather manufacturing.
• The explosion of deficits in highly trade-impacted manufacturing industries — along
with the offshoring threat — also contributed to the stagnation of wages in sectors
employing significant numbers of Black and Latino workers. Whereas earnings in
highly trade-impacted industries have remained virtually flat (0.02% average growth rate
on real terms), workers’ earnings in all manufacturing and hospitality and leisure had less
than impressive but at least some degree of average yearly real earnings growth, with
rates of 0.54% and 0.92% respectively.
• Black and Latino workers are also disproportionately represented in call center and
customer service jobs that have been subject to mass offshoring. People of color (Black,
Asian and Latino Americans) account for 43% of U.S. workers engaged as customer
service representatives but are 36.4% of the U.S. workforce. Over the past 25 years, 71,788
U.S. jobs are TAA-certified as lost to trade with the Philippines, which has been the
country of choice for call center offshoring. Some 58,220 of the U.S. jobs certified as lost to
the Philippines are designated as explicitly lost to offshoring.
• The 20 U.S. states that are least racially diverse had only 20% of all government-
certified trade job losses during the NAFTA-WTO era. Those states also represent less
than 10% of total of U.S. manufacturing job losses during the NAFTA-WTO era (only
300,000 of the total 4 million) according to the U.S. Bureau of Labor Statistics.
• States and cities with the largest Black and Latino populations have been hardest hit
by the economic and social fallout of failed U.S. trade policies.
▪ Just 15 U.S. states that are home to 85% of the total Latino population account for
half of TAA-certified trade-related job losses — 1.6 million of the more than 3.2
million U.S. jobs lost — from the start of the NAFTA-WTO era in 1994 to the latest
TAA certifications covering most of 2019. Those 15 states also account for nearly half
(47%) of all TAA-certified job losses caused by NAFTA – 480,000 out of 1.01 million.
These 15 states also account for 2.4 million of the 4 million total manufacturing job
losses documented by the U.S. Bureau of Labor Statistics during the NAFTA-WTO era.
▪ The 15 states that are home to 58% of the Black population account for 2.9 million of
the 4 million total manufacturing job losses documented by the U.S. Bureau of
Labor Statistics during the NAFTA-WTO era. These states account for
57% of TAA-certified trade job losses — 1.8 million of the more than 3.2 million U.S.
jobs. Those 15 states also account for 57% of TAA job losses caused by NAFTA, from
NAFTA’s implementation up to April 2020.
6PUBLIC CITIZEN Trade Discrimination
▪ Many cities such as Detroit, Chicago, Pittsburgh, New York and Cleveland that
were hardest hit by U.S. trade policy failures were locations whose growing
manufacturing employment opportunities had drawn six million Black workers
fleeing from racial terror and poverty in the Jim Crow South for safety and better
economic opportunities in the first half of the 1900s.
• U.S. Latino and Black workers who lose their jobs are even less likely than their white
counterparts to find a replacement job, according to the Bureau of Labor Statistics. For
every 100 white workers who lose their jobs, 14.3 remain unemployed. Meanwhile, for
every 100 Black workers who lose their jobs, 21.2 remain unemployed. Similarly, for every
100 Latino workers who lose their jobs, 21.8 remain unemployed.
• Increased competition for a reduced number of well-paying jobs available for non-
college-educated workers exacerbates underlying structural racial discrimination in
hiring, promotions and wages that, even in the absence of trade impacts, have resulted
in lower wages for Black and Latino workers relative to similarly educated non-Latino
white workers. A study by the Economic Policy Institute estimated that, even in
manufacturing and controlling for educational differences, actual wages for Latino and
Black workers are, respectively, about 25% and 23% lower compared to wages paid to
white workers.
• In no small part because of damaging disparities in educational opportunities, Black
and Latino workers are overrepresented relative to their share of the overall workforce
among the 58% of Americans without college degrees who were left to compete for an
ever-diminishing number of quality jobs available for non-college educated workers.
Sixty-eight percent of Black Americans and 77% of Latino Americans do not have college
degrees as of 2019, compared to 54% of the white population.
• After 25 years of the NAFTA-WTO model, large racial wage gaps remain for men and
are worsening for women. When NAFTA and the WTO began, Black men earned 75
cents, and Latino men earned 64 cents for every dollar earned by white men. Black
women earned 88 cents, and Latinas earned 78 cents for every dollar earned by white
women. Today, Black men earn 79 cents, and Latino men earn 71 cents for every dollar
earned by white men. Black women earn 83 cents, and Latinas earn 73 cents for every
dollar earned by white women.
• The wage premium offered by the manufacturing sector relative to other sectors is a
particularly important factor, given the racial wage gap that exists across all sectors.
Median weekly earnings in 2020 are $786 for Latino workers and $806 for Black workers –
7PUBLIC CITIZEN Trade Discrimination
compared to $1,018 for white workers. These median wage gaps are further widened by
gender. The median Black woman earns $779 per week, and the median Latina earns $717
per week, while the median U.S. woman worker overall earns $913 per week. Meanwhile,
white women earn a median weekly income of $930 per week.
• When Black and Latino workers lost manufacturing jobs and found new jobs, they
faced disproportionate pay cuts. More than half of Black workers and about 60% of full-
time Latino workers earn less than $15 an hour, compared with 42% of full-time U.S.
workers overall. While the manufacturing sector lost about 4 million jobs between 1993
and 2019, other sectors with jobs available to those without college education – such as
retail and leisure and hospitality – gained 6.8 million jobs. With average wages of $18.11
an hour, these sectors pay two-thirds that of manufacturing. Today, Latino workers make
up 24% and Black workers 13.1% of these sectors, percentages greater than their
representation in the overall workforce. As increasing numbers of trade-displaced
workers have joined the glut of workers competing for these non-offshorable jobs, real
wage growth has been extremely modest in these growing sectors.
• The states that have large Black and Latino populations also strikingly correlate with
those with higher income inequality levels. Five out of the 10 most unequal states in the
nation (New York, Florida, California, Illinois and New Jersey) are home to large Latino
and Black populations. Additionally, Nevada, Massachusetts and Washington, which are
states with large representations of Latino families, are also in the top 10 most unequal
states in the country. These same eight states are among the 10 states with the biggest
jumps in income share accumulated by the richest 1% from 1972 to 2015. In other words,
in these eight states the top 1% increased their share of income by at least 10.7%, leaving
less for the rest of their communities.
• Wealth inequality also has worsened over the NAFTA-WTO era with disproportionate
damage to Black and Latino families. The median wealth for white families is 41 times
that of Black families and 22 times that of Latino families. Median Black family wealth
in the United States is $3,500, which represents only 2% of the median white family’s
$147,000. Similarly, median Latino family wealth is $6,500, representing 4% of that of a
median white family. And racial disparities in wealth have grown more severe over time.
From 1995 (when the WTO went into effect and the first year of NAFTA) to 2016 (the
latest data available), the median Black family wealth has increased only by $308. During
that same period, the median Latino family’s wealth has slightly increased by $1,345.
Meanwhile, the average white family has increased its wealth by more than $50,000.
8PUBLIC CITIZEN Trade Discrimination
Introduction
The U.S. public was promised the North American Free Trade Agreement (NAFTA) would
create 200,000 new high-wage U.S. jobs per year in its first five years alone.2 The World Trade
Organization (WTO) was to increase U.S. wages by $1,700 per year for the average American
family and create 500,000 new jobs.3 China entering the WTO in 2001 would create a massive
new U.S. export market and only increase the U.S. trade deficit with China by $1 billion,
projected the U.S. International Trade Commission in its analysis of the impact of Congress
approving Permanent Normal Trade Relations (PNTR) trade status for China.4
Twenty-five years later, it’s obvious that the actual outcome of these “trade” policies is the
opposite of the promised gains. The promised trade-created jobs never materialized, but
millions of jobs were lost as offshoring and floods of imported goods associated with an
exploding trade deficit gutted U.S. manufacturing.
Since the start of NAFTA and the WTO, 3.2 million U.S. jobs have been U.S.-government-
certified as lost to trade just under the Trade Adjustment Assistance (TAA) program. More
than a million of these job losses are attributed to NAFTA. TAA, which provides qualified
workers extended unemployment benefits and retraining funds, represents a significant
undercount of trade-related job loss given it only covers certain types of jobs, and workers
need to know to apply and then must fill out lengthy applications that prove the trade
connection. The U.S.-China overall deficit increased by $192 billion, and millions of American
jobs were lost in what is now understood as the “China Shock.”5 Notably, after Congress
approved China’s entry into the WTO in 2000, the overall U.S. trade deficit with China soared
164%, according to the U.S. Census Bureau. U.S. Bureau of Labor Statistics’ data show that
during the NAFTA-WTO-China PNTR era, over 60,000 U.S. factories have closed, and overall
net U.S. manufacturing employment has declined by 4.5 million — one out of every four U.S.
manufacturing jobs.6 U.S. median wages have been stagnant during this period with most
manufacturing workers who lose jobs to trade and find reemployment forced to take pay cuts.
Two of every five rehired in 2018 were paid less in their new job, with one in six losing greater
than 20% of their income.7 For the average Latino or Black worker earning the median
manufacturing wage of $39,500 per year, this meant an annual loss of at least $7,900.
NAFTA, the WTO and other U.S. trade policies that focused on corporate priorities rather than
domestic job creation have undeniably negatively affected Latino and Black Americans.
Contrary to recent conventional wisdom, the data do not show that white working-class
Americans were disproportionately injured.
As a candidate, Donald Trump hijacked progressives’ critique of corporate globalization
and job offshoring, but reframed it into a narrative of resentment with racialized appeals to
white working-class voters. As this study documents, the underlying trade, employment and
9PUBLIC CITIZEN Trade Discrimination
demographic data show that people of color in America were equally, if not more
negatively affected.ii
The accepted wisdom that U.S. trade policies most severely hurting white working-class
Americans is, in part, based on the China Shock research.8 It used demographic data for the
“commuting zones” around areas where import-competing industries were hit hardest by
imports from China. This methodology shows that these places tend to be whiter than the rest
of America.9 However, this approach fails to capture the way in which trade affects different
social groups within a single community. For instance, an area’s population can be
predominantly white, but its manufacturing industries might employ mostly Black and Latino
workers. These complexities are hinted at in U.S. government datasets that provide
demographic data on employment in various industrial sectors and that show where
production facilities of various industries are concentrated.
Notably, exit poll data from the 2016 election shows that Trump won not only because he
gained support from white working-class voters who previously had supported President
Barack Obama, but because fewer Black and Latino voters and Millennials of all races and
ethnicities participated in the 2016 election. As pollster Stan Greenberg wrote in the
American Prospect about the 2016 election: “The Democrats don’t have a white working-
class problem. They have a working-class problem, which progressives have been reluctant
to address honestly or boldly. The fact is that Democrats have lost support with all working-
class voters across the electorate, including the Rising American Electorate of minorities,
unmarried women, and millennials. This decline contributed mightily to the Democrats’
losses in the states and Congress and to the election of Donald Trump.”10
As data about the 2020 election continues to be gathered and assessed, initial analyses from
exit polling show that working-class voters, of all races and ethnicities, were key to ousting
Trump from the White House and electing Joe Biden as the next president of the United
States. Some notable indicators include:
ii
The demographic data available in U.S. government datasets do not recognize the complexities of race and ethnicity in a
country like the United States. Bureau of Labor Statistics (BLS) data classifies population by race/ethnicity in four
categories: white, Black or African American, Asian, and Hispanic or Latino. This categorization does not recognize the
overlap between categories such as Black or white and Latino or that African American might not encompass all of the
Black population in the country. Furthermore, bundling together distinct groups of people, like African Americans and
African migrants, disregards the specific issues and challenges that each group faces. However, due to this data
shortcoming, this report focuses on the impacts of U.S. trade policies on Black and Latino workers, as defined by the BLS,
and for fluidity uses Black and African American interchangeably. The report also uses the term white, understanding that
this means non-Latino white population. Additionally, this research focuses on impacts on workers within the United States,
regardless of legal status.
10PUBLIC CITIZEN Trade Discrimination
• At the national level, 56% of union voters supported Biden while 40% supported Trump.
This 16-point union-voter margin for Biden nearly doubles Hillary Clinton’s union-voter
margin in 2016.11
▪ In some key swing states that decided the 2020 election, the union-voter swing against
Trump was yet larger. In 2016, Clinton carried union voters by 10 points in Wisconsin
(53% - 43%), while in 2020, Biden beat Trump’s Wisconsin union vote by 19 points
(58% - 39%). In both Michigan and Nevada, Biden’s margin with union voters was
larger than Clinton’s in 2016.12
• Voters living in households making $50,000 and under also were critical to Joe Biden’s
victory. In 2020, Biden won 55% of these voters, beating Clinton in 2016 (52%) and Obama
in 2012 (54%).13 According to Washington Post exit polls, 35% of voters fall into this
income category,14 in which Black and Latino families are disproportionally represented.
While 37.1% of the entire population lives in households with an income of less than
$50,000, this figure rises to 53.8% and 44.1%, respectively, for families where the
householder is Black and Latino.15
▪ In Wisconsin, Biden won voters making $50,000 and under by 22 points (60% - 38%),
up 18 points from Hillary Clinton in 2016 (49% - 45%). In Georgia, Clinton lost these
voters to Trump by 1 point (47% - 48%), while Joe Biden won 56% of voters to
Trump’s 42%, a 15-point swing in four years. In Michigan these voters went to Biden
57% - 42%, up four points from Clinton in 2016 (53% - 42%). Biden also outperformed
with these voters in Pennsylvania, capturing 56% to Trump’s 42%, up 2 points from
Clinton’s showing in 2016 (54% - 42%).16
What caused these shifts? Certainly, more research is needed. Sadly, the 2020 network exit
polls did not explicitly ask about trade, as they did in 2016 when exit polling found trade
issues and job offshoring to be key factors in swing Midwestern states that had voted for
Obama twice and then Trump. However, what already is well documented is that Trump did
not deliver his promises to working-class people. Instead of stopping trade-related job loss
and offshoring, during the Trump administration 311,427 American jobs have been
government-certified as lost to trade, with 202,543 explicitly listed as offshored.17 Instead of
creating a manufacturing jobs boom, growth in that sector continued on a trajectory it had
during the last two years of the Obama administration and then, by the start of 2019,
flattened. Then in large part because of Trump’s mismanagement of the COVID-19 crisis,
some 750,000 manufacturing jobs have been lost in 2020.18 Instead of ending the trade deficit,
“and quickly,” imports into the U.S. surged and the U.S. trade deficit by the third quarter of
11PUBLIC CITIZEN Trade Discrimination
Trump’s final year in office is 26.4% higher than in the same period in President Barack
Obama’s last year, despite a 14.6% overall fall-off in trade flows compared to 2019 related to
the COVID-19 pandemic.19
Whether these working-class voters of diverse races and ethnicities will stick with the
Democratic Party or vote at all in 2024 depends on whether their lives and livelihoods
measurably improve over the next four years. And that relies on the Biden administration
enacting economic policies designed to do just that, which means breaking from the trade
policy supported by Republican and Democratic presidents alike over the past few decades.
Whatever political party delivers for working-class voters of all races and ethnicities will be
the party able to win national elections.
Democrats’ need to create a new working-class-first trade policy is especially urgent given
the critical role Black and Latino voters have traditionally played in their electoral majorities.
Black and Latino workers directly lost jobs and experienced wage stagnation from NAFTA,
the agreements enforced by the WTO and the “China Shock” following China’s entry into the
WTO because they were overrepresented in the industries and concentrated in the regions
that were hit hardest. Latino and Black workers have also been impacted by the prevailing
economic trends plaguing many U.S. workers during the NAFTA-WTO period, only more
intensely. These findings spotlight why the next Democratic administration must recognize
the disproportionate harm done by past trade policies to people of color and adopt a new
approach to redress it.
Job offshoring and the decline of manufacturing especially affect Black and Latino workers
due to the damaging disparities in educational opportunities resulting in Black and Latino
workers being overrepresented in the non-college educated workforce and the way in which
increased competition for a reduced number of quality jobs available for non-college
educated workers exacerbates underlying racial biases.
The outcome: Latino and Black workers impacted by “trade” deals struggle harder to find new
jobs and face larger pay cuts when they do. This entrenches and widens significant income and
wealth inequality existing between Black and Latino families relative to their white
counterparts, contributing to the racist economic structure prevalent in the United States.
12PUBLIC CITIZEN Trade Discrimination
1. U.S. Trade Policy Has Increased the Economic Insecurity of Many
Black and Latino Families
People of color, both inside the United States and in the Global South, have borne the brunt
of the damage caused by corporate-led globalization. U.S. trade policies have had
devastating effects in the developing world. NAFTA, for example, displaced more than two
million Mexicans engaged in farming and related work after floods of subsidized U.S. corn
flowed into Mexico after the country eliminated policies that had only allowed corn imports
if domestic production failed to meet demand.20 Many of the NAFTA-displaced headed to
Mexican border maquila factory towns and across the U.S. border in search of work,
creating a precarious workforce that was easily exploited by companies on both sides of the
border.21 Since then, Mexico’s real wages have decreased, and over half of the population
still lives in poverty.22
Yet, while the negative effects on U.S. trade partners with large populations of people of color
have been extensively documented and discussed, the disproportionate harm assumed by
Black and Latino families inside the United States has received less attention. This report puts
the spotlight on this issue.
1.1 The Decline of Manufacturing Due to Trade Harms Black and Latino
Families
The dramatic decline of the U.S. manufacturing sector over the past three decades has
disproportionately harmed Black and Latino workers. A strong manufacturing sector means
higher wages, better working conditions, greater rates of unionization, and more economic
stability. Manufacturing wages are higher, on average, than those in the service sector, a fact
often twisted to claim that export-related jobs have higher-than-average wages. For example,
U.S. workers in the manufacturing sector earned an average of $27.70 per hour in 2019,
compared to $16.56 in leisure and hospitality, and $19.68 per hour in retail,23 which are
sectors with numerous jobs also available for workers without college degrees.
Even using median wage data, which limit how higher supervisory staff salaries distort the
calculation of average manufacturing sector salaries, manufacturing generally provides
better wages compared to other sectors of the economy. The table below shows median
weekly earnings for manufacturing, retail, leisure and hospitality, and all industries in 2019.
Broadly speaking, the manufacturing median weekly wage is 4.81% higher compared to the
median for workers in all sectors, and 33.5% and 55.7% superior to weekly wages in the retail
and leisure, and hospitality industries, respectively.
13PUBLIC CITIZEN Trade Discrimination
Median Usual Weekly Earnings in 2019
Industry Manufacturing Retail Leisure and All Industries
Hospitality
Type of Worker
Total $ 936 $ 701 $ 601 $ 893
Union Members $ 962 $ 744 $ 722 $ 1025
Represented by Unions $ 962 $ 730 $ 698 $ 1013
Non-union $ 933 $ 699 $ 597 $ 881
Source: U.S. Bureau of Labor Statistics24
The table also shows how the wages for union workers and workers represented by unions
(i.e., workers who report no union affiliation but whose jobs are covered by a union contract)
are higher compared to non-unionized wages in the same sector. A higher proportion of
workers benefit from this “union premium” in manufacturing compared to the
aforementioned services industries. Whereas the unionization rate in manufacturing is about
9.5%, the rate for retail is around 5%, and 3.5% for leisure and hospitality.25 The higher rates
of unionization in manufacturing means more workers in that sector have better salaries. The
Center for American Progress found that unions especially benefit non-white members with
regard to wealth accumulation, as they see larger increases in pay, benefits, and employment
stability than white union members.26
The negative consequences that the decline of manufacturing has had on African American
families has been the subject of several recent studies. In 2018, the Alliance for American
Manufacturing issued a report documenting how high and long-term unemployment
experienced by African Americans due to deindustrialization contributed to the
impoverishment of Black communities. This study further explains how deindustrialization
spurred a loss of personal wealth for African Americans, along with population loss and
segregation and decline in municipal financial resources in deindustrialized communities,
whose remaining residents were mainly Black.27 Additionally, Professor Eric D. Gould of the
Hebrew University of Jerusalem provided empirical evidence showing that manufacturing
decline between 1960 and 2010 had a disproportionate impact on Black communities in terms
of wages, employment, marriage rates, house values, poverty rates, death rates, single
parenthood, teen motherhood, child poverty, and child mortality.28
14PUBLIC CITIZEN Trade Discrimination
In that sense, the manufacturing sector as well as unionization have been a pathway for
Americans of all races and ethnicities to the middle class, and deindustrialization and the
decline of union membership particularly affect African Americans and Latinos’ prospects to
reach to this pathway.
1.2 Manufacturing Job Loss and Wage Stagnation Is Concentrated in
Economic Sectors With Significant Black and Latino Employment
Black and Latino workers were disproportionately represented in industries that have been
hit hardest by offshoring and import competition. This reality was explored in a 2019 paper
by the Center for American Progress with regard to Black workers and the automotive
sector.29 The percentage of African Americans and Latinos working in the manufacturing
sectors hit the hardest is greater than their overall representation in the U.S. workforce.
The table below shows the 10 manufacturing subsectors that experienced the greatest trade
balance decline between 1993 and 2019.iii
Top 10 of Most Affected Manufacturing Subsectors by Average Yearly
Percentage Variation
(1993 – 2019)
Average Yearly Average Yearly
Trade Balance Percentage
Manufacturing Subsector (2019 USD) Variation
323. Printing $701,319,419.33 -145.17%
337. Furniture ($22,544,917,825.68) -69.77%
326. Plastics & Rubber ($11,376,274,000.93) -67.52%
312. Beverages & Tobacco ($8,823,235,238.18) -45.81%
325. Chemicals ($14,019,673,081.36) -41.22%
332. Fabricated Metal Products ($17,122,291,565.16) -25.44%
331. Primary Metals ($34,531,042,433.70) -16.00%
322. Paper ($1,305,854,990.22) -13.23%
335. Electrical Equip., Appliances & Components ($37,367,280,992.10) -10.80%
336. Transportation Equipment ($101,968,915,910.31) -10.23%
Source: U.S. International Trade Commission30
iii
The table was constructed using trade data sourced from the U.S. International Trade Commission discerned by North
American Industry Classification System (NAICS) 3-digit codes. Since this system replaced the Standard Industrial
Classification (SIC) System in 1997, we used the equivalent SIC codes to retrieve trade data for 1993, 1994, 1995 and
1996. Appendix A includes a chart with the equivalences used.
15PUBLIC CITIZEN Trade Discrimination
African Americans, Latinos or both were a larger share of the workforce compared to their
share over the entire working population in nine of the 10 industries listed above in 1995, the
earliest year with employment data by detailed industry and race and Hispanic origin that is
proximate to the start of the NAFTA and WTO. (The only exception was printing, which in
any case represents a considerably smaller share of trade.) For example, while Black workers
comprised 10.6% of the overall labor force in 1995, they represented 13.5% of the workforce
in paper manufacturing, 11.4% in chemicals, 11.3% in transportation equipment and 11.1% in
primary metals.31 While Latinos comprised 8.9% of the labor force, they represented 12.3% of
workers in the manufacturing of fabricated metals, 11.4% of furniture, and 10.5% of plastics
and rubber.32 Furthermore, African Americans and Latinos represented 13% and 15.4%,
respectively, of the workforce dedicated to the beverages industry.
Textile and apparel are not included in the industries that experienced the sharpest
deteriorations on their trade balances during the NAFTA-WTO era because by 1993 the trade
deficit for these products was already large — $53.1 billion in 2019 dollars. However, a large
proportion of Black and Latino workers, with respective participation of 15% and 24%,
worked in the textile and apparel sectors. And, these sectors faced floods of imports from
low-wage countries during the NAFTA-WTO era, leading to a $107.4 billion deficit in 2019.
After the explosion of the U.S. trade deficit, triggered by the entry into force of NAFTA and
the WTO, African Americans and Latinos experienced considerable job losses in the sectors
that had substantial trade balance deteriorations and where they were overrepresented
during the mid-1990s when the trade deals went into effect.
Black workers’ manufacturing job losses were evenly spread across several subsectors.
Comparing Bureau of Labor Statistics’ employment data for 1995 and 2019, Black workers
were disproportionately represented in the primary metals manufacturing sector hit by
NAFTA-WTO era with a loss of 53,800 jobs. Black workers have also lost 22,100 jobs in the
paper manufacturing industry and 18,600 jobs in the beverages and tobacco industry during
the NAFTA-WTO era, two more sectors where Black workers were overrepresented relative
to their general share of the workforce.33
During the last 25 years, African Americans also lost 120,900 jobs in electrical equipment
and appliances, 51,200 jobs in fabricated metals, and 30,200 jobs in plastics and rubber
manufacturing, sectors in which Black workers were not overrepresented.34 Overall,
Black workers have lost nearly half a million manufacturing jobs (494,000) during the
NAFTA-WTO era.35
16PUBLIC CITIZEN Trade Discrimination
In the automotive sector, between 1995 and 2010 alone – the first 15 years of NAFTA – Black
workers lost 56,524 jobs.36 Well-paying, middle-class, union, auto-sector jobs were outsourced
to Mexico, where U.S. companies paid workers less per day than they paid U.S. workers per
hour to do the same jobs. From the start of NAFTA into 2019, the United States has seen the
trade deficit with Mexico in autos and auto parts increase 3,004%.37 The suppression of
independent unions in Mexico and other policies and practices designed to lock in low wages
has fueled the offshoring of production by U.S. automakers to the present. In 2019, General
Motors announced that it would close plants in the Midwest as it had shifted its most popular
vehicles’ production to Mexican plants. Ford decided to make its new Mustang hybrid SUV in
Mexico. To the extent the auto sector has added U.S. jobs, growth has been in Southern states
that lost hundreds of thousands of jobs in textile and furniture manufacturing. There, workers
in non-unionized auto sector factories making non-U.S. brands are paid considerably less
than autoworkers employed by the Big Three U.S. automakers in Midwestern union plants
had made. For instance, between 2001 and 2018, Michigan lost 125,200 auto jobs, while
Alabama gained 25,200.38 Today, non-union jobs in foreign “transplant” auto factories
represent 48% of U.S. vehicle production, up from just 17% in 2000.39
Latino workers also experienced job losses in sectors where they were overrepresented when
NAFTA and the WTO went into effect and U.S. manufacturing workers faced the pincer move
of harsh import competition and production offshoring. However, today Latinos represent
almost double the share of the U.S. workforce relative to 25 years ago — from 8.9% to 17.6%.
As a result, more Latinos work in various manufacturing industries today compared to 1995.
While many Mexican workers on the other side of the border found jobs in maquiladoras where
U.S. companies paid Mexican workers less than $2 per hour producing electrical equipment
and appliances for the U.S. market in the NAFTA period, U.S. Latinos lost 123,000 jobs in the
decline in the U.S. electrical equipment and appliances industry.40 Perhaps more infamously,
during the last 25 years 182,700 Latino jobs in the United States have been lost in textiles,
apparel and leather manufacturing.41 The California garment sector centered in Los Angeles,
with an estimated 80% Latino workforce, was one of these casualties.42
The explosion of trade deficits in the aforementioned sectors — along with the offshoring
threat — not only resulted in significant job loss for people of color across the United States.
It also contributed to the stagnation of wages, which was especially acute in highly trade-
impacted manufacturing industries. The graph below shows the growth rate of average
earnings for production and nonsupervisory employees in highly trade-impacted
manufacturing industries (which correspond to the top 10 most affected manufacturing
17PUBLIC CITIZEN Trade Discrimination
subsectors identified above, with the exception of beverages and tobacco due to the lack of
comparable data), all manufacturing industries, and leisure and hospitality.
Yearly Variation of Average Hourly Earnings of Production and
Nonsupervisory Employees in Selected Industries
(1994 - 2019)
5.00%
4.00%
3.00%
2.00%
1.00%
0.00%
1996
1994
1995
1997
1998
1999
2000
2001
2002
2003
2004
2005
2006
2007
2008
2009
2010
2011
2012
2013
2014
2015
2016
2017
2018
2019
-1.00%
-2.00%
-3.00%
Highly Trade-Impacted Industries All Manufacturing Leisure and Hospitality
Source: U.S. Bureau of Labor Statistics
The graph illustrates how workers in highly trade-impacted manufacturing industries had
lower earnings growth rates compared to all manufacturing. Furthermore, the growth rates
for wages of leisure and hospitality workers, who are relatively unexposed to import
competition or offshoring threats, have been greater than those in manufacturing. Whereas
earnings in highly trade-impacted industries have remained virtually flat (0.02% average
growth rate on real terms), workers’ earnings in all manufacturing and hospitality and
leisure had less than impressive but at least some degree of average yearly real earnings
growth, with rates of 0.54% and 0.92% respectively. This is not to say that non-college
educated workers would be better off if they were engaged in leisure and hospitality
activities given that wages in this sector are considerably lower compared to manufacturing.
Nevertheless, these figures on wage growth rates illustrate the impact that the deterioration of
trade balances has had on the wages of workers engaged in industries where Latinos and
African Americans were overrepresented.
18PUBLIC CITIZEN Trade Discrimination
These findings are consistent with recent
econometric literature. Professors John McLaren It’s Not All
from the University of Virginia and Shushanik
Manufacturing
Hakobyan from Middlebury College found that
Call Centers Employ Many
NAFTA reduced wage growth in the most
People of Color and Have
affected industries by 17 percentage points
relative to other industries.43 Been Hit by Mass Offshoring
The economic fallout from NAFTA, the WTO Globalization and trade deals have also
impacted service sector jobs. Call center
and China trade not only disproportionately jobs provide an example of service sector
harmed manufacturing workers in sectors in jobs for which many workers benefit from
which many people of color were employed, union representation that are being mass
outsourced to low wage countries, like the
but in addition, the states and cities where
Philippines. The Business Process
Black and Latino populations are concentrated Outsourcing (BPO) industry considers the
represent a disproportionate share of TAA- Philippines a choice venue because call
center workers there are paid less than $2
certified trade job loss.
per hour and are denied basic worker
rights.i U.S. call center workers represented
1.3 Trade-Related Job Loss Is by the Communications Workers of
America union have coordinated with their
Concentrated in States With Filipino counterparts, including to protest
Greatest Black and Latino the arrest of those seeking to organize
unions to fight for better wages and
Populations working conditions.i Some 58,220 of the
U.S. jobs certified as lost to the Philippines
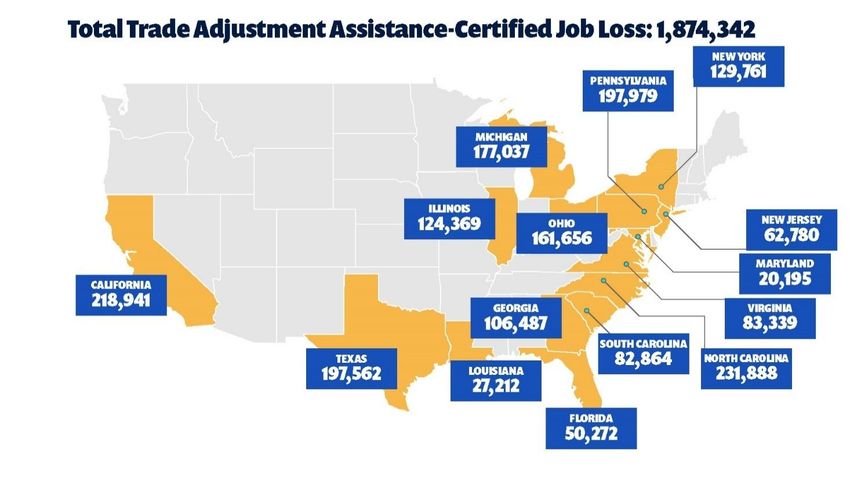
Just 15 U.S. states that are home to 85% of the are designated as explicitly lost to
total U.S. Latino population44 account for half of offshoring. People of color (i.e., Black,
TAA-certified trade-related job losses – 1.6 Asian and Latino Americans) account for
43% of U.S. workers engaged as customer
million of the more than 3.2 million U.S. jobs lost service representatives.i Some 71,788 U.S.
– from the start of the NAFTA-WTO era in 1994 jobs are TAA-certified as lost to trade with
to the latest TAA certifications, which cover most the Philippines, with 58,220 of those jobs
designated as explicitly lost to offshoring. i
of 2019.45 Those 15 states also account for nearly Until recent years, TAA did not cover
half (47%) of all TAA-certified job losses caused service sector workers at all, so waves of
by NAFTA – 480,000 out of 1.01 million.46 call center and other service-sector
instances of mass offshoring were not
Moreover, 2.4 million of the 4 million total counted. More offshoring is projected for
manufacturing job losses documented by the call center jobs, with the U.S. Bureau of
U.S. Bureau of Labor Statistics during the Labor Statistics having forecast that an
additional 51,600 American jobs would be
NAFTA-WTO era supported working families lost in the sector between 2018 and 2028.i
in these 15 states.47
19PUBLIC CITIZEN Trade Discrimination
50% of Government-Certified Trade-Related Job Losses
(1.6 Million) Are in These 15 States Where 85% of the Latino
Population Resides
Source: U.S. Department of Labor Trade Adjustment Assistance data provided with geomapping
via Public Citizen’s Trade Adjustment Assistance Database
According to the U.S. Bureau of Labor Statistics, Black workers have lost nearly half a million
manufacturing jobs (494,000) during the NAFTA-WTO era.48 Just 15 states that are home to
58% of the Black population49 account for 57% of TAA-certified trade-related job losses – 1.8
million of the more than 3.2 million U.S. jobs – between the start of the NAFTA-WTO era and
mid-2019.50 Additionally, 57% of TAA job losses caused by NAFTA — since NAFTA’s
implementation up to April 2020 — happened in these 15 states.51 These 15 states also
account for 2.9 million of the 4 million total manufacturing job losses documented by the U.S.
Bureau of Labor Statistics during the NAFTA-WTO era.52
20PUBLIC CITIZEN Trade Discrimination
57% of Government-Certified Trade-Related Job Losses
(1.8 million) Are in These 15 States Where Majority of Black
Population Resides
Source: U.S. Department of Labor Trade Adjustment Assistance data provided with geomapping
via Public Citizen’s Trade Adjustment Assistance Database
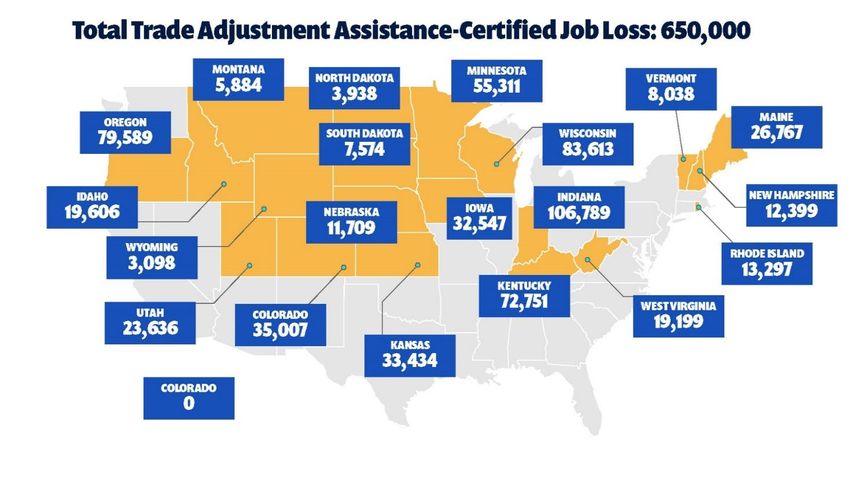
The 20 U.S. states that are least racially diverse also are states that have less manufacturing
and thus have been less impacted by trade-related job offshoring tracked by the TAA
program. Combined together, Maine, Vermont, West Virginia, New Hampshire, Idaho,
Wyoming, Iowa, Utah, Montana, Nebraska, Kentucky, Wisconsin, Colorado, North Dakota,
Oregon, Kansas, Indiana, South Dakota, Minnesota, and Rhode Island represent 650,000 of
the 3.2 million TAA certified job losses and less than 10% (only 300,000 of the total 4 million)
of U.S. manufacturing job losses during the NAFTA-WTO era, according to the U.S. Bureau
of Labor Statistics.” 53
21PUBLIC CITIZEN Trade Discrimination
The 20 U.S. States That Are Least Racially Diverse Have Less
Manufacturing and Thus Have Been Less Impacted by
Trade-Related Job Offshoring Tracked by the TAA Program
Source: U.S. Department of Labor Trade Adjustment Assistance data provided with geomapping via
Public Citizen’s Trade Adjustment Assistance Database
Many of the states — and cities such as Detroit, Chicago, Pittsburgh, New York, and
Cleveland — that were hardest hit by U.S. trade policy failures were locations whose
growing manufacturing employment opportunities had drawn six million Black workers
fleeing racial terror and poverty in the Jim Crow South for safety and better economic
opportunities in the first half of the 1900s.54
22PUBLIC CITIZEN Trade Discrimination
U.S. Cities With Large Black and Latino Populations
Slammed by Trade-Related Job Loss
The trade-related loss of factories, jobs and wages had a significant impact on many cities where
people of color (i.e., Black, Asian, Latinos, American Indians) constitute a large share of the
population. Local governments were simultaneously hit by declining revenue and increasing demand
for services from residents adversely impacted by trade deals and globalization, straining the social
safety net. The result has been a significant crisis for local government services, including education,
in the areas hardest hit. Throughout the United States, communities have suffered significant economic
stress due to trade deals. Here are some examples of the impact of globalization on well-paying
manufacturing jobs in cities with a large population of people of color. The following figures55 are for
the 1995-2019 time period (the earliest and latest years for which comparable data are available), and
all dollar figures are adjusted for inflation.
Baltimore: People of color constitute 73% of Baltimore’s 593,490 residents.56 From 1995 to 2019, the
city lost 44,300 of its manufacturing jobs, which comprised 42.6% of its manufacturing workforce.57
Chicago: People of color constitute 68.5% of Chicago’s 2.7 million population.58 From 1995 to 2019,
Chicago lost 219,100 of its manufacturing jobs, which comprised 44% of its manufacturing jobs.59
Cleveland: People of color constitute 68.4% of Cleveland’s 381,000 population.60 From 1995 to 2019,
the city lost 76,200 of its manufacturing jobs, which comprised 38% of its manufacturing workforce.61
Detroit: People of color constitute 90% of Detroit’s 670,000 population.62 From 1995 to 2019, Detroit
lost 48,700 manufacturing jobs — one-third of its manufacturing workforce.63 Many of the jobs were
lost to NAFTA in automobile sector factories. The counties surrounding Detroit and nearby towns like
Flint, which have major Black populations, also suffered major NAFTA-related auto sector job loss.
El Paso: People of color constitute 89.5% of El Paso’s 681,728 population.64 From 1995 to 2019, El
Paso lost 27,400 of its manufacturing jobs, which comprised 61% of its manufacturing workforce.65
Los Angeles: People of color constitute 73.6% of the 3,979,576 people living in Los Angeles.66 From
1995 to 2019, Los Angeles lost 284,500 of its manufacturing jobs, which comprised 46% of its
manufacturing workforce.67
Milwaukee: People of color constitute 65.9% of the 590,157 people living in Milwaukee.68 From 1995
to 2019, Milwaukee lost 44,100 of its manufacturing jobs, which comprised 27.1% of its
manufacturing workforce.69
Philadelphia: People of color constitute 67.4% of the 1,584,064 people living in Philadelphia.70 From
1995 to 2019, Philadelphia lost 39,900 of its manufacturing jobs, which comprised 54.6% of its
manufacturing workforce.71
St. Louis: People of color constitute 56.7% of the 300,576 people living in St. Louis.72 From 1995 to
2019, St. Louis lost 60,800 of its manufacturing jobs, which comprised 33.8% of its manufacturing
workforce.73
23PUBLIC CITIZEN Trade Discrimination
1.4 Black and Latino Workers Are Overrepresented Among Those Whose
Wages Have Stagnated and Economic Fortunes Declined Since NAFTA
The data incorporated in the previous sections suggest that, contrary to recent conventional
wisdom, Black and Latino workers have indeed been severely affected by the job loss and
wage stagnation caused by failed trade policies in the United States. And, Black and Latino
workers have been disproportionately affected by the broader economic trends impacting
U.S. workers during the NAFTA-WTO period. However, the negative impact of trade shock
job loss and wage declines are magnified for these demographic groups because it comes in
the context of underlying racial biases against Black and Latino populations that have affected
hiring and promotion prospects, wages and educational opportunities for generations.
The manufacturing sector provides well-paid
jobs for workers without college degrees. Job
offshoring and the decline of manufacturing
Even When Well-Paying Jobs Are
has meant disproportionate wage losses for Not Outsourced, Downward
Black and Latino workers, in part because of Pressure on Wages Continues
damaging disparities in educational
NAFTA’s special investor protections and
opportunities resulting in Black and Latino
guaranteed duty-free access for Mexican goods
workers being overrepresented relative to
to the U.S. market have led to downward
their share of the overall workforce among the
pressure on wages even in the context of
58% of Americans without college degrees workers with union representation. Namely,
who were left to compete for an ever- after NAFTA, U.S. companies became more
diminishing number of quality jobs available likely to threaten relocation as a means of
for non-college educated workers. Sixty-eight defeating union organizing drives or otherwise
percent of Africans Americans and 77% of restrain or cut wages or benefits for U.S. workers
Latinos do not have college degrees as of 2019, in union contract negotiations.74 The research
compared to 54% of the white population.76 found an increase in the number of such threats
Professors Mary Batistich and Timothy Bond of relocation in mobile industries after NAFTA
of Purdue University recently explored the came into effect. Overall, unions had a lower
impact of the rise of import competition from success rate in campaigns where threats to close
Japan during the 1970s and 1980s on were used (38%) than in campaigns where no
manufacturing losses for African Americans. such threats were made (51%).75
They found that while import competition
from Japan led to decreased manufacturing
24You can also read