The electrical activity of Saharan dust as perceived from surface electric field observations
←
→
Page content transcription
If your browser does not render page correctly, please read the page content below
Atmos. Chem. Phys., 21, 927–949, 2021
https://doi.org/10.5194/acp-21-927-2021
© Author(s) 2021. This work is distributed under
the Creative Commons Attribution 4.0 License.

The electrical activity of Saharan dust as perceived from
surface electric field observations
Vasiliki Daskalopoulou1,2 , Sotirios A. Mallios2 , Zbigniew Ulanowski3,4 , George Hloupis5 , Anna Gialitaki2,6 ,
Ioanna Tsikoudi2,7 , Konstantinos Tassis8,9 , and Vassilis Amiridis2
1 Section  of Astrophysics and Space Physics, Department of Physics, University of Crete, Heraklion 70013, Greece
2 Institute for Astronomy, Astrophysics, Space Applications and Remote Sensing,
National Observatory of Athens, Athens 15236, Greece
3 Department of Earth and Environmental Sciences, University of Manchester, Manchester M13 9PL, UK
4 British Antarctic Survey, NERC, Cambridge CB3 0ET, UK
5 Department of Surveying and Geoinformatics Engineering, University of West Attica,

Egaleo Campus, Egaleo 12244, Greece
6 Laboratory of Atmospheric Physics, Department of Physics,

Aristotle University of Thessaloniki, Thessaloniki 54124, Greece
7 Section of Environmental Physics and Meteorology, National and Kapodistrian University of Athens, Athens, Greece
8 Institute for Theoretical and Computational Physics, Department of Physics,

University of Crete, Heraklion 70013, Greece
9 Institute of Astrophysics, Foundation for Research and Technology – Hellas, Heraklion 71110, Greece

Correspondence: Vassilis Amiridis (vamoir@noa.gr)

Received: 3 July 2020 – Discussion started: 27 July 2020
Revised: 24 November 2020 – Accepted: 4 December 2020 – Published: 25 January 2021

Abstract. We report on the electric field variations during Sa-     ment, episodic cases that reduce the electric field are also
haran dust advection over two atmospheric remote stations in        observed (up to ∼ 60 V m−1 ). To quantitatively approach our
Greece, using synergistic observations of the vertical atmo-        results, we examine the dependency of Ez against theoretical
spheric electric field strength (Ez ) at ground level and the       assumptions for the distribution of separated charges within
lidar-derived particle backscatter coefficient profiles. Both       the electrified dust layer. Electrically neutral dust is approx-
parameters were monitored for the first time with the simulta-      imated by atmospheric conductivity reduction, while charge
neous deployment of a ground-based field mill electrometer          separation areas within electrically active dust layers are ap-
and a multi-wavelength polarization lidar. The field mill time      proximated as finite-extent cylinders. This physical approxi-
series are processed to extract the diurnal variations of the       mation constitutes a more realistic description of the distribu-
global electric circuit and remove fast field perturbations due     tion of charges, as opposed to infinite-extent geometries, and
to peak lightning activity. In order to identify the influence of   allows for analytical solutions of the electric field strength so
the elevated dust layers on the ground Ez , we extract a local-     that observed variations during the monitored dust outbreaks
ized reference electric field from the time series that reflects    can be explained.
the local fair-weather activity. Then, we compare it with the
reconstructed daily average behaviour of the electric field and
the Saharan dust layers’ evolution, as depicted by the lidar.
The observed enhancement of the vertical electric field (up         1   Introduction
to ∼ 100 V m−1 ), for detached pure dust layers, suggests the
presence of in-layer electric charges. Although higher dust         The global electric circuit (GEC) represents the electric cur-
loads are expected to result in such an electric field enhance-     rent pathway in Earth’s atmosphere. The electric current that
                                                                    flows upwards from thunderstorms and electrified clouds into

Published by Copernicus Publications on behalf of the European Geosciences Union.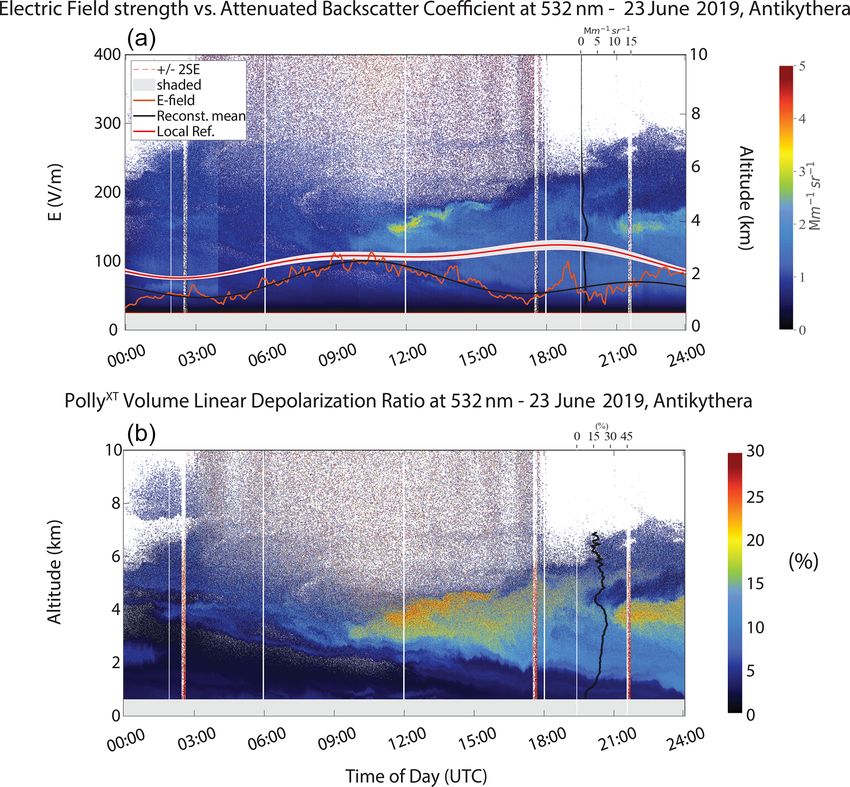
928                                                           V. Daskalopoulou et al.: The electrical activity of Saharan dust

the ionosphere spreads out over the globe along magnetic           and particle-to-surface or particle-to-particle collisions, i.e.
field lines to the opposite hemisphere and returns to the sur-     triboelectrification (Kamra, 1972; Lacks and Shinbrot, 2019;
face of Earth as the fair-weather air-to-Earth current (Bering     Waitukaitis et al., 2014). Such processes are claimed to have
et al., 1998). The GEC is established by the conducting at-        a large impact on desert dust transport and its influence in
mosphere sandwiched between the conductive Earth and the           climate and ecosystems through the retention of larger dust
conductive mesosphere–ionosphere (Williams, 2009). Atmo-           particles in the atmosphere (van der Does et al., 2018; Ryder
spheric electric parameters, such as the vertical electric field   et al., 2018), as well as on particle vertical orientation with
(Ez ) and induced air-to-Earth current (Ic ) through the GEC,      an impact on radiative transfer (Bailey et al., 2008; Mallios
greatly depend on ambient weather conditions and convec-           et al., 2021; Ulanowski et al., 2007).
tive meteorological systems (Kourtidis et al., 2020) due to           Ground-based electric field measurements can be indica-
the re-distribution of charged or uncharged aerosols and ter-      tive of the electrical behaviour of elevated dust layers. These
restrial radioactive particles in Earth’s atmosphere (Harrison     measurements can provide useful information if they are
and Ingram, 2005; Wright, 1933). Under fair-weather condi-         combined with other retrievals on aerosol profiling (e.g. li-
tions, which are defined according to international standards      dar or ceilometer) (Nicoll et al., 2020). However, features
as those with cloudiness less than 0.2, wind speed less than       of E-field (electric field) time series, such as the enhance-
5 m s−1 , and the absence of fog or precipitation (Chalmers,       ment of the near-ground electric field during dust outbreaks,
1967; Harrison and Nicoll, 2018), the atmospheric electri-         are still unexplained in broad literature (Yaniv et al., 2016,
cal circulation is dominated by the potential difference be-       2017). Observations of an enhanced or even reversed E field
tween the global capacitor planes (about 250 kV; e.g. Rycroft      at the height of the ground-based sensor, e.g. an electrostatic
et al., 2008), which in turn generates the fair-weather electric   fieldmeter, are attributed by Ette (1971) and Freier (1960) to
field and consequently the fair-weather electric current in the    charge separation within electrically active dust. According
presence of the conducting atmosphere. An average current          to several laboratory studies (Duff and Lacks, 2008; Forward
density of 2 pA m−2 and a downward-looking (by conven-             et al., 2009; Inculet et al., 2006; Waitukaitis et al., 2014),
tion positive; e.g. Rakov and Uman, 2003, p. 8) electric field     charge transfer processes lead to smaller particles being neg-
equal to a typical value of about 130 V m−1 are expected,          atively charged, while larger particles tend to be positively
respectively (Rycroft et al., 2008). The daily variation of        charged; therefore charge separation within lofted dust lay-
the global thunderstorm activity modulates the electric field      ers is also possible due to the expected size-selective gravi-
strength, and the resulting diurnal variation is represented by    tational settling that could stratify the fine- and coarse-mode
the Carnegie curve (Harrison, 2013).                               particles (Ulanowski et al., 2007). An observed reduction of
   Amongst the aerosols affecting the atmospheric electri-         the E field in a mountainous area is attributed to the superpo-
cal content (Whitby and Liu, 1966), mineral dust represents        sition of two dust layers in different heights with respect to
one of the most significant contributors, along with volcanic      the ground-based sensor (Katz et al., 2018). Moreover, lay-
ash (Harrison et al., 2010), due to its mineralogical com-         ers that exhibit large particle densities lead to more particles
position that results in different electrical properties of the    competing for the same amount of ions (ion–particle com-
dust particles (Kamra, 1972) and its abundance in terms of         petition; e.g. Gunn, 1954; Reiter, 1992); hence they act as a
dry mass (Tegen et al., 1997). During dust storms, dust dev-       passive element within the atmospheric circulation and can
ils and the subsequent advection of elevated dust layers, the      reduce the near-ground electric field. A similar reduction of
electrical parameters can vary greatly from the values un-         the electric field can be expected whenever, for any reason,
der fair-weather conditions (Harrison et al., 2016; Renno          the charge separation does not occur. As an example, one
and Kok, 2008; Zheng, 2013). It is well documented that            can think of meteorological conditions that force the parti-
over deserts the emission process of dust particles can gen-       cles to move randomly, cancelling their vertical movement
erate large atmospheric electric fields (Esposito et al., 2016;    and, therefore, the charge separation. Nonetheless, system-
Renno and Kok, 2008; Zheng, 2013) that affect their flow           atic profiling measurements are needed so as to fully charac-
dynamics (Kok and Renno, 2006). Charged dust occurrences           terize the electrical properties of the dust particles aloft, with
are recorded via ground-based methods also in destinations         respect to the locally occurring meteorological conditions.
further away from the source (Harrison et al., 2018; Katz             In this study, we focus on monitoring perturbations of the
et al., 2018; Silva et al., 2016; Yair et al., 2016; Yaniv et      E field near the ground caused by the transported dust layers,
al., 2017), while balloon-borne observations (Kamra, 1972;         with special emphasis on slow E-field perturbations (with a
Nicoll et al., 2011) indicate that space charge is indeed per-     duration larger than 6 h to exclude phenomena with small
sistent within lofted dust layers during their transport to long   timescales or local effects of random origin), and we attempt
distances. The exact mechanisms that would explain and suf-        to classify and comment on the electrical activity of the dust
ficiently describe the long-range electrification of dust are      layers. As electrically active we define the layers that ex-
not clear yet and remain under investigation. Major processes      hibit charge separation and behave as electrostatic genera-
that are considered responsible for the electrification of dust    tors in the GEC, similarly to electrified shower clouds and
particles include ion attachment (Tinsley and Zhou, 2006)          thunderstorms (e.g. Mallios and Pasko, 2012). Conversely,

Atmos. Chem. Phys., 21, 927–949, 2021                                                 https://doi.org/10.5194/acp-21-927-2021
V. Daskalopoulou et al.: The electrical activity of Saharan dust                                                              929

electrically neutral ones are assumed to be the layers with no    are observed. Moreover, the prevailing meteorological con-
charge separation which, therefore, act as passive elements in    ditions on the island are again representative of the eastern
the GEC, similarly to the non-electrified shower clouds (e.g.     Mediterranean with warm and dry days in summer in con-
Baumgaertner et al., 2014). Four selected cases of Saharan        trast to winter, when the days are colder and wetter days are
dust plumes are examined, as captured over Finokalia and          typical. The dust outbreaks recorded were on 25 July 2017
Antikythera atmospheric observatories by the same ground-         and 16 March 2018 at Finokalia and 20 October 2018 and
based electrometer, as well as by the sophisticated PollyXT       23 June 2019 at Antikythera; these dates were selected due
lidar system. In Sect. 2, we provide an overview of the in-       to the presence of elevated dust layers in the lidar profiles.
strumentation and measurement techniques and specify the
methods used to parameterize the electrical behaviour of the      2.1     Aerosol monitoring and characterization
dust layers. In Sect. 3 we present the modelled E-field be-
haviour which is used as a proof of concept for the expla-        2.1.1    Lidar measurements
nation of the E-field diurnal variation (relative to the local
                                                                  For the comprehensive characterization of dust particle op-
reference field) presented in the results section along with
                                                                  tical properties, we exploit the profiling capabilities of the
the dynamic evolution of the dust episodes as revealed by
                                                                  PollyXT Raman polarization lidar (Engelmann et al., 2016)
the profiling information from the lidar. We further discuss
                                                                  of the National Observatory of Athens (NOA), which is part
whether the configuration of finite cylindrical charge accu-
                                                                  of the European Aerosol Research Lidar Network (EAR-
mulation regions, previously suggested for the representation
                                                                  LINET). This multi-wavelength system is equipped with
of charge distributions within thunderclouds (Krehbiel et al.,
                                                                  three elastic channels at 355, 532 and 1064 nm; two vibra-
2008; Riousset et al., 2007), is capable of reproducing our
                                                                  tional Raman channels at 387 and 607 nm; two channels
experimental results. Finally, we present our conclusions in
                                                                  for the detection of the cross-polarized backscattered sig-
Sect. 6.
                                                                  nal at 355 and 532 nm; and one water vapour channel at
                                                                  407 nm. The system employs two detectors; a near-field and
                                                                  a far-field telescope provide reliable aerosol optical property
2   Data and methodology
                                                                  profiles from close to the ground to the upper troposphere.
                                                                  The basic lidar quantities used for the monitoring and char-
We analyse four Saharan dust outbreaks recorded over two
                                                                  acterization of dust loads in our study are the total atten-
observational sites in Greece. The first atmospheric moni-
                                                                  uated backscatter coefficient (Mm−1 sr−1 ) at 532 nm (cali-
toring station is situated in the remote location of Finokalia
                                                                  brated range-corrected signal) to account for particle concen-
(35.338◦ N, 25.670◦ E) on the northeastern coast of Crete,
                                                                  trations and the volume linear depolarization ratio (VLDR,
with the nearest large urban centre being the city of Her-
                                                                  δv ) at 532 nm. VLDR (%) is the ratio of the cross-polarized
aklion located 70 km to the west. The station is located at
                                                                  to the co-polarized backscattered signal (Freudenthaler et
the top of a hill (252 m a.s.l.) facing the sea within a sector
                                                                  al., 2009), where the prefixes “cross-” and “co-” are defined
of 270 to 90◦ , and the climatic characteristics are typical of
                                                                  with respect to the plane of polarization of the emitted laser
the eastern Mediterranean basin, exhibiting two distinctive
                                                                  pulses. It encloses the influence of both atmospheric particles
seasons, the dry season (April to September), characterized
                                                                  and molecules, with high δv values being indicative of irreg-
by increased levels of pollution and biomass burning, and
                                                                  ular particles (i.e. atmospheric dust). However, for a compre-
the wet season (October to April). Significant Saharan dust
                                                                  hensive aerosol characterization, the particle backscatter co-
transport occurs when south–southwestern winds are preva-
                                                                  efficient (β) and particle linear depolarization ratio (PLDR,
lent during the intermediate season of March till June and
                                                                  δp ) are needed. PLDR (%) is derived from VLDR by cor-
may lead to ground concentrations exceeding 1 mg m3 (Solo-
                                                                  recting for molecular depolarization with atmospheric pa-
mos et al., 2018). Since there is no significant human ac-
                                                                  rameters extracted from radiosonde measurements (i.e. at-
tivity occurring at a distance shorter than 15 km within the
                                                                  mospheric pressure and temperature). In the selected case
above sector, it makes it an appropriate location for monitor-
                                                                  studies, we also present the δp and β profiles, as derived
ing dust layers advected directly from the Sahara. The second
                                                                  in the timeframe when each dust episode was fully devel-
site is the PANhellenic GEophysical observatory (PANGEA)
                                                                  oped (averaged between 18:00 and 21:00 UTC for all dust
on the remote island of Antikythera (35.861◦ N, 23.310◦ E,
                                                                  cases). Typical δp values for Saharan dust are in the range
193 m a.s.l.). The island covers an area of just 20.43 km2 , is
                                                                  of 25 % to 35 % at 532 nm, while large β values are repre-
38 km southeast of the larger island of Kythera and is de-
                                                                  sentative of substantial particle concentrations (Haarig et al.,
void of human activity, as its inhabitants are at most 20 peo-
                                                                  2017; Veselovskii et al., 2016, 2020).
ple during early fall to midsummer. The station location is
ideal, as the island is placed at a crossroad of air masses
(Lelieveld et al., 2002), with north-northeastern winds be-
ing prominent between August and February, while in spring
and early summer western airflows that favour dust transport

https://doi.org/10.5194/acp-21-927-2021                                               Atmos. Chem. Phys., 21, 927–949, 2021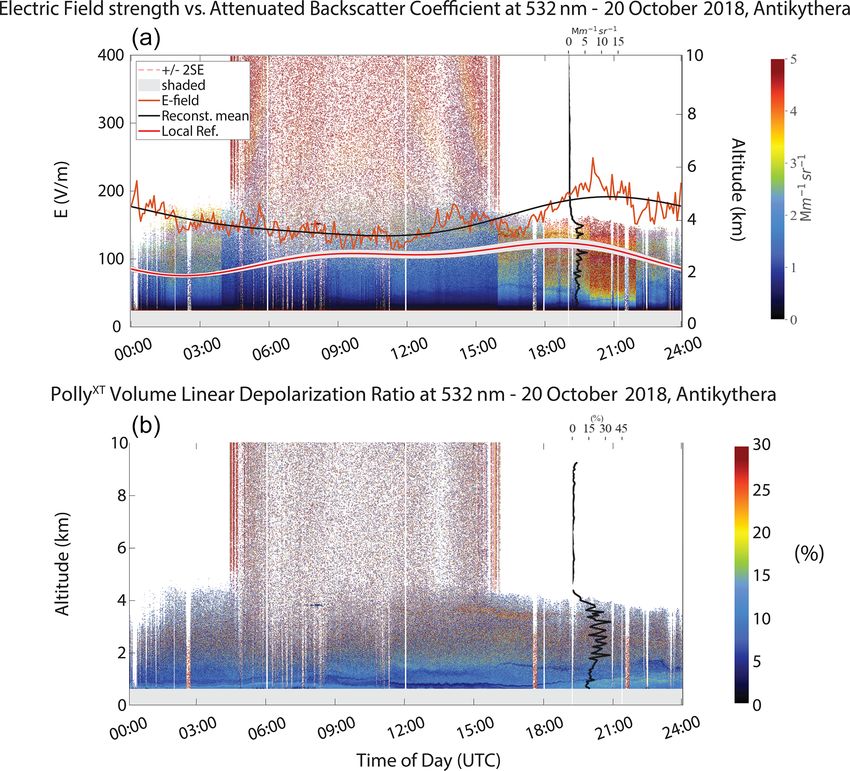
930                                                            V. Daskalopoulou et al.: The electrical activity of Saharan dust

2.1.2    Ancillary aerosol and trajectory information               ground E field (e.g. Zhou and Tinsley, 2007), we construct a
                                                                    localized reference electric field (LREF) by exploiting only
The aerosol optical depth (AOD) was monitored by a                  the inherent time series attributes and the measuring quantity
Cimel sun photometer, as part of the Aerosol Robotic Net-           itself, through the processing chain described below (Fig. 2).
work (AERONET, https://aeronet.gsfc.nasa.gov/, last access:         Various authors have presented different methodologies for
11 December 2020), which was co-located with the li-                determining fair-weather conditions (e.g. Anisimov et al.,
dar on both stations. For the cases examined here, the              2014). For this specific study, the selected constraints of fair
AOD varied from 0.221 to 0.366 at 500 nm. To charac-                weather are based on the classification of fair-weather days
terize the air masses in regard to their origin, we use the         as the less electrically disturbed days, which is also assumed
NOAA HYSPLIT (Hybrid Single-Particle Lagrangian Inte-               by the Carnegie Institute researchers (Harrison, 2013). Al-
grated Trajectory model) backward-trajectory model, driven          though local effects on the E field at each site can be of a
by GDAS (Global Data Assimilation System) meteorologi-              random nature (wind gusts, lightning strikes, radon emission
cal data (https://www.ready.noaa.gov/HYSPLIT.php, last ac-          and turbulent flows due to orography), the selection of fair-
cess: 11 December 2020). The arrival heights for dust over          weather data can be based on noise reduction by subtract-
the observational sites were selected in HYSPLIT according          ing values which are clearly dominated by local influences
to the prevailing layering depicted by our lidar measurements       and not directly addressing the meteorological criteria of fair
(Fig. 1).                                                           weather (Harrison and Nicoll, 2018).
                                                                       As such, the FM data are pre-processed by applying the
2.2     Electric field measurements and data processing             appropriate scaling factor for the 3 m mounting mast of the
                                                                    electrometer (Chubb, 2015) and then days with no missing
2.2.1    Ground-based E-field measurements
                                                                    values due to either instrument malfunction, power outages
The JCI 131 field mill (FM) electrometer (Chubb, 2014,              or PC communication failures are selected (filter no. 1). Un-
2015) was installed at Finokalia from April 2017 until May          der local fair-weather conditions, the E field, as measured
2018 (382 d) and then re-located to Antikythera, where the          here, is positive, therefore imposing the second filtering step
examined time series span from June 2018 to June 2019               with a non-negativity constraint (filter no. 2). When repre-
(243 d) for continuous monitoring of the near-ground (at in-        senting the E-field diurnal variation by the Carnegie curve,
strument mast height) vertical electric field. Field mills are      which is used consistently as a reference against locally mea-
robust instruments, mostly used for lightning warning appli-        sured atmospheric electricity parameters, the hourly varia-
cations, providing, though, sufficient sensitivity for the detec-   tions of the field that shape the curve correspond to the 24,
tion of weaker electric fields. The instrument was mounted          12, 8 and 6 h durations, as deduced from previous consis-
on a 3 m pole and as far as possible from physical obsta-           tent observations of the Carnegie vessel (Harrison, 2013).
cles, buildings and any metallic objects that could create dis-     The present study attempts to derive the local harmonic fit
tortions to the electric field. However, at Finokalia the FM        in the form of the LREF, based on the Carnegie curve mor-
was on the edge of a hilly elevation which added a topogra-         phology and assuming that this trend should be followed by
phy factor not quantified in this specific research due to the      the reference field as well. Consequently, the averaged 1 s
lack of typical flat ground measurements in the area. At An-        data to 1 min data (data logger configuration) are shifted to
tikythera, the mill installation location could be more care-       the frequency domain through a fast Fourier transform (FFT)
fully selected to avoid orography, obstacles and power grid         representation so as to evaluate the relative contributions of
lines. The instrument output range was set to the most sensi-       the first five principal harmonics to the diurnal cycle of the
tive scale (2.0 kV full scale) with a sensitivity of the order of   electric field (hourly variations including daily mean), which
1 V m−1 for 1 Hz measurement frequency, and the data were           are depicted in the following signal equation for S (t) (1). We
acquired from a 24 bit local data logger. In order to interpret     note that days with missing data are removed because the un-
the field mill measurements, it is essential to compare the         even temporal distribution of the measurements modifies the
data with a reference field representative of local fair-weather    time window for the FFT algorithm and, therefore, modifies
conditions. The methodology followed for this process is de-        the time series spectrum.
scribed in the paragraph below.
                                                                    S (t) = A0 + A1 cos (2π f1 + ϕ1 ) + A2 cos (2π f2 + ϕ2 )
2.2.2    Derivation of the localized reference electric field
                                                                         + A3 cos (2π f3 + ϕ3 ) + A4 cos (2π f4 + ϕ4 ) ,        (1)
The classification of the vertical electric field behaviour un-
der dust-influenced conditions, as that of an enhanced, re-            where S is the electric field at time t in h (UTC); Ai is
duced or reversed E field, necessitates comparison with the         i = 0, . . . 4, for which A0 represents the mean value (con-
local long-term fair-weather electric field. In order to rep-       stant, zeroth harmonic) and A1 to A4 (first to fourth har-
resent solely the diurnal GEC influence at each observa-            monic) represent the amplitudes of the 24, 12, 8 and 6 h
                                                                                              t
tional site, away from electric generators perturbing the near-     variations; and fi = i 24   360◦ is the frequency of each har-

Atmos. Chem. Phys., 21, 927–949, 2021                                                  https://doi.org/10.5194/acp-21-927-2021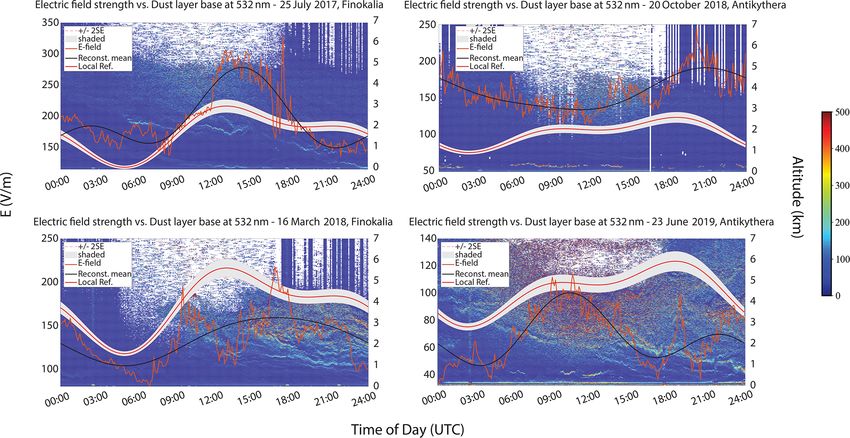
V. Daskalopoulou et al.: The electrical activity of Saharan dust                                                                  931

Figure 1. NOAA HYSPLIT backward-trajectory model with GDAS assimilated data input for (a) 25 July 2017 with 72 h backward prop-
agation of air masses towards Finokalia, (b) 20 October 2018 with 72 h backward propagation of air masses towards Antikythera, (c)
16 March 2018 with 48 h backward propagation of air masses towards Finokalia and (d) 23 June 2019 with 48 h backward propagation
of air masses towards Antikythera (https://www.ready.noaa.gov/HYSPLIT.php, 3 July 2020). Please note that some dates in the figure are
given in the format of month day.

monic, where f0 = 0 and ϕi are the respective phases in de-          curve are), we impose the Chauvenet criterion on the am-
grees, with ϕ0 = 0 (Harrison, 2013). Based on the form of            plitude of each of the filtered five harmonics so as to detect
the Carnegie curve and assuming that this trend should be            outliers. The criterion is imposed once with the use of the
followed by LREF, we find empirically that the ratio be-             relation below:
tween the zeroth harmonic and the first harmonic is around 2.
Therefore, the Ez values for which the amplitude A0 is larger
                                                                            dj

than 2 times the amplitude A1 are kept (filter no. 3). The same                         1
                                                                     N erfc √          < ,                                        (2)
filter is applied to the other harmonics as well (A0 is larger               2s         2
than 2 times Ai ), making sure that no fast transient contribu-
tion is kept.                                                        where
                                                                                 j
    Lastly, since the amplitude of each harmonic is expected            d j = Ai − Ai is the deviation for i = 0, . . . 4 referring to
to be constant for all days (as the amplitudes in the Carnegie       the ith harmonic, and j = 0, . . . N is the day number and N
                                                                     the total number of days, for

https://doi.org/10.5194/acp-21-927-2021                                                  Atmos. Chem. Phys., 21, 927–949, 2021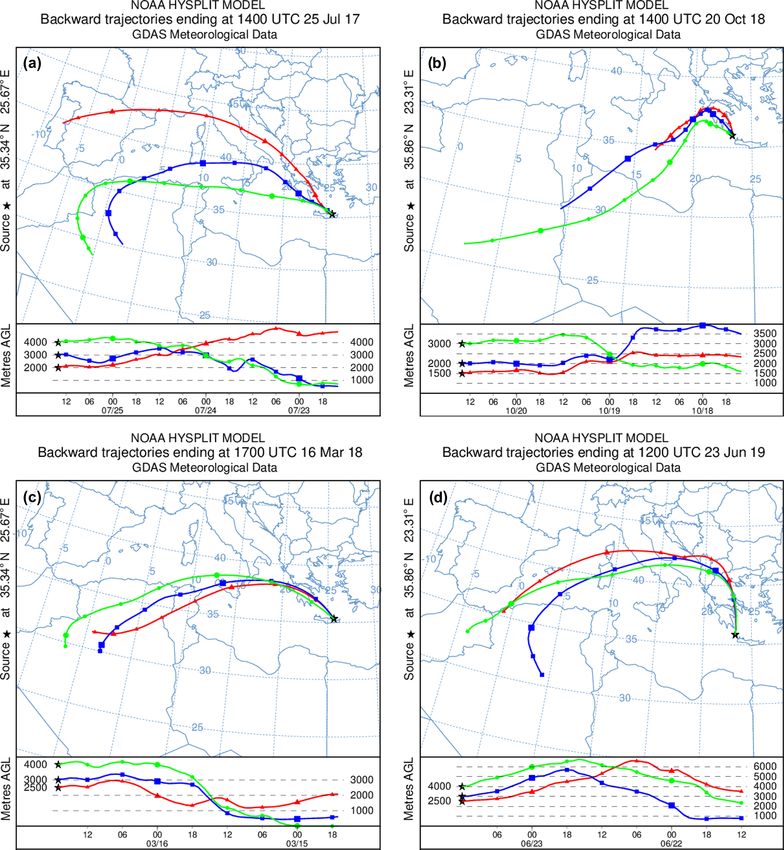
932                                                                   V. Daskalopoulou et al.: The electrical activity of Saharan dust

Figure 2. Signal-processing chain for (i) the derivation of the localized reference electric field (LREF) that represents local fair-weather (FW)
conditions, following the proposed filtering process (filters no. 1 to no. 4, yellow to orange) of the field mill electric field data as retrieved at
both Finokalia (Finok.) and Antikythera (Antik.) atmospheric stations and (ii) the derivation of the daily mean electric field under dust-driven
days from the same datasets (yellow to olive green). The LREF is compared to the mean electric field values in order to assess the electric
field behaviour. Ampl: amplitude; harm.: harmonic.

                     j
   Ai = N1 N
            P
               j =1 Ai , where Aij is the ith harmonic amplitude             retains the main characteristics of the local reference field,
per day and summated over j gives Ai as the mean amplitude                   since fast transient events, which are less than 6 h in duration,
of each harmonic.                                                            are removed. Therefore, the LREF and reconstructed mean
   Lastly, s is the unbiased sample variance and is defined as               field signals that are compared have the same spectral infor-
                                                                             mation. Moreover, to compare the E-field time series with the
                        2
        PN  j                                                               lidar retrievals, all the field mill data are further averaged to
         j =1 A i − A i
s2 =                                                                         5 min.
              N −1
                                                                             2.3    Mathematical formalism for the modelling of the
within erfc(x), which is the complementary error function,                          ground E field
defined as
                                      Zx                                     Ideally, under strict fair-weather conditions, a complete lack
                              2                −t 2                          of aerosol particles in the atmospheric circulation is ex-
erfc (x) = 1 − erf (x) = 1 − √             e          dt.
                               π                                             pected, since it guarantees that the only mechanism of at-
                                      0
                                                                             mospheric ion loss is the ion–ion recombination. As the con-
After the Chauvenet criterion is met, 152 total undisturbed                  centration of aerosols increases, additional loss can be due
weather days are detected for Finokalia, and 109 d are de-                   to ions attaching to the particles, which leads to a pertur-
tected for Antikythera. From this reduced dataset, we re-                    bation of the ion density from fair-weather values. In ac-
construct the LREF by keeping the mean values of the first                   tual conditions, aerosols always exist, but under fair-weather
three harmonics and calculate the respective standard errors                 conditions their concentrations are small enough to not sig-
as ±2SE from the reconstructed signal.                                       nificantly affect the ionic content of the atmosphere. There-
                                                                             fore, for the modelling purposes of fair-weather conditions,
2.2.3    E-field measurement comparison                                      aerosol concentrations can be neglected. In the steady state
                                                                             of such an atmosphere, the divergence of the total current
In order to compare LREF with the daily variation of the                     is zero ∇J tot = 0, as a direct consequence of the continuity
electric field during the dust events, these field mill measure-             equation and hence the conduction, current remains constant
ments are also shifted to the frequency domain through an                    with altitude. From Ohm’s law, we can relate the conduction
FFT. Again, the first five harmonics are retained, and from                  current Jz with the vertical component of the electric field Ez
this specific dataset, a smoothed slow varying field is recon-               (Fig. 3a) as
structed (otherwise referred to as the reconstructed mean for
the remainder of this paper) from the set of mean amplitudes
and phases of the first three harmonics. This filtered field                 Jz = σ Ez ,                                                         (3)

Atmos. Chem. Phys., 21, 927–949, 2021                                                              https://doi.org/10.5194/acp-21-927-2021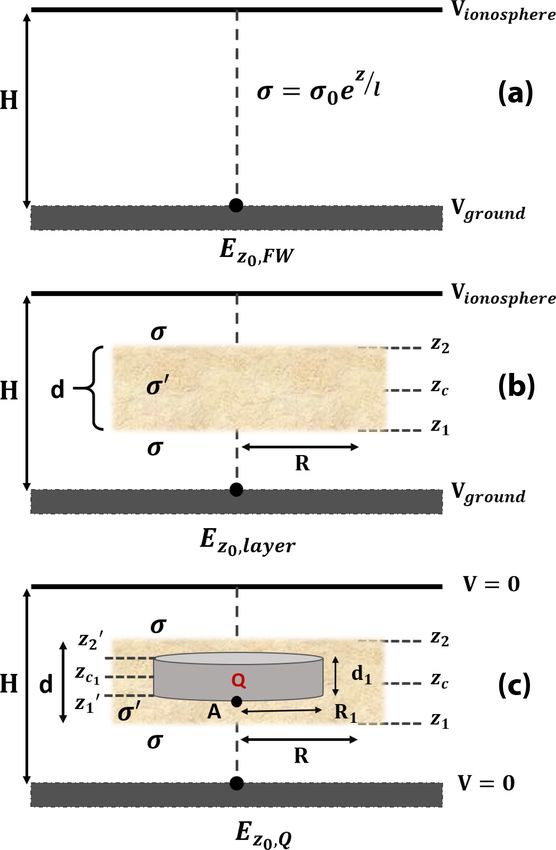
V. Daskalopoulou et al.: The electrical activity of Saharan dust                                                                       933

                                                                              We, then, express the conduction current at ground level,
                                                                           Jz0 , as a function of the columnar resistance Rc and the po-
                                                                           tential difference 1V = Vion − V0 (5), therefore yielding

                                                                                    1V   Vion
                                                                           Jz 0 =      =      ,                                         (5)
                                                                                    Rc   Rc
                                                                              where Vion is the ionospheric potential at the altitude H
                                                                           and V0 is the potential at Earth’s surface, which is considered
                                                                           a good conductor due to soil particles that are usually cov-
                                                                           ered by a thin, conducting film of water (Kanagy and Mann,
                                                                           1994); hence V0 is set equal to zero.
                                                                              The columnar resistance can be calculated from the con-
                                                                           ductivity profile of Eq. (4) (Rycroft et al., 2008), hence yield-
                                                                           ing

                                                                                    ZH
                                                                                         dz    l             H
                                                                           Rc =             =      1 − exp −      .                     (6)
                                                                                         σ    σ0             l
                                                                                    0

                                                                              By combining Eqs. (3), (5) and (6), the fair-weather elec-
                                                                           tric field at ground level, Ez0 , is of the form (Gringel et al.,
                                                                           1986)

                                                                                        Vion          Vion
Figure 3. Schematic of the formalism for the calculation of the            Ez0 =              =                 ,                     (7)
steady-state near-ground electric field bounded between the ground
                                                                                        σ0 Rc   l 1 − exp − Hl
potential (Vground ) and ionospheric potential (Vionosphere ) at height       which depends solely on the scale height l and the iono-
H under (a) fair-weather conditions (Ez0, FW ) where atmospheric           spheric potential Vion .
conductivity σ follows an exponential distribution along the alti-
                                                                              However, the presence of aerosols in the atmosphere and
tude z with respect to the scaling height l; (b) the presence of an
                                                                           consequently dust particles affects atmospheric conductivity
electrically neutral dust layer (Ez0, layer ) with depth d and radius R,
                                                                           (Harrison, 2003; Siingh et al., 2007; Tinsley and Zhou, 2006;
which modifies conductivity to σ 0 ; and (c) the hypothesis of a cylin-
drical charged monopole (Ez0, Q ) within the dust layer, with depth        Zhou and Tinsley, 2007). Aerosols tend to scavenge atmo-
d1 , radius R1 and total charge Q. The monopole case is a superpo-         spheric ions due to electrostatic interactions and ion thermal
sition of the electrically neutral dust layer with the charged cylinder    diffusion, leading to a reduction of the atmospheric ion den-
within the bounded atmospheric potential.                                  sity and consequently the atmospheric electrical conductiv-
                                                                           ity. The process of ion attachment to aerosols has been ex-
                                                                           haustively investigated in the past literature. A review paper
where σ is the atmospheric conductivity, and we can assume                 by Long and Yao (2010) contains a summary of all models
a smooth conductivity profile along the altitude z as                      and theories regarding the aerosol charging by ions. The case
                                                                           of a steady-state atmospheric desert dust layer that does not
             z                                                           exhibit charge stratification is examined below. The layer acts
σ = σ0 exp         ,                                                (4)    as a passive electrical element (resistor) and reduces the fair-
               l
                                                                           weather atmospheric conductivity due to the ion attachment
where σ0 and l are parameters that represent the near-ground               to dust particles, by a varying reduction factor n. Figure 3b
atmospheric conductivity and the atmospheric scale height,                 represents the above layer configuration, where the new con-
respectively. The given mathematical formalism of the atmo-                ductivity profile within the layer along the altitude z will be
spheric conductivity is adopted also by Ilin et al. (2020). The
authors demonstrated that such a profile adequately describes                    σ0     z
the main aspects of the real conductivity distribution and can             σ0 =     exp       .                                          (8)
                                                                                  n       l
be seen as a global mean conductivity profile.
                                                                              The electric field at ground due to the dust layer Ez0 , layer
                                                                           is given by

                                                                                              Vion
                                                                           Ez0 , layer =             ,                                  (9)
                                                                                             σ0 Rc 0

https://doi.org/10.5194/acp-21-927-2021                                                              Atmos. Chem. Phys., 21, 927–949, 2021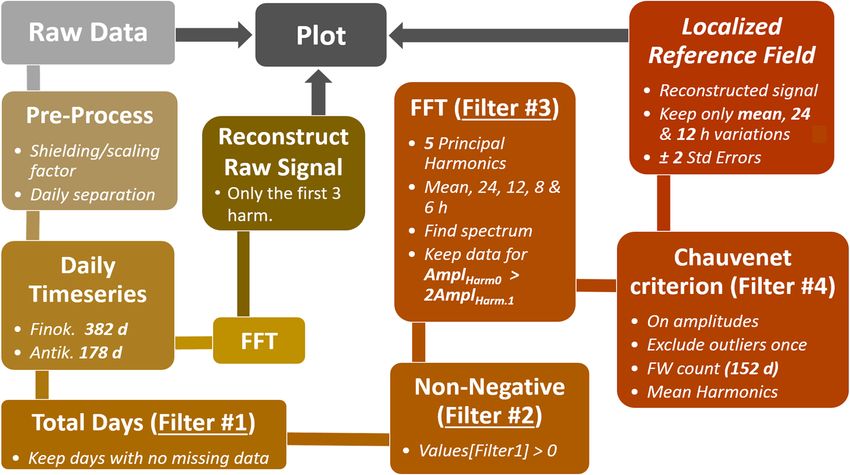
934 V. Daskalopoulou et al.: The electrical activity of Saharan dust
0
with the new columnar resistance Rc being a total charge density of ρ is given below. We calculate the
potential at point A (central lower point of the charged cylin-
der), as specified in Fig. 3c, which is given as the sum of the
Zz1 Zz1 ZH potential from the total charge Q and the potential from its
0 dz dz dz
Rc = + 0 + , z 6 = z1, 2 ⇒ image charge Qimg , where Qimg = −Q as
σ σ σ
0 z1 z1
0 l zc − d/2 d
Rc = 1 + (n − 1) exp − 1 − exp − VA = VQ + VQimg . (12)
σ0 l l
H
The solution for the potential at the central axis of a solid
− exp − , (10) charged cylinder with total charge density ρ1 is given by (e.g.
l
David J. Griffiths’ Instructor’s Solution Manual for Introduc-
where z1, 2 are the layer bottom and top heights, zc is the tion to Electrodynamics, 4th edition; Griffiths, 2013)
mean layer central height, and d = z2 − z1 is the mean layer
depth. The dust layer horizontal extent R (radius), as de-
VQ =
picted in Fig. 3b, is assumed to be at least 10 times larger q
than its vertical extent (R ≥ 10 d) for a thin-layer approxi- d + R 2 + d2
ρ1 1
q
1 1
mation. d1 R12 + d12 + R12 ln − d12 ,
And Eq. (9) gives through Eq. (10) 4ε0 R1
for R1 ≥ 10 d1
Ez0 , layer = (13)
Vion where ε0 is the permittivity of vacuum, R1 is the charge
h i . region horizontal extent presented by the cylinder radius,
− zc −d/2 1 − exp − dl − exp − Hl
l 1 + (n − 1) exp l
d1 = z2 0 − z1 0 is the cylinder depth (charge region vertical
(11) extent) and ρ1 is the total charge density. Correspondingly,
the potential at point A due to the image charge is calculated
Therefore, it is clear that Ez0 , layer depends on the scale
as
height parameter l, the reduction parameter n, the layer cen-
tral height zc and the layer depth d. A further investigation
of the E-field dependence on the various parameters listed VQimg =
above can be found in Appendix A. −ρ1
q
2
q
2
2zc1 R12 + 2zc1 − 2zc1 − d1 R12 + 2zc1 − d1
In a next step, we parameterize an electrically active dust 4ε0
layer to calculate its impact on the surface E field. Specif- q 2
2z + R 2 + 2z
ically, we construct a simplistic model for the atmospheric c1 1 c1
+ R12 ln
column (1D), based on the hypothesis that the charge accu- q 2 2
2zc1 − d1 + R1 + 2zc1 − d1
mulation areas within the dust layer can be approximated by
charged cylinders of a total charge density of ±ρ (Fig. 3c). d1
−2d1 2zc1 − (14)
For the cylinder, we assume that its horizontal extent, as 2
represented by the cylinder radius R1 in Fig. 3c, is at least
for zc1 as the charged area central height. The new colum-
10 times larger than the vertical extent (large-cloud approx-
nar resistance up to the height of point A will be
imation) to ensure that the field lines are vertical with only
0
weak radial dependence directly below the centre of the layer Zz1 Zz1
(e.g. Riousset et al., 2007). The electric field of such an ideal- dz dz
Rc1 = + ⇒
ized finite-extent charged layer is dependent on the distance σ σ0
0 z1
from the layer. Departures from this behaviour occur near
layer edges and distances comparable to the layer extent. Rc1 =
Moreover, the hypothesis of the presence of image charges
l zc − d/2 nl zc − d/2
is also applied due to the ground being a good conductor, en- 1 − exp − + exp −
σ0 l σ0 l
suring that the calculated electric potentials are solutions to
zc1 − d1 /2
the Poisson equation. − exp − , (15)
The formulation for such an electrically active layer con- l
sists of a superposition of the electrically neutral dust layer which is calculated from the ground to the dust layer bottom
case with the case of the monopole charged cylinder, con- height z1 and from there to the cylindrical charged area bot-
strained for zero ground and zero ionospheric potentials. The tom height z1 0 (Fig. 3c). Note that d is the layer depth, while
derivation of the ground electric field due to the presence of d1 is the cylinder depth.
Atmos. Chem. Phys., 21, 927–949, 2021 https://doi.org/10.5194/acp-21-927-2021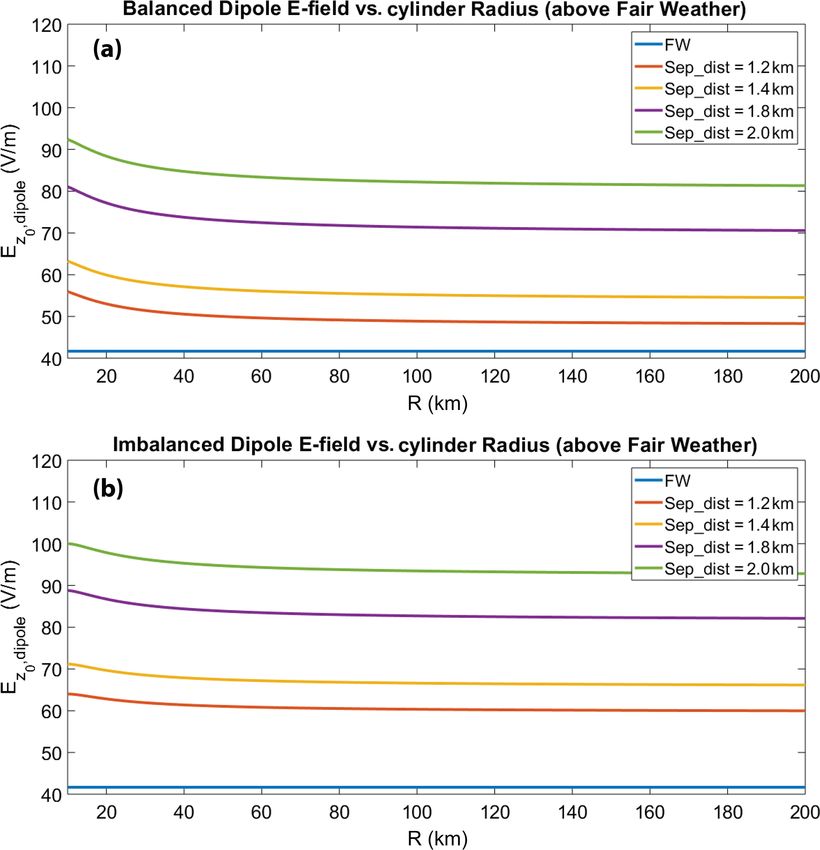
V. Daskalopoulou et al.: The electrical activity of Saharan dust                                                                       935

   And again, from Ohm’s law and Eq. (15), we get the elec-             Table 1. Dust layer central height and depth, as derived from the
tric field at ground level for the case of a charged cylindrical        PLDR profiles.
monopole as
                                                                                Dust Outbreak                   zci (km)    di (km)

Ez0 , Q =                                                                       25 July 2017 (Finokalia)                3          4
                                                                                20 October 2018 (Antikythera)           3          4
                             VA                                                 16 March 2018 (Finokalia)             3.5        2.5
 h                i     h                    z −d /2 i ,
           zc −d/2
                      + nl exp − zc −d/2
                                                   c
l 1 − exp − l                        l     − exp − 1 l 1                        23 June 2019 (Antikythera)            3.5          3
                                                                 (16)
   where VA is given from Eqs. (12) to (14), with Ez0 , Q be-           below the reference electric field values, and we investi-
ing dependent on the scale height l, the conductivity reduc-            gate whether electrified dust layers can reproduce such a be-
tion factor n, the central layer height zc and the charged area         haviour. Ez0 , layer dependency on the various atmospheric pa-
central height zc1 .                                                    rameters points to atmospheric conductivity as the dominant
   In the case of multiple stratified charged areas within the          factor that affects the E field (see Appendix A). Therefore,
layer, the electric field at ground level is a superposition of         we expect that if the dust layer is electrically neutral and acts
the contribution to the field from each charge and its im-              as a passive element by reducing the atmospheric conductiv-
age (Ez0 , Qi ), along with the non-stratified dust layer’s con-        ity, it will greatly affect the field by forcing it below the local
tribution attributed to the imposed conductivity reduction              reference values.
(Ez0 , layer ), hence yielding                                             Since there is little data on vertical profiling of the dust
                                                                        layer electrical properties, we use the previous measurements
                    X
Ez0 , multipole =       Ez0 , Qi + Ez0 , layer ⇒                        of electric field variation with altitude, which indicated a
                                                                        charge density of ρ = ± 25 pC m3 within a transported Saha-
Ez0 , dipole = Ez0 , lower cylinder + Ez0 , upper cylinder              ran dust layer away from the emission source (Nicoll et al.,
 + Ez0 , layer ,                                                 (17)   2011). From this value, the total charge Q is estimated for
                                                                        the different model cylinder extents. Gringel and Muhleisen
   where, subsequently, if we assume a dipole charge con-               (1978) measured a reduction of the electrical conductivity,
figuration within the dust layer, the total contribution to             compared to the fair-weather values, by a factor of 4 within
the ground E field (Ez0 , dipole ) will be a superposition of           an elevated dust layer, and we, therefore, adopt a reduction
the influence from the lower (Ez0 ,lower cylinder ) and upper           factor of n = 4 in the present study (see also Appendix A).
(Ez0 ,upper cylinder ) charged areas, along with the electrically       For Ez0 , Ez0 , layer and Ez0 , Q estimations, the scale height is
neutral dust layer’s contribution (Ez0 , layer ).                       fixed to a globally average value of l = 6 km (Kalinin et al.,
                                                                        2014; Stolzenburg and Marshall, 2008); the ionospheric po-
3     Model outputs                                                     tential is fixed at Vion = 250 kV; and the ionospheric height is
                                                                        at H = 70 km. The mean central height of the dust layer and
As a result of the mathematical formalism described in                  mean layer depth are both set equal to 3 km (zc = d = 3 km),
Sect. 2.3, we present the 1D model outputs and restrictions             since this height represents the average value for the four dust
under which the various behaviours of the near-ground E-                cases according to the lidar PLDR profiles (Table 1).
field strength can be exhibited in comparison to the calcu-
lated fair-weather E field. Following this formulation, the             3.1.1    Balanced or imbalanced dipole field below the
dust layer that exhibits charge separation is approximated                       fair-weather field
with a dipole of oppositely charged cylinders. The influence
of small charge imbalances, of less than 10 %, in the bipo-             We consider the case of two oppositely charged cylinders
lar case, which could quantitatively explain the enhancement            with similar geometries as in Fig. 3c, assuming they are
or reduction in the E field, is also investigated. If multiple          within a dust layer with a mean height of 3 km and a mean
charge accumulation regions are suspected within the dust               depth of 3 km. The lower cylinder central height zc1 starts at
layer (Zhang and Zhou, 2020), the problem can be still repre-           2.95 km and decreases; the upper cylinder central height zc2
sented by the model output through a superposition of several           starts also at 2.95 km for a zero separation distance (at this
cylindrical monopoles with different charge densities, polar-           limit, it represents electrically neutral dust that lacks inter-
ities and separation distances.                                         nal E-field generation due to the absence of charge separa-
                                                                        tion) and increases within the dust layer boundaries (varying
3.1    E field below the fair-weather field                             the separation distance), while each cylinder depth is fixed
                                                                        at 100 m, in order to be of finite vertical extent but quite
In this section, we describe the possible cases under which             thin. The separation distance between the two cylinders is
lofted dust layers can reduce the near-ground E-field strength          defined as the difference between their central heights, and

https://doi.org/10.5194/acp-21-927-2021                                                      Atmos. Chem. Phys., 21, 927–949, 2021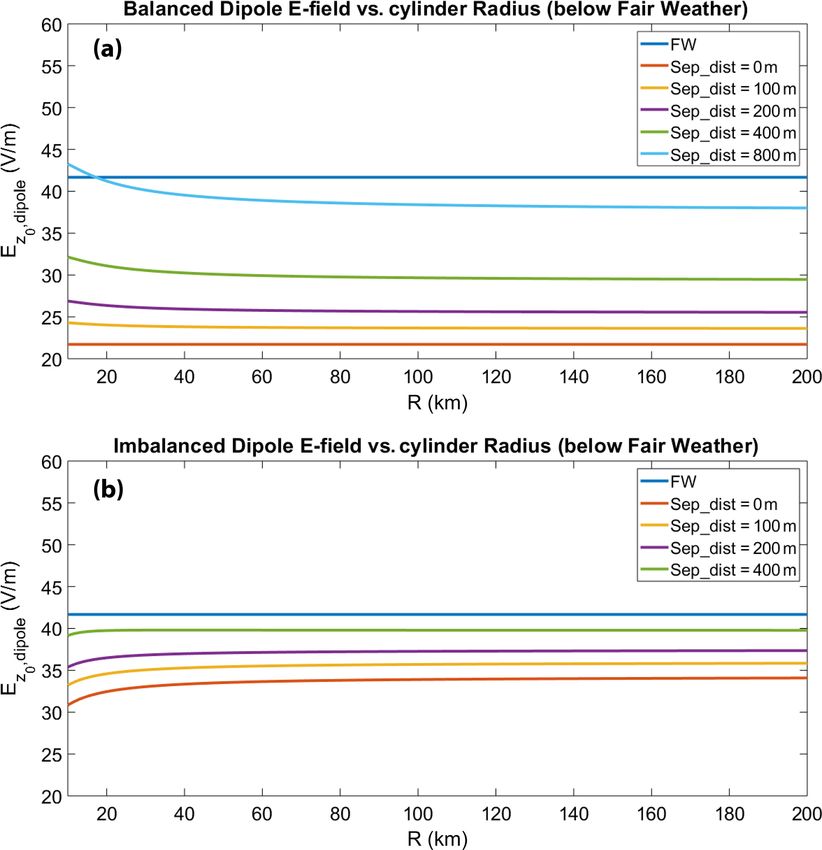
936                                                           V. Daskalopoulou et al.: The electrical activity of Saharan dust

the ground E field is a superposition of the electric field of
the upper and lower cylinders. We assume the bottom cylin-
der to be positively charged with density +ρ and the up-
per one to be negatively charged with −ρ (Fig. 4a), in or-
der to simulate gravitational settling conditions for larger
and, most probably, positively charged dust particles (For-
ward et al., 2009; Waitukaitis et al., 2014). From Eqs. (12)
to (17), the field is analytically calculated directly on the
axis of the charged cylinders and plotted against the cylin-
der radius R for separation distances up to 800 m. As seen
in Fig. 4, the resulting electric field values on ground level
are consistently below the fair-weather constant value. When
the dipole separation distance increases, the vertical elec-
tric field at ground level increases. This happens due to the
stronger influence of the lower charged cylindrical layer to
the surface resistance. The fact that the upper charged cylin-
der moves to higher altitudes signifies that the resistance be-
tween the specific layer and the ground increases; therefore
the conduction current at the ground decreases. The conduc-
tion current due to the upper charged layer, then, becomes
weaker than the conduction current due to the lower charged
layer, which moves towards the ground. Since the conductiv-
ity at the ground is undisturbed by the dust layer (Fig. 3c)       Figure 4. Vertical electric field strength at ground level (Ez0 ,dipole )
and equal to the fair-weather value, the ground electric field     below the fair-weather field (blue line), for a dipole of (a) finite
due to the upper layer decreases as the layer moves up, while      uniformly charged cylinders and (b) non-uniformly charged cylin-
                                                                   ders exhibiting a charge imbalance of 8 %, within an elevated dust
the field due to the lower layer increases as the layer ap-
                                                                   layer as a function of the cylinder radius R. Ez0 ,dipole is calculated
proaches the ground, leading to an increasing value of the         for separation distances (Sep_dist) of 0 (electrically neutral dust),
total electric field with the increasing separation distance.      100, 200, 400 and 800 m (balanced dipole case only) between the
When the separation distance is kept relatively small, the en-     charged layers.
hancement effect in the E field is not significant enough to
overcome the fair-weather values (Fig. 4). For large radii, al-
though the infinite-plate configuration is asymptotically ap-      upper cylinder not only decreases as it moves to higher alti-
proached (Ez0 , dipole −→ 0), there is a nearly constant resid-    tudes, but it is also reduced due to the reduction of the total
ual field for the finite cylindrical geometry of the charged       charge density which influences proportionally the electric
regions. Since the charged cylinders are placed in a conduct-      field. Note that even a small imbalance can highly increase
ing medium above a perfect conductor, the electric field at        the external field. Nevertheless, for relatively small separa-
the ground will not be zero even if the cylinders have infinite    tion distances the resulting field values fall again below the
extent. Due to the conductivity distribution, there is an un-      fair-weather value.
even contribution of the electric fields of each cylinder, and,
therefore, the E field is expected to converge to this non-zero    3.2     E field above the fair-weather field
value (Fig. 4).
   If the dipole charge density is not uniformly distributed       We examine the physical arrangement within the dust layer
to both cylinders, resulting in a charge imbalance within          that can provide an enhancement to the electric field above
the layer, the electric field will be more sensitive to sepa-      the fair-weather values and subsequently above the LREF.
ration distance changes (Fig. 4b). Such an imbalance could
be the result of (a) dust charging at the source prior to          3.2.1    Balanced or imbalanced dipole field above the
any charge separation that may occur (Ette, 1971; Kamra,                    fair-weather field
1972), (b) charging due to atmospheric current or (c) charge
loss through dry deposition in the planetary boundary layer        For the same charged region geometries as discussed previ-
(PBL). In Fig. 5, the ground electric field dependence on          ously, larger separation distances are imposed for the bal-
the separation distance and cylinder radius is depicted, for       anced dipole case (Fig. 5a), but we strictly remain within
a charge density difference of 1ρ = 2 pC m3 (8 %) between          the base dust layer mean dimensions. Figure 5 shows that as
the two charged cylindrical areas, with the upper one being        the separation distance between the oppositely charged lay-
less charged. This leads to a larger increase of the E field       ers increases, an enhancement of the E field above the local
than in the balanced dipole case (Fig. 4a), as the effect of the   reference values occurs. This enhancement becomes more

Atmos. Chem. Phys., 21, 927–949, 2021                                                    https://doi.org/10.5194/acp-21-927-2021
V. Daskalopoulou et al.: The electrical activity of Saharan dust 937
ined are separated into two classes, the ones that effectuate an
enhancement to the ground electric field and those inducing
a reduction with respect to the local reference field. Through
these observations, we attempt to provide evidence of elec-
trically active dust only by ground-based methods, supported
by the model configuration described in the previous sec-
tions.
4.1 Layer characterization through PollyXT
The July 2017 and March 2018 dust events at Finokalia are
characterized by large concentrations of airborne dust parti-
cles from the middle of the day onwards, followed by dust
settling towards the ground after 21:00 UTC, as indicated by
the time–height plots of the total attenuated backscatter co-
efficient (Figs. 6 and 8). Larger particle concentrations are
shown in red tones, with the β and δp (black lines) pro-
files superimposed to the respective attenuated backscatter
coefficient (top panel) and δv (lower panel) quick looks. For
the first case study (Fig. 6), beta values are between 3 to 4
(Mm−1 sr−1 ) with a maximum value of 5 (Mm−1 sr−1 ) in-
side the layer and denote large particle concentrations. High
Figure 5. Vertical electric field strength at ground level (Ez0 ,dipole ) δv values (>10 %) are indicative of dust particles, and δp val-
above the fair-weather field (blue line), for a dipole of (a) finite uni- ues between ∼ 25 %–30 % in the afternoon are characteristic
formly charged cylinders and (b) non-uniformly charged cylinders of pure dust. The settling of dust particles below 2 km, in-
exhibiting a charge imbalance of 8 %, within an elevated dust layer
side the marine boundary layer (MABL), is revealed from
as a function of the cylinder radius R. Ez0 ,dipole is calculated for
the time–height evolution of the VLDR (see Fig. 6). For the
separation distances (Sep_dist) of 1.2, 1.4, 1.8 and 2 km between
the two charged layers. March 2018 case study (Fig. 8), the elevated layer (small
dust concentration was present near the surface) reached Fi-
nokalia around noon. The layer was directly transported from
prominent as the layers grow further apart within the dust the Sahara and reached the station in less than 48 h, as indi-
plume and the contribution from the lower layer is signif- cated by the backward-trajectory analysis (Fig. 1c). Exami-
icantly larger than the upper layer. The above dependence nation of the β profile in Fig. 8 shows values that reach up
of the ground E field on the separation distance is not ex- to 15 Mm−1 sr−1 at the top of the layer, indicating higher
pected in the case of charged infinite plates, as discussed in aerosol concentrations in this case. δv values close to 30 %
Sect. 3.1.1. Again, for a charge imbalance of 8 % between the are indicative of high dust particle concentration, and δp val-
two cylinders and for larger separation distances, the E field ues persistently of 30 % are characteristic of pure dust within
is significantly enhanced and exceeds the local fair-weather the entirety of the layer (1 to 4 km), with dust downward mix-
values (Fig. 5b). The term large or small separation distance ing inside the MABL being less prominent.
depends on the conductivity distribution and more specif- The 20 October 2018 Antikythera layer (Fig. 7) exhibits
ically on the conductivity scale height, as can be seen in lower dust particle concentrations (β values lower than
Eqs. (11) and (16). This increase becomes more prominent 5 Mm−1 sr−1 ) close to the ground up to 6 km in altitude,
as the separation distance increases and the lower positive mostly mixed with marine aerosols below 2 km (Figs. 1b
cylinder moves closer to the sensor location. and 7). High δv values (>20 %) are indicative of dust par-
ticle presence, and δp values between 25 % and 30 % in the
afternoon are characteristic of pure dust. It is also observed
4 Experimental results that the near-ground dust concentration is very low, with the
thin layer at 500 m being a mixture of dust particles and par-
The near-ground electric field measurements with co-located ticles of marine origin with the VLDR around 15 %. The
lidar observations are presented for the four case stud- 23 June 2019 dust outbreak consists primarily of highly el-
ies of elevated Saharan dust layers, over the two atmo- evated dust concentrations, since δv values are greater than
spheric remote sensing stations. The transient dust events 15 % (Fig. 9), after midday, with δp values reaching up to
recorded by PollyXT were, simultaneously, electrically moni- 30 % in the height range of 3 to 5 km, which are repre-
tored throughout the day with the field mill. According to the sentative of pure dust (Fig. 9). The dust plume was trans-
effect over the E-field time series, the dust outbreaks exam- ported again directly from Sahara to Antikythera within 48 h
https://doi.org/10.5194/acp-21-927-2021 Atmos. Chem. Phys., 21, 927–949, 2021938 V. Daskalopoulou et al.: The electrical activity of Saharan dust
Figure 6. (a) Time series of the vertical electric field strength (orange), the extracted localized reference (ref.) electric field (red) and the
reconstructed (reconstr.) mean electric field variation (black) from the field mill dataset, for the recorded 25 July 2017 dust layer at Finokalia.
The E-field data are plotted with the time–height evolution of the attenuated backscatter coefficient (Mm−1 sr−1 ) and the particle backscatter
coefficient (β) profile (Mm−1 sr−1 , black vertical line) at 532 nm from the PollyXT lidar, which was co-located with the field mill. Areas of
increased particle concentration are denoted with reddish tones, while the β values are derived by averaging between 18:00 and 21:00 UTC.
(b) Volume linear depolarization ratio (δv , %) at 532 nm for the same dust layer as obtained from the PollyXT lidar and the particle linear
depolarization ratio (δp , %) profile (black vertical line), again averaged between 18:00 and 21:00 UTC. Large δv values are depicted with
reddish tones.
(Fig. 1d), and very low concentrations of dust particles are tion’s coastal location. Complementarily, Ez diurnal varia-
also present within the MABL. tion in the station of Antikythera exhibits a minimum in the
early-morning hours at ∼ 23:00 UTC and a single maximum
4.2 Local mean E-field behaviour during the evening at ∼ 19:00 UTC (Figs. 7 and 9), with a
mean value of ∼ 102 V m−1 . Since the time series at An-
Considering the electrical properties of the layers detected at tikythera are restricted to 1 year, the mean E-field value is
Finokalia (Figs. 6 and 8), the LREF and the reconstructed statistically biased; therefore it is lower than the expected
mean electric field are depicted, with the local diurnal varia- fair-weather value.
tion resembling the Carnegie curve. The Ez values vary be-
tween a total minimum at ∼ 05:00 UTC and the maximum 4.3 Observed E-field enhancement as compared to
at ∼ 13:00 UTC with a mean value of ∼ 173 V m−1 . An in- LREF
crease of the electric field is observed at about 22:00 UTC,
resulting in a double peak variations curve (Yaniv et al., In Figs. 6 and 7, we present the dust events that induced an
2016). The reconstructed mean E field is close to the ex- enhanced electrical behaviour near the ground. The E-field
pected fair-weather value, and the slight difference can be at- strength measurements are averaged over 5 min in order to be
tributed to local meteorological factors, atmospheric bound- comparable with the lidar data. In the 25 July layer (Fig. 6),
ary layer characteristics (Anisimov et al., 2017) and the sta- dust advection is recorded, since the first morning hours and
Atmos. Chem. Phys., 21, 927–949, 2021 https://doi.org/10.5194/acp-21-927-2021V. Daskalopoulou et al.: The electrical activity of Saharan dust 939
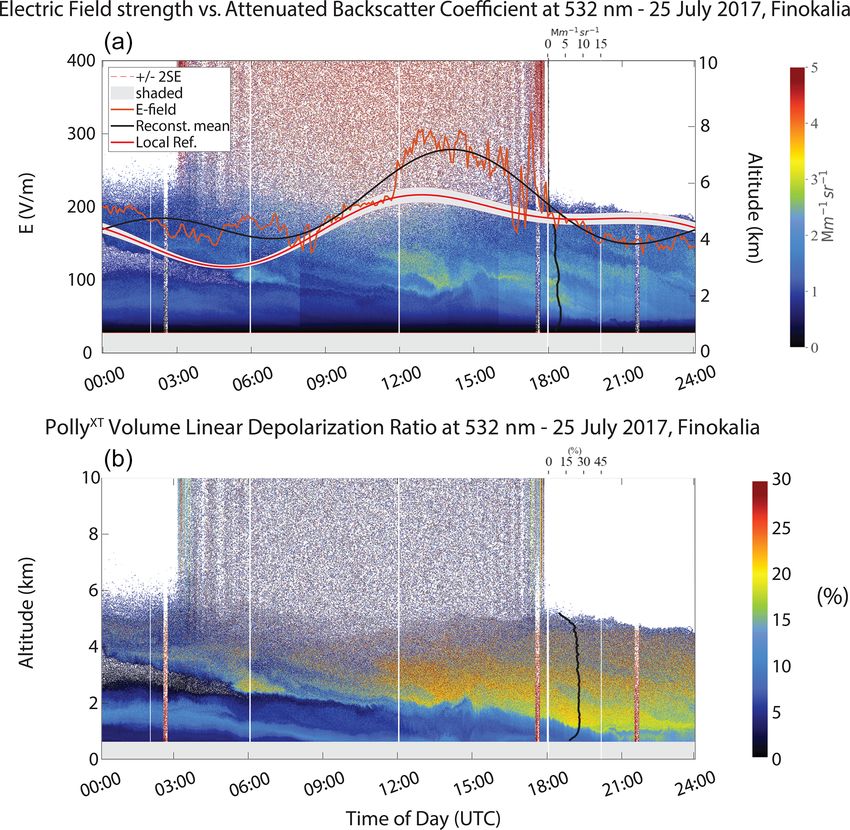
Figure 7. (a) Time series of the vertical electric field strength (orange), the extracted localized reference (ref.) electric field (red) and the
reconstructed (reconstr.) mean electric field variation (black) from the field mill dataset, for the recorded 20 October 2018 dust layer at
Antikythera. The E-field data are plotted with the time–height evolution of the attenuated backscatter coefficient (Mm−1 sr−1 ) and the
particle backscatter coefficient (β) profile (Mm−1 sr−1 , black vertical line) at 532 nm from the PollyXT lidar, which was co-located with the
field mill. Areas of increased particle concentration are denoted with red tones, while the β values are derived by averaging between 18:00
and 21:00 UTC. (b) Volume linear depolarization ratio (δv , %) at 532 nm for the same dust layer as obtained from the PollyXT lidar and the
particle linear depolarization ratio (δp , %) profile (black vertical line), again averaged between 18:00 and 21:00 UTC. Large δv values are
depicted with red tones.
areas of increased particle concentration can be spotted from expected only when the lofted dust layer is electrically active
early noon. The δp profile signifies that the layer consists pri- and charge separation within the layer is prominent. From
marily of dust which descends after ∼ 16:00 UTC and falls Fig. 5b, it becomes apparent that the external E field is more
entirely below 2 km at ∼ 18:30 UTC, but the mean electric sensitive to charge imbalances, even small ones, than to sep-
field (black line) remains above the reference field (red con- aration distance variations; hence a charge imbalance within
toured line), showing an increase when particle density is these layers could drive the E field above the fair-weather val-
maximized towards noon and a small drop when dust con- ues, as observed in the above cases, for even smaller charge
centrations within the MABL becomes significant. separation distances.
A similar electrical behaviour was observed during the
dust event of October 2018 that reached the PANGEA obser- 4.4 Observed E-field reduction as compared to LREF
vatory. Large lofted particle concentrations are attributed to
dust as discussed previously (Fig. 7). The mean Ez appears Several dust load cases were detected, both at Finokalia and
enhanced as compared to the LREF, showing a further in- Antikythera, where the near-ground electric field strength
crease at ∼ 21:00 UTC when dust deposition becomes promi- exhibits a decrease when compared to the local reference
nent. According to the physical approximation of cylindrical field and, particularly, when high dust particle concentrations
charged areas (see Sect. 3.2), such an enhancement would be were present. In this specific study, we select the cases of
March 2018 and June 2019 in terms of the similar tempo-
https://doi.org/10.5194/acp-21-927-2021 Atmos. Chem. Phys., 21, 927–949, 2021940 V. Daskalopoulou et al.: The electrical activity of Saharan dust Figure 8. (a) Time series of the vertical electric field strength (orange), the extracted localized reference (ref.) electric field (red) and the reconstructed (reconstr.) mean electric field variation (black) from the field mill dataset, for the recorded 16 March 2018 dust layer at Finokalia. The E-field data are plotted with the time–height evolution of the attenuated backscatter coefficient (Mm−1 sr−1 ) and the particle backscatter coefficient (β) profile (Mm−1 sr−1 , black vertical line) at 532 nm from the PollyXT lidar, which was co-located with the field mill. Areas of increased particle concentration are denoted with red tones, while the β values are derived by averaging between 18:00 and 21:00 UTC. (b) Volume linear depolarization ratio (δv , %) at 532 nm for the same dust layer as obtained from the PollyXT lidar and the particle linear depolarization ratio (δp , %) profile (black vertical line), again averaged between 18:00 and 21:00 UTC. Large δv values are depicted with red tones. ral injection of dust particles, large AOD values and similar later drops further below the LREF as the layer progresses layer progression throughout the day (Figs. 8 and 9). From to lower altitudes. Following the 1D model outputs for such the δp profiles, we deduce that for both cases, the elevated a case (see Sect. 3.1.1), this observed reduction could be at- layer between 2 and 4 km consists primarily of dust particles, tributed to either electrically neutral dust aloft or to electri- while the decrease of δp towards the bottom of the layer is cally active dust with the charged regions in relatively small indicative of downward mixing inside the MABL, with ma- separation distances within the layer. Under the electrically rine particles of lower δp s. The mean E field remains positive active dust case, a charge imbalance of less than 10 % can and well below the reference field, exhibiting an increase as be adequate to interpret the observed reduction of the E field dust injection initiates at ∼ 09:00 UTC along with a decrease below the LREF for even smaller separation distances. But along the plume’s progression (Fig. 8). The dust plume of the detection of such an E-field reduction below the LREF June 2019 instills a similar electrical behaviour to the ground cannot conclusively characterize the electrical activity of the E field, as the bottom of the layer seems to progressively dust layer aloft. move towards lower altitudes during late afternoon, and the total dust load remains persistent. The mean E field is pos- 4.5 Reversed E-field polarity itive and consistently below the reference field, exhibiting an increase close to fair-weather values when particle injec- If a reversed-polarity E field is observed (in our time series tion begins towards noon and dust concentration is rising but there were dust cases under which the field exhibited polar- Atmos. Chem. Phys., 21, 927–949, 2021 https://doi.org/10.5194/acp-21-927-2021
You can also read