Variability in the mass absorption cross section of black carbon (BC) aerosols is driven by BC internal mixing state at a central European ...
←
→
Page content transcription
If your browser does not render page correctly, please read the page content below
Atmos. Chem. Phys., 21, 635–655, 2021
https://doi.org/10.5194/acp-21-635-2021
© Author(s) 2021. This work is distributed under
the Creative Commons Attribution 4.0 License.

Variability in the mass absorption cross section of black carbon
(BC) aerosols is driven by BC internal mixing state at a central
European background site (Melpitz, Germany) in winter
Jinfeng Yuan1 , Robin Lewis Modini1 , Marco Zanatta2 , Andreas B. Herber2 , Thomas Müller3 , Birgit Wehner3 ,
Laurent Poulain3 , Thomas Tuch3 , Urs Baltensperger1 , and Martin Gysel-Beer1
1 Laboratoryof Atmospheric Chemistry, Paul Scherrer Institute, Forschungsstrasse 111, 5232 Villigen PSI, Switzerland
2 HelmholtzCenter for Polar and Marine Research, Alfred-Wegener-Institute,
Am Handelshafen 12, 27570 Bremerhaven, Germany
3 Experimental Aerosol and Cloud Microphysics Department, Leibniz Institute for Tropospheric Research, Permoserstraße 15,

04318 Leipzig, Germany

Correspondence: Robin Lewis Modini (robin.modini@psi.ch)

Received: 16 January 2020 – Discussion started: 31 January 2020
Revised: 11 September 2020 – Accepted: 22 November 2020 – Published: 18 January 2021

Abstract. Properties of atmospheric black carbon (BC) par-         ics) and BC core size distribution, had only minor effects.
ticles were characterized during a field experiment at a ru-       These results for ambient BC measured at Melpitz during
ral background site (Melpitz, Germany) in February 2017.           winter show that the lensing effect caused by coatings on BC
BC absorption at a wavelength of 870 nm was measured by            is the main driver of the variations in MACBC and EMAC ,
a photoacoustic extinctiometer, and BC physical properties         while changes in other BC particle properties such as source,
(BC mass concentration, core size distribution and coating         BC core size or coating composition play only minor roles at
thickness) were measured by a single-particle soot photome-        this rural background site with a large fraction of aged parti-
ter (SP2). Additionally, a catalytic stripper was used to in-      cles. Indirect evidence suggests that potential dampening of
termittently remove BC coatings by alternating between am-         the lensing effect due to unfavorable morphology was most
bient and thermo-denuded conditions. From these data the           likely small or even negligible.
mass absorption cross section of BC (MACBC ) and its en-
hancement factor (EMAC ) were inferred for essentially water-
free aerosol as present after drying to low relative humid-
ity (RH). Two methods were applied independently to in-            1   Introduction
vestigate the coating effect on EMAC : a correlation method
(MACBC, ambient vs. BC coating thickness) and a denud-             Black carbon (BC), which commonly refers to graphitic el-
ing method (MACBC, ambient vs. MACBC, denuded ). Observed          emental carbon (Petzold et al., 2013), is a major component
EMAC values varied from 1.0 to 1.6 (lower limit from de-           of atmospheric aerosols. BC-containing particles are emit-
nuding method) or ∼ 1.2 to 1.9 (higher limit from correla-         ted from incomplete combustion processes. BC is highly
tion method), with the mean coating volume fraction ranging        refractory, insoluble and a strong light absorber across the
from 54 % to 78 % in the dominating mass equivalent BC             whole solar spectrum (Corbin et al., 2019). The latter makes
core diameter range of 200–220 nm. MACBC and EMAC were             BC the dominant light-absorbing component of atmospheric
strongly correlated with coating thickness of BC. By con-          aerosols and causes a substantial positive radiative forcing
trast, other potential drivers of EMAC variability, such as dif-   through aerosol–radiation interactions (Bond et al., 2013).
ferent BC sources (air mass origin and absorption Ångström         Two parameters are required to quantify the light absorp-
exponent), coating composition (ratio of inorganics to organ-      tion coefficient of BC (bap, BC ; [Mm−1 ]) in climate models:
                                                                   the mass absorption cross section of black carbon (MACBC ;

Published by Copernicus Publications on behalf of the European Geosciences Union.
636                          J. Yuan et al.: Variability in the mass absorption cross section of black carbon (BC) aerosols

[m2 g−1 ]) and the BC mass concentration (mBC ; [µg m−3 ]),        numerical simulations of light absorption by BC particles of
as shown in Eq. (1),                                               variable morphology indicate that the fractal dimension, the
                                                                   location inside the particle and the refractive index of BC ag-
bap, BC = MACBC × mBC .                                     (1)    gregates also influence EMAC . Considering these factors typ-
                                                                   ically results in smaller EMAC than would be expected with
BC mass concentrations are simulated with chemical trans-          simpler core–shell morphologies (Adachi et al., 2010; Zhang
port models, taking BC emission inventories as input.              et al., 2017).
MACBC values must be assumed or calculated from simpli-               As well as being theoretically predicted, the lensing effect
fied optical models based on knowledge gained from labora-         has also been observed in laboratory experiments. For ex-
tory and field measurements.                                       ample, Shiraiwa et al. (2010) coated colloidal graphite par-
   The term “aerosol mixing state” refers to the distribution      ticles (compact, near-spherical shape) with volatile organic
of different particulate species among particles, where an in-     species (oleic acid and glycerol, boiling points are 290 and
ternally mixed particle contains multiple species and an ex-       360 ◦ C, respectively) and measured the BC core size dis-
ternally mixed particle only contains a single species. For ex-    tribution, coating thickness, and light absorption properties
ample, when BC is freshly emitted, it is often separated from      of both untreated and thermo-denuded samples (at 400 ◦ C).
other species, which refers to the externally mixed state. Dur-    They observed that EMAC at 532 nm increased from 1.3 to
ing the atmospheric aging of BC, non-BC particles coagulate        2 as the coating volume fraction was increased from 42 %
(e.g., particulate sulfate, nitrate, organics) with (and gaseous   to 88 %. In contrast, Qiu et al. (2012) observed a negligi-
species condense onto) BC particles to form a variety of in-       ble lensing effect when they coated 150 nm combustion soot
ternal mixing states.                                              particles with secondary organic aerosol formed by the OH-
   The mixing state of BC with other particulate matter in         initiated oxidation of toluene in an environmental chamber.
the same particle – the internal mixing state – is relevant be-    The observed EMAC values at 532 nm only reached 1.1 for
cause it influences the light absorption by the BC in this par-    volume equivalent coating fractions from 54 % to 70 %. It
ticle. Based on a simple configuration of concentric spheres       should be noted that the results of Qiu et al. (2012) are out-
core–shell morphology, Mie theory provides a solution to           liers among the more numerous laboratory studies showing
predict light absorption by coated BC particles (Bohren and        notable absorption enhancements.
Huffman, 1998). According to this theory, if a BC particle            The BC lensing effect and its relationship to internal mix-
is coated with non-absorbing species, more light is focused        ing state have also been investigated with field measurements
towards the BC core, enhancing the amount of light it ab-          of atmospheric aerosols. Some studies have used a soot par-
sorbs and thereby increasing its MACBC value (Eq. 1). This         ticle aerosol mass spectrometer (SP-AMS, Aerodyne Inc.) to
is known as the “lensing effect” (van de Hulst, 1957). The         measure relative coating masses as an indicator for BC in-
MACBC enhancement factor, EMAC , due to lensing is con-            ternal mixing state. The SP-AMS is a modified form of the
ceptually defined as the MAC value of the mixed particle,          aerosol mass spectrometer (AMS) performed by coupling a
MACBC, mixed , divided by the MAC value of the bare BC             1064 nm laser source to an AMS instrument, making it pos-
core:                                                              sible to measure both BC and non-refractory aerosol com-
          MACBC, mixed                                             ponents. Using this instrument one can measure the chemi-
EMAC =                 .                                    (2)    cal composition of BC-containing particles (specifically, the
          MACBC, bare
                                                                   average ratio of non-BC to BC core mass, referred to as
The lensing effect cannot result in unlimited enhancement          Rcoat-BC ). However, the detection efficiency of BC cores in
of light absorption. Instead, a saturation point occurs, above     an SP-AMS is sensitive to BC mixing state, since coatings
which EMAC does not increase any further with continued            affect the focusing of BC-containing particles within the in-
increase in coating thickness. The maximal MAC enhance-            strument, and consequently the degree of overlap between
ment factor that can be reached for a BC core depends on           the instrument’s laser and particle beams (Willis et al., 2014;
particle morphology and size, with greater values for smaller      Taylor et al., 2015). This complicates the quantification of
cores. Mie theory (Bohren and Huffman, 1998) predicts that         absolute BC core and coating mass concentrations with the
the lensing effect saturates at an enhancement factor of 2–3       SP-AMS, particularly in ambient campaigns where a wide
for concentric coatings around BC cores with mass equiva-          variety of BC mixing states might be encountered (e.g., Col-
lent diameters in the range between 100 and 300 nm, which is       lier et al., 2018).
the diameter range where ambient BC mass size distributions           Other field studies have employed traditional single-
typically peak (Bond et al., 2006). Therefore, EMAC factors        particle soot photometer (SP2) instruments to measure ab-
of up to ∼ 3 are plausible for ambient BC particles (Bond et       solute BC coating thicknesses. Unlike the SP-AMS, the de-
al., 2006; Zhang et al., 2017).                                    tection efficiency of BC particles in the SP2 does not depend
   Particle morphology, i.e., the shape of the particle and the    on particle mixing state. Therefore, SP2 measurements are
core, as well as the position of the BC core within a parti-       more quantitative than SP-AMS measurements in terms of
cle, also affect absorption enhancement. More sophisticated        both refractory BC (rBC) mass and BC core diameter. In ad-

Atmos. Chem. Phys., 21, 635–655, 2021                                                 https://doi.org/10.5194/acp-21-635-2021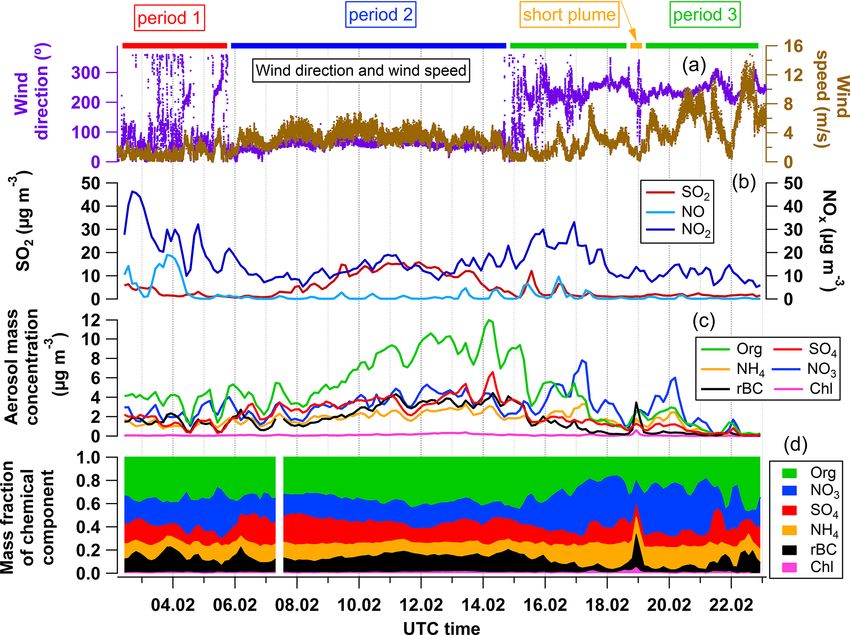
J. Yuan et al.: Variability in the mass absorption cross section of black carbon (BC) aerosols                                 637

dition, incandescence measurements are combined with opti-
cal measurements of particle size in the SP2, allowing quan-                   bap, BC
titative measurement of the BC coating thickness under the         MACBC =             .                                       (3)
                                                                                mBC
assumptions of a core–shell morphology for BC-containing
particles, as well as certain material properties (Gao et al.,     Two independent approaches were chosen in this study to
2007; Laborde et al., 2012a). The derived coating thickness        quantify the lensing effect on the MACBC of atmospheric
values are sensitive to these assumptions, as discussed in de-     BC-containing particles. The first approach, hereafter re-
tail below in Sect. 4.2.1 and by Taylor et al. (2015), which       ferred to as the correlation method, is based on a corre-
necessitates the exercise of considerable care when using the      lation analysis of concurrent quantitative measurements of
SP2 to perform quantitative coating thickness measurements.        both MACBC and BC particle mixing state. The mixing state
   Cappa et al. (2019) summarized the most recent ambient          is inferred as the coating thickness resulting from the dif-
observations of BC mixing state and the lensing effect. In         ference of measured diameters between the entire particle
some studies (Liu et al., 2015b; Peng et al., 2016) a strong       and the BC core based on an assumed core–shell configu-
lensing effect was observed, with EMAC reaching above 2            ration. The relationships between this specific metric of BC
for mean ratios of coating to core mass (Rcoat-BC ) values         mixing state and more general measures of aerosol mixing
up to 6. However, in other studies, only a weak or negligi-        state (e.g., the mixing state index χ ) are discussed in the re-
ble lensing effect was observed (EMAC < 1.2 for Rcoat-BC in        view of Riemer et al. (2019). The second approach, here-
the range 0.6 to 20) (Healy et al., 2015; Cappa et al., 2019).     after referred to as the denuding method, is based on mod-
Cappa et al. (2019) formulated two hypotheses to explain the       ifying the mixing state of atmospheric BC-containing parti-
large difference in EMAC values observed in these two differ-      cles, i.e., to remove the coatings present on atmospheric BC
ent groups of studies: (1) the diversity of coating mass frac-     using a catalytic stripper. Measurements of the MACBC in
tion among individual particles (e.g., Fierce et al., 2016) and    both the untreated ambient aerosols and the corresponding
(2) different mixing morphologies (e.g., off-center behavior       denuded aerosols make it possible to establish the causal re-
of BC within a particle caused reduced EMAC , Adachi et al.,       lationship between the lensing effect and BC mixing state.
2010). Furthermore, the composition of the coating material        For this purpose, the EMAC is calculated with Eq. (4) un-
may, via composition dependence of mixed particle morphol-         der the assumption that the MACBC of the denuded aerosol
ogy (Moffet et al., 2016), also affect the resulting lensing ef-   represents the properties of bare BC (i.e., by assuming that
fect (e.g., Zhang et al., 2018; Wei et al., 2013). However, the    MACBC, denuded = MACBC, bare ).
relative importance and interplay of these effects in atmo-
spheric aerosols remain poorly understood.                                   MACBC, ambient
                                                                   EMAC =                                                      (4)
   Zanatta et al. (2016) reported MACBC values inferred from                 MACBC, denuded
long-term observations at various European sites of the Euro-      The two approaches described above were applied during a
pean Research Infrastructure for the observation of aerosol,       field experiment, which is described in detail in the follow-
clouds and trace gases (ACTRIS), additionally providing in-        ing.
direct evidence that the lensing effect occurs. In this study,
we performed an intensive field experiment at one of these         2.2   The Melpitz site
sites – the Melpitz observatory in Germany – with the goal
to directly quantify the main drivers behind variations of         The intensive field campaign was conducted at the research
MACBC , with a particular focus on mixing state and lensing        site of the Leibniz Institute for Tropospheric Research (TRO-
effect.                                                            POS) in Melpitz (51◦ 32’N, 12◦ 56’E, 86 m a.s.l.). The Mel-
                                                                   pitz site is a rural and regional background site, belonging
                                                                   to many international (GAW, ACTRIS and EMEP) and do-
2     Method                                                       mestic (GUAN) observational networks (Birmili et al., 2016;
                                                                   Poulain et al., 2014; Spindler et al., 2010; Spindler et al.,
2.1    Methods to quantify the lensing effect
                                                                   2013). The station is located near the town of Torgau with
To explore the light absorption and the coating-induced en-        20 000 inhabitants in eastern Germany and 50 km northeast
hancement by the same BC mass, the mass absorption cross           from the city of Leipzig, with 600 000 inhabitants. The obser-
section of BC (MACBC ) is a key parameter to start with.           vational containers are situated on the flat and semi-natural
Inverse to the modeling calculation shown in Eq. (1) in            meadow surround by agricultural land. A federal main road
Sect. 1, the MACBC ([m2 g−1 ]) is defined in Eq. (3). To in-       (B 87) is 1.5 km north from the station and two conservative
fer MACBC , the BC absorption coefficient (bap, BC ; [Mm−1 ])      forests are located 2.5 and 1 km in the north and south direc-
at 870 nm and the BC mass concentration (mBC ; [µg m−3 ])          tion, respectively. The Melpitz site is about 130 km from the
need to be measured.                                               Polish border and anthropogenic emissions between Melpitz
                                                                   and Poland are negligible (Spindler et al., 2013). The mea-
                                                                   surements here are regarded as representative of the lowland

https://doi.org/10.5194/acp-21-635-2021                                                Atmos. Chem. Phys., 21, 635–655, 2021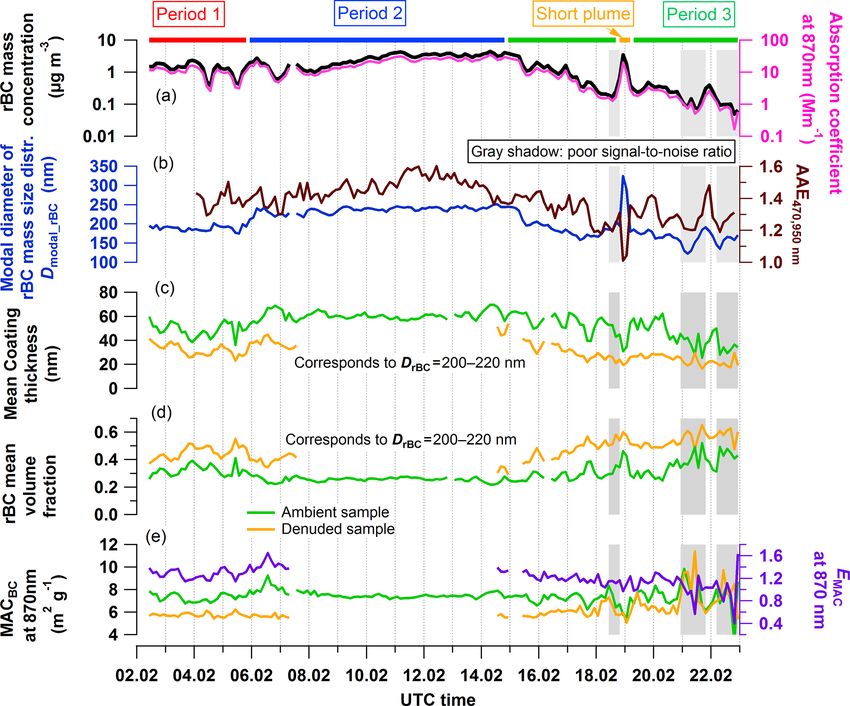
638                          J. Yuan et al.: Variability in the mass absorption cross section of black carbon (BC) aerosols

background atmosphere in central Europe (Asmi et al., 2011;
Aas et al., 2012; Birmili et al., 2009). The two main wind di-
rections for Melpitz are southwest (SW) and east (E) with
the different air masses arriving at Melpitz: air masses cross-
ing the western part of central Europe, including the city of
Leipzig, and continental air masses with anthropogenic emis-
sions from countries in eastern Europe via long-range trans-
port. Seasonally, the particulate mass concentration is highest
with the easterly wind direction in winter and lowest with the
westerly wind direction in summer (Spindler et al., 2013).
   The field experiment was conducted from 1 to 23 Febru-
ary 2017. Contributions from different BC sources are ex-
pected during the winter season. Furthermore, the higher pol-      Figure 1. Schematic of the sampling system, instruments and target
lution level makes it possible to achieve higher time resolu-      quantities related to this study. PAX is photoacoustic extinctiome-
tion with the online instruments.                                  ter, and SP2 is single-particle soot photometer. PAX and SP2 an-
                                                                   alyzed both ambient and denuded samples. The other instruments
2.3   Experimental setup                                           only analyzed the untreated ambient aerosol, including a multi-
                                                                   angle absorption photometer (MAAP), an Aethalometer (AE33),
                                                                   an aerosol chemical speciation monitor (ACSM) and further instru-
The sampling setup, including the instruments, is shown in         ments, which are not shown here.
Fig. 1. The ambient air was passed through a PM10 inlet fol-
lowed by a Nafion dryer (relative humidity, RH,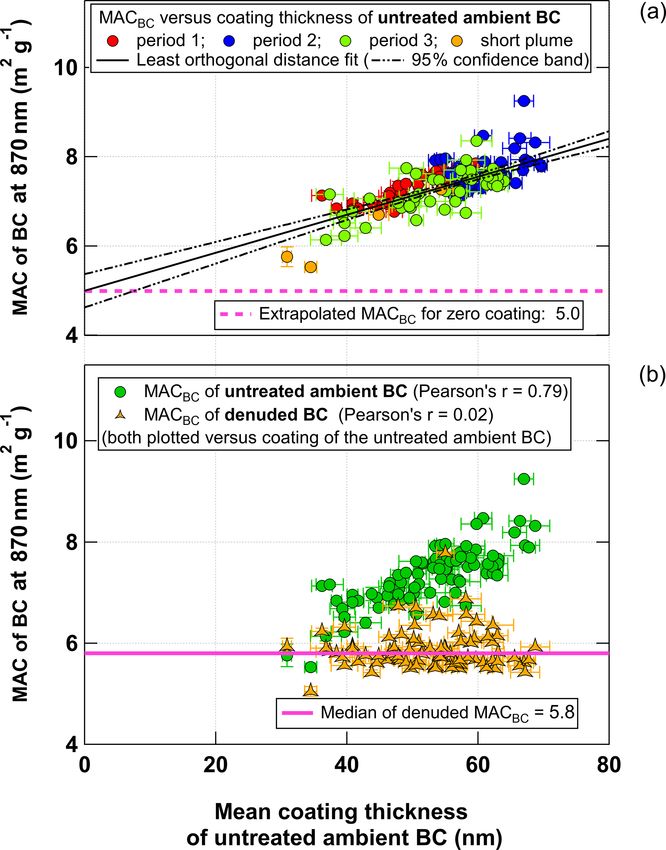
J. Yuan et al.: Variability in the mass absorption cross section of black carbon (BC) aerosols                                  639

∼ 80 nm using a void-free material density of 1.8 g cm−3 .         ter than ±10 % and to represent BC mass in atmospheric
For BC cores greater than the upper limit of detection of the      aerosols from different sources within ±20 %.
SP2, the particles are detected while the rBC mass cannot             Particles passing the laser beam also elastically scatter
be quantified due to the signal saturation from the analog-        laser light, which is detected by avalanche photodetectors
to-digital (A/D) converter. Therefore, the upper quantifica-       (APDs). BC-free non-absorbing particles do not evaporate
tion limit (LOQ) is ∼ 200 fg rBC mass per particle, corre-         within the laser beam and remain unperturbed, and the scat-
sponding to an rBC mass equivalent core diameter (DrBC ) of        tering signal is determined by a standard APD. The ampli-
∼ 600 nm. Note that the SP2 is also equipped with a narrow         tude of the scattering signal is proportional to the partial scat-
band incandescence detector (NB; 630–800 nm; Schwarz et            tering cross section of the detected particle for the solid angle
al., 2006). However, we did not further use these signals as       covered by the detector optics. From the measured scattering
the upper LOQ was at similar BC core mass as for the broad-        cross section the optical diameter of the particles (Dopt ) is in-
band detectors and because two-color pyrometry is out of the       ferred using Mie theory (Bohren and Huffman, 1998, i.e., as-
scope of this paper.                                               suming spherical particle shape). The refractive index of the
   As discussed by Pileci et al. (2020), there are a number        particles is assumed to be 1.50 + 0i, which typically provides
of different methods for quantifying and correcting for the        optical size distributions that agree within 20 % with corre-
mass of BC outside the SP2 size detection limits (if the           sponding mobility size distributions, excepting some outly-
user decides to apply a correction at all). These methods          ing cases when the total aerosol load was very low (Fig. S1).
are based on extrapolation of SP2-measured BC core mass            Unit detection efficiency for the standard optical sizing was
size distributions. In this study we used the lognormal fit        achieved for optical diameters Dopt > ∼ 150 nm and the up-
approach. Further, to better represent the upper portion of        per LOQ, which is restricted by detector saturation, was at
the size distributions where most of the missing mass ap-          Dopt = 500 nm. Absolute calibration of the scattering cross
peared to lie (Fig. S5), we fitted lognormal functions sep-        section measurement was done using spherical polystyrene
arately to the lower (80
640                             J. Yuan et al.: Variability in the mass absorption cross section of black carbon (BC) aerosols

                                                                           The optical size of the individual BC-containing parti-
                                                                        cle (Dtotal ) can be inferred from the combination of Mie
                                                                        model calculation, the measured scattering signal of the en-
                                                                        tire particle and the core diameter (DrBC ) (Taylor et al., 2015;
                                                                        Schwarz et al., 2008). Briefly, based on a concentric core-
                                                                        shell configuration, the Mie model is able to calculate the
                                                                        scattering cross section of the BC core with the input of DrBC
                                                                        and RIBC . Then Dtotal can be inferred by the Mie model with
                                                                        the input of the refractive index of the coating (RIcoat ) with
                                                                        scattering by coating (difference between measured scatter
                                                                        signal of entire particle and Mie calculated BC core scatter-
                                                                        ing signal). The particle-scattering cross sections with fixed
                                                                        DrBC , Dtotal , RIBC and RIcoat inputs by the Mie model are
                                                                        stored in a series of 2-D lookup tables for data analysis in the
                                                                        PSI SP2 toolkit run with Igor Pro (Wavemetrics, OR, USA).
                                                                        Finally, the coating thickness (Tcoat ) can be calculated with
                                                                        the reconstructed Dtotal and DrBC :

Figure 2. Comparison of the absorption coefficients measured by         Tcoat = (Dtotal − DrBC )/2.                                  (5)
the PAX and the MAAP. The MAAP data measured at 637 nm were
adjusted to 870 nm using the spectral dependence of the absorption      The coating thickness is more sensitive to RIcore than RIcoat ,
measured by the aethalometer. The PAX data measured at 870 nm           which is consistent with previous sensitivity evaluation (Tay-
are shown with the original calibration and after scaling by a factor   lor et al., 2015). The precision of the coating thickness re-
1.44 to match the MAAP data on average. The percentage differ-          trieved by the LEO method was estimated to be about ±20 %
ence between the scaled PAX and MAAP measurements is plotted
                                                                        (Laborde et al., 2012b) for DrBC ranging from 150 to 400 nm.
on the right-hand y axis (green crosses).
                                                                        2.4.2   Absorption measurements

                                                                        Instruments
stead of the normal scattering detector for the LEO sizing
because the 10 % and 90 % percentiles are much narrower                 A MAAP (Thermo Fisher Scientific, MA, USA; Petzold and
for the former, as shown in Fig. S2c and d.                             Schönlinner, 2004) was used to measure the aerosol absorp-
   The principle behind the LEO sizing can be applied to the            tion coefficient at 637 nm. The MAAP measures both the
time-resolved signal of the normal scattering signal at any             light radiation transmitted and backscattered from a particle-
position in the laser beam (Laborde et al., 2012a). The scat-           loaded fiber filter and determines the fraction of light ab-
tering signal of a BC-containing particle at incandescence              sorption by absorbing aerosol components via a radiative
onset represents that of the bare BC core, which makes it               transfer program. To minimize the interference by the light-
possible to infer its optical diameter (Dopt, BC ). This is done        scattering aerosol components on the angular distribution of
by assuming spherical shape and a certain BC refractive in-             the backscattered radiation, the measurements are performed
dex (RIBC ). Figure S3 shows a comparison of the optical di-            with three detectors at different angles. For the data analysis
ameter of the BC core with the BC mass-equivalent diam-                 in this study, a factor of 1.05 has been applied for the re-
eter inferred from the incandescence signal. The refractive             quired wavelength correction (from 660 to 637 nm) accord-
index of the bare BC core was chosen to be 1.75 + 0.43i,                ing to Müller et al. (2011).
which made the two diameters match in this study. This                     A PAX (Droplet Measurement Technologies, CO, USA)
value is lower than the value most commonly used for am-                was used to measure the aerosol absorption coefficient at
bient soot in other studies with SP2 measurement at various             870 nm, which minimizes interference from light-absorbing
sites (RIBC = 2.26 + 1.26i; Moteki et al., 2010; Laborde et             particulate matter other than BC, such as brown carbon or
al., 2012b, 2013; Zanatta et al., 2018; Dahlkötter et al., 2014).       dust. It applies photo-acoustic spectroscopy, which is de-
The reason for achieving the BC diameter match with a lower             scribed in detail in Arnott et al. (1999). Photo-acoustic spec-
than usual refractive index is not known, nor should this ap-           troscopy has been widely used in recent years as it is an
proach be interpreted as an accurate refractive index mea-              in situ measurement without perturbing particle morphology
surement. However, choosing it in this manner ensures bias-             (Lack et al., 2006). The PAX was calibrated following the
free measurements of the coating thickness of bare BC parti-            manufacturer instructions. However, the precision of these
cles (i.e., this choice results in coating thickness histograms         calibrations was insufficient and the absorption coefficients
for bare BC particles that are centered around 0 nm).                   measured with application of these calibration coefficients

Atmos. Chem. Phys., 21, 635–655, 2021                                                      https://doi.org/10.5194/acp-21-635-2021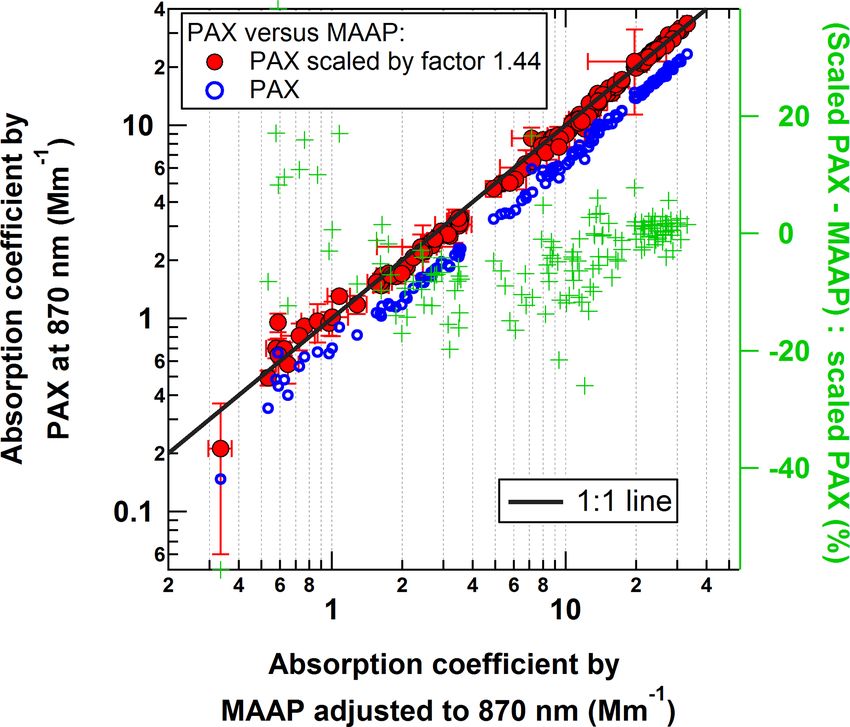
J. Yuan et al.: Variability in the mass absorption cross section of black carbon (BC) aerosols 641
were inconsistent with the results from the MAAP, as further The correlation between wavelength-adjusted MAAP data
discussed below (Müller et al., 2011). and PAX data is excellent in the range above ∼ 1 Mm−1
An Aethalometer (Model AE33, Magee Scientific, CA, (Fig. 2). However, the bap, PAX, 870 nm measurements are sys-
USA; Hansen et al., 1984) was also used to measure the tematically biased lower than the bap, MAAP, 870 nm measure-
aerosol absorption coefficients at seven wavelengths (370, ments by 31 %, which is most likely a result of imprecise
470, 520, 590, 660, 880 and 950 nm). The AE33 is also a and hence inaccurate PAX calibration (as discussed above).
filter-based instrument, with associated limitations in quanti- The MAAP demonstrated good accuracy in several inter-
fying the absorption coefficient absolutely. However, in this comparison studies, and it has been shown to have a low
study we only applied the AE33 to infer the relative spectral instrument-to-instrument variability of less than 5 % (Müller
dependence of light absorption. For this purpose we used the et al., 2011). Therefore, we decided to scale the PAX data
default instrument output, which includes a loading compen- by a constant scaling factor of 1.44[= 1/(1−0.31)] to match
sation and a correction for the effects of multiple scattering bap, MAAP, 870 nm , as shown in Fig. 2. Application of this con-
within the filter matrix (Drinovec et al., 2015). Note that the stant scaling factor brings the scaled PAX and MAAP mea-
absolute value of the multiple-scattering correction is irrele- surements into good agreement at absorption coefficients
vant for our purpose, except for the fact that it is assumed to greater than ∼ 15 Mm−1 , while the scaled PAX measure-
be independent of wavelength. ments are up to 10 % lower than the corresponding MAAP
The spectral dependence of the aerosol absorption coeffi- measurements in the range down to 1 Mm−1 (as shown by
cient, bap , often follows a power law bap (λ) ∼ λ−AAE in good the green crosses in Fig. 2). The scaled PAX data provide ab-
approximation. The exponent AAE is commonly referred to sorption coefficients with high time resolution and for both
as the absorption Ångström exponent. In this study we use ambient and denuded inlets, with absolute calibration refer-
absorption coefficients measured by the AE33 at two differ- enced to the MAAP.
ent wavelengths (λ1 and λ2 ) to infer the AAE using the fol-
lowing equation (Moosmüller et al., 2011): 2.4.3 The catalytic stripper (CS)
−ln(bap (λ1 )/bap (λ2 )) The basic principle and inner structure of the catalytic strip-
AAE (λ1 , λ2 ) = . (6) per (CS; Catalytic Instruments; Model CS015) have been de-
ln(λ1 /λ2 )
scribed in Amanatidis et al. (2013). The residence time of the
BC absorbs light broadly from near-UV to near-infrared CS used in this study was approximately 0.35 s, with a flow
wavelengths and thus has a weak spectral dependence rate of 1.5 L min−1 , and the temperature was set to 350 ◦ C.
(AAE ≈ 1; van de Hulst, 1957). By contrast, light-absorbing As shown in Fig. S5, the denuding process by the catalytic
organics (Corbin et al., 2019), can exhibit substantial light stripper did not influence the shape of the rBC core size dis-
absorption at near-UV and blue wavelengths while being tribution in the range ∼ 60 to 600 nm. The fractional loss of
negligible at red to near-infrared wavelengths, which nor- rBC mass was up to 20 % for DrBC below 300 nm. The losses
mally results in AAE larger than 1. likely introduced only negligible bias in the MACBC values
Typical AAE values for traffic emissions are close to unity since the absorption measurement by the PAX was also be-
since BC is the only light-absorbing component. However, hind the CS. The median coating thickness was 58 and 32 nm
AAE values are significantly larger than unity in biomass before and after denuding, respectively, indicating that the
burning emissions due to co-emission of BC and brown car- CS did not remove the coating completely. Denuding could
bon. The difference of the two branches of AAE values can potentially cause some compaction of the BC cores. How-
be used for source apportionment via an “AAE model” (Zot- ever, the denuded sample data were only used to determine
ter et al., 2017; Liu et al., 2014; Elser et al., 2016). Note that the MACBC of the bare BC cores – more precisely an upper
the application of the model is only precise under favorable limit of it due to residual coating – and hence such denuding
conditions, in which traffic and biomass burning are the only does not significantly affect the interpretation of our results.
sources.
3 Results and discussion
Absorption coefficient
3.1 Periods with distinct air mass origin
The absorption coefficient was quantified with a combination
of PAX, MAAP and AE33 data. The absorption coefficient The time series of wind direction and wind speed, as well as
measured by the MAAP at λ = 637 nm was adjusted to λ = chemical information, are shown in Fig. 3. Three distinct pe-
870 nm, using the 3 h averaged AAE data obtained from the riods and a short plume case were identified based on these
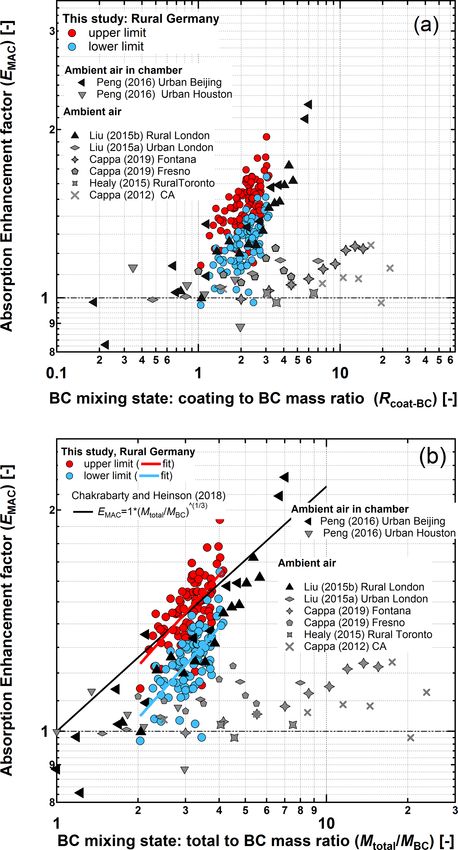
AE33. data and on air mass back trajectory analyses (Fig. 4; calcu-
lated for an air mass arrival altitude of 100 m). The exact time
bap, MAAP, 870 nm = bap, MAAP, 637 nm
windows and characteristics of the different periods are sum-
× (637/870)AAE(637, 870) (7) marized in Table S1. In period 1 (2 February 2017 09:00 to
https://doi.org/10.5194/acp-21-635-2021 Atmos. Chem. Phys., 21, 635–655, 2021642 J. Yuan et al.: Variability in the mass absorption cross section of black carbon (BC) aerosols Figure 3. Time series of (a) wind direction and wind speed at 10 min time resolution measured 6 m above ground; (b) concentrations of gas-phase species SO2 , NO, and NO2 at 3 h time resolution; (c) mass concentrations of aerosol-phase chemical components measured by the ACSM and the SP2 at 3 h time resolution; and (d) relative mass fractions of the measured aerosol chemical components. 5 February 2017 21:00 UTC), the local wind speed at Mel- previous observations from Melpitz and indicate that NOx - pitz was low (median: 1.2 m s−1 ; interquartile range, IQR: rich vehicle emissions were a dominant source of pollution 0.8 to 1.7 m s−1 ) and the local wind direction at the site var- in these air masses (Spindler et al., 2013). ied frequently. Back trajectory analysis showed that most of In period 2 (5 February 2017 21:00 to 14 February 2017 the air masses came from south to southwest (S to SW) of the 22:00 UTC), the local wind speed at the site (median: 3.4; sampling site, passing through the high Alps region. The lo- IQR: 2.7–4.1 m s−1 ) was higher than that of period 1 with cal wind directions were generally not consistent with the air constant local wind direction from the northeast to south- mass origin sector according to the back trajectory analysis. east (Fig. 3a). Back trajectory analysis indicated that the air However, given the low and variable local winds during this masses arriving at the site had traveled from northeastern, time period, the back trajectory result is more relevant for in- eastern and southeastern Europe (Fig. 4), consistent with the terpreting the aerosol- and gas-phase composition. The gas- local wind directions. In the gas phase, the most striking fea- phase mixing ratios were usually strongly dominated by NOx ture of the measurements is that SO2 was present at signif- (except for period 2; see Table S1). The median SO2 to NOx icantly higher levels than in the other periods, with a me- ratio was 0.08 (IQR: 0.05–0.11). Similarly, the aerosol prop- dian concentration of 9.2 (IQR 3.2–13.2) µg m−3 (Fig. 3b). erties were comparable among the periods except for period The SO2 to NOx ratio was also much higher with a median 2. For period 1, the median value of the total aerosol mass value of 0.63 (IQR 0.28–0.83). The PM1 aerosol mass con- concentration from the integrated ACSM data (non-BC) and centration from integrated ACSM (non-BC) and SP2 (BC) the SP2 (BC) was 10.6 µg m−3 (IQR: 8.7–11.7; Table S1), also showed the highest levels observed during the whole the mass ratio of particulate inorganics to organics was 1.45 campaign period, with a median mass concentration of 23.0 (IQR: 1.22–1.55), and the sulfate to nitrate mass ratio was (IQR 20.4–27.2) µg m−3 (Table. S1), which was almost twice 0.60 (IQR: 0.39–0.71). Note, these mass concentrations ap- as high compared to the other periods. Despite the higher proximately correspond to PM1 composition due to the in- concentrations of chemical components (Fig. 3c), the rela- trinsic upper detection limits of the ACSM and SP2. The tive composition of organic and total inorganic components aerosol composition measured in this study is consistent with (Fig. 3d) was similar to that of period 1 and remained rela- Atmos. Chem. Phys., 21, 635–655, 2021 https://doi.org/10.5194/acp-21-635-2021
J. Yuan et al.: Variability in the mass absorption cross section of black carbon (BC) aerosols                                           643

Figure 4. Map of air mass back trajectories: 96 h air mass back trajectories terminating at Melpitz site (yellow star) at an altitude of 100 m
for every hour of the campaign. Trajectories terminating at altitudes of 10 and 500 m were similar to those shown here. The map is based on
the HYSPLIT atmospheric transport and dispersion modeling system provided by Air Resources Laboratory (ARL) (Stein et al., 2015).

tively stable within period 2. However, within the inorganic             components, substantially higher mass fractions of nitrate
fraction, the sulfate to nitrate mass ratio was remarkably               (35 %, 25 %–41 %) were found compared to the other pe-
high, with a median value of 1.1 (0.9–1.2) during this period.           riods, while rBC mass concentrations (0.6, 0.3–1.4 µg m−3 )
The source of sulfur leading to the high concentrations of               and rBC mass fractions (7 %, 4 %–11 %) reached their low-
SO2 and sulfate in period 2 was likely residential and indus-            est levels for the whole campaign (Fig. 3c and d, Table S1).
trial solid fuel burning in eastern and southeastern Europe,             Organic mass fractions were less than 30 % (Table S1), lower
where coal with a high sulfur content is still used as a fuel            than the fractions observed in periods 1 and 2.
source. For example, Poland, located 150 km east of the Mel-                A short plume of BC aerosol passed over the sampling
pitz site, has the highest SO2 emissions among EU countries              site between 18 February 17:00 and 19 February 07:00 UTC.
(Glasius et al., 2018). Previous studies have shown that com-            Given the stagnant air conditions and low wind speed dur-
bustion of coal and biomass (wood) are significant sources               ing this period, this plume likely resulted from a local emis-
of carbonaceous aerosols in Poland in winter (Spindler et al.,           sion. As shown in Fig. 3c, the 3-hourly averaged rBC mass
2013; Ciarelli et al., 2017; Glasius et al., 2018).                      concentration peaked at ∼ 4 µg m−3 during this event, which
   In period 3 (14 February 2017 22:00 to 23 February 2017               was the highest value reached during the campaign. The or-
00:00 UTC), the local wind at the site was dominated by                  ganic aerosol concentration was stable during the event (2.3,
westerly winds with generally higher and more variable wind              2.1–2.5 µg m−3 ), which suggests that the plume did not come
speeds (median: 4 m s−1 : IQR: 2.5–6.3 m s−1 ) than those of             from a forest fire or biomass burning event since such events
period 1 and 2. The majority of the back trajectories origi-             would emit large amounts of organics. A coal burning source
nate from western Europe (Fig. 4), consistent with local wind            for the plume is also not evident since the SO2 did not in-
direction. In the particle phase, total aerosol mass concen-             crease as shown in Fig. 3b. The fact that the AAE470, 950
trations decreased steadily throughout period 3 to the low-              dropped to around 1.0 during the period within the absorbing
est values observed during the whole campaign. The me-                   aerosol plume may indicate fresh emissions from a combus-
dian total aerosol mass concentration was 10.9 µg m−3 (IQR:              tion engine as BC source. In addition, the observed much
8.1–15.8) during the period (Table S1). Among the aerosol                larger BC core diameters (above 300 nm, Fig. 5b) in the

https://doi.org/10.5194/acp-21-635-2021                                                        Atmos. Chem. Phys., 21, 635–655, 2021
644                          J. Yuan et al.: Variability in the mass absorption cross section of black carbon (BC) aerosols

plume compared to the other periods likely indicated a super-     rope measured in Paris (Laborde et al., 2013), and ∼ 210–
polluter. Very dirty trucks or cars are known to produce          220 nm in Asian outflow measured at a remote site in Japan
larger BC particles than typical engines do (Schneider et al.,    (Ueda et al., 2016). During this campaign, systematically
2015); however, the persistence of the plume rather indicates     larger median Dmodal_rBC values were measured in period
a nearby stationary rather than multiple mobile sources. In       2 (239 nm) than in periods 1 (190 nm) and 3 (181 nm). The
summary, the short plume seems to have resulted from a lo-        larger BC particles measured in period 2 might be related to
cal event, but the exact source is not apparent.                  coal burning emissions (e.g., lignite coal burning in Poland);
                                                                  while the burning of hard coal briquette emits particles that
3.2   Physical and optical properties of BC                       lie mostly in the nuclei and Aitken mode (20–100 nm), the
                                                                  number size distribution of lignite emissions peaks in the ac-
Time series of the physical and optical properties of BC in       cumulation mode (100–1000 nm) (Bond et al., 2002). There-
the essentially water-free aerosol sample as present after dry-   fore, it is possible that BC cores from lignite burning are
ing to low RH are shown in Fig. 5. The BC mass concen-            larger than BC from other common sources such as traffic.
tration and absorption coefficient measurements were highly       Wood burning emissions from domestic heating are also ex-
uncertain during periods of low aerosol loading (gray-shaded      pected to generate larger BC cores than those emitted by traf-
periods occurring at the end of the campaign) due to the          fic and thus could also be partly responsible for the generally
SP2 data acquisition settings (the SP2 was set to save data       larger BC cores observed during period 2. During the short
from only 1 out of every 200 particles) and instrumental          and distinct plume, Dmodal_rBC ranged from 192 to 298 nm,
limits (the manufacturer-reported sensitivity of the PAX is       substantially larger than the values measured in remote back-
J. Yuan et al.: Variability in the mass absorption cross section of black carbon (BC) aerosols 645 Figure 5. Time series of the physical and optical parameters of BC in the dried aerosol sample at 3 h time resolution: (a) ambient rBC mass concentration measured by SP2 (left axis) and absorption coefficient of bulk aerosol measured by PAX at 870 nm (right axis); (b) model BC core diameter of rBC mass size distributions determined with lognormal fits shown in Fig. S6 (left axis) and AAE470, 950 (right axis); (c) mean thickness of non-BC coatings on ambient and denuded rBC cores with mass-equivalent diameters in the range 200 to 220 nm, calculated from single-particle data; (d) mean rBC volume fractions for ambient and denuded rBC particles calculated from the coating thickness data shown in (c); (e) mean MACBC of ambient and denuded samples (left axis) and corresponding EMAC calculated with Eq. (4) (right axis). The gap in the denuded time series in (c) and (d) (and corresponding gap in the EMAC time series in e) from 6 to 14 February is due to malfunction of the valve-switching system. The time periods when rBC mass was less than 0.2 µg m−3 are marked with gray shading due to poor signal-to-noise ratio. modal diameters were in the range of diameters for which It is apparent from the time series in Fig. 5c and e that the the LEO-fit analysis described in Sect. 2.4.1 could be suc- ambient MACBC and BC coating thickness correlated well. cessfully applied to all types of internally mixed BC parti- These two properties of the dried aerosol are plotted as a scat- cles (i.e., all types of BC particles ranging from uncoated to ter plot in Fig. 6a, indicating that ambient MACBC and coat- thickly coated particles). Therefore, to obtain a representative ing thickness were positively correlated with a Pearson cor- indicator of BC internal mixing state that is applicable to the relation coefficient of 0.73. This provides evidence that there mode of the BC mass size distributions, coating thicknesses was indeed a lensing effect during the campaign and that the are presented here for BC cores with diameters between 200– BC mixing state was the main driver of MACBC variability. 220 nm. For simplicity we hereafter refer to this parameter We hereafter refer to this method of directly evaluating the as “coating thickness” without specifying the range of BC dependence of MACBC on the internal mixing state as the core diameters over which it has been calculated. The mean correlation method. To investigate the robustness of the re- coating thickness at 3 h time resolution (Fig. 5c) was calcu- sults of the correlation method, Fig. S10 displays versions lated from single-particle data as shown in Fig. S7. The coat- of Fig. 6a with different scaling factors applied to the under- ing thickness for ambient particles ranged from 51 to 61 nm lying quantities used to calculate MACBC . In particular, we (IQR) over the whole campaign, which corresponds to rBC investigated the effect of applying a loading-dependent scal- volume fractions between 25 % and 30 % (Fig. 5d). ing factor to PAX data in Fig. S10b (as motivated by Fig. 2 https://doi.org/10.5194/acp-21-635-2021 Atmos. Chem. Phys., 21, 635–655, 2021
646 J. Yuan et al.: Variability in the mass absorption cross section of black carbon (BC) aerosols
tween MACBC and coating thickness may not be linear for
lightly coated BC (the lensing effect appears to be weaker for
lightly coated than moderately to heavily coated BC; Peng et
al., 2016; Liu et al., 2017), this extrapolated intercept is re-
garded as a lower limit estimate of MACBC, bare .
A second, more direct approach was also applied to inves-
tigate the lensing effect – we refer to this as the denuding
method. In this method a catalytic stripper (CS) was used
to remove BC coating material (Fig. 5c) before the MACBC
measurement. Figure 5e shows that this process resulted in
lower MACBC for the denuded samples relative to the corre-
sponding ambient samples. In Fig. 6b, the ambient and de-
nuded MACBC values are plotted against the mean coating
thickness of the unperturbed, ambient BC particles (i.e., be-
fore denuding by the CS). It is seen that most of the denuded-
MACBC values fall in the range from 5.6 to 6.0 m2 g−1 (me-
dian = 5.8 m2 g−1 ) and that the values are largely indepen-
dent of the original coating thickness, with a Pearson cor-
relation coefficient of only 0.02 (the denuded-MACBC val-
ues are also largely independent of the coating thickness
of the denuded particles as shown in Fig. S4, with a Pear-
son correlation coefficient of −0.29). This is in contrast to
the trend observed for the ambient MACBC measurements,
which showed strong correlation with the coating thickness
of the unperturbed BC particles. These results suggest that
the coating material removed from the BC particles by the
CS was largely responsible for the lensing effect displayed
Figure 6. (a) MACBC of the aerosol sample dried to low RH by the ambient BC particles.
against the mean coating thickness of ambient rBC particles with
The results displayed in Figs. 5c and S8 indicate that the
core diameters in the range 200–220 nm mass equivalent diameter.
CS did not remove all coating material from the BC particles,
(b) MACBC of ambient and thermo-denuded samples against the
mean coating thickness of ambient rBC particles. Each data point likely due to the short residence time of around 0.35 s only.
represents an average value over a 3 h time period with error bars The denuded particles retained thin coatings which might
representing the standard error of the mean (these averages were still be responsible for a lensing effect. However, such a lens-
performed with 1 min resolution data in the case of the MACBC ing effect is not apparent when plotting the denuded-MACBC
values and 1 s resolution data in the case of the mean coating thick- values against the coating thickness of the denuded particles
nesses). An orthogonal distance linear regression was applied to the (Fig. S10). In any case, we consider the median denuded
ambient data to calculate a y-intercept value that represents an esti- MACBC of 5.8 m2 g−1 to represent an upper limit estimate
mate of the MAC for zero coating, i.e., MACBC, bare . Note that the of MACBC, bare . The true value of MACBC, bare likely falls
number of ambient MACBC data points in (b) is smaller than in (a) within the range of 5.0 to 5.8 m2 g−1 defined by the lower
due to the gap of missing data in the denuded MACBC time series
and upper limit estimates arising from the correlation and
from 7 to 14 February shown in Fig. 5e.
denuding methods, respectively. Still, the results of the two
methods are roughly consistent with each other, strengthen-
ing the conclusion that the internal mixing of BC drove the
and the discussion in Sect. 2.4.2), as well as the effect of ap- variability of MACBC in this campaign.
plying separate missing rBC mass correction factors for each
time period of the campaign in Fig. S10c (as discussed in 3.4 Influence of other BC particle properties on
Sect. 2.4.1 ). In these cases (as well as the case when both MACBC
types of scaling factors are applied, Fig. S10d), the positive
correlation between MACBC and the mean coating thickness In this section, the importance of BC particle properties
remains, supporting the evidence for an observed lensing ef- other than the internal mixing state is explored in relation
fect. to MACBC variability.
In order to estimate the MACBC of bare, uncoated BC First, we address the question of whether the ambient
(MACBC, bare ) a linear function was fit to the measurements MACBC is dependent on the BC “source”. In a qualitative
in Fig. 6a (via orthogonal distance regression, ODR, fit) to manner, the air mass origins characterized in Sect. 3.1 can
obtain a y-intercept of 5.0 m2 g−1 . Since the relationship be- be used to indicate different emission sources of BC parti-
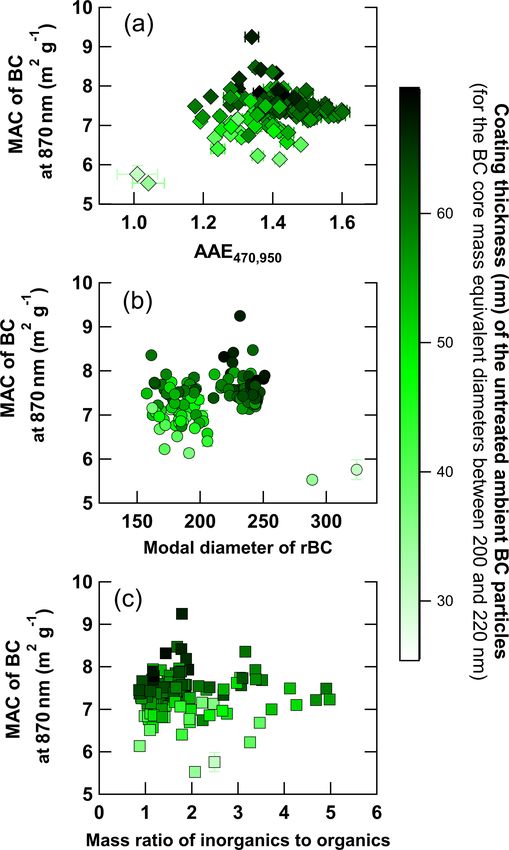
Atmos. Chem. Phys., 21, 635–655, 2021 https://doi.org/10.5194/acp-21-635-2021J. Yuan et al.: Variability in the mass absorption cross section of black carbon (BC) aerosols 647 cles in order to answer this question. In Fig. 6a, it is seen that equivalent BC to coal emissions. Still, the AAE470, 950 val- the MACBC measurements from all air mass origin periods ues found here were mostly above 1.4 during period 2, which (Fig. 6a) scatter around the same regression fitting line. This is consistent with the assumption that coal burning (lignite) suggests that the differences in MACBC between the periods emissions were relevant during this period. Therefore, we are driven by differences in coating thickness, rather than the conclude that coal burning emissions likely contributed to the air mass origins or the characteristics of BC from different BC measured during the campaign, however, without being sources. able to quantify this contribution. In this case, the contribu- As introduced in Sect. 2.4.2, the absorption Ångström ex- tions of wood burning and traffic to BC as calculated with ponent (AAE) can indicate different BC sources (e.g., traf- the aethalometer model and displayed in Fig. S9b should be fic emissions typically display AAE ∼ 1, while wood burn- considered as upper limit estimates, since these contributions ing emissions generally have AAE >1). Therefore, in a more would likely be lower if a third source was included in the quantitative manner, the correlation of MACBC and AAE model. can be calculated to explore a possible source dependence Independent of a precise BC source apportionment the cor- for MACBC . Time series of AAE values calculated between relation of AAE with MACBC can still be assessed to explore different pairs of wavelengths are shown in Fig. S9a, indi- a potential source dependence for MACBC . Figure 7a indi- cating similar behavior for all wavelength pairs. Given this cates there was no clear relationship between MACBC and fact, AAE470, 950 was chosen to explore the correlation with AAE470, 950 during the campaign. This supports the conclu- MACBC in Fig. 5b in order to have the wavelength depen- sion of the analysis displayed in Fig. 6a that MACBC vari- dence of absorption across a wide range of wavelengths ability was driven by coating thickness, and not by the char- (from blue to near-infrared). acteristics of BC from different sources. AAE470, 950 ranged from approximately 1.2 to 1.6 during Second, we address the question of whether the MACBC the campaign, except for the short plume period where val- depends on the BC core diameter. Figure 7b shows that ues around 1 were observed. This indicates that there were there was no clear relationship between MACBC and BC contributions from emission sources other than traffic to BC core diameter (R 2 = 0.01, or 0.09 with the two outlying during the campaign. Wood burning is performed in winter points with the largest modal diameters removed), which in central Europe for heating purposes, and it is likely that indicates that the variation in BC size was not responsible brown carbon emissions from this activity resulted in absorp- for the MACBC variability. This is because the modal di- tion at shorter wavelengths, contributing to high AAE470, 950 ameters of the BC core mass size distributions only varied values (>1). If it is assumed that additional emission sources within a relatively narrow range during the campaign (DrBC such as coal burning did not contribute to the sample, the from 150 to 250 nm). This corresponds to dimensionless size aethalometer model for source apportionment (Zotter et al., parameters x(= π DrBC /λ) in the range from 0.5 to 0.9. In 2017) can be used to separate the contributions of wood both the Rayleigh (x 1) and Mie regime (x ∼ 1), the size- burning and traffic emissions to total absorption (and there- distribution-weighted MACBC is relatively independent of fore equivalent BC). The results of this model are shown DrBC . For much greater DrBC (x 1, known as the geomet- in Fig. S9b. During periods 1 and 3, the model suggests ric regime) incident light is unable to penetrate through the that traffic and wood burning emissions contributed roughly whole particle: absorption only occurs in the outer layer of equally to the observed total BC mass concentration. In con- the particle, which results in a strong negative relationship trast, during period 2, the modeled wood burning contribu- between MACBC and DrBC in this regime. The modal diam- tion dominated over the traffic contribution. eters of the BC core mass size distributions observed during It is important to stress, however, that the AAE model can this campaign were not large enough to reach the geomet- only apportion the measured absorption to two sources. As ric regime, which is why no clear relationship was observed discussed in Sect. 3.1, it is likely that a third source – coal between MACBC and DrBC . burning emissions – also contributed to the BC measured Third, the dependence of the ambient MACBC on the coat- during the campaign, at least in period 2 when the SO2 to ing composition is evaluated. Moffet et al. (2016) indicated NOx ratio was significantly higher. Bond et al. (1999) ob- that the chemical composition of the BC coating material served that the industrial burning of lignite coal produced may affect the optical properties of BC by influencing the a yellowish, carbonaceous aerosol with strong absorption location of a BC core within its hosting particle. These au- wavelength dependence. More generally, Bond et al. (2002) thors observed in a field study in central California that BC observed AAE435, 880 values between 1 and 3 for aerosol pro- cores in particles with organic-rich coatings were located duced from the burning of different types of coal. Given the near particle centers while BC cores in particles with inor- wide range of observed AAE for coal burning emissions, and ganic coatings were located near particle edges. They hy- the lack of knowledge regarding a specific value that is ap- pothesized that the latter case occurs due to crystallization of propriate for central Europe (e.g., as is the case for biomass the inorganic species. In terms of light absorption enhance- burning aerosols; Zotter et al., 2017), it is not possible to ment, a few laboratory and field studies have found evidence use measured AAE values to apportion a specific fraction of that EMAC values depend on whether BC is internally mixed https://doi.org/10.5194/acp-21-635-2021 Atmos. Chem. Phys., 21, 635–655, 2021
648                             J. Yuan et al.: Variability in the mass absorption cross section of black carbon (BC) aerosols

                                                                        showed that EMAC at 870 nm displayed a positive relation-
                                                                        ship with the mass ratio of bulk secondary organic to sec-
                                                                        ondary inorganic aerosol, with EMAC at 870 nm increasing
                                                                        from 1 to 2 as the mass ratio of organics to inorganic in-
                                                                        creased from 2 to 8. However, it should also be noted here
                                                                        that coating amounts were not measured, and therefore the
                                                                        observed relationship could potentially be the result of cross-
                                                                        correlation between coating composition and coating thick-
                                                                        ness.
                                                                           In this study, the chemical composition was measured for
                                                                        bulk aerosols by an ACSM. No chemical or mixing state in-
                                                                        formation is available at the single-particle level. Therefore,
                                                                        we used the bulk ratio of measured inorganic to organic par-
                                                                        ticulate matter as a proxy variable to investigate a possible
                                                                        dependence of MACBC on coating composition. In Fig. 7c it
                                                                        is seen that MACBC displays no clear relationship with the
                                                                        inorganic to organic ratio. By contrast, darker points are sys-
                                                                        tematically higher up than brighter points, indicating that the
                                                                        amount of coating (coating thickness) had a large effect on
                                                                        absorption enhancement through the lensing effect, whereas
                                                                        variations in coating composition only had a negligible effect
                                                                        during this campaign. However, it cannot be ruled out that a
                                                                        relationship between coating chemical composition and ab-
                                                                        sorption enhancement did in fact exist, but that the relation-
                                                                        ship is not apparent in Fig. 7c because the bulk ratio of inor-
                                                                        ganic to organic aerosol mass is a poor indicator of the com-
                                                                        position of coatings on individual particles.
                                                                           Despite the fact that atmospheric aging processes tend
                                                                        to make aerosols more homogeneous during transport away
                                                                        from sources, e.g., by increasing the degree of internal mix-
                                                                        ing, some dependence of MACBC on BC source could be re-
                                                                        tained. Possible drivers for such source dependence include
                                                                        differences in BC core size and morphology, in chemical mi-
Figure 7. Time-resolved MACBC values of untreated ambient BC            crostructure of the BC, in morphology of the coated BC due
particles at 870 nm wavelength calculated at 3 h resolution plotted
                                                                        to differences in coating processes and/or coating compo-
against (a) the absorption Ångström exponent, AAE470, 950 , be-
tween 470 and 950 nm wavelength; (b) the modal diameter of the
                                                                        sition. The MACBC of denuded aerosol samples exhibited
BC core mass size distributions (DrBC ) (expressed as mass equiv-       very limited variability (Fig. S4b) suggesting that potential
alent diameter); and (c) the ratio of non-refractory inorganic to or-   differences in MACBC of bare cores from different sources
ganic components measured in near-PM1 by the ACSM.                      are small. The analyses presented above further suggest that
                                                                        BC-source-related differences in MACBC , which may or may
                                                                        not exist close to sources, largely disappear during transport
with organic or inorganic species. Wei et al. (2013) found that         to the rural background site. The only exceptions are vari-
glycerol-coated BC had EMAC at 532 nm of ∼ 1.4 while BC                 ations in coating thickness, which have been shown to drive
cores coated with solid ammonium sulfate and ammonium                   MACBC variations, and which may have retained some resid-
nitrate had EMAC at 532 nm of only 1.10 and 1.06, respec-               ual relation with BC source.
tively. However, it should be noted that the amount of coating
could not be quantified conclusively in these experiments,              3.5   Absorption enhancement factors (lensing effect)
and therefore it must be considered likely that the coating                   and their comparison with previous studies
volume fractions differed for the different coating compo-
sitions. Zhang et al. (2018) applied a multi-linear regression          The relationship between EMAC and the internal mixing state
analysis to positive matrix factorization (PMF) source appor-           of BC is shown in Fig. 8a. In order to directly compare the
tionment results to conclude that highly oxidized secondary             results of this study with those from previous studies, the
organic aerosol was the major chemical component respon-                BC mixing state is represented in Fig. 8a by the mean ra-
sible for aerosol light absorption enhancement observed at              tio of coating to core mass (Rcoat-BC ) for BC cores with
an urban background site in Paris, France. These authors                mass equivalent diameter between 200 and 220 nm, rather

Atmos. Chem. Phys., 21, 635–655, 2021                                                      https://doi.org/10.5194/acp-21-635-2021
You can also read