Air mass physiochemical characteristics over New Delhi: impacts on aerosol hygroscopicity and cloud condensation nuclei (CCN) formation
←
→
Page content transcription
If your browser does not render page correctly, please read the page content below
Atmos. Chem. Phys., 20, 6953–6971, 2020
https://doi.org/10.5194/acp-20-6953-2020
© Author(s) 2020. This work is distributed under
the Creative Commons Attribution 4.0 License.

Air mass physiochemical characteristics over New Delhi:
impacts on aerosol hygroscopicity and cloud condensation
nuclei (CCN) formation
Zainab Arub1 , Sahil Bhandari2 , Shahzad Gani3 , Joshua S. Apte3 , Lea Hildebrandt Ruiz2 , and Gazala Habib1
1 Department of Civil Engineering, Indian Institute of Technology Delhi, New Delhi, India
2 McKetta Department of Chemical Engineering, The University of Texas at Austin, Austin, Texas, USA
3 Department of Civil, Architectural and Environmental Engineering, The University of Texas at Austin, Austin, Texas, USA

Correspondence: Zainab Arub (jyotika.mmmec@gmail.com)

Received: 11 November 2019 – Discussion started: 3 December 2019
Revised: 12 April 2020 – Accepted: 16 April 2020 – Published: 12 June 2020

Abstract. Delhi is a megacity subject to high local anthro-      and then those in AS. The size turned out to be more impor-
pogenic emissions and long-range transport of pollutants.        tant than chemical composition directly, and the NCCN was
This work presents for the first time time-resolved estimates    governed by either the Aitken or accumulation modes, de-
of hygroscopicity parameter (κ) and cloud condensation nu-       pending upon the supersaturation (SS) and critical diameter
clei (CCN), spanning for more than a year, derived from          (Dc ). af was governed mainly by the geometric mean diame-
chemical composition and size distribution data. As a part of    ter (GMD), and such a high af (0.71±0.14 for the most dom-
the Delhi Aerosol Supersite (DAS) campaign, the character-       inant sub-branch of the SA air mass – R1 – at 0.4 % SS) has
ization of aerosol composition and size distribution was con-    not been seen anywhere in the world for a continental site.
ducted from January 2017 to March 2018. Air masses origi-        The high af was a consequence of very low Dc (25–130 nm,
nating from the Arabian Sea (AS), Bay of Bengal (BB), and        for SS ranging from 0.1 % to 0.8 %) observed for Delhi. Indi-
southern Asia (SA) exhibited distinct characteristics of time-   rectly, the chemical properties also impacted CCN and af by
resolved sub-micron non-refractory PM1 (NRPM1 ) species,         impacting the diurnal patterns of Aitken and accumulation
size distributions, and CCN number concentrations. The SA        modes, κ and Dc . The high-hygroscopic nature of aerosols,
air mass had the highest NRPM1 loading with high chlo-           high NCCN , and high af can severely impact the precipitation
ride and organics, followed by the BB air mass, which was        patterns of the Indian monsoon in Delhi, impact the radiation
more contaminated than AS, with a higher organic fraction        budget, and have indirect effects and need to be investigated
and nitrate. The primary sources were identified as biomass-     to quantify this impact.
burning, thermal power plant emissions, industrial emissions,
and vehicular emissions. The average hygroscopicity param-
eter (κ), calculated by the mixing rule, was approximately 0.3
(varying between 0.13 and 0.77) for all the air masses (0.32±    1   Introduction
0.06 for AS, 0.31 ± 0.06 for BB, and 0.32 ± 0.10 for SA).
The diurnal variations in κ were impacted by the chemical        High aerosol loading can have huge climatic repercussions
properties and thus source activities. The total, Aitken, and    on precipitation including land surface feedback through
accumulation mode number concentrations were higher for          rainfall, surface energy budget, and variation in latent heat
SA, followed by BB and AS. The mean values of estimated          atmospheric influx (Tao et al., 2012). Added cloud conden-
CCN number concentration (NCCN ; 3669–28926 cm−3 ) and           sation nuclei (CCN) may nucleate a larger number of smaller
the activated fraction (af ; 0.19–0.87), for supersaturations    droplets, which then take a longer time to coalesce into rain-
varying from 0.1 % to 0.8 %, also showed the same trend, im-     drops (Gunn and Phillips, 1957; Squires, 1958). A greater
plying that these were highest in SA, followed by those in BB    cloud depth, indicating higher rain initiation, occurs in more

Published by Copernicus Publications on behalf of the European Geosciences Union.
6954                                                Z. Arub et al.: Air mass physiochemical characteristics over New Delhi

polluted clouds. Complete suppression of warm rain might          icity based on PM2.5 mass, RH, and visibility data (Wang and
also occur and get aggravated due to additional CCN acti-         Chen, 2019).
vation above the cloud base (Braga et al., 2017). While rain         In this work, for the first time for Delhi, time-resolved size
suppression was observed in the case of polluted urban and        distribution and chemical speciation measurements were car-
industrial plumes (Rosenfeld, 2000), and smoke arising from       ried out from 15 January 2017 to 31 March 2018 as a part
forest fires (Rosenfeld, 1999), the precipitation tendency in-    of the Delhi Aerosol Supersite (DAS) campaign (Gani et
creases due to influx of giant CCN consisting of sea salt         al., 2019). The time-resolved hygroscopicity parameter and
(Rosenfeld et al., 2002) and salt playas (Rudich et al., 2002)    CCN estimates were derived using chemical speciation data
due to acceleration of the auto-conversion rate (Rosenfeld et     from an aerosol chemical speciation monitor (ACSM), and
al., 2008). To understand the impact of pollution on indirect     number concentration data from a scanning mobility particle
radiative forcing and precipitation in highly polluted regions,   sizer (SMPS), measured from January 2017 to March 2018.
the information on CCN number concentration is essential in       Data were analysed to investigate the following hypotheses:
global climate models (GCMs) and regional climate models          (a) the precursors to secondary organic aerosol (SOA) forma-
(RCMs).                                                           tion critically impact the chemical composition over Delhi,
   As per the fifth IPCC report (Boucher et al., 2013), the       (b) the emission sources significantly impact CCN formation
two most important factors governing CCN activation and           by governing the size distributions and chemical composi-
number concentration are size and composition. The aerosol        tion, and thus hygroscopicity, and (c) physical properties im-
chemical composition impacts the aerosol hygroscopicity,          pact CCN more compared to chemical properties directly –
which impacts the critical diameter and hence CCN activa-         however, the physical properties are, in turn, shaped by the
tion. The hygroscopicity parameter (κ) is defined as the to-      chemical properties.
tal water uptake ability of aerosols (Petters and Kredenweis,
2007). Further, the increase in relative humidity (RH) due
to water uptake by aerosol can impact visibility (Lee et al.,     2     Methodology and instrumentation
2016; Liu et al., 2012); secondary particle formation (Ervens
et al., 2011); and measurements of remote sensing (Wang and       2.1    Instrumentation
Martin, 2007; Brock et al., 2016), aerosol loading, and its
chemical composition (Chen et al., 2018). Hence, it is essen-     For a detailed assessment of aerosol physiochemical prop-
tial to determine the hygroscopicity of aerosols, especially in   erties, an SMPS (TSI, Shoreview, MN), ACSM (Aerodyne
the polluted regions of the world, where these impacts are        Research, Billerica MA), and aethalometer (Magee Scien-
expected to be highly significant.                                tific Model AE33, Berkeley, CA) were operated at the In-
   Although the recent precipitation data during 1950–2011,       dian Institute of Technology (IIT) Delhi in Block 5, at a
averaged over July and August for Delhi, reveal a significant     height of nearly 15 m, as a part of the DAS campaign. This
decreasing trend, there has been an increasing trend in the       sampling site in New Delhi was free from any source activ-
frequency of heavy rainfall events and a decrease in the fre-     ity, except for a road, located 150 m away. The IIT campus
quency of wet and rainy days when it rains for a shorter pe-      is cleaner than the rest of the city. However, it lies in the
riod (Guhathakurta et al., 2015). These occurrences are most      heart of the city, and the outskirts of the campus experience
likely signatures of aerosols impacting the cloud-nucleating      fresh traffic influx. The IIT campus allows only limited ac-
properties, which calls for detailed CCN data examination.        cess to vehicles and therefore has less traffic compared to the
The high uncertainties associated with radiative forcings,        city in general. A temperature-controlled room was used to
both direct and indirect, especially at the regional level, are   carry out the measurements. Two separate and thermally in-
a result of poor representation of the aerosol distributions in   sulated sampling lines (3/4 in. outer-diameter stainless-steel
GCMs. This is critical for the Indian sub-continent, where the    tubes) with flows of 3 and 2 L min−1 equipped with PM1 cy-
variability in aerosol microphysical properties is very high,     clone, in line with a water trap and a Nafion membrane dif-
at various spatial and temporal scales. These necessitate the     fusion dryer (Magee Scientific Sample Stream Dryer, Berke-
measurement of long-term aerosol physiochemical proper-           ley, CA), were used for (1) an SMPS and ACSM in conjunc-
ties, the hygroscopicity parameter, and CCN estimates. De-        tion with a flow controller and (2) an aethalometer, respec-
tailed CCN and κ measurements have been carried out in            tively. A brief description of the instruments is given below.
different parts of the world (Rissler et al., 2004; Bougiatioti   A detailed description of the instruments is given in Gani et
et al., 2011; Engelhart et al., 2012) and in India, in places     al. (2019) and Bhandari et al. (2020).
like Kanpur (Bhattu and Tripathi, 2014, 2015; Ram et al.,             The SMPS was comprised of a differential mobility anal-
2014), Mahabaleshwar (Leena et al., 2016), and the eastern        yser (DMA; TSI 3081), an electrostatic classifier (TSI 3080),
Himalayas (Roy et al., 2017). However, no CCN measure-            an X-ray aerosol neutralizer (TSI 3088), and a water-based
ments or estimates have been developed so far for Delhi.          condensation particle counter (CPC; TSI 3785). The ambi-
There is only one study that has estimated aerosol hygroscop-     ent air was sampled in the size range 12–560 nm, with a time
                                                                  difference of 135 s between two scans. The sheath-to-aerosol

Atmos. Chem. Phys., 20, 6953–6971, 2020                                             https://doi.org/10.5194/acp-20-6953-2020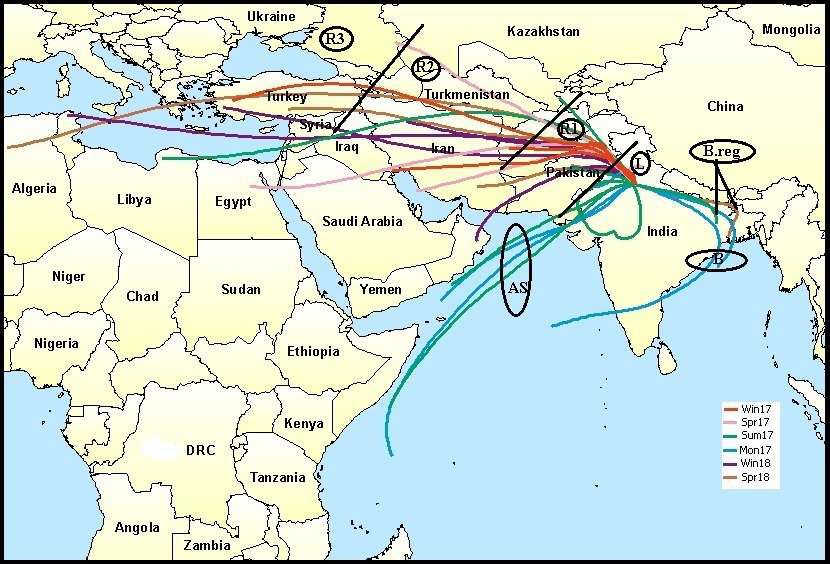
Z. Arub et al.: Air mass physiochemical characteristics over New Delhi                                                      6955

flow ratio was 4 : 1, and the total flow drawn by the CPC was      The reference residuals for HOA, BBOA, and OOA
1 L min−1 . The two dominant modes (Aitken and accumula-           (RRef_HOA , RRef_BBOA , RRef_OOA ) were then calculated us-
tion) are well captured within this size range. The ACSM           ing standard deviations of reference profiles (SDf57 _Ref_HOA ,
sampled the inlet air at a flow rate of 0.1 L min−1 with a time    SDf57 _Ref_BBOA , SDf57 _Ref_OOA ), as given below for HOA in
resolution of ∼ 1 min. The calibration procedures and data         Eq. (2):
processing are discussed in Gani et al. (2019). The ACSM                        q
collected time-resolved NRPM1 (non-refractory PM1 ) based          RRef_HOA = (SDf57 _Ref_HOA )2 + (SDf60 _Ref_HOA )2 .       (2)
on species that volatilize by 600 ◦ C and included NO−       −
                                                       3 , Cl ,
   2−      +                                                       The residuals of the cluster means were then compared with
SO4 , NH4 , and organics.
                                                                   the reference residuals as per the six conditions described in
2.2   Qualitative separation of organic aerosols as                detail in Sect. S1 in the Supplement and classified as HOA,
      BBOA, HOA, and OOA                                           BBOA, OOA, or mixed.

                                                                   2.3   Estimation of κ and CCN
The composition data presented in this work were collected
in the DAS study. PMF (positive matrix factorization) anal-        The ACSM data were used to calculate κ as per the following
ysis was conducted on the 15 months in the dataset. As a           mixing rule in Eq. (3) (Petters and Kredenweis, 2007):
result, biomass-burning organic aerosol (BBOA) could be re-            X
solved as a separate factor only in spring 2018. This inability    κ=     i κi ,                                          (3)
to resolve primary organic aerosol (POA) to separate factors,            i
namely hydrocarbon-like organic aerosol (HOA) and BBOA,
                                                                   where i and κi represent the volume fractions and individ-
was attributed to the unit mass resolution of the instrument
                                                                   ual hygroscopicity parameters of the various components.
(Bhandari et al., 2020, and references therein). Owing to the
                                                                   The inorganics were represented by (NH4 )2 SO4 , NH4 Cl, and
lack of explicit BBOA and HOA separation in all seasons, the
                                                                   NH4 NO3 . The organic κi was taken as 0.1 (Gunthe et al.,
Ng et al. (2010) compilation of profiles was analysed, com-
                                                                   2009, 2011; Dusek et al., 2010; Rose et al., 2011). κi val-
bined with the profiles identified in spring in Delhi. It was
                                                                   ues were taken as 0.61 for (NH4 )2 SO4 , 1.02 for NH4 Cl, and
observed that spring 2018 profiles fell within the bounds of
                                                                   0.67 for NH4 NO3 (Sullivan et al., 2009; Petters and Kreden-
the uncertainty of the Ng et al. (2010) compilation. Thus, Ng
                                                                   weis, 2007). The density values to estimate the volume frac-
et al. (2010) reference profiles were utilized for source attri-
                                                                   tion of the inorganic constituents were taken as 1770 kg m−3
bution of each cluster. While factor profiles can differ across
                                                                   for (NH4 )2 SO4 , 1519 kg m−3 for NH4 Cl, and 1720 kg m−3
the world, taking regionally relevant profiles together with
                                                                   for NH4 NO3 (Haynes et al., 2014). The density of organics
those usually employed as reference profiles for PMF analy-
                                                                   was taken as 1500 kg m−3 (Bougiatioti et al., 2009). κ for BC
sis likely accounts for this variability. As a part of the anal-
                                                                   was taken as zero, as reported in several studies (Hong et al.,
ysis conducted here, the mean strength at the relevant m/z
                                                                   2014; Leng et al., 2014; Wu et al., 2013).
(s) (m/z 57 and 60) and the standard deviation (SD) of the
                                                                      It should be noted that we assumed that the κ calculated
profiles at these m/z (s) were utilized in the analysis.
                                                                   from NRPM1 data of ACSM represents the bulk hygroscop-
   Organic aerosols were qualitatively segregated by compar-
                                                                   icity parameter in the absence of size-resolved measurements
ing the m/z ratios of f57 and f60 with the reference pro-
                                                                   and is a limitation of this work. The difference due to the as-
files of BBOA (f57 : 0.0337±0.00884, f60 : 0.025±0.00521),
                                                                   sumption cannot be accounted for and should be investigated
HOA (f57 : 0.0838 ± 0.00378, f60 : 0.00227 ± 0.00214), and
                                                                   in the future. However, it is reported that for κ > 0.1, CCN
oxygenated organic aerosol (OOA) (f57 : 0.00997 ± 0.00786,
                                                                   closures within 20 % can be achieved assuming bulk com-
f60 : 0.00571±0.00349), as reported by Ng et al. (2010). This
                                                                   position and internal mixing (Wang et al., 2010). Tempera-
was done by first calculating the cluster means of f57 and f60
                                                                   ture, relative humidity (RH), and the calculated κ were then
for each cluster (Table 2). This was followed by an evaluation
                                                                   used to calculate the critical diameter (Dc ) from the multi-
of residuals. Residuals represent the deviation of the cluster
                                                                   component κ-Köhler theory (Bhattu and Tripathi, 2015). The
means from the reference profiles. The HOA, BBOA, and
                                                                   temperature and RH data are available from the RK Puram
OOA residuals (RHOA , RBBOA , and ROOA ) were then cal-
                                                                   site (∼ 3–4 km aerial distance from the measurement site)
culated based on cluster means of f57 and f60 (CMf57 and
                                                                   maintained by the Central Pollution Control Board (CPCB),
CMf60 ), with respect to the corresponding means of refer-
                                                                   India. NCCN was then estimated by integrating the size dis-
ence profiles (RMf57 and RMf60 ), as given below for HOA
                                                                   tribution obtained from SMPS above Dc . The CCN esti-
in Eq. (1):
                                                                   mates were obtained for the supersaturation (SS) of 0.1 %,
      q                                                            0.15 %, 0.2 %, 0.35 %, 0.4 %, 0.5 %, 0.6 %, 0.7 %, 0.75 %,
RHOA = (CMf57 _HOA − RMf57 _HOA )2                                 0.8 %, 0.85 %, and 1 %. However, for the sake of detailed
                                                                   analysis, 0.1 %, 0.4 %, and 0.8 % were chosen: 0.1 % rep-
        +(CMf60 _HOA − RMf60 _HOA )2 .                      (1)    resents the condition when the effect of chemical composi-

https://doi.org/10.5194/acp-20-6953-2020                                            Atmos. Chem. Phys., 20, 6953–6971, 2020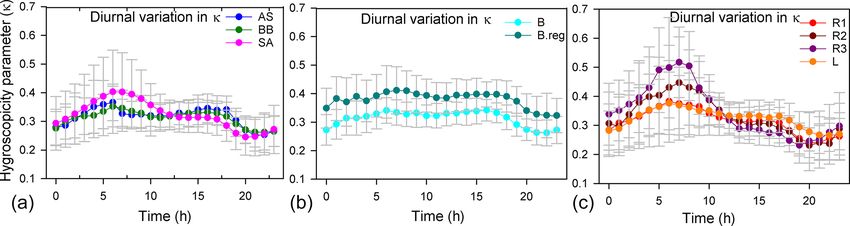
6956                                                 Z. Arub et al.: Air mass physiochemical characteristics over New Delhi

tion is expected to be the highest, 0.4 % represents the con-      benzenei (o) = 2.31. [OH] is not constant and varies consid-
dition for convective clouds, and 0.8 % represents a high-         erably temporally and spatially, but due to the unavailability
supersaturation state, when almost all aerosols tend to get        of data of its variation for Delhi, it was assumed constant for
activated as CCN.                                                  ageing calculation.

2.4    Air mass characterization
                                                                   3     Results and discussion
To characterize the air masses, the Hybrid Single Particle La-
grangian Integrated Trajectory (HYSPLIT) model was used
                                                                   The HYSPLIT analysis revealed that the north-western di-
(Draxler and Rolph, 2003) to determine the major pathways
                                                                   rection is the most dominant direction, which is representa-
of aerosols reaching Delhi. The 5 d back-trajectory analysis
                                                                   tive of SA air masses, and within it, R1 is the most domi-
was done at the receptor site at a height of 500 m. The clus-
                                                                   nant, indicating that overall, the emissions from Pakistan and
ter analysis was then performed seasonally to identify the
                                                                   Afghanistan and the sources en route govern Delhi’s aerosol
cluster mean trajectories per season. These mean trajecto-
                                                                   characteristics. However, the chemical signatures were po-
ries were then again re-clustered to identify three main clus-
                                                                   tentially different for the various clusters, which explains the
ters based on the directions of the mean cluster trajectories:
                                                                   variation in aerosol properties with time. Due to the differ-
the Arabian Sea (AS) branch (16.5 % of total trajectories),
                                                                   ent nature of sources and pathways, aerosol properties vary,
the Bay of Bengal (BB) branch (13 % of total trajectories),
                                                                   resulting in different hygroscopic properties and CCN form-
and the southern Asian (SA) branch (70.5 % of total trajecto-
                                                                   ing potential. These aspects are discussed in the following
ries). The BB branch was further classified as B (54 %) and
                                                                   sections.
B.reg (45 %), where B represents the air masses reaching the
sea, while B.reg represents the air masses that aligned to-
                                                                   3.1    Introduction to characteristics and sources of air
wards reaching the Bay of Bengal but did not hit the sea.
                                                                          masses
The SA branch was partitioned into L (17.5 %), R1 (54 %),
R2 (18 %), and R3 (11 %). L represents the local trajecto-         Out of the three main branches, the SA branch was the most
ries originating within India, mainly from Delhi, Punjab, and      anthropogenically contaminated, followed by BB and AS
Haryana. R1 represents trajectories coming from Pakistan           branches, as indicated by the mean NRPM1 mass concen-
and Afghanistan. R2 represents trajectories originating from       trations: 125.2 ± 91.6, 45.9 ± 23.3, and 32.5 ± 20.6 µg m−3 ,
Iran. R3 is representative of all trajectories beyond these, in-   respectively (Fig. 2a). The total NRPM1 loading for the SA
cluding a portion of South Africa, the Mediterranean Sea,          branch followed the sequence: NRPM1(L) < NRPM1(R3) <
and Turkey. The seasonal clusters for the winter, spring, sum-     NRPM1(R1) < NRPM1(R2) . Amongst the SA branches, L
mer, and monsoon of the year 2017 and winter and spring of         was associated with the lowest organic (52.8 ± 40.6 µg m−3 )
the year 2018 are shown in Fig. S1 in the Supplement. The          and inorganic (42.1 ± 33.1 µg m−3 ) content, while R2 had
re-clustering is shown in Fig. 1. All the chemical speciation      the maximum organic (85.4 ± 59.8 µg m−3 ) and inorganic
data from ACSM and size distribution data from SMPS were           (57.9±47.5 µg m−3 ) content. A summary of the overall char-
then categorized as per the classification discussed above and     acteristics is given in Table 1. The prominent sources for the
used in the following discussion.                                  SA air mass include metal processing industries (Haryana
                                                                   and Delhi NCR), coke and petroleum refining (Punjab),
2.5    Aerosol ageing estimation
                                                                   thermal power plants (Pakistan, Punjab, and NCR Delhi),
The NOx , toluene, and benzene data inventory for the entire       agricultural-residue burning (Punjab and Haryana), soil dust
campaign was taken from the CPCB for RK Puram, when-               (Pakistan, Punjab) (Jaiprakash et al., 2017), and coal mines
ever available. The data were not available for branch B. To       in Pakistan, where non-ideal burning of (NH4 )2 SO4 occurs
determine the photochemical ageing of aerosols, toluene and        (Chakraborty et al., 2015).
benzene concentrations were used to calculate the life (in            When comparing the BB branches, total NRPM1 for B
hours), as per Nault et al. (2018) in Eq. (4):                     (41.9 ± 20.8 µg m−3 ) was slightly less than that for B.reg
                                                                   (47.3±25.4 µg m−3 ), and this can be attributed to the fact that
                  1                                                the B.reg air mass does not travel over water (originates adja-
t =−
     [OH] × (ktoluene − kbenzene )                                 cent to the coastline) but is subject to its influence, while the
                                                                   B air mass travels over water and is therefore cleaner. B.reg

        toluenei (t)           toluenei (o)
  × ln                 − ln                    ,            (4)    had a slightly higher inorganic and organic content than that
       benzenei (t)           benzenei (o)
                                                                   of B.
where [OH] = 1.5×10⁶ molecules cm−3 (Nault et al., 2018),             The relatively higher abundance of aerosols of BB over
ktoluene = 2.3 × 10⁻¹² exp(−190/T ), and kbenzene = 1.8 ×          AS can be attributed to both the sources and the pathways of
10−12 exp(340/T ) (Atkinson et al., 2006) are the rate con-        air masses. In terms of source, the Bay of Bengal is more an-
stants for each aromatic compound, toluenei (o) = 1.85 and         thropogenically impacted than the Arabian Sea, as concluded

Atmos. Chem. Phys., 20, 6953–6971, 2020                                              https://doi.org/10.5194/acp-20-6953-2020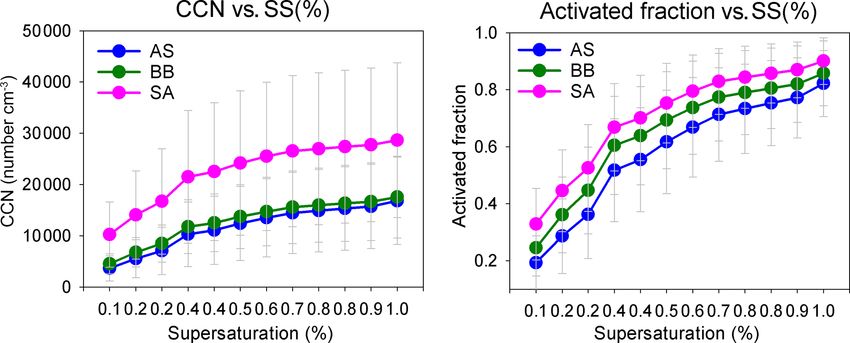
Z. Arub et al.: Air mass physiochemical characteristics over New Delhi                                                                         6957

Figure 1. HYSPLIT grouping of cluster mean trajectories based on directions and distances of source regions. Cluster mean trajectories
were obtained for all seasons and clubbed as per directions. AS branch originated from the Arabian Sea; BB branch, with sub-branches B
and B.reg, originated from Bay of Bengal; and SA branch, with sub-branches L, R1, R2, and R3 from the north-western direction, originated
mainly on the southern Asian landmass. The map layer used is from “World Countries (Generalized)”, by Esri, Garmin International (2010,
https://www.arcgis.com/home/item.html?id=170b5e6529064b8d9275168687880359, last access: 17 May 2020). © Esri, Garmin. All rights
reserved. This map is intellectual property of Esri, Garmin, and used under license. Further details may be found at https://www.esri.com
(last access: 17 May 2020).

Table 1. Mean values of NRPM1 species and BC (µg m−3 ) for all clusters.

 Cluster       NRPM1             BC           NH+
                                                4             Cl−         NO−
                                                                            3          SO2−
                                                                                         4           Inorg.         POA          OOA            Org.
 A          32.5 ± 20.6     7.7 ± 7.6     3.6 ± 2.5      0.5 ± 1.4     2.3 ± 2.9    7.6 ± 4.6    14.0 ± 9.3     7.4 ± 8.1    10.3 ± 7.0   18.5 ± 13.6
 BB         45.9 ± 23.4     6.8 ± 5.1     4.8 ± 3.2      0.6 ± 1.1     4.3 ± 3.8    9.9 ± 6.5   19.7 ± 12.4     7.6 ± 5.4    16.3 ± 7.8   26.2 ± 14.1
 SA        125.2 ± 91.6   12.1 ± 10.7   12.7 ± 11.1    12.1 ± 20.4   13.3 ± 11.8   12.7 ± 9.7   50.8 ± 44.0   39.5 ± 43.7   36.3 ± 24.2   74.4 ± 58.1
 B          41.9 ± 20.7     5.6 ± 5.2     4.6 ± 2.6      0.5 ± 0.7     4.2 ± 3.8    9.1 ± 5.7   18.5 ± 11.0     7.2 ± 4.3    15.5 ± 7.3   23.4 ± 11.5
 B.reg      47.3 ± 25.4     6.8 ± 5.1     5.2 ± 3.8      0.8 ± 1.4     4.5 ± 3.8   10.7 ± 7.3    21.1 ± 3.4     8.5 ± 7.2    17.4 ± 8.4   26.2 ± 16.2
 L          94.9 ± 68.1    12.2 ± 9.8   10., 4 ± 8.2    5.2 ± 12.2    10.1 ± 9.7   16.4 ± 9.8   42.0 ± 33.0   18.9 ± 23.1   29.5 ± 21.7   52.9 ± 40.6
 R1        129.1 ± 97.6   12.6 ± 11.3   12.3 ± 10.9    11.6 ± 19.4   13.7 ± 12.6   12.5 ± 7.6   50.2 ± 44.2   44.2 ± 46.7     37.7 ± 26   79.0 ± 6.32
 R2        143.2 ± 92.5   11.4 ± 10.3   14.6 ± 12.2    16.4 ± 23.6   15.6 ± 11.7   11.3 ± 6.7   57.9 ± 47.5   49.4 ± 49.5   38.9 ± 22.4   85.4 ± 59.9
 R3        127.1 ± 81.6    10.4 ± 8.7   15.0 ± 13.4      19.6 ± 26   13.1 ± 10.0    9.3 ± 4.8   56.9 ± 49.7   35.7 ± 31.8   34.3 ± 18.4   70.2 ± 14.7

by the ICARB campaign (Kalapureddy et al., 2009). Previ-                     over the IGP is largely composed of inorganic oxidized mat-
ous studies (Nair et al., 2008a, b; Moorthy et al., 2008) re-                ter (IOM), including fly ash from coal-fired power plants and
ported higher aerosol number concentration (NCN ), as well                   mineral matter from open crop waste burning (Habib et al.,
as black carbon (BC) concentration, over the Bay of Ben-                     2006). The AS air mass travels over western India and brings
gal than over the Arabian Sea, in all size ranges within the                 pollution from both fossil fuel combustion and desert dust
marine boundary layer as well as the vertical column. The                    (Habib et al., 2006).
BB air mass travelled over the Indo-Gangetic Plain (IGP),
and the AS air mass travelled across western India and the                   3.2    PM1 chemical composition of different air masses
desert region of Rajasthan. Based on previous emission es-
timates (Habib et al., 2006), the emission fluxes from fossil
                                                                             Mass closure between SMPS size distribution data and the
fuel dominate the aerosol burden over the IGP. The aerosol
                                                                             sum of ACSM species together with BC was achieved (R 2 =

https://doi.org/10.5194/acp-20-6953-2020                                                         Atmos. Chem. Phys., 20, 6953–6971, 2020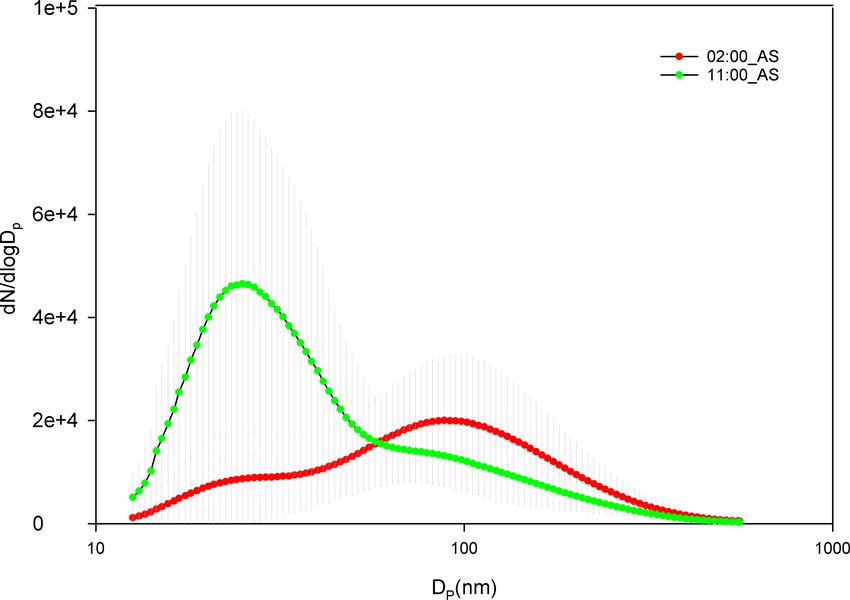
6958 Z. Arub et al.: Air mass physiochemical characteristics over New Delhi
2−
POA and OOA, followed by NO− −
3 , SO4 , and Cl , domi-
nated the PM composition for the SA air mass, while OOA,
followed by SO2−4 and OOA, was dominant for BB and AS
air masses. High chloride was a special feature of the SA air
mass which was not apparent in the other two branches.
NH+4 was assumed to be the dominant cation based on
high aerosol neutralization ratio (ANR) values (mean val-
ues ranging from 0.95 to 0.85). The ANR is defined as the
normalized ratio of the measured NH+ 4 concentration to the
NH+ 4 concentration needed for full neutralization of the an-
ions and calculated as per Eq. (5) (Zhang et al., 2007):
NH+
4 meas
ANR =
NH+
4 neut
(NH+
4 /18)
= . (5)
(2 × SO2− − −
4 /96) + (NO3 /62) + (Cl /35.5)
Detailed ANR values are given in Table S1 in the Supple-
ment. ANR values revealed that while AS, B, and L branches
were completely neutralized, B.reg, R1, R2, and R3 were
only partly neutralized, indicating that minor components of
sulfate, chloride, and nitrate may be bound to non-volatile
salts such as NaNO3 , NaCl, or Na2 SO4 or are associated with
organics as organosulfates, organochlorides, or organoni-
Figure 2. Mean values of (a–c) NRPM1 ; (d–f) organics, inorganics, trates, evidence for which is shown in a previous DAS study
and BC; and (g–i) PM1 species (from top to bottom) for the various (Bhandari et al., 2020).
air masses. Panels (a), (d), and (g) are for AS, BB, and SA; (b), (e), To determine the dominant salts, NH+ 4 ions were neutral-
and (h) are for BB branches (B and B.reg); and (c), (f), and (i) are 2−
ized with SO4 ions. The speciation of salts of NH+ 4 and
for SA branches (L, R1, R2, and R3).
SO2−4 was determined by the molar ratio of NH +
4 to SO2−4
ions (R[SO2− 2−
4 ]). R[SO4 ] > 2 is indicative of (NH4 )2 SO4 ,
Table 2. Cluster means of f57 and f60 values for all branches,
where SD means standard deviation. while 1 < R[SO2− 4 ] < 2 indicates a mixture of (NH4 )2 SO4
and NH4 HSO4 , and R[SO2− 4 ] < 1 indicates a mixture of
Cluster f57 f60 H2 SO4 and NH4 HSO4 (Nenes et al., 1998; Asa-Awuku et
al., 2011; Padró et al., 2012). For Delhi, R[SO2− 4 ] > 2 was
Mean SD Mean SD
obtained for all branches, indicating that (NH4 )2 SO4 was
A 0.02389 0.00777 0.004061 0.001199 present in all branches. Furthermore, the non-sulfate NH+ 4
BB 0.0205 0.006107 0.004294 0.000962 ions [ns-NH+ +
4 ] were calculated, as per [ns-NH4 ] = [NH4 ]−
+
SA 0.02499 0.007663 0.007089 0.003569
2 × [SO2− 2
4 ]. The r values were then determined for the cou-
B 0.02088 0.005959 0.004368 0.000916 pling of ns-NH4 ions with (a) Cl− ions, (b) NO−
+
3 ions,
B.reg 0.01998 0.006266 0.004192 0.001012 and (c) [NO− 3 + Cl −
] ions jointly (Du et al., 2010). All r 2
L 0.0239 0.007179 0.006023 0.002404 values are detailed in Table S1. This analysis revealed that
R1 0.0254 0.007878 0.00717 0.003861 (NH4 )2 SO4 is the dominant salt for AS and B branches based
R2 0.02509 0.00764 0.007851 0.003576 on r 2 + 2− values of 0.78 for AS and 0.75 for BB 0.75.
NH4 /SO4
R3 0.02427 0.006971 0.007084 0.002992
NH4 Cl formation for SA was confirmed by a high r 2 value
(0.90) for ns-NH+ −
4 coupling with Cl . A similar finding is
reported by Bhandari et al. (2020) based on the coupling of
0.83) as detailed in our parallel paper (Gani et al., 2019). The the NH4 Cl factor with wind direction. Coupling of ns-NH+ 4
2−
NRPM1 species (NH+ − −
4 , Cl , NO3 , SO4 , POA, and OOA) with NO− 3 revealed a good correlation for B (0.70) and B.reg
and BC varied significantly for the different air masses, both (0.63) (Fig. S6). In all cases, an increase in r 2 for combined
in terms of the mass of species (Fig. 2c) and the diurnal NO− −
3 +Cl as compared to individual ions indicates that both
patterns (Fig. 3), leading to different aerosol chemistry and HNO3 and HCl were synchronously neutralized by NH3 . If
chemical reactions. A summary of the average mass of each Cl− and NO− 3 are present in the fine mode, they are ex-
species for all air masses is detailed in Table 1. In brief, both pected to be in the form of their respective ammonium salts
Atmos. Chem. Phys., 20, 6953–6971, 2020 https://doi.org/10.5194/acp-20-6953-2020Z. Arub et al.: Air mass physiochemical characteristics over New Delhi 6959
2−
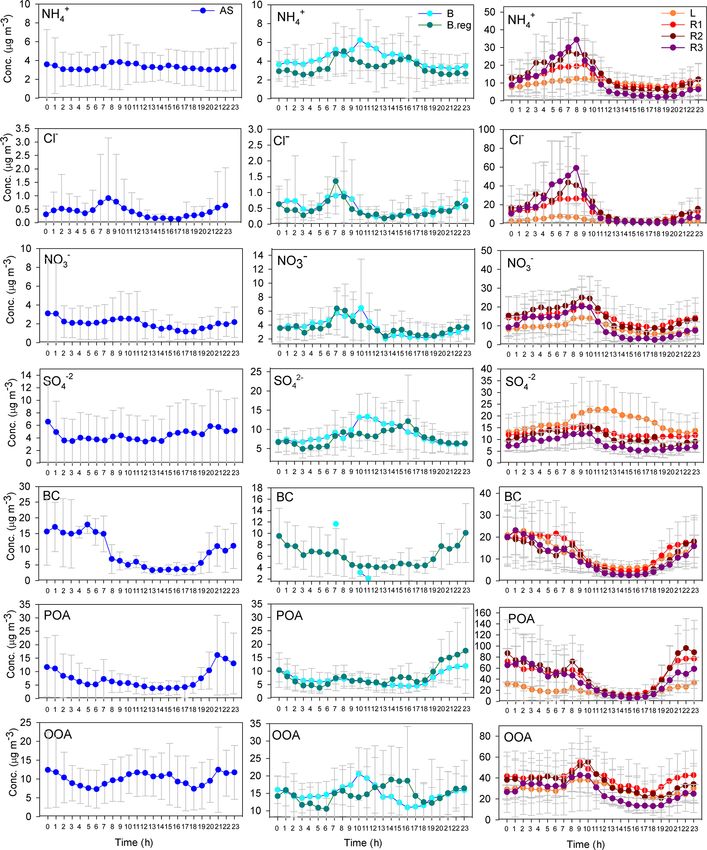
Figure 3. Diurnal variation in NRPM1 species (NH+ − −
4 , Cl , NO3 , SO4 , POA, and OOA) and BC for AS on the left, BB (B and B.reg) in
the middle, and SA (L, R1, R2, and R3) air masses on the right.
https://doi.org/10.5194/acp-20-6953-2020 Atmos. Chem. Phys., 20, 6953–6971, 20206960 Z. Arub et al.: Air mass physiochemical characteristics over New Delhi
(Harrison and Pio, 1983). Thus, the dominating salts were salt mines in Pakistan that might contribute to high Cl−
(NH4 )2 SO4 for AS, (NH4 )2 SO4 and NH4 NO3 for the BB air in other branches compared to L; (b) locally, plastic burn-
mass, and NH4 Cl for SA and its sub-branches. ing, refuse burning, and soil dispersion; (c) biomass burning,
The organic speciation revealed that AS organics were which is a very prominent feature of the SA branch, as in-
BBOA; BB (both B and B.reg) organics were a mix of the dicated by f57 and f60 values and also by a large number of
three; and SA organics were BBOA, wherein L, R1, and R2 fire counts from MODIS fire-count data (Bhattu and Tripathi,
organics were BBOA while R3 organics were both HOA and 2015), dominantly in Punjab, Haryana, and a few places in
BBOA. Pakistan; (e) coal-based thermal power plants in Delhi, Pun-
The NOx emissions (in µg m−3 ) for the SA air mass jab, Haryana, and Pakistan; and (f) small- and medium-scale
(96.88 ± 127.22) were the highest, followed by those in BB metal processing industries in Delhi, Punjab, and Haryana,
(38.30 ± 64.79) and then those in the AS (36.71 ± 68.13) air where HCl is used in a pickling process of hot and cold
mass. BB is representative of B.reg only, as NOx data for the rolling of steel sheets and acid recovery from fume gener-
B air mass were not available. NOx data for AS were also ation is not practised (Jaiprakash et al., 2017).
scarce. The SA aerosols exhibited less ageing (4.38 ± 4.49 h) As far as the increase in chloride with the increasing length
compared to B.reg. (11.58 ± 3.45 h), but both were represen- of trajectories is concerned, the most plausible explanation is
tative of aged aerosols. Ageing was not calculated for AS due biomass burning. It is pointed out in Sect. 3.2 that BCwb
to very little data availability. contribution increases as the air mass trajectories become
To determine the presence of biomass burning and traffic distant, a feature similar to chloride emissions. There was
emissions, BCwb (wood-burning component) and BCff (traf- a marked similarity in the diurnal patterns of NH+ 4 and Cl
−
−
fic component) for all air masses were determined, based on ions such that the sequence of [Cl ] for SA sub-branches
aethalometer data, as per Sandradewi et al. (2008). The con- was also valid for [NH+ 4 ], indicating the formation of NH4 Cl.
tributions of BCwb and BCff are summarized in Table S4. NH4 Cl may also be emitted directly from cement plants (Ch-
Since fossil fuel sources are active year-round, there was a eney et al., 1983) in Punjab. The equilibrium constant for Cl−
strong presence of BCff, ranging from 70 % to 86 %. How- is more sensitive to ambient temperature than NO− 3 , as a re-
ever, biomass burning is only active during certain specific sult of which, during the daytime, a large amount of NH4 Cl
times for short durations and is very prominent in the north- dissociates to form NH3 and HCl if the temperature exceeds
western direction for the SA air masses. It was observed 10 ◦ C (Kaneyasu et al., 1999). The diurnal patterns of both
that the more distant air masses exhibited a higher BCwb [NH+ −
4 ] and [Cl ] exhibited a sharp decrease after 08:00 LT
contribution compared to those originating within proxim- (all times listed in the paper are in local time, UTC+5:30)
ity. Hence, while L was associated with 13.9 % BCwb, R3 in the morning, which is obvious, since NH+ 4 for the SA
exhibited 29.2 % BCwb. The BCwb contribution for A and air mass is mostly associated with Cl− . At the same time
BB air masses was 21 %. It can thus be concluded that both [NO− 3 ] showed an increase between 09:00 and 10:00 and
biomass burning and traffic emissions are important sources then started decreasing, but the rate of decrease was lower
contributing to the chemical composition of the various air than NH4 Cl. This is expected, as NH4 NO3 is more stable
masses. than NH4 Cl (Kaneyasu et al., 1999). During winter, the am-
bient temperature drops slightly below 10 ◦ C in the morning
3.3 Diurnal variation in chemical species and probable hours, increases sharply after 08:00 to reach a maximum at
sources 14:00, and then again starts decreasing and reaches around
10 ◦ C at midnight (Gani et al., 2019). Since during winters,
3.3.1 The southern Asian air mass the air mass comes mostly from the north-western direction
of the SA air mass, it is evident that the formation and disso-
This air mass ranked highest in NH+ 4 concentration com- ciation of NH4 Cl were governed by the ambient temperature
pared to other branches. Locally (i.e. for L), the source for at the receptor site.
NH+ 4 may be attributed to NH3 gas from the nearby agri- The reduction in chloride concentrations at midday can
cultural fields of the Indian Agricultural Research Institute also be attributed to sulfate substitution mechanism, when
(IARI) (Sharma et al., 2014). For R1, R2, and R3, sharp sulfate formation enhances, and was also marked by the ra-
spikes in early morning hours seen in the diurnal patterns tio R[SO2− 4 ] ratio greater than 2 for L, R1, R2, and R3. This
of NH+ 4 indicate its formation from ammonia as a result is valid especially for L, wherein [SO2− 4 ] increased signifi-
of industrial exhaust of untreated ammonia. This is because cantly. However, the diurnal patterns of [SO2− +
4 ] and [NH4 ]
its diurnal variation is very similar to the diurnal of NH3 did not resemble each other, indicating that (NH4 )2 SO4 may
emissions of an industrial origin (Wang et al., 2015). A be present in small amounts, but primarily SO2− 4 is associated
very prominent feature of the SA that made it distinct from 2−
elsewhere. Hence, SO4 in combined form can be expressed
the other two air masses was the presence of high chloride
in two ways: (a) small amounts of (NH4 )2 SO4 and (b) mostly
([Cl− ]L < [Cl− ]R1 < [Cl− ]R2 and [Cl− ]R3 ). High Cl− in the
in combination with K+ . Thus, the sharp jump in [SO2− 4 ] in
SA branch can be attributed to several factors: (a) Khewra
Atmos. Chem. Phys., 20, 6953–6971, 2020 https://doi.org/10.5194/acp-20-6953-2020Z. Arub et al.: Air mass physiochemical characteristics over New Delhi 6961
locally originated air masses in the late morning and after- that they come from primary emissions. The diurnal profiles
noon hours may be attributed to SO2 emissions. SO2 emis- for all branches were similar, which shows a decline as the
sions in India are primarily attributed to power generation day proceeds, followed by an increase as the night proceeds.
plants that make use of coal combustion as the chief source OOA was present significantly in all the three branches but
(Reddy and Venkataraman, 2002), followed by transporta- is maximum for SA. Its diurnal variation resembled that of
tion. Such coal-based power plants are located in the IGP, NO− 2
3 (r = 0.78), indicative of its semi-volatile nature. OOA
with a high concentration in Haryana. SO2 dissolves readily and NO− 2
3 correlations were strongest for L (r = 0.91), fol-
in water and can form sulfite ion, which in the presence of lowed by R2 (r = 0.85), R3 (r = 0.81) and R1 (r 2 = 0.75).
2 2
ozone can form sulfate ion (Erickson et al., 1977). H2 SO4
formed from the reaction of SO2 and ozone can react with 3.3.2 The Bay of Bengal air mass
NH3 to form NH4 HSO4 , which combines with NH3 again
to form (NH4 )2 SO4 (Stelson and Seinfeld, 1982; Seinfeld,
[Cl− ] was lower in this air mass compared to that in SA.
1986). Since the ozone spiked during the daytime (10:00–
For both of the BB branches, fossil fuel combustion was the
16:00), more sulfate formation was seen when ozone was
most likely source of Cl− , as fossil fuel emissions dominate
maximum. The diurnal variation for ozone is explained in
the IGP. Cl− for BB was not correlated with ns-NH+ 4 and
Gaur et al. (2014) for Kanpur, where a spike in ozone lev-
may be present in the form of methyl chloride, methylene
els was seen during 10:00–16:00. A peak in sulfate concen-
chloride, carbon tetrachloride, and tetrachloroethene (Ho et
tration was also previously observed for the foggy period in
al., 2004).
Kanpur at 10:00 due to the resumption of photochemical ac-
Fossil fuel combustion from coal plants along the IGP can
tivity after fog dissipation (Chakraborty et al., 2015). SO2− 4 be explained as a common source for both SO2− 4 and NH4
+
in SA branches may also combine with K+ , as K+ is pro- 2
ions, leading to (NH4 )2 SO4 formation (r + 2− = 0.78).
duced in biomass burning. Evidence for the presence of K+ NH4 /SO4
along with SO2− 4 in the accumulation mode is reported in This was also seen in the diurnal profiles of [SO2− 4 ] and
Fuzzi et al. (2007). SO2− − [NH+ 4 ], both of which exhibited a sharp spike in the early
4 and NO3 emissions may also be
associated with secondary formation for R1, R2, and R3 due morning hours between 10:00 and 16:00. SO2 emissions,
to industrial emissions from metal product manufacturing in- as explained for SA via photochemical oxidation by O3 in
dustries in Punjab and Haryana; large-scale manufacturing of combination with NH3 , can lead to (NH4 )2 SO4 formation.
2−
porcelain insulators; switchgear in Islamabad (Jaiprakash et For the B.reg branch, the diurnal profiles of NH+ 4 and SO4
al., 2017); and steel rolling mills in Iran, Iraq, and Turkey exhibited double spikes (M pattern, which is a typical fea-
and Punjab. ture of NOx profile for traffic emissions) during heavy traf-
The NO− 3 levels were very high for SA. The high
fic hours (06:00–08:00 and around 16:00–19:00), indicat-
NO− 3 in SA can be explained by the non-ideal burning of ing (NH4 )2 SO4 formation. NO from automobile exhaust can
NH4 NO3 and NOx emissions due to mining equipment in also form NH3 in three ways catalytic convertors (Gandhi
the coal mines in Pakistan, leading to high NO− 3 formation
and Shelf, 1991), which in combination with SO2 , formed
(Chakraborty et al., 2015). It is mentioned in Sect. 3.2 that due to pyrolysis of sulfide fuels and subsequent oxidation,
NOx emissions in the SA branch are very high. NH+ 4 neu-
can lead to (NH4 )2 SO4 formation.
tralizes NO− simultaneously with Cl −
; however, the correla- The correlation of [NO− +
3 ] with [ns-NH4 ] was appreciably
3
tion of [NO− +
3 ] with [ns-NH4 ] is moderate for SA. Therefore,
high for both B and B.reg. For both these branches, the fossil
−
it is expected that NO3 might be associated with K+ and fuel combustion resulting in NO− 3 emissions in combination
Na+ , since biomass burning results in K+ and Na+ emis- with NH+ 4 (Rajput et al., 2015; Pan et al., 2016) can lead
sions (Fuzzi et al., 2007). K+ and Na+ exhibit a high affinity to NH4 NO3 formation. This is also evident from the diurnal
for nitrate during neutralization reactions, thus aiding in par- profile of NO− +
3 that shows a very similar pattern to NH4 and
ticulate nitrate formation (Bi et al., 2011). This is in addition is expected to be in the form of NH4 NO3 . The diurnal profiles
to other nitrate sources that are discussed above along with of NO− 3 show a decline as the temperature increases during
SO2− the day and NO− 3 converts back to HNO3 due to its semi-
4 sources for SA.
The BC concentrations were highest for SA, followed by volatile nature.
those in AS and then those in BB. The biomass burning The BC concentration in BB air masses was considerably
in the SA air mass could be a major source of BC besides lower than in the SA air masses. The missing points in the di-
power plants, cement plants, local traffic, and industries. The urnal variability in BC for the B region are on account of the
POA emissions for SA followed the order BC(L) < BC(R3) < unavailability of aethalometer data. The BC in the IGP can be
BC(R1) < BC(R2) . The spikes during the early morning hours emitted from industries (as for B), traffic (as for B.reg), and
and nighttime of the POA diurnal profile may be attributed natural sources (Derwent et al., 2001). For B and B.reg, the
to lower boundary layer heights during the two periods. BC B.reg branch was subjected to a longer duration of anthro-
and POA were well correlated (r 2 = 0.77) for R3, indicating pogenic influence compared to B, which also spent consider-
able time on the water; hence after the early morning hours,
https://doi.org/10.5194/acp-20-6953-2020 Atmos. Chem. Phys., 20, 6953–6971, 20206962 Z. Arub et al.: Air mass physiochemical characteristics over New Delhi
when the various fresh emissions start increasing, the mag- for continental aerosols (Andreae and Rosenfeld, 2008; Pet-
nitude of POA for B.reg exceeds B. However, POA for BB ters and Kreidenweis, 2007; Pöschl et al., 2009; Pringle et al.,
was very low compared to SA. For B.reg, the spike in OOA 2010). Including BC in κ calculations leads to a difference of
during daytime hours was very similar to that of odd oxygen 10 % in κ on average, shifting the mean κ of 0.32 to 0.29. The
(O3 + NO2 ) for Delhi. The Ox profile for Delhi is given in BC mass fraction and volume fractions were 10 % and 9 %,
Tiwari et al. (2015), indicating its production by local pho- respectively. Thus, the change in κ due to the introduction of
tochemistry despite the increase in boundary layer height in BC was not significant.
the afternoon. The similarity in OOA and Ox diurnal profiles κ varied from 0.13 to 0.77, and there was a difference in
was also noted for Kanpur (Chakraborty et al., 2016). the diurnal variation in the hygroscopicity parameter for the
various air masses (Fig. 4). A similar finding was observed
3.3.3 The Arabian Sea air mass in China, with a mean κ of 0.3, varying in the range 0.1–
0.5 (Rose et al., 2010). Recently, κ of 0.42 ± 0.07 was also
Chloride amounts were very low for AS compared to that in reported for PM2.5 for Delhi based on beta attenuation moni-
SA. Biomass burning as indicated by f57 and f60 measure- tor (BAM) measurements of PM2.5 (Wang and Chen, 2019),
ments seems to be the main Cl− contributor to AS and might using an indirect method in the absence of direct measure-
be associated with K+ , which is also emitted along with it. ments. Thus, the dependence of κ on size cannot be underes-
Similar to the cases of the L branch in the case of the SA timated for Delhi and should be dealt with in the future.
air mass and the BB air mass, the power stations in Gujarat Variation in κ with size has been seen in several places
and Rajasthan lead to SO2 emissions. Since the power plants in the world; e.g. at 97 % RH, mass growth factors of 6.95
in this region, over which the AS air mass traverses, are rela- and 9.78 were reported for the size ranges 0.53–1.6 and
tively small in number, the SO2 concentration is much lower 1.6–5.1 µm, respectively, on the Slovenian coast (Turšič et
compared to that in the BB air masses. SO2 emissions subse- al., 2006). Aitken mode κ was 0.25, while the accumulation
quently lead to (NH4 )2 SO4 formation, which was the main mode κ was 0.45 for Beijing (Gunthe et al., 2011). An in-
salt present in this branch and was also evident from the high crease in κ for the higher size regime points to the fact that
correlation between the two ions. (NH4 )2 SO4 may be formed the organic fraction is higher in the smaller size range, while
due to emissions from both power plants and traffic (similar the inorganic fraction increases substantially with size.
to B.reg). Traffic emissions can be understood from the M In the PM1 size range, while κ of 0.1 indicates secondary
2−
pattern in diurnal profiles of NH+4 and SO4 , though the vari- organic aerosol, κ varied from 0.01 to 0.8 for biomass-
ation was not very pronounced and might be suppressed due burning aerosols in lab studies (Petters et al., 2009). κ var-
to power plant emissions. The traffic signal was more clearly ied from 0.15 to 0.25, with lower values (around 0.16) being
implied by the diurnal profile of (NH4 )2 SO4 for AS, as seen observed during the night, when biomass-burning particles
in Fig. S2. The correlation of [NO− +
3 ] with [ns-NH4 ] was very prevailed during wintertime in Athens, Greece (Psichoudaki
−
poor for AS, indicating that NO3 might be associated with et al., 2018). Thus, κ values for Delhi can represent both sec-
K+ and Na+ , similar to B.reg. ondary formation and biomass burning. This is true for Delhi,
Both BC and POA for the AS air mass were less than in which had both POA and OOA in all the air masses, while
the SA air mass. However, compared to BB, BC was slightly BBOA was present in AS and SA air masses, as detailed in
higher and POA was comparable. BC was likely of an in- the preceding sections on chemical properties.
dustrial origin. The POA diurnal profile was similar to the An important observation for all branches is that when
other air masses. Similar to B.reg, the OOA diurnal pattern the inorganic volume fraction (of dominant salt) increased
resembled that of odd oxygen, where the odd-oxygen profile (Fig. S2), during the times when κ was high (Fig. 4), or when
is reported in Tiwari et al. (2015). the organic volume fraction decreased (Fig. S2), a dip in Dc
Thus, the direct emission sources and the precursors (SOx , (Fig. 6) was seen, implying that a larger size regime was
NOx , NH3 , O3 , and Ox ) that lead to particulate matter forma- available for activation. The diurnal variation in κ (Fig. 4)
tion strongly impacted the chemical properties of aerosols. more strongly followed the diurnal pattern of the dominant
The chemical properties of aerosol also impacted the hygro- inorganic salts for a cluster (Fig. S2), since the hygroscop-
scopicity of aerosols, as is discussed in the following section. icity parameters for inorganic salts are considerably higher
than those of organics. Pearson correlation coefficient (r) val-
3.4 Impact of chemical composition on the ues between κ and the salt volume fractions revealed that
hygroscopicity of air masses the diurnal patterns of κ were governed dominantly by vol-
ume fractions of (NH4 )2 SO4 (r: 0.85) for AS, moderately
This study provides the first long-term estimation of aerosol by (NH4 )2 SO4 (r: 0.55) and NH4 NO3 (r: 0.49) for BB,
hygroscopicity in the PM1 regime. The mean κ was ap- and dominantly by NH4 Cl for SA air masses. For the two
proximately the same for all the air masses, which is ∼ 0.3 BB branches, κ of the B branch was governed dominantly
(0.32 ± 0.06 for AS, 0.31 ± 0.06 for BB, and 0.32 ± 0.10 for by (NH4 )2 SO4 (r: 0.78) and moderately by (NH4 )2 SO4 (r:
SA) and in line with the global average value of 0.27 ± 0.21 0.57) and NH4 NO3 (r: 0.54) for B.reg. For SA air masses,
Atmos. Chem. Phys., 20, 6953–6971, 2020 https://doi.org/10.5194/acp-20-6953-2020Z. Arub et al.: Air mass physiochemical characteristics over New Delhi 6963
Figure 4. Diurnal variation in κ with time. Panel (a) is for AS, BB, and SA; panel (b) is for BB branches (B and B.reg), and panel (c) is for
SA branches (L, R1, R2, and R3).
κ of R1, R2, and R3 was governed dominantly by NH4 Cl (r Table 3. Mean values of CCN number concentrations (cm−3 ) at
values of 0.71, 0.89, and 0.95) and jointly by NH4 Cl (r: 0.65) 0.1 %, 0.4 %, and 0.8 % SS for all clusters.
and NH4 NO3 (r: 0.73) for L.
High volume fractions of (NH4 )2 SO4 and NH4 NO3 may Cluster CCN at 0.1 % SS CCN at 0.4 % SS CCN at 0.8 % SS
be attributed to SOx , NOx , and NH3 emissions due to power Mean SD Mean SD Mean SD
plant emissions and traffic. In the SA sub-branches (Fig. 4),
A 3669 2480 11 089 6650 15 339 8149
the spike in κ during the early morning (07:00–08:00) ex-
BB 4558 1945 12 526 5626 16 329 7385
hibited the sequence κ(R3) > κ(R2) > κ(R1) >= κ(L) , and the SA 10 245 6352 22 526 13 439 27 374 14 902
lower spike in late evening (18:00–22:00) exhibited the se-
B 4469 1885 11 699 4900 14 892 5883
quence R3 > R2 < R1 < L and is attributed to NH4 Cl for-
B.reg 4726 2043 14 088 6506 19 040 8993
mation. This implies that during the morning, R3 aerosols
were most hygroscopic, while L aerosols were least hygro- L 8200 4612 18 810 9434 23 161 10 845
R1 10 921 6843 24 053 14 743 28 914 16 265
scopic, while after 09:00, L aerosols were most hygroscopic
R2 11 318 6071 23 736 13 739 28 926 15 111
and R3 aerosols were the least hygroscopic. The flatter curve R3 9555 6077 20 469 10 580 25 971 11 963
of κ can be attributed to two factors: (a) the chloride contri-
bution of distant trajectories decreased very steeply with time
compared to the local emissions, and (b) κ of L was also sup-
plemented substantially by NH4 NO3 . Thus, the source activ- NCCN and af for all branches at 0.1 %, 0.4 %, and
ities by which the chemical properties of aerosols are shaped 0.8 % SS are detailed in Tables 3 and 4, respectively.
impacted the hygroscopicity parameter tremendously. This The total number concentrations (NCN in cm−3 ) fol-
consequently impacted the size regime of aerosols available lowed the sequence NCN(AS) (20 558 ± 9654) < NCN(BB)
for activation and is discussed in the following section. (20 864 ± 9731) < NCN(SA) (31 406 ± 15 168),
and for SA, NCN(L) (27 009 ± 11 651) < NCN(R3)
3.5 Impact of governing parameters on CCN estimates (30 974 ± 12 223) < NCN(R1) (32 772 ± 16 475) < NCN(R2)
of air masses (33 371 ± 14 989), and NCN(B) (19 025 ± 7704) < NCN(B.reg)
(24 333 ± 11 956). Mean NCN values for all branches are
CCN number concentration (NCCN ) for SA listed in Table S2.
(22 526 ± 13 439) was higher compared to that in BB High values of NCCN for Delhi are consistent with other
(12 526 ± 5626) and AS (11 089 ± 6650), where values polluted regions in the world. The relevant statistics for
(cm−3 ) are given at 0.4 % SS. Amongst the SA sub- two highly polluted sites, namely Beijing and Kanpur, are
branches, NCCN followed an increasing order, as NCCN(L) presented by Gunthe et al. (2011) and Bhattu and Tri-
(18 810 ± 9434) < NCCN(R3) (20 469 ± 10 580) < NCCN(R2) pathi (2015), respectively. NCCN was 7660 ± 3460 and 900–
(23 736 ± 13 739) < NCCN(R1) (24 053 ± 14 743), while for 27 000 (in cm−3 ) at 0.46 % SS and in the range 0.18 %–
the B branches, the order of increase in NCCN (cm−3 ) was 0.6 % SS, respectively. The high NCCN is consistent with
NCCN(B) (11 699 ± 4900) < NCCN(B.reg) (14 088 ± 6506) the high NCN . Correspondingly, NCN was 16 800 ± 9100 and
at 0.4 % SS. Correspondingly, the activated fractions ∼ 50 000 (cm−3 ). Even though high number concentrations
(af ) followed the sequence af(SA) (0.70 ± 0.15) < af(BB) of CCN and condensation nuclei (CN) have been reported,
(0.64 ± 0.17) < af(AS) (0.55 ± 0.18), wherein for SA sub- the af was not seen to be so high. The af in Beijing was
branches, af(R3) (0.65 ± 0.16) < af(R2) (0.694 ± 0.16) < af(L) 0.54 ± 0.23 and 0.66 ± 0.23 at 0.46 % SS and 0.86 % SS, re-
(0.692 ± 0.13) < af(R1) (0.71 ± 0.15), and for BB, af(B.reg) spectively. For Kanpur, af was reported as ∼ 0.018–0.54 for
(0.62 ± 0.16) < af(B) (0.65 ± 0.18) at 0.4 % SS. Mean 0.18 %–0.60 % SS. However for Delhi, the af ranged from
https://doi.org/10.5194/acp-20-6953-2020 Atmos. Chem. Phys., 20, 6953–6971, 20206964 Z. Arub et al.: Air mass physiochemical characteristics over New Delhi
Table 4. Mean activated fractions at 0.1 %, 0.4 %, and 0.8 % SS for
all clusters.
Cluster af at 0.1 % SS af at 0.4 % SS af at 0.8 % SS
Mean SD Mean SD Mean SD
A 0.19 0.09 0.55 0.18 0.75 0.15
BB 0.25 0.10 0.64 0.17 0.81 0.14
SA 0.33 0.13 0.70 0.15 0.86 0.10
B 0.25 0.10 0.65 0.18 0.81 0.15 Figure 5. Variation in CCN and activated fraction with SS (%) for
B.reg 0.23 0.10 0.62 0.16 0.80 0.12 AS, BB, and SA air masses.
L 0.31 0.11 0.69 0.13 0.85 0.09
R1 0.34 0.13 0.71 0.15 0.87 0.10
R2 0.35 0.13 0.69 0.16 0.85 0.11 0.4 % SS, SACCN ∼ = ASCCN , BBCCN ; and (c) at 0.8 % SS,
R3 0.30 0.13 0.65 0.16 0.82 0.12 SACCN < BBCCN and ∼ = ASCCN . The explanation for this
observation is that at 0.1 % SS, the CCN was governed by
the accumulation mode, but at 0.4 % and 0.8 % SS, it was
governed more by the Aitken mode. It is the Aitken mode
0.19 for AS, at 0.1 % SS, to 0.86 for R1, at 0.8 % SS, im- that dominantly governs the total number concentration, and
plying that even at low SS, a considerably large number of hence it can be said that CCN is governed by CN at a higher
particles were activated, and at high SS, almost all particles SS and by the accumulation mode at low SS. This is be-
reached the activated state. It should be noted here that the cause as supersaturation increases, Dc increases. At low SS,
statistics for Beijing and Kanpur correspond to the range (3– Dc is high (Dc > 100 nm), almost always at a 0.1 % SS, for
900 nm) and (14.6–680 nm), while the estimates for Delhi are all branches, as shown in Fig. 6d; hence the size distribu-
given in the (10–560 nm) range. This finding is also consis- tion that is integrated to get the CCN involves the accumula-
tent with Wang and Chen (2019), which states that for Delhi, tion mode only. At 0.4 % SS, the Dc was around 40–47 nm;
activation of a 0.1 µm particle requires SS ∼ 0.18 ± 0.015 %, therefore a considerable fraction of the Aitken mode and ac-
compared with ∼ 0.3 % for Beijing; 0.28 %–0.31 % for Asia, cumulation mode was available for activation. At 0.8 % SS,
Africa, and South America; and ∼ 0.22 % for Europe and the Dc was ∼ 25–30 nm; therefore, the contribution of the
North America. The high activated fractions of aerosol can Aitken mode further increases and the accumulation mode is
impact the precipitation patterns in Delhi and may be respon- also available as usual. These findings are also true for BB
sible for the short, intense precipitation events and decrease branches (B and B.reg) and SA branches (L, R1, R2, and
in overall rainfall. However, no study to date has validated R3), as shown in Fig. S4. It is the low value of Dc relative to
this growing trend with CCN measurements or estimates, and other places that is responsible for high CCN. As explained
this needs to be investigated in the future. in Sect. 3.4, Dc is largely associated with κ. The Dc at other
The af and NCCN for all air masses increased as expected places such as Kanpur varied from 50 to 200 nm, for SS rang-
with an increase in supersaturation. The variation in CCN ing from 0.18 to 0.60 (Bhattu and Tripathi, 2015), compared
and the activated fraction with SS are shown in Figs. 5 and to which Dc for Delhi is lower (17–142 nm, for SS ranging
S3. The figures clearly show that even though NCCN for SA from 0.1 % to 0.8 %), implying that a larger regime is avail-
was far greater compared to BB and AS, the activated frac- able for activation. It is pertinent to mention here that the dip
tions were fairly close. B.reg had higher NCCN but a close af in CCN for SA at midday and the peak at the same time for
compared to B. Similarly, L had the lowest NCCN among all AS and BB can be attributed to the following. (a) The dip
SA branches but the highest af . These features elucidate that in NAccumulation for SA at midday was much more prominent
many factors are at play and impact NCCN and af differently. compared to AS and BB. (b) At midday, the NAitken for SA
To determine the governing parameters impacting both NCCN also decreased, while it increased for AS and BB. Thus, the
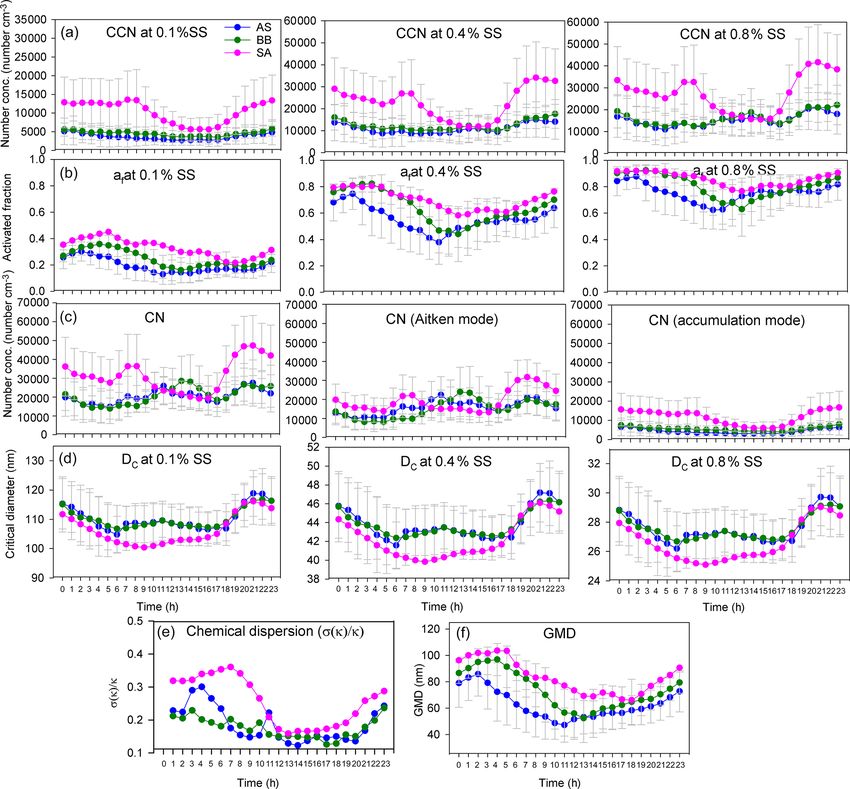
and af , the diurnal patterns of NCCN , af , and Dc at 0.1 %, dip in NCCN was strengthened by the simultaneous dip of
0.4 %, and 0.8 % SS; NCN , NAitken , and NAccumulation ; κ; and both the Aitken and accumulation modes, while the peak in
geometric mean diameter (GMD) are shown in Figs. 6, S4, NCCN for AS and BB was a manifestation of the dominant
and S5. peak in Aitken modes. Similar features were also exhibited
The NCCN curve for SA showed a sharp diurnal feature for sub-branches of BB and SA. A deeper insight reveals that
which was not as prominent for the other two. However, at the dip in number concentration at midday for SA was most
noon, at 0.4 % and 0.8 % SS, while NCCN dipped for SA, aptly seen in the diurnal pattern of POA (which is the most
it rose for AS and BB (Fig. 6). Furthermore, with the in- dominant NRPM1 species) and, to quite a good extent, in
crease in supersaturation, the dip in CCN of SA increased other NRPM1 species barring the SO2− 4 ion. Similarly, the
such that (a) at 0.1 % SS, SACCN > ASCCN , BBCCN ; (b) at peak in the Aitken mode for AS and BB can be attributed
Atmos. Chem. Phys., 20, 6953–6971, 2020 https://doi.org/10.5194/acp-20-6953-2020You can also read


