Inhibition of mitochondrial complex II in neuronal cells triggers unique pathways culminating in autophagy with implications for neurodegeneration
←
→
Page content transcription
If your browser does not render page correctly, please read the page content below
www.nature.com/scientificreports
OPEN Inhibition of mitochondrial
complex II in neuronal cells triggers
unique pathways culminating
in autophagy with implications
for neurodegeneration
Sathyanarayanan Ranganayaki1, Neema Jamshidi2, Mohamad Aiyaz3,
Santhosh‑Kumar Rashmi4, Narayanappa Gayathri4, Pulleri Kandi Harsha5,
Balasundaram Padmanabhan6 & Muchukunte Mukunda Srinivas Bharath7*
Mitochondrial dysfunction and neurodegeneration underlie movement disorders such as
Parkinson’s disease, Huntington’s disease and Manganism among others. As a corollary, inhibition
of mitochondrial complex I (CI) and complex II (CII) by toxins 1-methyl-4-phenylpyridinium (MPP+)
and 3-nitropropionic acid (3-NPA) respectively, induced degenerative changes noted in such
neurodegenerative diseases. We aimed to unravel the down-stream pathways associated with CII
inhibition and compared with CI inhibition and the Manganese (Mn) neurotoxicity. Genome-wide
transcriptomics of N27 neuronal cells exposed to 3-NPA, compared with MPP+ and Mn revealed
varied transcriptomic profile. Along with mitochondrial and synaptic pathways, Autophagy was the
predominant pathway differentially regulated in the 3-NPA model with implications for neuronal
survival. This pathway was unique to 3-NPA, as substantiated by in silico modelling of the three toxins.
Morphological and biochemical validation of autophagy markers in the cell model of 3-NPA revealed
incomplete autophagy mediated by mechanistic Target of Rapamycin Complex 2 (mTORC2) pathway.
Interestingly, Brain Derived Neurotrophic Factor (BDNF), which was elevated in the 3-NPA model
could confer neuroprotection against 3-NPA. We propose that, different downstream events are
activated upon neurotoxin-dependent CII inhibition compared to other neurotoxins, with implications
for movement disorders and regulation of autophagy could potentially offer neuroprotection.
Abbreviations
CII Mitochondrial complex II
3-NPA 3-Nitropropionic acid
ROS Reactive oxygen species
GSH Glutathione (reduced)
GSSG Glutathione (GSSG)
EM Electron microscopy
H&E Haematoxylin and eosin
CI Mitochondrial complex I
MPP+ 1-Methyl-4-phenylpyridinium
1
Department of Neurochemistry, National Institute of Mental Health and Neurosciences (NIMHANS), No. 2900,
Hosur Road, Bangalore, Karnataka 560029, India. 2Department of Radiological Sciences, Ronald Reagan UCLA
Medical Center, Los Angeles, CA 90095, USA. 3Genotypic Technology Pvt. Ltd., 2/13, Balaji Complex, 80 feet Road,
RMV 2nd Stage, Bangalore, Karnataka 560094, India. 4Department of Neuropathology, NIMHANS, No. 2900,
Hosur Road, Bangalore, Karnataka 560029, India. 5Department of Neurovirology, NIMHANS, No. 2900, Hosur
Road, Bangalore, Karnataka 560029, India. 6Department of Biophysics, NIMHANS, No. 2900, Hosur Road,
Bangalore, Karnataka 560029, India. 7Department of Clinical Psychopharmacology and Neurotoxicology, National
Institute of Mental Health and Neurosciences (NIMHANS), No. 2900, Hosur Road, Bangalore, Karnataka 560029,
India. *email: bharath@nimhans.ac.in
Scientific Reports | (2021) 11:1483 | https://doi.org/10.1038/s41598-020-79339-2 1
Vol.:(0123456789)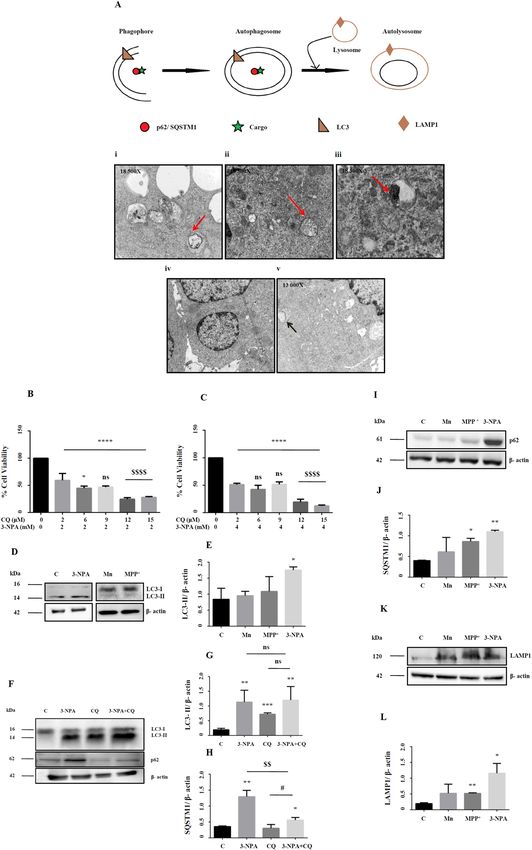
www.nature.com/scientificreports/
Mn Manganese
mTORC2 Mechanistic target of rapamycin complex
BDNF Brain derived neurotrophic factor
GST Glutathione-S-transferase
GeMM Genome scale metabolic model
GIMME Gene inactivity moderated by metabolism and expression
AMPK AMP-regulated protein kinase
AKT Protein kinase B
Bcl-2 B-cell lymphoma 2
Mitochondrial dysfunction is a common mechanism underlying neurodegeneration associated with movement
disorders1. Mitochondrial inhibitors induce neurotoxicity in vitro and in vivo and recapitulate many features of
neurodegenerative diseases with motor impairment. 1-methyl-4-phenylpyridinium ( MPP+) is the most widely
studied mitochondrial complex I (CI) inhibitor, with implications for Parkinson’s disease. 3-Nitropropionic
acid (3-NPA) is a selective inhibitor of mitochondrial complex II (CII) (Succinate Dehydrogenase; SDH)2, with
implications for Huntington’s disease (HD)2–5.
Most studies on neurotoxicity and dysfunction of respiratory complexes focus on CI damage. Of late, CII
function, regulation and response to pathophysiological stimuli has emerged to be crucial in bioenergetics and
human disease since it is at the crossroads of two essential pathways: Oxidative phosphorylation and Krebs
cycle6. Genetic mutations and epigenetic changes in CII genes and dysfunction of SDH activity are linked with
cancer7–12 and mitochondrial disorders including Leigh’s syndrome and optic atrophy13–15. CII-mediated reverse
electron transfer and ROS generation is linked with ischaemia–reperfusion i njury16. CII is therefore a promis-
ing target for human d iseases17. In the brain, 3-NPA-mediated CII inhibition induces striatal dysfunction and
neurotoxicity that entails mitochondrial dysfunction, metabolic defects and increased R OS2–5. We previously
showed that 3-NPA neurotoxicity correlated with altered mitochondrial p roteome18. 3-NPA toxicity is different
eurons19 involving mitochondrial and non-mitochondrial e vents20, thereby highlighting
in cortical and striatal n
regional specificity in the brain and neuronal cell specificity of neurotoxic mechanisms.
Neurotoxic cell death mechanisms may not be common across toxins. Previously, we compared Idiopathic
Parkinson’s disease (iPD) and Manganism, both manifesting as movement disorder with nigrostriatal pathology,
by studying neurotoxic models [ MPP+ and Mn models for iPD and Manganism respectively]21. Loss of neuronal
processes was observed in the M PP+ and not the Mn model. While M PP+ lowered the electrophysiological activ-
ity of dopaminergic neurons, Mn did not. Transcriptomics revealed several differentially expressed genes to be
unique to either models with genes related to neuritogenesis and neuronal proliferation revealing contrasting
profile in both. Genome-wide DNA methylation profile was different between both models indicating that iPD
and atypical Parkinsonism have divergent neurotoxicological manifestation at the neuronal level.
Similarly, neurotoxin-mediated inhibition of mitochondrial complexes could display varied down-stream
events. While CI inhibition induced mitochondria-dependent classical apoptotic mechanisms3,21–23, CII inhibi-
tion induced relatively lower caspase-3 mechanisms and demonstrated higher dependence on necrotic mecha-
nisms and more rapid cell d eath24,25. Morphological analysis revealed significant differences in ultrastructural
+
changes between MPP and 3-NPA neurotoxic m odels18,21.
We hypothesized that neuronal death leading to movement disorder induced by different neurotoxins, entail
varied mechanisms. Neurotoxic effects following CII inhibition could be different from the events induced by a
CI inhibitor and Mn. To address this, we have in the current study, characterized the morphological and molecu-
lar changes induced by the CII inhibitor 3-NPA in neuronal cells and compared the same with the alterations
induced by CI inhibitor M PP+ and the metal toxin Mn, with implications for movement disorder.
Results
3‑NPA neurotoxicity is associated with unique transcriptomic profile in N27 neuronal cells
compared with other neurotoxins. 3-NPA treatment induced dose (0–8 mM) and time (0–48 h)
dependent neurotoxicity in N27 cells with L D50 of 4 mM at 48 h (Supplementary Figure 1A,B) (consistent with
previous studies26) and altered cellular morphology including loss of processes (Supplementary Figure 1E).
3-NPA at L D50 inhibited Complex II (CII) activity (Supplementary Figure 2A), and induced mitochondrial dys-
function (Supplementary Figure 2B–D) including ultrastructural changes, consistent with the published neuro-
toxicological features of 3-NPA2,5,18. Ultrastructural analysis revealed elongated mitochondria at 4 mM 3-NPA
(24 h) (Figure S3Bi), enlarged mitochondria with abnormal, circular cristae (Figure S3Ci) and loss of cristae
(Figure S3Cii), both at 4 mM 3-NPA (48 h). These data indicate mitochondrial dysfunction following 3-NPA
treatment. 3-NPA mediated mitochondrial dysfunction was associated with increased cellular hydroperoxides,
increased nitric oxide release and decreased [GSH]/[GSSG] ratio (Supplementary Figure 4)18.
To investigate whether CII inhibition altered the gene expression profile, whole genome transcriptomics was
carried out in 3-NPA treated N27 cells at LD50 (vs. control) by cDNA microarray analysis (Fig. 1A). The raw
intensities of the microarray signals were normalized following rigorous quality checks and background correc-
tion. High data quality was depicted by the MVA graphs and box plots, while principal component analysis (PCA)
ascertained the quality of grouping of the data of the biological replicates (Supplementary Figure 5). Of ~ 30,000
genes [> 1.75 and < 0.55-fold vs. control as threshold for up and down-regulation respectively] that were obtained,
analysis was carried out on genes within the threshold limit and were filtered with p-value ≤ 0.05, followed by
False Discovery Rate (FDR) analysis (p < 0.1) to obtain the number of up-regulated and down-regulated genes
(Fig. 1B and Supplementary Tables 2, 3).
Scientific Reports | (2021) 11:1483 | https://doi.org/10.1038/s41598-020-79339-2 2
Vol:.(1234567890)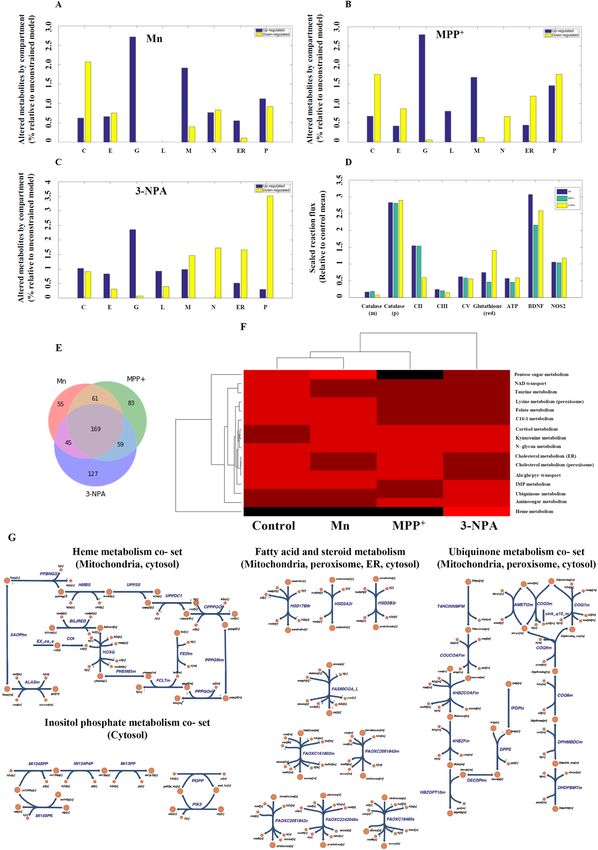
www.nature.com/scientificreports/
Figure 1. Summary of the transcriptomics data along with functional classification and GO analysis of the
differentially regulated genes upon 3-NPA/Mn/MPP+ treatment. Whole genome microarray of control and
treated N27 cells (Mn/MPP+/3-NPA) following mRNA extraction and hybridization against rat genome array
revealed several differentially regulated genes. The heat map of 3-NPA transcriptome vs. control is depicted
(A) along with the colour coded range of gene expression. The heat map was generated using GeneSpring
GX software (Agilent). (B) Number of genes differentially regulated in Mn/MPP+/3-NPA models along with
common genes across the groups. Non-parametric analysis by Kruskal Wallis test followed by post-hoc pair
wise comparison with Dunn–Bonferroni correction (C) of differentially regulated genes across the three models
revealed that the dataset of 3-NPA was different and exclusive from that of Mn (p < 0.001) and MPP+ (p < 0.001).
To validate the microarray data, 5 genes: BDNF (D), NOS2 (E), NQO1 (F), SQSTM1 (G) and FASLG (H) were
tested, whose expression was consistent with the microarray data. Total GST activity was higher in 3-NPA
treatment vs. control (I), consistent with the microarray data (n = 3 trials per experiment; **p < 0.01, ***p < 0.001,
****p < 0.0001).
Scientific Reports | (2021) 11:1483 | https://doi.org/10.1038/s41598-020-79339-2 3
Vol.:(0123456789)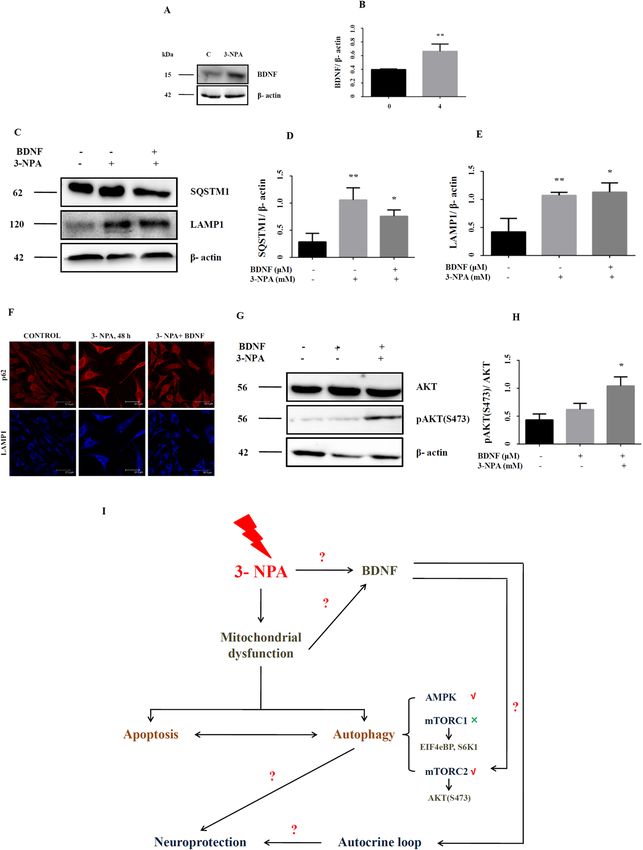
www.nature.com/scientificreports/
Sl. no Gene symbol Gene name Fold change (3NPA/control)
1 Gsta2 Glutathione S-transferase alpha 2 3.84
2 Gsta3 Glutathione S-transferase A3 15.70
3 Gsta4 Glutathione S-transferase alpha 4 3.29
4 Gsta5 Glutathione S-transferase Yc2 subunit 5.12
5 Gsta5 Glutathione S-transferase alpha 5 6.00
6 Gstm1 Glutathione S-transferase mu 1 1.84
7 Gstm7 Glutathione S-transferase, mu 7 2.16
8 Gstp1 Glutathione S-transferase pi 1 2.03
9 Mgst2 Microsomal glutathione S-transferase 2 2.11
10 Mgst3 Microsomal glutathione S-transferase 3 7.55
Table 1. List of various subunits and isoforms of glutathione-s-transferase (GST) upregulated in 3-NPA
treated N27 cells. The gene symbol and gene name of different GST subunits/isoforms along with the fold
change in expression (vs. control) noted in the transcriptomics experiment are provided.
To analyse whether the altered transcriptome was specific to CII inhibition, we compared this data with the
transcriptome profile of N27 cells exposed to the complex I (CI) inhibitor M PP+ and the metal toxin Mn (Sup-
21
plementary Figure 1C,D and Fig. 1B) at L D50, as descried earlier by u
s (to avoid variability due to cell type and
ensure easier comparison, we employed N27 cells for all toxins treated at their respective LD50, although this
concentration varies across the three toxins).
Among the differentially expressed genes, 2367 genes were exclusively up-regulated in the 3-NPA model, 694
in MPP+ and 603 in Mn (vs. control), while 158 were common to all. Among the under-expressed genes, 916
were down regulated exclusively in the 3-NPA model, 428 in MPP+ and 255 in Mn (vs. control), while 112 genes
were common to all (Fig. 1B). Pair-wise comparison of the transcriptome revealed significant differences between
3-NPA and the other two toxins (Fig. 1C). Non-parametric analysis by Kruskal–Wallis test highlighted statisti-
cally significant difference in mean ranks of fold change among the three toxins ( x2 = 34.4, p < 0.001). Post-hoc
pair-wise comparison with Dunn–Bonferroni correction revealed that CII-inhibition dependent transcriptomic
changes showed significantly higher fold change compared to Mn (p < 0.001) and M PP+ (p < 0.001) (Fig. 1C).
These data highlight significant genome-wide transcriptomic differences following CII-inhibition, compared
with CI-inhibition and Mn neurotoxicity.
Five of the differentially expressed genes (4 up-regulated and 1 down-regulated) in the 3-NPA model were
randomly selected for validation of the microarray data, by qRT-PCR. Brain Derived Neurotrphic Factor
(BDNF)27, up-regulated by 1.8-fold in microarray data showed ~ twofold increase in the RT-PCR experiment
(Fig. 1D). Nitric Oxide Synthase 2 (NOS2), up-regulated by 2.8-fold in the microarray experiment showed ~ 6.5-
fold increase in qRT-PCR (Fig. 1E). Similarly, NAD(P)H Quinone Dehydrogenase 1 (NQO1)28, up-regulated
by 2.64-fold in the microarray experiment showed ~ fivefold increase by qRT-PCR (Fig. 1F). Sequesterome 1
(SQSTM1), a key autophagic protein29 up-regulated by twofold in the microarray experiment showed ~ threefold
increase by qRT-PCR (Fig. 1G). On the other hand, FAS Ligand (FASLG)30, down-regulated by 2.8-fold in the
microarray data showed ~ 1.8-fold down-regulation by qRT-PCR (Fig. 1H). Several isoforms of glutathione-S-
transferase (GST)31 showed consistent up-regulation in the microarray data (Table 1), which was validated by
elevated enzyme activity of GST in the 3-NPA treatment (vs. control) (Fig. 1I).
Differences in functional pathways induced by 3‑NPA, Mn and MPP+: focus on autophagy‑related
genes. Functional analysis revealed global differences among Mn, MPP+ and 3-NPA models. K-mean clus-
tering carried out to partition genes with a particular level of expression as apriori set of six clusters indicated
different clustering pattern among the three models (Supplementary Figure 6A–C) with cluster CL6, showing
maximum number of genes in Mn and CL3 in both M PP+ and 3-NPA. The number of genes significantly dif-
ferentially expressed among the groups as a fraction of variability is plotted in the Pareto graph (Supplementary
Figure 6D).
Gene ontology analysis of the up and down-regulated genes showed varied biological processes associated
with 3-NPA (Supplementary Figure 7). The up-regulated genes were part of several pathways but significantly
clustered into 3 groups: mitochondrial, synaptic and autophagic. Down-regulated genes predominantly clustered
as mitochondrial, metabolic and apoptotic functional groups (Fig. 2A–D). Comparison of the differentially
expressed mitochondrial genes revealed 88 in MPP+ (58 genes up-regulated; 30 genes down-regulated), 74 in
Mn (55 up-regulated; 19 down-regulated) and 258 in 3-NPA (190 up-regulated; 68 down-regulated) that were
differentially regulated and unique to each group, while 38 genes (27 up-regulated and 11 down-regulated) were
common (Fig. 2B). Regarding synaptic genes, 33 in M PP+ (21 genes up-regulated; 12 genes down-regulated), 36
in Mn (27 up-regulated; 9 down-regulated) and 132 genes in 3-NPA (110 up-regulated and 22 down-regulated)
treatment, while 16 genes (8 up-regulated and 8 down-regulated) were common across the 3 groups (Fig. 2C).
Regarding autophagy genes, 30 in MPP+ (23 genes up-regulated and 7 genes down-regulated), 19 in Mn (17 up-
regulated and 2 down-regulated), 127 in 3-NPA (101 up-regulated and 26 down-regulated) were differentially
regulated and unique to each group, while only 9 (7 up-regulated and 2 down-regulated) were common (Fig. 2D).
Overall, the number of autophagy genes common across the 3 toxins was the lowest, compared with synaptic
Scientific Reports | (2021) 11:1483 | https://doi.org/10.1038/s41598-020-79339-2 4
Vol:.(1234567890)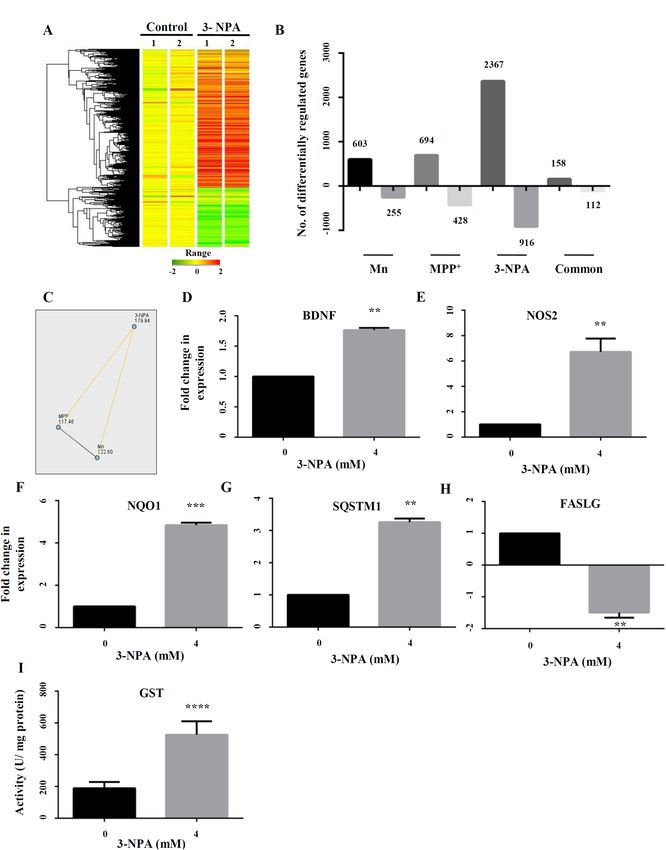
www.nature.com/scientificreports/
Figure 2. Functional classification and GO analysis of the differentially regulated genes upon Mn/MPP+/3-NPA
treatment. (A) Functional classification of all the up- and down-regulated genes in the 3-NPA model. Functional
classification and the number of differentially regulated genes among three major pathways—mitochondrial (B),
synaptic (C) and autophagic (D) are shown.
and mitochondrial genes. Most of the autophagy genes were altered only in 3-NPA and not in Mn/MPP+ models
(Table 2) highlighting the importance of autophagy in 3-NPA neurotoxicity. To substantiate this and understand
the metabolic changes across the three toxins, we built in silico models and characterized the differences.
Network interpretation of differentially expressed transcripts: in silico analysis. Since cellular
functions are compartmentalized in organelles, in silico analysis of the differentially expressed transcripts in
the context of a metabolic network was carried out focused on variation (enrichment or reduction) of organelle
metabolism as assessed by their size. The compartments included the cytosol, endoplasmic reticulum, golgi
apparatus, lysosome, mitochondria peroxisome, and extracellular compartment. The identified set of up- and
down-regulated genes were used to extract the reaction sub-networks for each of the toxins. The salient observa-
tions from this assessment (Fig. 3A–C) reflect a large change in the golgi for all neurotoxins with relatively larger
changes in the mitochondria of Mn and M PP+ models in comparison to 3-NPA, and lack of lysosomal metabo-
lites in Mn. Altered peroxisomal metabolites are also of note. These findings are consistent with autophagy in
3-NPA treated cells, although the mechanisms by which these changes are manifested are not clear, thus requir-
ing a detailed exploration of the network flux state differences.
Scientific Reports | (2021) 11:1483 | https://doi.org/10.1038/s41598-020-79339-2 5
Vol.:(0123456789)www.nature.com/scientificreports/
Fold change (vs.
control)
Gene symbol Gene name 3-NPA Mn MPP+
Autophagy
Atg3 Autophagy related 3 0.45 UC UC
Atg16l1 Autophagy related 16-like 1 (S. cerevisiae) 3.03 UC UC
Unc45b unc-45 homolog B (C. elegans) 3.08 UC UC
Unc5c unc-5 homolog C (C. elegans) 1.94 UC UC
Unc5cl unc-5 homolog C (C. elegans)-like 7.62 UC UC
Uncx UNC homeobox 2.48 UC UC
Ulk2 Unc-51 like kinase 2 (C. elegans) 0.42 UC UC
Unc50 unc-50 homolog (C. elegans) 0.51 UC UC
Gabarapl1 GABA(A) receptor-associated protein like 1 2.52 UC UC
Sqstm1 Sequestosome 1 1.98 UC UC
Traf3ip3 TRAF3 interacting protein 3 2.26 UC UC
Tnik TRAF2 and NCK interacting kinase 3.62 UC UC
Traf6 TNF receptor-associated factor 6, E3 ubiquitin protein ligase 2.10 UC UC
Mdm2 p53 E3 ubiquitin protein ligase 3.11 UC UC
Mdm4 Mdm4 p53 binding protein homolog (mouse) 2.25 UC UC
Dapk1 Death associated protein kinase 1 2.69 UC UC
Dapk3 Death-associated protein kinase 3 0.54 UC UC
Map1b Microtubule-associated protein 1B 3.24 UC UC
Prkaa1 Protein kinase, AMP-activated, alpha 1 catalytic subunit 1.89 UC UC
Prkaa2 Protein kinase, AMP-activated, alpha 2 catalytic subunit 2.17 UC UC
Prkab2 Protein kinase, AMP-activated, beta 2 non-catalytic subunit 3.48 UC UC
Prkag2 Protein kinase, AMP-activated, gamma 2 non-catalytic subunit 10.25 UC UC
Cnksr1 Connector enhancer of kinase suppressor of Ras 1 2.23 UC UC
Pih1d1 PIH1 domain containing 1 0.46 UC UC
Pih1d2 PIH1 domain containing 2 0.56 UC UC
Ctss Cathepsin S 2.43 UC UC
Ctsw Cathepsin W 5.41 UC UC
Xdh Xanthine dehydrogenase 4.88 UC UC
Dnm1l dynamin 1-like 0.53 UC UC
Parp11 Poly (ADP-ribose) polymerase family, member 11 3.94 UC UC
Tiparp TCDD-inducible poly(ADP-ribose) polymerase 1.90 UC UC
Ppara Peroxisome proliferator activated receptor alpha 1.85 UC UC
Ppargc1b Peroxisome proliferator-activated receptor gamma, coactivator 1 beta 2.01 UC UC
Rictor RPTOR independent companion of MTOR, complex 2 2.01 UC UC
Deptor DEP domain containing MTOR-interacting protein 2.41 UC UC
Sgk2 Serum/glucocorticoid regulated kinase 2 2.88 UC UC
Eif4ebp1 Eukaryotic translation initiation factor 4E binding protein 1 1.81 UC UC
Perp PERP, TP53 apoptosis effector 1.99 UC UC
Tp53i11 Tumor protein p53 inducible protein 11 1.80 UC UC
Tp53rk TP53 regulating kinase 1.82 UC UC
Tp53inp2 Tumor protein p53 inducible nuclear protein 2 0.34 UC UC
Tprkb Tp53rk binding protein 0.52 UC UC
Sesn2 sestrin 2 3.14 UC UC
Genes activated by AKT
Usp9x Ubiquitin specific peptidase 9, X-linked 0.52 UC UC
Plk5 Polo-like kinase 5 3.83 UC UC
Mdm2 p53 E3 ubiquitin protein ligase 3.11 UC UC
Conserved helix-loop-helix ubiquitous
Chuk 1.82 UC UC
kinase
Stim1 Stromal interaction molecule 1 2.06 UC UC
FOXO family genes
Foxa1 Forkhead box A1 2.00 UC UC
Foxe1 Forkhead box E1 (thyroid transcription factor 2) 2.76 UC UC
Foxj2 Forkhead box J2 1.79 UC UC
Continued
Scientific Reports | (2021) 11:1483 | https://doi.org/10.1038/s41598-020-79339-2 6
Vol:.(1234567890)www.nature.com/scientificreports/
Fold change (vs.
control)
Gene symbol Gene name 3-NPA Mn MPP+
Foxk1 Forkhead box K1 2.07 UC UC
Foxo6 Forkhead box O6 2.27 UC UC
Foxc1 Forkhead box C1 0.41 UC UC
Foxq1 Forkhead box Q1 0.33 UC UC
RAB family genes
Rab25 RAB25, member RAS oncogene family 0.03 UC UC
Rab2a RAB2A, member RAS oncogene family 0.57 UC UC
Rab32 RAB32, member RAS oncogene family 0.38 UC UC
Rabl5 RAB, member RAS oncogene family-like 5 0.40 UC UC
Rab11fip1 RAB11 family interacting protein 1 (class I) 2.85 UC UC
Rab20 RAB20, member RAS oncogene family 2.09 UC UC
Rab30 RAB30, member RAS oncogene family 2.15 UC UC
Rab3a RAB3A, member RAS oncogene family 3.10 UC UC
Rab3il1 RAB3A interacting protein (rabin3)-like 1 3.11 UC UC
Rab6b RAB6B, member RAS oncogene family 1.98 UC UC
Rab7b Rab7b, member RAS oncogene family 2.02 UC UC
Rab9b RAB9B, member RAS oncogene family 2.53 UC UC
RAS family genes
Radil Ras association and DIL domains 2.80 UC UC
Rasa3 RAS p21 protein activator 3 1.81 UC UC
Rasa4 RAS p21 protein activator 4 2.16 UC UC
Rasa4 RAS p21 protein activator 4 2.20 UC UC
Rasal1 RAS protein activator like 1 (GAP1 like) 2.42 UC UC
Rasal3 RAS protein activator like 3 2.93 UC UC
Rasgrp2 RAS guanyl releasing protein 2 (calcium and DAG-regulated) 2.15 UC UC
Rasl10a RAS-like, family 10, member A 2.13 UC UC
Rassf5 Ras association (RalGDS/AF-6) domain family member 5 4.39 UC UC
Rassf9 Ras association (RalGDS/AF-6) domain family (N-terminal) member 9 2.38 UC UC
Rem2 RAS (RAD and GEM) like GTP binding 2 2.37 UC UC
Rerg RAS-like, estrogen-regulated, growth-inhibitor 1.77 UC UC
Rhebl1 Ras homolog enriched in brain like 1 2.06 UC UC
Rhov ras homolog family member V 3.85 UC UC
RragB Ras-related GTP binding B 2.78 UC UC
Rragd Ras-related GTP binding D 4.35 UC UC
Raph1 Ras association (RalGDS/AF-6) and pleckstrin homology domains 1 0.50 UC UC
Rasl11a RAS-like family 11 member A 0.26 UC UC
Rasl12 RAS-like, family 12 0.50 UC UC
Rasl2-9 RAS-like, family 2, locus 9 0.52 UC UC
Growth factors
Bdnf Brain-derived neurotrophic factor 1.80 2.08 UC
Grb7 Growth factor receptor bound protein 7 2.22 UC UC
Igf2 Insulin-like growth factor 2 4.42 UC UC
Igf2bp2 Insulin-like growth factor 2 mRNA binding protein 2 2.24 UC UC
Igf2r Insulin-like growth factor 2 receptor 1.91 UC UC
Igfals Insulin-like growth factor binding protein, acid labile subunit 2.08 UC UC
Igfbp2 Insulin-like growth factor binding protein 2 2.49 UC UC
Igfbp5 Insulin-like growth factor binding protein 5 3.71 UC UC
Igfbpl1 Insulin-like growth factor binding protein-like 1 5.99 UC UC
Apoptosis
Bbc3 Bcl-2 binding component 3 1.82 UC UC
Bcl11a B-cell CLL/lymphoma 11A (zinc finger protein) 1.94 UC UC
Bcl2 B-cell CLL/lymphoma 2 2.05 UC UC
Bcl2l10 BCL2-like 10 (apoptosis facilitator) 1.95 UC UC
Bcl6b B-cell CLL/lymphoma 6, member B 1.96 UC UC
Bik BCL2-interacting killer (apoptosis-inducing) 2.23 UC UC
Continued
Scientific Reports | (2021) 11:1483 | https://doi.org/10.1038/s41598-020-79339-2 7
Vol.:(0123456789)www.nature.com/scientificreports/
Fold change (vs.
control)
Gene symbol Gene name 3-NPA Mn MPP+
Hrk Harakiri, BCL2 interacting protein (contains only BH3 domain) 13.02 UC UC
Bcl2l11 BCL2-like 11 (apoptosis facilitator) 0.51 UC UC
Bcl2l12 BCL2-like 12 (proline rich) 0.46 UC UC
Bcl3 B-cell CLL/lymphoma 3 0.51 UC UC
Bnip2 BCL2/adenovirus E1B interacting protein 2 0.46 UC UC
Aen Apoptosis enhancing nuclease 3.21 UC UC
Aifm3 Apoptosis-inducing factor, mitochondrion-associated 3 2.21 UC UC
Casp4 Caspase 4, apoptosis-related cysteine peptidase 2.23 UC UC
Faim2 Fas apoptotic inhibitory molecule 2 1.83 UC UC
Casp9 Caspase 9, apoptosis-related cysteine peptidase 0.42 UC UC
Cidea Cell death-inducing DFFA-like effector a 2.28 UC UC
Pdcd1 Programmed cell death 1 1.84 UC UC
Dad1 Defender against cell death 1 0.56 UC UC
Capn8 Calpain 8 11.25 UC UC
Capns2 Calpain, small subunit 2 2.59 UC UC
Table 2. List of autophagic and apoptotic genes differentially regulated across Mn/MPP+/3-NPA treatment.
The gene symbol and gene name of different Autophagy and Apoptotic markers along with the fold change in
expression (vs. control) noted in the transcriptomics experiment are provided. UC = unchanged.
Context‑specific GeMM analysis. Context-specific GeMMs were constructed using the transcriptomes,
to further characterize the functional metabolic differences among the three models. The different feasible flux
states for each of the models were assessed and estimates of the flux states were calculated using FBA, to interro-
gate the metabolic content and capabilities. Fluxes were compared among the 3 models (vs. control for catalase,
mitochondrial and peroxisomal isoforms), CII, CIII and CV, and NOS2, and evaluation of production of ATP,
glutathione, and BDNF (Fig. 3D). These fluxes were significantly altered for each of the neurotoxic models and
were different among them for almost all of the enzymes (or metabolite demands). These predictions are con-
sistent with experimental data (Fig. 1D,E, Supplementary Figures 2 and 4), which is notable considering that a
qualitative (i.e. present/absent calls) interpretation of the transcriptomics were used to generate the GeMMs, yet
lowered CII, along with altered ATP, glutathione, and BDNF were noted.
Clustering of reactions differentially present in Mn, M PP+ and 3-NPA GeMMs according to the canonical
or pre-defined sub-systems indicated changes in multiple areas of metabolism, including amino acids, sugars,
and fatty acids (Supplementary Figure 8A). For more nuanced and context-specific characterization of the
varied metabolic capabilities in the 3 models, cell- and context-specific functional sub-systems were calculated
to generate N27 specific pathway sets (co-sets) (see Supplementary information spreadsheets). The N27 co-sets
provide a functional interpretation of the different transcriptomic states. At a correlation threshold of 0.95, reac-
tion co-sets were calculated for each model, resulting in 380, 369, 398, and 357 co-sets for the untreated, Mn,
MPP+ and 3-NPA, respectively. For pathways that involve as least 6 reactions (biochemical transformations or
transport reactions), there were 23, 22, 22, and 20 sets for the untreated, Mn, MPP+, 3-NPA conditions, respec-
tively (see Supplementary information spreadsheets). As expected, focusing on the largest co-sets, there was a
high-degree of overlap between the untreated and toxin treated conditions. However, there were four co-sets that
were not present in any of the models but were present in the untreated N27 GeMMs; these involved Keratan
sulfate metabolism pathways (involving 3 different co-sets) and Glycogen metabolism. Additionally, the Melanin
biosynthesis co-set was not present in M PP+ treated cells.
The altered structure of the co-sets in toxin-treated conditions (vs. control) indicates a shift in the utilization
of glycosaminoglycan and glycogen. Hierarchical clustering of the mean fluxes for the largest co-sets reveals that
the Heme metabolism co-set (Fig. 3F) is the most discriminating pathway between 3-NPA treated cells (vs. other
toxins). Further, Uniquinone and IMP Metabolism co-sets were more active in 3-NPA treated cells. Reactions
of NAD, taurine, and folate metabolism was decreased (vs. control) in all of the 3 toxin-treated GeMMs, likely
reflecting increased oxidative stress. Another clear discriminating pattern is lowered Pentose sugar metabolism
(Supplementary Figure 8B) in M PP+ treated cells compared to others (although 3-NPA is also decreased relative
to untreated and Mn treated).
Comparison of the sampled flux states between each of the GeMMs and control identified 330, 372, and 400
statistically different reaction fluxes for Mn, MPP+ and 3-NPA (see Supplementary information spreadsheets;
p < 0.05 following Bonferroni corrections and at least a twofold difference in mean flux between treated and
untreated cells), respectively. 169 reactions were shared among all toxic models (Fig. 3E). 3-NPA treated cells had
the largest number of differentially active reactions comparison to control and Mn/MPP + treated cells (Fig. 3E
and Supplementary information spreadsheets). Fatty acid metabolism, particularly the oxidation of long chain
fatty acids that involve the peroxisome, were among these reactions (see Supplementary Information).
Taken together, (i) changes seen in the mitochondria/lysosome/peroxisome/golgi, (ii) metabolism of long
chain fatty acids (requiring partial peroxisomal metabolism) in 3-NPA model, (iii) changes seen in sugar polymer
Scientific Reports | (2021) 11:1483 | https://doi.org/10.1038/s41598-020-79339-2 8
Vol:.(1234567890)www.nature.com/scientificreports/
Figure 3. Organellar changes based on metabolic network interpretation of differentially expressed transcripts in toxic cell models vs.
control. (A–C) Mn, MPP+, and 3-NPA organelle changes, respectively (C = cytosol; E = extracellular; G = golgi apparatus; L = lysosome;
M = mitochondria; N = nucleus; ER = endoplasmic reticulum; P = peroxisome). (D) Flux changes for selected enzymes for context
specific GeMMs. Mean reaction fluxes for different enzymes and metabolites relative to the corresponding mean flux for untreated
N27 cells are shown. All pairwise comparisons are statistically significant for the paired t-test at p < 0.05 following Bonferroni
correction except for: Mn vs. MPP+ NOS2, and Mn vs 3-NPA NOS2. (m = mitochondria, p = peroxisome, red = reduced state). (E)
Venn diagram of the reactions based on the differentially expressed genes in each neurotoxic model vs. control (generated using
Python (Matplotlib library); URL—https://matplotlib.org/). (F) Clustering of reaction co-sets for GeMMs for control, Mn, MPP+ and
3-NPA treated cells (generated using MATLAB version 2015b). The colour scale is linear from 0 (Black) to 1 (Bright red). (G) Pathway
maps of the co-sets and reaction pathways that are differentially active in 3-NPA treated cells and observed to be involved in autophagy
(generated using Escher; URL—https://escher.github.io). The heme co-set is responsible for the flux restrictions on CII. Detailed
descriptions of the co-sets and constituent reactions are provided in the Supporting information spreadsheets.
Scientific Reports | (2021) 11:1483 | https://doi.org/10.1038/s41598-020-79339-2 9
Vol.:(0123456789)www.nature.com/scientificreports/
Figure 4. Ultrastructural and biochemical evidences of autophagy in 3-NPA toxicity. Representative electron ▸
micrographs of 3-NPA cell model showed evidences of autophagy at various stages starting from formation of
autophagosomes (A-i) and formation of autolysosomes (A-ii). Accumulation of multilamellar vesicles (A-iii),
a characteristic feature of incomplete autophagy was also observed. Mn treatment did not show discernable
morphological changes (A-iv). Whereas, MPP+ treatment caused cytoplasmic vacuolations along with the
presence of abnormal mitochondria (arrow) (n = 3 experiments per group). Arrows represent the described
pathological features [schematic was generated using Microsoft Paint (2004)]. (B,C) Co-treatment of 3-NPA
model at 2 and 4 mM with chloroquine (0–15 µM) showed a dose and time dependent increase in cell death
as shown by cell viability assay (n = 6 trials per experiment; *p < 0.05, ****p < 0.0001 compared to its respective
untreated control; $$$$p < 0.0001 compared to 3-NPA treated N27 cells at 2 mM and 4 mM; ns-not significant).
(D–J) Standard autophagy markers depicting different stages of autophagy were examined in 3-NPA/Mn/MPP+
treated N27 cells. LC3 conversion that represents the autophagosomal mass, was maximum in 3-NPA treatment
(D,E, corresponding complete blots in supplementary Figure 9i (3-NPA) and ii (Mn and M PP+)) which was
confirmed by CQ cotreatment (F,G, corresponding complete blot in supplementary Figure 9iv). The LC3
western data for Mn and M PP+ is from a blot that is different from the 3-NPA blot (D). The β-actin western data
for Mn and MPP+ is from a blot that is different from the 3-NPA blot (D). The status of autophagy upon 3-NPA
treatment was further evaluated upon co-treatment with CQ (15 µM), followed by assessment of the levels
of LC3-II conversion (F,G) and p62 (F,H, corresponding complete blot in supplementary Figure 10v). LC3
converiosn was noted in 3-NPA, CQ and 3NPA + CQ; however, the differences among the three groups was not
significant (ns). On the other hand, p62 showed significant over-expression in 3-NPA + CQ treatment both in
comparison with control and CQ treatment alone (n = 3 trial per experiment; *p < 0.05, **p < 0.01, ***p < 0.001;
compared to untreated control; #p < 0.05, compared to CQ treatment alone; $$p < 0.01, compared to 3-NPA
treatment alone). p62/SQSTM1 was also higher in M PP+ and 3-NPA treated cells (I,J, corresponding complete
blot in supplementary Figure 10i) indicating possible incomplete autophagy (n = 3 trials per experiment;
*p < 0.05, **p < 0.01). LAMP1, the lysosome marker showed significant increase in MPP+ and 3-NPA model
(K,L, corresponding complete blot in supplementary Figure 11i). The western data of LC3 in CQ + 3-NPA
samples (F), p62 (G), LAMP1 (I) are from 2 different blots. All blots were cut to retain only the region depicting
the protein of interest.
in all the models compared to control and (iv) alterations in heme and ubiquinone metabolism in the 3-NPA
model in particular (Fig. 3G), highlight the possible role of autophagy particularly in the 3-NPA model. Conse-
quently, we tested whether autophagy plays an important role down-stream in the 3-NPA model.
N27 cells treated with 3‑NPA use autophagy as a rescue mechanism. Ultrastructural analysis
of the 3-NPA treated cells showed evidences of autophagy, including structures of phagophore, autophago-
some, autolysosome and typical intracellular multi-lamellar inclusion bodies (Fig. 4A). Such structures were
not observed in Mn and MPP+ models (Fig. 4A-iv and v). N27 cells treated with 3-NPA and chloroquine, an
autophagy inhibitor showed increased cell death compared to 3-NPA treatment alone (Fig. 4B,C). Since CQ
treatment increased cell death in the 3-NPA model, suppression of autophagic pathway could exacerbate the
neurotoxic effects on 3-NPA leading to increased cell death.
Next, we carried out western blot of the molecular players of autophagy. Analysis of the autophagic flux
revealed effective conversion of the microtubule-associated protein light chain 3A, LC3-I to LC3-II species only
in 3-NPA and not in Mn/MPP+ models (Fig. 4D,E; corresponding full blots in supplementary Figure 9i (3-NPA)
and ii (Mn and M PP+)). Further, western blot of LC3 in 3-NPA treated cells with and without CQ compared to
control indicated relatively higher intensity of LC3-II band (Fig. 4F,G; corresponding full blot in supplementary
Figure 9iv). CQ (positive control) independently increased LC3-I conversion compared to control. However,
3-NPA + CQ treatment does not show any further increase in LC3 conversion compared with 3-NPA treatment
alone (Fig. 4F,G), indicating that 3-NPA causes incomplete autophagy by inducing possible lysosomal dysfunction
rather that inducing formation of new autophagosomes. On the other hand, expression of SQSTM1 or protein
62 (p62) was elevated both in the 3-NPA and MPP+ models, with an increasing trend in Mn in the total extract
(Fig. 4I,J; corresponding full blot in supplementary Figure 10i), which was also reflected in the soluble fraction
(Supplementary Figure 10ii). While CQ treatment alone did not show significant change in p62 expression com-
pared to control, CQ + 3-NPA co-treatment showed significant over expression of p62 (Fig. 4F,H; corresponding
full blot in supplementary Figure 10v). Lysosome Associated Membrane Protein 1 (LAMP1), a marker of auto-
lysosome showed highest expression in the 3-NPA model (Fig. 4K,L; corresponding full blot in supplementary
Figure 11i). These data confirm the role of autophagy exclusively in the 3-NPA model.
Analysis of the autophagic pathway in the 3‑NPA model. AMP-regulated Protein Kinase (AMPK) is
one of the regulators of mechanistic Target of Rapamycin (mTOR), a negative regulator of a utophagy32. The cata-
lytic subunits of AMPK (PRKAA1 and PRKAA2), were up-regulated in the microarray data (Table 2, Fig. 5A,B;
corresponding full blot in supplementary Figure 11ii). Western analysis revealed increased phosphorylation (at
Thr172) of AMPK, thus confirming its activation in the 3-NPA model (Fig. 5A,C; corresponding full blot in
supplementary Figure 11iii). AMPK mediated cascade could result either in mTOR-dependent or independent
autophagy. mTOR exists as mTOR Complex 1 (mTORC1) and mTOR Complex 2 (mTORC2), which have shared
and unique s ubunits32.
Microarray data of the 3-NPA model revealed differential regulation of the subunits and down-stream
targets of both mTORC1 and mTORC2. mTOR showed unchanged expression (0.8-fold vs. control), while
Scientific Reports | (2021) 11:1483 | https://doi.org/10.1038/s41598-020-79339-2 10
Vol:.(1234567890)www.nature.com/scientificreports/
Scientific Reports | (2021) 11:1483 | https://doi.org/10.1038/s41598-020-79339-2 11
Vol.:(0123456789)www.nature.com/scientificreports/
Figure 5. Mechanism and pathways activated in 3-NPA induced autophagy. Consistent with the microarray ▸
data, AMPK was up-regulated at the protein level (A,B, corresponding complete blot in supplementary
Figure 11ii) and was activated upon 3-NPA treatment as indicated by increased phosphorylation (A,C,
corresponding complete blot in supplementary Figure 11iii). mTOR itself can function in presence of or
independent of AMPK, whose levels were moderately higher in 3-NPA treatment (A,B, corresponding
complete blot in supplementary Figure 11iv) (n = 3 trials per experiment; *p < 0.05, **p < 0.01). Western
blotting on total cell extracts revealed that the primary subunit of mTORC1, RAPTOR, was unchanged upon
3-NPA treatment (D,E, corresponding complete blot in supplementary Figure 12i) and so were the levels of
the other regulatory subunit PRAS40 (D,E, corresponding complete blot in supplementary Figure 12ii) and
its downstream targets including S6K1 (D,E, corresponding complete blot in supplementary Figure 12iii) and
EIF4EBP (D,E, corresponding complete blot in supplementary Figure 12iv). However, the phosphorylation
status of PRAS40 (pPRAS40-D,F, corresponding complete blot in supplementary Figure 13i) and EIF4EBP
(pEIF4EBP-D,F, corresponding complete blot in supplementary Figure 13iv) was significantly lower in
3-NPA treatment along with increased phosphorylation of S6K1 (pS6K1-D,F, corresponding complete blot in
supplementary Figure 13ii). (G–I) 3-NPA induced changes in mTORC2 subunits and its downstream targets.
The primary subunit of mTORC2, RICTOR, was upregulated upon 3-NPA treatment (G,H, corresponding
complete blot in supplementary Figure 14i) unlike the other regulatory subunit mSIN1 (G,H, corresponding
complete blot in supplementary Figure 14ii) and its downstream target AKT (G,H, corresponding complete
blot in supplementary Figure 14iii). However the phosphorylation status of mSIN1 (pSIN1-G,I, corresponding
complete blot in supplementary Figure 15i) was much lower, while phosphorylation of AKT at S473 [pAKT
(S473)-G,I, corresponding complete blot in supplementary Figure 15iii] and T308 (pAKT (T308)-G,I,
corresponding complete blot in supplementary Figure 15ii) was significantly higher in 3-NPA treatment
(n = 3 trials per experiment; *p < 0.05, **p < 0.01). The western data for all the proteins in this figure are from
independent blots. All blots were cut to retain only the region depicting the protein of interest.
DEP-containing mTOR interacting protein (DEPTOR), a subunit common to both complexes was up-regulated
(2.4-fold), and mTOR-associated protein, LST8 homolog (mLST8) (1.3-fold), another component of mTORC1
showed relatively unchanged expression (Table 2).
The unique components of mTORC1 including Regulator Associated Protein of mTORC1 (RPTOR) (0.91-
fold) and AKT1 Substrate1 (Proline rich) (PRAS40) (1.1-fold) were relatively unchanged. Similarly, the down-
stream targets of mTORC1 including Ribosomal Protein S6 Kinase polypeptide 1 (S6K1) (0.8-fold), UNC-51
like Kinase 1 (ULK1) (0.9-fold) showed relatively unchanged expression. On the other hand, two down-stream
targets: Growth factor Receptor Bound protein 10 (GRB10) (0.26-fold) and Eukaryotic translation initiation
factor 4e binding protein 1 (Eif4ebp1) (1.8-fold) showed differential regulation in the 3-NPA model (Table 2).
Western blot of mTORC1 components and down-stream targets validated the microarray data. Expression
of RPTOR and PRAS was relatively unchanged vs. control (Fig. 5D,E; corresponding full blot in supplementary
Figure 12i (RPTOR) and ii (PRAS40)), consistent with microarray data. However, expression of EIF4eBP1 was
relatively unchanged, unlike the microarray data, which showed up-regulation (Fig. 5D,E; corresponding full blot
in supplementary Figure 12iv). Since mTOR expression was higher on western blot (Fig. 5A,B; corresponding
full blot in supplementary Figure 11iv), and to assess whether autophagy is triggered via mTORC1, we tested
the phosphorylation status of mTORC1 component and downstream targets. Phosphorylation of PRAS40 at
Thr246 and EIF4Ebp1 at T45 was relatively lower vs. control (Fig. 5D,F; corresponding full blot in supplementary
Figure 13i (pPRAS40) and iv (pEIF4Ebp1)) indicating that mTORC1 is not activated. However, phosphorylation
of S6K1 was increased (Fig. 5D,F; corresponding full blot in supplementary Figure 13ii).
Microarray data of mTORC2 components (Table 2) revealed that RPTOR-independent Companion of
mTORC2 (RICTOR) was up-regulated (twofold), while mitogen activated Protein Kinase associated Protein
1 (mSIN1) (1.15-fold) and Proline rich 5-like protein (PROTOR) (1.3-fold) were relatively unchanged. The
downstream genes Protein Kinase B (AKT) (0.8-fold) and Protein Kinase C (PKC) (1.4-fold) showed relatively
unchanged expression while Serum Glucocorticoid regulated Kinase (SGK) was up-regulated (2.9-fold) (Table 2).
Western blot revealed that while RICTOR was over-expressed, mSIN1 was relatively unchanged (Fig. 5G,H;
corresponding full blot in supplementary Figure 14i (RICTOR) and ii (mSIN1)), consistent with the micro-
array data. On the other hand, AKT expression showed decreasing trend, consistent with the microarray
data. mTORC2-dependent autophagy is regulated by the phosphorylation of the target proteins such as AKT
(Ser473)33. Ser473 of AKT was hyperphosphorylated (Fig. 5G,I; corresponding full blot in supplementary Fig-
ure 15iii), while Thr308 of AKT, was also hyperphosphorylated, which indicates complete activation (Fig. 5G,I;
corresponding full blot in supplementary Figure 15ii). To confirm this, we searched the transcriptomics data for
down-stream targets of AKT and found p53 E3 Ubiquitin Protein Ligase (Mouse double minute 2 or MDM2)
(3.1-fold), Stromal Interaction Molecule 1 (STIM 1) (2.1-fold), Conserved Helix-loop-Helix Ubiquitous Kinase
(Chuk) (1.8-fold) were over-expressed (Table 2). Further, mSIN1, the mTORC2 inhibitor was significantly hypo-
phosphorylated, thereby lowering its inhibitory effects and potentially facilitating AKT phosphorylation and
mTORC2 mediated autophagy (Fig. 5G,I; corresponding full blot in supplementary Figure 15i). These data
confirm mTORC2-dependent autophagy in the 3-NPA model.
Cellular interaction between apoptosis and autophagy in the 3‑NPA model. A cross-talk between
ther34,35. Certain genes play a dual role in both
autophagy and apoptosis exists, with both regulating each o
phenomena34. Beclin1-BCL2 complex for instance defines the balance between apoptosis and a utophagy34,35.
While Beclin1 was up-regulated, BCl2 expression was down-regulated in the 3-NPA model (Table 2) (Fig. 6A–C;
Scientific Reports | (2021) 11:1483 | https://doi.org/10.1038/s41598-020-79339-2 12
Vol:.(1234567890)www.nature.com/scientificreports/
Scientific Reports | (2021) 11:1483 | https://doi.org/10.1038/s41598-020-79339-2 13
Vol.:(0123456789)www.nature.com/scientificreports/
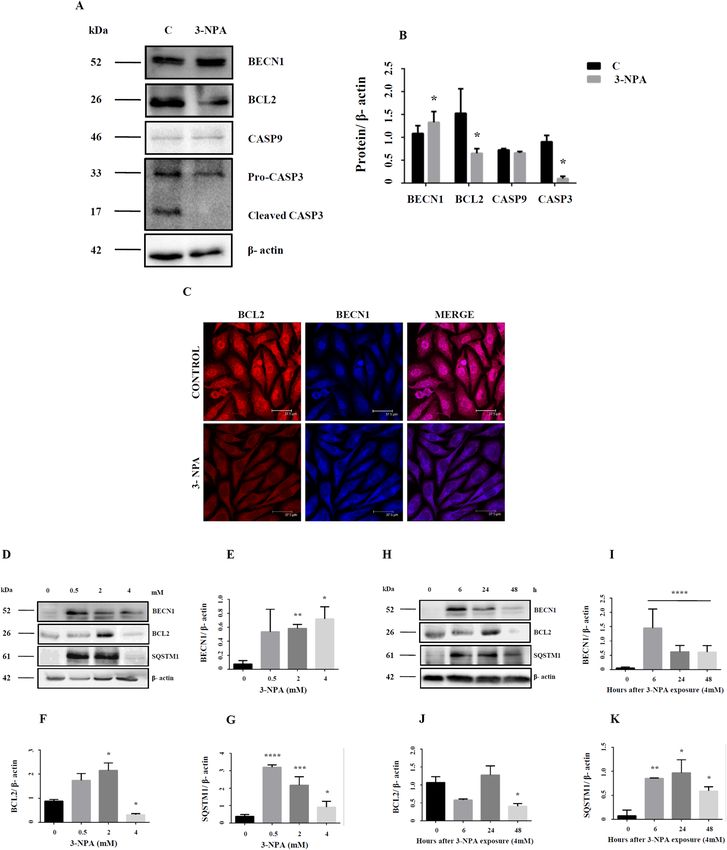
Figure 6. Dynamics between apoptosis and autophagy in 3-NPA treated N27 cells. BECN1, a key molecule
in autophagy that balances autophagy and apoptosis was up-regulated (A,B, corresponding complete blot in
supplementary Figure 16i) in 3-NPA treatment. Apoptotic markers BCL2 and CASP3 were down-regulated (A,B,
corresponding complete blots in supplementary Figure 17i and vii) whereas CASP9 was slightly lowered but not
statistically significant in 3-NPA treated cells (n = 3 trials per experiment; *p < 0.05). In case of CASP3, along with
lowered pro-caspase levels in 3-NPA, the active form was also not generated. (C) Representative confocal images
of control and 3-NPA treated cells stained with BCL2 and BECN1 vs. control (n = 3 coverslips per group). Dose
(0–4 mM) (D–G, corresponding complete blots in supplementary Figure 16ii (BECN1), 17ii (BCL2) and iv (p62))
and time (0–48 h) (H–K, corresponding complete blots in supplementary Figures 16iv (BECN1), 17iii (BCL2) and
vi (p62)) dependence of autophagic and apoptotic markers are shown in 3-NPA vs. control samples (n = 2 trials per
experiment; *p < 0.05, **p < 0.01, ***p < 0.001, ****p < 0.0001). The western data for all the proteins in this figure are
from independent blots. All blots were cut to retain only the region depicting the protein of interest.
Scientific Reports | (2021) 11:1483 | https://doi.org/10.1038/s41598-020-79339-2 14
Vol:.(1234567890)www.nature.com/scientificreports/
corresponding full blot in supplementary Figure 16i (BECN1) and 17i (BCL2)). While BCL2 was localized pri-
marily in the nucleus, 3-NPA treatment induced BCL2 labeling both in the nucleus and cytoplasm (Fig. 6C) with
potential role in regulating apoptotis36,37. Microarray data also confirmed down-regulation of BCL2-dependent
genes BCL2l11, BCL2l12, BCL3 and BNIP2. Further, we observed that 3-NPA treatment not only lowered the
caspase 3 expression (quantification shown in Fig. 6B is for pro-caspase-3 band), but the cleaved active form was
also minimal (Fig. 6A; corresponding full blot in supplementary Figure 17vii). Caspase-9 was showed slightly
lowered expression, which was statistically not significant (Table 2) (Fig. 6A,B; corresponding full blot in sup-
plementary Figure 16v). Since both autophagy and apoptosis is dynamic process, dose and tome dependent
experiments were carried to validate the relative involvement of these pathways. We observed that in the lower
doses, BCL2 expression was several fold higher compared to control, which then drastically decreased at the
LD50 concentration (Fig. 6D,F; corresponding full blot in supplementary Figure 17ii). However, at earlier time
points of 3-NPA treatment at 4 mM, BCL2 expression remained unchanged, which subsequently decreased 48 h
(Fig. 6H,J; corresponding full blot in supplementary Figure 17iii). On the other hand, BECN1 was significantly
upregulated at all time points and doses to different extents (Fig. 6D,E,H,I; corresponding full blot in supplemen-
tary Figure 16ii (dose) and iv (time)). SQSTM1 (p62) expression which was significantly elevated at the earlier
stages and doses, decreased at LD50 but was found to be relatively higher compared to control (Fig. 6D,G,H,K;
corresponding full blot in supplementary Figure 17iv (dose) and vi (time)). Considering these data, we speculate
that at earlier stages of 3-NPA toxicity, both apoptotic and autophagic pathways are activated. However, at the
later stages, owing to the downregulation of apoptotic proteins such as BCL2, along with consistently higher
autophagic markers (BECN1 and p62) and reduced conversion of pro-caspase 3 to its active form (Fig. 6A,B),
the cells may prefer autophagy over apoptotic pathways.
Potential role of neurotrophic factors in enhancing autophagy in the 3‑NPA model. Trophic
factors such as BDNF protect against cell death by enhancing autophagy33,38, although contradictory evidence
exists27. Microarray data in the 3-NPA model revealed over-expression of BDNF (1.8-fold) and the same was
confirmed by RT-PCR (Fig. 1D) and western blot (Fig. 7A,B; corresponding full blot in supplementary Fig-
ure 18i). We tested whether exogenous BDNF could promote autophagy in the 3-NPA model. Supplementa-
tion of the 3-NPA model with BDNF lowered p62 levels (Fig. 7C,D; corresponding full blot in supplementary
Figure 18ii), while LAMP1 expression was unchanged (Fig. 7C,E; corresponding full blot in supplementary
Figure 18iii), which was confirmed by immunocytochemistry (Fig. 7F). AKT phosphorylation could hasten the
completion of autophagy by increased fusion of p62 with lysosome via re-organization of the c ytoskeleton39.
We observed increased phosphorylation of AKT at S473 (Fig. 7G,H; corresponding full blot in supplementary
Figure 18v), which indicates AKT activation, with potential down-stream e ffects39.
Discussion
3‑NPA neurotoxicity entails unique cellular and transcriptomic profile. We investigated whether
CII inhibitor triggers pathways that are different from CI inhibitor vs. metal toxin in neurons. This has impli-
cations for movement disorders and neurodegeneration as indicated in our previous study on Mn and MPP+
models21. Since the concentration of the three toxins are varied, it is challenging to emphatically state that the
differences between CII and CI events are not influenced by dose-dependent effects of the toxin. Initial experi-
ments with 3-NPA at concentrations comparable to Mn and MPP+ did not show any significant changes. Further,
changes in established parameters such as ROS and GSH/GSSG could be noticed with highest significance at
LD50 of 3-NPA (4 mM, 48 h). These data indicate that 3-NPA is a relatively weaker toxin, effective only at higher
doses in this cell line compared to Mn and M PP+. The current study revealed autophagy pathway to be uniquely
activated in the 3-NPA model. Mitochondrial dysfunction and autophagy in the 3-NPA model have been noted
previously, but the downstream mechanisms were not explored in detail18,20,40,41.
3-NPA neurotoxicity is associated with apoptosis2,42,43. Our data revealed CASP9 levels to be unchanged in the
3-NPA model, while CASP3 was lowered (Fig. 6), consistent with other data44. 3-NPA probably activates calpain
and cytochrome C relocalization that could downregulate CASP3 and C ASP944 and support cell survival. This
could be possible in the 3-NPA cell model, since our transcriptomics data revealed up-regulation of Calpain 8
(CAPN8; 11.2-fold) and Calpain small subunit (CAPNS2; 2.6-fold).
In silico modelling using canonical pathway definitions revealed that autophagy could be triggered exclusively
in the 3-NPA model with potential neuroprotective effects. Although one of the issues with pre-defined pathways
is a lack of specificity for different experimental conditions and in turn inability to account for different cellular
processes; the calculated N27 co-sets provided a means of calculating specific, functional pathways and subse-
quent characterization of biochemical alterations in the three models. The 3-NPA model was consistent with
autophagy, with specific co-sets and associated metabolic reactions preferentially activated only in 3-NPA but
not others (see Supplementary information spreadsheets, ‘mn_mpp_npa_vs_ref_difference’ tab). These can be
seen as providence of metabolic substrates released and metabolized to promote autophagy, such as ubiquitina-
tion of proteins and long chain fatty acid oxidation, requiring peroxisomal, mitochondrial inositol metabolism
(Fig. 3F,G).
The FBA analysis of the GeMMs comparing the fluxes in the 3 models in conjunction with the different co-sets
led to interesting observations. Independent of any direct regulatory effects, the flux through CII is predicted to
be lowered in the 3-NPA model, but increased in Mn and M PP+ models (Fig. 3D). Further, heme co-set (Fig. 3G
and Supplementary information spreadsheets) was identified as being a principal pathway accounting for the
altered flux states. Thus, the decreased CII flux may be in large part accounted for by increased heme metabolism
in autophagy through succinyl-CoA metabolism. Additionally, glutathione synthesis is increased in 3-NPA but
decreased in the other 2 models, potentially implying autophagy-specific mechanism.
Scientific Reports | (2021) 11:1483 | https://doi.org/10.1038/s41598-020-79339-2 15
Vol.:(0123456789)www.nature.com/scientificreports/
Figure 7. Growth factor mediated neuroprotection in 3-NPA treated N27 cells. Consistent with the
microarray data, BDNF showed increased expression at the protein level (A,B, corresponding complete blot
in supplementary Figure 18i). Co-treatment of 3-NPA treated N27 cells with BDNF could activate mTORC2
pathway as indicated by levels of pAKT (S473) (G,H, corresponding complete blot in supplementary
Figure 18v). Autophagy was tending towards completion as indicated p62/SQSTM1 (C,D, corresponding
complete blot in supplementary Figure 18ii) and LAMP1 (C,E, corresponding complete blot in supplementary
Figure 18iii) in BDNF + 3-NPA co-treatment (n = 3 trials per experiment; *p < 0.05, **p < 0.01). This was
validated further by immunocytochemistry (F) (n = 3 coverslips per group). (I) Depicts the schematic diagram
summarizing the key findings of the study. 3-NPA mediated mitochondrial dysfunction alters the interaction
and the ensuing balance between autophagy and apoptosis in neuronal cells with autophagy potentially
conferring neuroprotection [Schematic was generated using Microsoft Powerpoint (2004)]. Autophagy pathway
in the 3-NPA model entails mTORC2 (and not mTORC1) pathway and AMPK. 3-NPA mediated up-regulation
of BDNF could positively influence neuroprotection either directly via autocrine loop or indirectly via
upregulating the autophagy mechanism. The western data for all the proteins in this figure are from independent
blots. All blots were cut to retain only the region depicting the protein of interest.
Scientific Reports | (2021) 11:1483 | https://doi.org/10.1038/s41598-020-79339-2 16
Vol:.(1234567890)www.nature.com/scientificreports/
3‑NPA induces incomplete autophagy in N27 cells. We noted ultrastructural evidences of incomplete
a utophagy45 only in the 3-NPA and not in Mn or M PP+ models (Fig. 4). Autophagy genes revealed differen-
tial regulation (Table 2) both at the mRNA and protein level in the 3-NPA model. For example, GABARAPL1
which typically associates with autophagic vesicles46 was up-regulated by 2.5-fold. LC3 I to II conversion and
LAMP1 was higher in 3-NPA treated cells (Fig. 4). However, p62 mRNA and protein levels were consistently
higher (Figs. 1G, 4). p62, a multifunctional protein that interacts with LC3 is down-regulated with progression
of autophagy47 probably indicating incomplete a utophagy48. Astrocytes exposed to 3-NPA demonstrated incom-
plete autophagy with increased accumulation of p6249.
Proteins BCL2 and BECN1 maintain a delicate balance between autophagy and apoptosis34,35. Dissocia-
tion of BECN1 from BCL2 promotes autophagy. We observed up-regulation of BECN1 with a corresponding
down-regulation of BCL2 in 3-NPA treated cells (Fig. 6)50. BECN1 is regulated by ubiquitination of TRAF6,
which disrupts its interaction with BCL2, thereby inducing autophagy51. Our microarray data revealed twofold
up-regulation of TRAF6 (Table 2), which could indirectly induce autophagy.
Death associated protein kinases (DAPKs) govern cell death by interacting with apoptotic or autophagic
proteins. DAPK1, which was up-regulated in 3-NPA treated cells (2.7-fold), participates in autophagy and inter-
acts with MAP1B which was up-regulated (3.2-fold). LC3 belongs to the family of MAP1 proteins and interacts
directly with phosphorylated MAP1B52. Apart from activated AMPK53, DAPK can also phosphorylate BECN1
and weaken its interaction with BCL2, thereby facilitating autophagy54,55.
mTORC2 is the chosen pathway in 3‑NPA mediated autophagy: role of RICTOR and not
RAPTOR. mTOR and AMPK are metabolic checkpoints in a utophagy56,57. mTOR exists as mTORC1 and
mTORC2; although mTORC2 is relatively less explored. mTORC1 has 4 subunits: DEPTOR, mLST8, RAP-
TOR and PRAS40. Pathways coping with metabolic stress impinge on mTORC1, whose inhibition promotes
autophagy32. mTORC1 activates the downstream targets eIF4eBP and S6K1 via phosphorylation. DEPTOR,
RAPTOR and PRAS40, when activated, negatively regulate mTORC1, thereby promoting autophagy. We noted
evidences of mTORC1 inhibition in the 3-NPA model. While mTOR was up-regulated, RAPTOR was unchanged
(Fig. 5). PRAS40 was hypo-phosphorylated, which could negatively regulate mTORC1. mTORC1 interacting
protein PIH1D1, that positively regulates its assembly and S6K p hosphorylation58 was down-regulated (0.4-
fold). However, phosphorylation of S6K1 was slightly higher, despite unchanged expression, which could be due
to phosphorylation via AKT59.
Inhibition of mTORC1 could happen via AMPK. During cellular energy crisis, AMPK [activated in 3-NPA
model (Fig. 5)], can regulate mTORC1 by phosphorylating TSC2 and RAPTOR32,57. Proteins including KSR1-2
and Sestrins (SESN1-3) can activate AMPK. For instance, SESN2 (up-regulated by ~ 3.1-fold) which is stress
inducible and regulated by p53 inhibits mTORC1 by activating AMPK via forming AMPK-TSC1:TSC2
complex60–62. Transcriptomics data showed up-regulation of other p53 associated proteins, PERP (~ twofold),
Tp53I11 (1.8-fold) and Tp53RK (1.82-fold). Similarly, KSR1 and KSR2 can physically interact with and activate
AMPK63,64. KSR in turn is activated by CNK1 (up-regulated by ~ 2.2-fold), which acts upstream to RAF in RAS
pathway connecting it with KSR62.
On the other hand, our study revealed activation of mTORC2 pathway leading to autophagy. mTORC2 has
five subunits (DEPTOR, RICTOR, mLST8, mSIN1 and PROTOR) and its activation phosphorylates the down-
stream target AKT at ser473, via up-regulation of RICTOR63 (Fig. 5). This process is regulated by mSIN165,
whose phosphorylation at T86 dissociates if from RICTOR, impairing its catalytic activity and abolishing AKT
(S473) phosphorylation66. DEPTOR also negatively regulates mTORC2, and its overexpression could promote
cell survival by inhibition of mTORC1 pathway and activation of PI3K/AKT p athway67. Previous s tudies29,33 have
clearly suggested that AKT regulates mTOR mediated autophagy and phosphorylation at Ser473 of AKT is a read
out for mTORC2 activation. Further, our data also showed hyperphosphorylation of AKT at T308 (Fig. 5G–I),
which indicates complete activation of AKT leading to autophagy33,39. Hence, 3-NPA treatment could induce
autophagy via mTORC2 and AKT.
BDNF offers neuroprotection against 3‑NPA neurotoxicity. Both mTORC1 and mTORC2 are
regulated by growth factors32,33,65. Growth factor regulates mTORC1 at the level of TSC complex via PI3K
and AKT68 and activates TORC2 partly by PI3K29. We noted significant up-regulation of BDNF mRNA and
protein (Figs. 1D, 7A,B). BDNF can activate mTORC1, which in turn induces p70S6K1 phosphorylation and
expression69, but this can be over-ridden by AMPK at the level of TSC2 and R aptor70. BDNF can also regulate
phosphorylation of AKT at S47368,70,71 probably via PI3K.
Growth factors can also activate Rictor and promote pAKT (S473)33. Co-treatment with 3-NPA and BDNF
elevated pAKT (S473) in N27 cells (Fig. 7G,H). It is possible that growth factor increases phosphatidylinosi-
tol triphosphate [PtdIns (3, 4, 5) P3] content, which associates with the SIN1-PH domain and in turn recruit
mTORC2 to the plasma membrane, enabling pAKT (S473)65. This could in-turn regulate mTORC1 activity and
autophagy as evidenced by LAMP1 and p62 levels (Fig. 7C–E). mTORC2 can be regulated via syndecan proteins,
which act as co-receptors for growth factors72–74 and these were up-regulated exclusively in the 3-NPA model
(SDC2-1.9-fold; SDC3-4.4-fold). Upon growth factor stimulation, they target PKCa to the plasma membrane
eventually recruiting mTORC2 and activate AKT75.
BDNF can confer neuroprotection by suppressing autophagy via activation of mTORC1 and regulating the
LK227,76,77. Apart from mTORC1, mTORC2 is also required to regulate a utophagy39,78. Our study also
activity of U
speculates a similar scenario, wherein upon growth factor stimulation, there is increased activity of mTORC2
as depicted by higher pAKT (S473) and greater turnover of autophagosomes as depicted by p62 and LAMP1
(Fig. 7). BDNF treatment and subsequent increase in mTORC2 activity in 3-NPA treated cells could promote
Scientific Reports | (2021) 11:1483 | https://doi.org/10.1038/s41598-020-79339-2 17
Vol.:(0123456789)You can also read


