PUBLICATIONS Journal of Geophysical Research: Earth Surface
←
→
Page content transcription
If your browser does not render page correctly, please read the page content below
PUBLICATIONS
Journal of Geophysical Research: Earth Surface
RESEARCH ARTICLE                              Presentation and Analysis of a Worldwide Database
10.1002/2017JF004236
                                              of Earthquake-Induced Landslide Inventories
Key Points:                                   Hakan Tanyaş1 , Cees J. van Westen1 , Kate E. Allstadt2 , M. Anna Nowicki Jessee3 ,
• The available information on
  earthquake-induced landslide data is        Tolga Görüm4 , Randall W. Jibson2 , Jonathan W. Godt2 , Hiroshi P. Sato5, Robert G. Schmitt2                           ,
  cataloged                                   Odin Marc6,8 , and Niels Hovius7,8
• The quality, completeness, and
                                              1
  representation of earthquake-induced         Faculty of Geo-Information Science and Earth Observation, University of Twente, Enschede, Netherlands, 2U.S. Geological
  landslide inventories are discussed         Survey, Golden, CO, USA, 3Indiana University Bloomington, Bloomington, IN, USA, 4Department of Geography, Istanbul
• A scoring method for an overall
                                              University, Istanbul, Turkey, 5Department of Geography, Nihon University, Tokyo, Japan, 6Now at Institut de Physique du
  evaluation of earthquake-induced
  landslide inventories is proposed           Globe Strasbourg, University of Strasbourg, EOST, Strasbourg, France, 7Institute of Earth and Environmental Science,
                                              University of Potsdam, Potsdam, Germany, 8Helmholtz Centre Potsdam, German Research Center for Geosciences,
                                              Potsdam, Germany
Supporting Information:
• Supporting Information S1
• Table S1
                                              Abstract Earthquake-induced landslide (EQIL) inventories are essential tools to extend our knowledge of
Correspondence to:
                                              the relationship between earthquakes and the landslides they can trigger. Regrettably, such inventories
H. Tanyaş,                                    are difficult to generate and therefore scarce, and the available ones differ in terms of their quality and level
h.tanyas@utwente.nl                           of completeness. Moreover, access to existing EQIL inventories is currently difficult because there is no
                                              centralized database. To address these issues, we compiled EQIL inventories from around the globe based on
Citation:                                     an extensive literature study. The database contains information on 363 landslide-triggering earthquakes
Tanyaş, H., van Westen, C. J., Allstadt,      and includes 66 digital landslide inventories. To make these data openly available, we created a repository to
K. E., Anna Nowicki Jessee, M., Görüm, T.,
Jibson, R. W., … Hovius, N. (2017).
                                              host the digital inventories that we have permission to redistribute through the U.S. Geological Survey
Presentation and analysis of a world-         ScienceBase platform. It can grow over time as more authors contribute their inventories. We analyze the
wide database of earthquake-induced           distribution of EQIL events by time period and location, more specifically breaking down the distribution
landslide inventories. Journal of
Geophysical Research: Earth Surface, 122,
                                              by continent, country, and mountain region. Additionally, we analyze frequency distributions of EQIL
1991–2015. https://doi.org/10.1002/           characteristics, such as the approximate area affected by landslides, total number of landslides, maximum
2017JF004236                                  distance from fault rupture zone, and distance from epicenter when the fault plane location is unknown. For
                                              the available digital EQIL inventories, we examine the underlying characteristics of landslide size,
Received 30 JAN 2017
Accepted 20 AUG 2017
                                              topographic slope, roughness, local relief, distance to streams, peak ground acceleration, peak ground
Accepted article online 24 SEP 2017           velocity, and Modified Mercalli Intensity. Also, we present an evaluation system to help users assess the
Published online 30 OCT 2017                  suitability of the available inventories for different types of EQIL studies and model development.

                                              1. Introduction
                                              Losses due to earthquake-triggered landslides can be significant, and for some events they exceed losses
                                              directly due to shaking (Bird & Bommer, 2004; Harp et al., 1984). Approximately 70% of all earthquake-related
                                              casualties not caused by ground shaking are caused by landslides (Marano et al., 2010). From 2004 to 2010 a
                                              total of 47,736 earthquake-induced landslide (EQIL) casualties were reported (Kennedy et al., 2015; Petley,
                                              2012). In addition, EQIL commonly have considerable indirect and long-term effects on society and infrastruc-
                                              ture that intensify their overall damage (e.g., Huang & Fan, 2013; Shafique et al., 2016) such as blocked roads
                                              that hamper medical care (Marui & Nadim, 2009), floods from the failure of landslide dams, increased debris-
                                              flow activity (e.g., Shieh et al., 2009; Tang et al., 2016), and downstream river aggradation and associated
                                              flooding (e.g., Korup, 2006).
                                              Papers having both worldwide (Keefer, 1984; Rodriguez et al., 1999) and national (Hancox et al., 2002;
                                              Papadopoulos & Plessa, 2000; Prestininzi & Romeo, 2000) perspectives have established a baseline for under-
©2017. The Authors.                           standing the relations among EQIL distributions, landslide types, and areas of coverage. However, several
This is an open access article under the      authors have demonstrated that these relationships have high uncertainty, and they are not always valid
terms of the Creative Commons
Attribution-NonCommercial-NoDerivs
                                              (e.g. Barlow et al., 2014; Gorum et al., 2014; Hancox et al., 2002; Jibson et al., 2004; Jibson & Harp, 2012). A
License, which permits use and distri-        number of explanations have been given to explain this uncertainty. Hancox et al. (2002) stated that the data
bution in any medium, provided the            used to derive these relationships might be inadequate to characterize the whole world, as the work by
original work is properly cited, the use is
non-commercial and no modifications
                                              Keefer (1984) was based predominantly on earthquakes in North America, and data sets belonging to differ-
or adaptations are made.                      ent climatic, geologic, and topographic conditions may give different results. Jibson and Harp (2012) found

TANYAŞ ET AL.                                              EARTHQUAKE-INDUCED LANDSLIDE INVENTORIES                                                             1991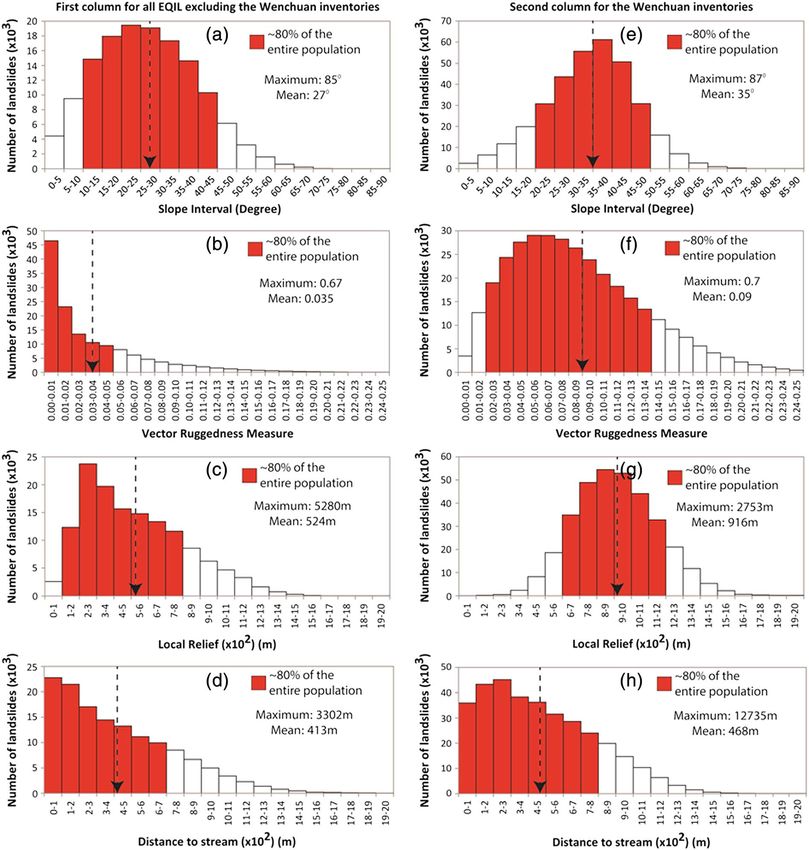
Journal of Geophysical Research: Earth Surface                                         10.1002/2017JF004236

                    that landslide distance limits differ between plate boundary earthquakes, which made up most of Keefer’s
                    (1984) data set, and intraplate earthquakes, where seismic wave attenuation is generally much lower.
                    Furthermore, Gorum et al. (2014) concluded that estimating the number of coseismic landslides from
                    earthquake magnitude alone remains highly problematic. It is well established that the ground shaking
                    experienced at a given location depends on numerous factors beyond just magnitude, such as local site con-
                    ditions, source mechanism, region, depth, and rupture directivity. Therefore, the existence and the reliability
                    of the input data such as digital elevation model, geologic map, and ground-shaking parameters are also
                    essential for a comprehensive analysis.
                    A few authors have started to develop models that take a more complete view of the driving factors (e.g.,
                    Kritikos et al., 2015; Marc, Hovius, & Meunier, 2016; Nowicki et al., 2014). However, the literature is still
                    relatively sparse, in part because it is challenging and time consuming to pull together input data sets
                    (e.g., EQIL inventories) that cover the wide range of conditions under which EQIL occurs. The importance
                    of different tectonic, geomorphologic, and climatic settings to landslide distribution patterns and the
                    internal relation between EQIL-related factors such as landslide number, size-frequency distribution,
                    and total landslide-affected area still requires further investigation using EQIL inventories from many
                    different environments.
                    Even though landslide susceptibility assessment using different statistical analyses has become a common
                    approach, the use of seismic indicators in these analyses to estimate EQIL hazard is still rare (Budimir et al.,
                    2014; Carro et al., 2003; Gallen et al., 2016; Lee, 2014; Marzorati et al., 2002; Nowicki et al., 2014; Robinson
                    et al., 2017). The generation of EQIL hazard maps for new or scenario events is complicated as each earth-
                    quake has specific characteristics, and existing EQIL inventories only reflect the characteristics of a single
                    earthquake. For statistical EQIL hazard assessments, many more EQIL inventories are needed to represent
                    the response to different amounts of ground shaking and regional differences in landslide susceptibility.
                    Physically based methods are not prone to the same limitations, but the existing models are still rather simple
                    and focus mainly on shallow landslides by applying the widely used Newmark method (Jibson et al., 2000).
                    Other models use weighted approaches that combine a number of factor maps but do not use information
                    on frequency and expected landslide densities (e.g., Kritikos et al., 2015) or utilize statistical approaches that
                    assume a single relationship between landslide occurrence and susceptibility to landsliding across the globe
                    (e.g., Nowicki et al., 2014).
                    A limited number of preliminary studies have used EQIL inventories to produce globally applicable models
                    for near real-time prediction of seismically induced landslides (Godt et al., 2008; Kritikos et al., 2015; Marc,
                    Hovius, Meunier, Gorum et al., 2016; Nowicki et al., 2014). Though they are not yet sufficiently mature to oper-
                    ationally inform disaster response after earthquakes, the development of such models benefits greatly from
                    the availability of past data for model development and testing. The more data available, the better the mod-
                    els can become.
                    Beyond its value for the hazard studies, having more EQIL data could also help us to improve our understand-
                    ing in terms of some other natural processes such as erosion, sediment transportation, landscape evolution,
                    and climatic and environmental change. For example, Malamud et al. (2004b) relate the magnitude of
                    earthquakes to erosion rates using EQIL inventories. Parker et al. (2011) analyze the relationships between
                    coseismic slip, mass wasting, and relief generation considering the landslides triggered by the Wenchuan
                    earthquake. Marc, Hovius, Meunier, Gorum et al. (2016) use EQIL inventories to derive total landslide volumes
                    and area affected. Later, Marc, Hovius, and Meunier (2016) use this knowledge to assess seismic mass-balance
                    over multiple earthquakes. Gallen et al. (2015) suggest the EQIL inventories can be a useful tool to probe the
                    near-surface environment for spatial patterns of material strength. On the other hand, Schlögel et al. (2011)
                    try to detect climatic and environmental change by analyzing landslide inventories. Although the authors do
                    not use particularly the EQIL inventories in their studies, having a larger EQIL database could also provide
                    opportunity to increase the quality in such studies.
                    These findings emphasize the importance of collecting EQIL inventories from as many past events as possible
                    and making them easily accessible to the EQIL community. We can use them to better understand the causal
                    factors of the landslide distribution under different conditions, which can help determine landslide suscept-
                    ibility, hazard, vulnerability, and risk, and can provide rapid assessments of landslide densities after an earth-
                    quake (Guzzetti et al., 2012). Though there are two national scale EQIL databases for Italy (Martino et al., 2014)

TANYAŞ ET AL.                    EARTHQUAKE-INDUCED LANDSLIDE INVENTORIES                                                       1992
Journal of Geophysical Research: Earth Surface                                               10.1002/2017JF004236

                    Figure 1. Schematic graph showing the different types of EQIL data sources. The numbers in the lower right corner refer to
                    the number of EQIL events of each data type currently available to our knowledge.

                    and New Zealand (Rosser et al., 2017), currently no global-scale centralized database exists for recording
                    these events and storing the available inventory maps.
                    In this work, we strive to overcome and account for some of these issues, which are mainly caused by the
                    scarcity of data, in order to create an openly available EQIL database and promote progress in this field.
                    We have compiled 66 digital EQIL inventories from numerous authors. We have created a centralized repo-
                    sitory using the U.S. Geological Survey’s ScienceBase platform for sharing the inventories that we have per-
                    mission from the original authors to redistribute.
                    In the following sections, we present the results of our compilation. First, we summarize the EQIL data sources
                    and define different data types to categorize them. Based on the available inventories, we analyze EQIL dis-
                    tributions for different years, continents, countries, and mountain belts. Frequency distributions are pre-
                    sented for some of the reported EQIL parameters such as total area affected, total number of landslides,
                    landslide area, maximum distance from fault rupture and epicenter location, slope angle, ruggedness, local
                    relief, distance to stream, peak ground acceleration (PGA), peak ground velocity (PGV), and Modified
                    Mercalli Intensity (MMI). We conclude by establishing a schema for evaluating EQIL inventories utilizing pub-
                    lished standards for ideal inventories (Harp et al., 2011; Xu, 2014), applying this to the EQIL inventories in our
                    database, discussing implications for using EQIL inventories for a range of applications, and detailing the
                    ScienceBase repository we created for openly sharing EQIL inventories with the community.

                    2. EQIL Data Types
                    Earthquake-induced landslide information is presented in the literature with large variability in detail and
                    data format because they were generated by many different researchers with different methods, objectives,
                    and priorities. For some earthquakes, there are comprehensive spatial landslide data available, whereas for
                    other cases, we cannot even be sure whether a single landslide was triggered. For example, within 1 week
                    of the main shock of 15 April 2016 in Kumamoto earthquake (Mw = 7), the Geospatial Information
                    Authority of Japan provided a basic landslide inventory on their web site (http://www.gsi.go.jp/). This swift
                    provision is attributed to efficient landslide interpretation and mapping using ortho-photos, produced by
                    digital aerial photos, Global Navigation Satellite System and Inertial Measurement Unit measured aerial trian-
                    gulation, and semi-automated mosaic image producing. On the other hand, for the earthquake of 7
                    December 2015 that occurred in mountainous region of Tajikistan (Mw = 7.2), no information on landslide
                    occurrence is available. Because of gaps such as this, there are an unknown number of undocumented events
                    in addition to the known EQIL events presented here.
                    Figure 1 illustrates how we can evaluate information obtained from different sources. The first major division
                    separates earthquakes with or without reported landslides. Depending on this division, we have defined five
                    types of data sources ranging from Type 1 to Type 5.

TANYAŞ ET AL.                    EARTHQUAKE-INDUCED LANDSLIDE INVENTORIES                                                               1993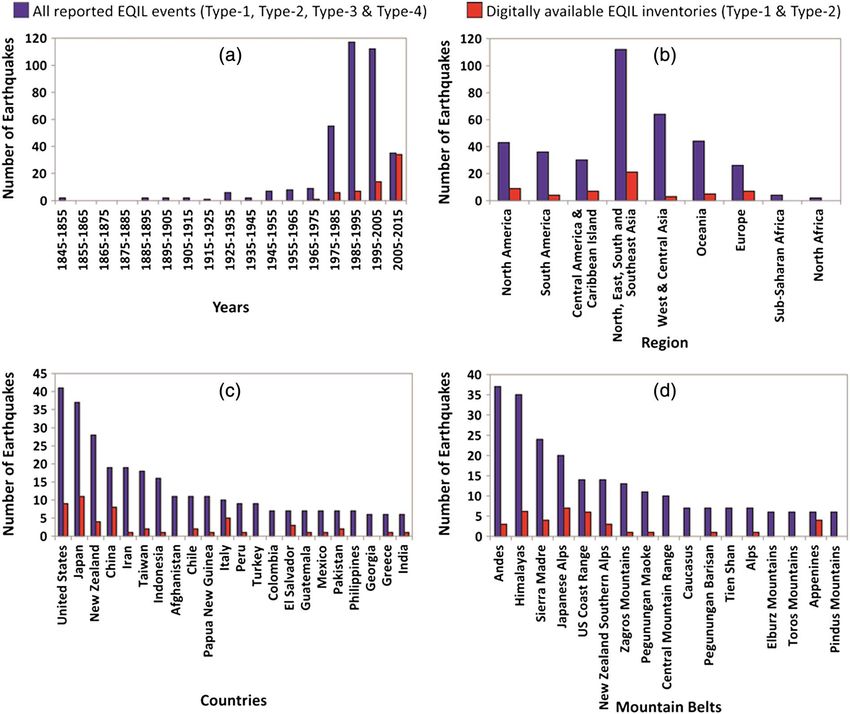
TANYAŞ ET AL.
EARTHQUAKE-INDUCED LANDSLIDE INVENTORIES
Journal of Geophysical Research: Earth Surface
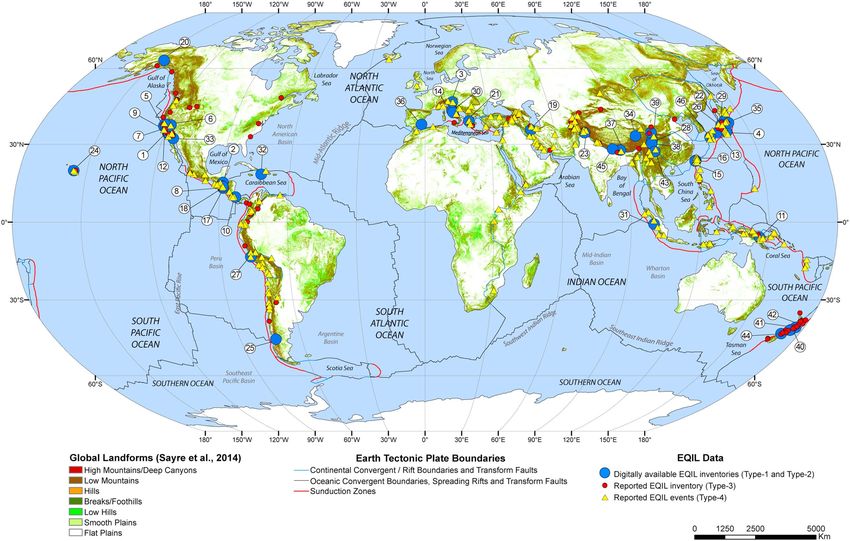
Figure 2. Location of EQIL reported events (with and without inventories; digitally available EQIL inventories are marked with same IDs listed in Table 1).
10.1002/2017JF004236
1994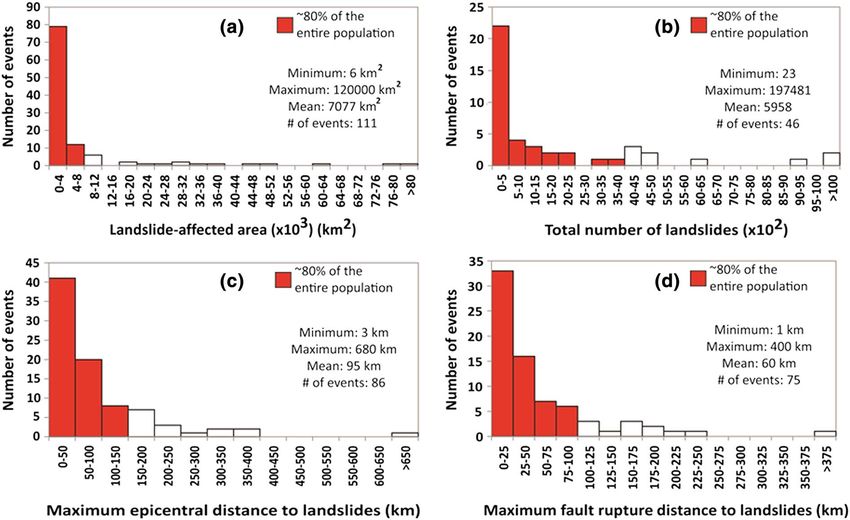
Journal of Geophysical Research: Earth Surface                                         10.1002/2017JF004236

                    Landslide inventory maps are the most useful EQIL data source. Ideally, they contain records on the location,
                    date of occurrence, and attribute information such as age, depth of failure, degree and style of activity, and
                    landslide type for each mapped landslide (Guzzetti et al., 2000; Guzzetti et al., 2012; Hansen, 1984; McCalpin,
                    1984; Pašek, 1975; Wieczorek, 1984). However, to our knowledge, no EQIL inventory satisfies all these ideal
                    conditions. In reality, ancillary information such as landslide size and (or) type can be presented at best in
                    high-detail EQIL inventories. In this study, we have named these high-detail inventories data source Type 1
                    (Figure 1). However, such inventories are compiled for few earthquakes that trigger landslides, and we
                    observe that many of the available inventories lack the relevant attribute information. We have named these
                    low-detail inventories data source Type 2 (Figure 1).
                    In this study, we have collected either the digital or hardcopy versions of the inventories after contacting the
                    authors or organizations producing the inventories. We have converted the hardcopy inventory maps to
                    shape files that can be used in a GIS. As a result of these efforts, we were able to collect EQIL digital inventory
                    maps for 46 earthquakes (Figure 2 and Table 1). For some earthquakes, multiple inventories are available
                    from different sources; therefore, we have 64 digital EQIL inventories that can be classified as either Type-1
                    or 2-data. More EQIL inventories have been produced, but the originators of these data either did not
                    respond, declined to share their inventories, or we did not know about them.
                    In several cases, the publications describing EQIL do not contain actual inventory maps, and only the general
                    characteristics of the landslide distribution are given (Type-3 inventories). For example, Keefer (1984) used 40
                    EQIL inventories in his study. Although this is one of the few global-scale EQIL studies, only a limited number
                    of inventory maps referred to in this study are accessible today. D. K. Keefer (written communication(s), 2016)
                    indicated that EQIL inventory maps were only available for a few of the 40 reported earthquakes, and the
                    general relations and conclusions reported were pieced together from various resources, listed in Keefer
                    and Tannaci (1981). Information from the general characteristics of these events can still be significant,
                    and thus we add the Type-3 events to our database. Because EQIL characteristics cannot be directly verified
                    from an inventory, Type-3 events might introduce more uncertainty and outliers into the observations, and
                    thus these data should be used with care. We carried out an extensive literature review of EQIL events and
                    were able to find an additional 89 earthquakes having at least one reported EQIL inventory (Type 3 in
                    Figure 1). We have extracted some landslide characteristics for these events, such as the approximate
                    landslide-affected area, the total number of landslides, and the maximum landslide distance to the epicenter
                    and rupture zone. Additionally, we listed fault types, earthquake magnitude, and focal depth for these events.
                    The complete list is presented in Table S1 in the supporting information.
                    In addition to the above mentioned EQIL data types, for some earthquakes we only know of the existence of
                    triggered landslides without any other information. For these events, we do not have reliable qualitative,
                    quantitative, or spatial information on the triggered landslides. We have named this data source Type 4
                    (Figure 1). Marano et al. (2010) compiled such events in their study; they used the catalogue of the U.S.
                    Geological Survey’s Prompt Assessment of Global Earthquakes for Response (PAGER) system, PAGERCAT
                    (Allen et al., 2009). This database was compiled from news reports and official sources available at the time
                    of publishing. Based on this catalogue, 276 earthquakes from 1968 to 2008 had confirmed EQIL occurrences,
                    of which 51 overlap with events classified as Type 3, Type 2, or Type 1. Therefore, the database from Marano
                    et al. (2010) contributes 225 additional landslide-triggering earthquakes (Figure 2), giving a total of 363
                    reported EQIL events.
                    It is also useful to collect data on null events (earthquakes in mountainous environments that did not trig-
                    ger landslides) in order to understand the causes and mechanisms of EQIL. If no landslides are reported for
                    a particular earthquake, it may be that the earthquake did not cause any landslides, or that it did but the
                    landslides were not documented. We classify these as Type 5 (Figure 1). However, no official recording pro-
                    cedure exists for earthquakes that do not trigger landslides. Therefore, identifying null events with certainty
                    is not possible.

                    3. Analysis of EQIL Characteristics
                    In what follows, we review the characteristics of the EQIL events presented in this database, discussing gen-
                    eral aspects of each inventory; important characteristics to consider before utilizing these data are discussed,
                    including specific features of EQIL inventories of Type 1 and Type 2.

TANYAŞ ET AL.                    EARTHQUAKE-INDUCED LANDSLIDE INVENTORIES                                                       1995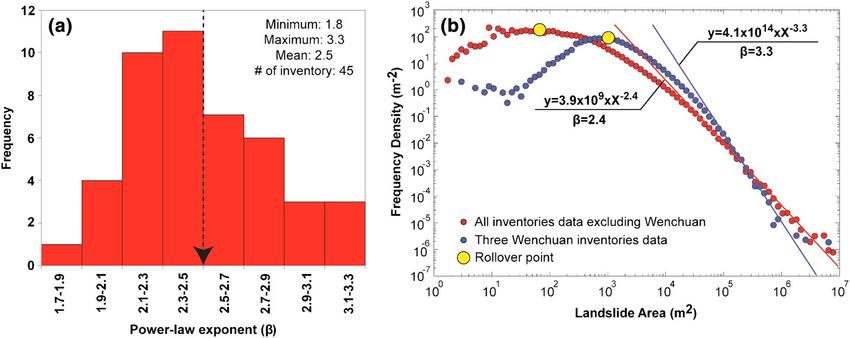
Table 1
List of the Digitally Available EQIL Inventories (as of September 2016)
Epicenter Data Depth Number of Total landslide Fault
2
ID Location Date /time location type Magnitude (km) landslides area (km ) type Reference study
TANYAŞ ET AL.
a
1 San Fernando, California (USA) 1971-02-09 /14:00:41 UTC 34.416°N Pt 6.6 (Mw) 8.9 391 N/A S Morton (1971)
118.370°W
2 Guatemala 1976-02-04/09:01:43 UTC 15.324°N Plg 7.5 (Mw) 5.0 6,224 60.8 S Harp et al. (1981)
89.101°W
3 Friuli (Italy) 1976-05-06/20:00:11 UTC 46.356°N Plg/Pt 6.5 (Ms) 9.0 1,007 1.1 T Govi (1977)
13.275°E
4 Izu Oshima Kinkai (Japan) 1978-01-14/03:24:39 UTC 34.809°N Plg 6.6 (Ms) 14.0 659 1.5 S Suziki (1979)
139.259°E
5 Mount Diablo, California (USA) 1980-01-24/19:00:09 UTC 37.852°N Pt 5.8 (Mw) 11.0 105 N/A S Wilson et al. (1985)
121.815°W
a
6 Mammoth Lakes, California (USA) 1980-05-25/19:44:50 UTC 37.696°N Plg 6.5 (ML) 6.0 4,027 33.8 NDC Harp et al. (1984)
118.750°W
7 Coalinga, California (USA) 1983-05-02/23:42:37 UTC 36.240°N Plg 6.7 (ML) 9.6 3,980 4.8 T Harp and Keefer (1990)
120.300°W
8 San Salvador (El Salvador) 1986-10-10/17:49:24 UTC 13.827°N Pt 5.7 (Mw) 7.0 268 N/A S Rymer (1987)
89.118°W
9a Loma Prieta, California (USA) 1989-10-18/00:04:15 UTC 37.036°N Pt 6.9 (Mh) 17.2 1775 N/A T Keefer and Manson (1998)
9b Loma Prieta, California (USA) 121.880°W Plg 138 0.4 T McCrink (2001)
10 Limon (Costa Rica) 1991-04-22/21:56:51 UTC 9.685°N Plg 7.6 (Mw) 10.0 1,643 8.2 T Marc, Hovius, and Meunier (2016)
83.073°W
a
11 Finisterre Mt./(Papua N. G.) 1993-10-13/02:06:00 UTC 5.889°S Plg 6.9 (Mw) 25.3 4,790 69.0 T Meunier et al. (2008)
146.020°E
12 Northridge, California (USA) 1994-01-17/12:30:55 UTC 34.213°N Plg 6.7 (Mw) 18.2 11,111 23.8 T Harp and Jibson (1995)
118.537°W
13 Hyogo-ken Nanbu (Japan) 1995-01-16/20:46:52 UTC 34.583°N Plg 6.9 (Mw) 21.9 2,353 0.5 S Uchida et al. (2004)
135.018°E
a
14a Umbria-Marche (Italy) 1997-09-26/09:40:26 UTC 43.084°N Pt 6.0 (Mw) 10.0 233 N/A N Esposito et al. (2000) and Antonini et al. (2002)
a
14b Umbria-Marche (Italy) 12.812°E Plg 210 1.9 Marzorati et al. (2002)
15 Jueili (Taiwan) 1998-07-17/04:51:14 UTC 23.407°N Plg 5.7 (Mw) 12.6 847 4.8 T Huang and Lee (1999)
120.736°E
16 Chi-Chi (Taiwan) 1999-09-20/17:47:18 UTC 23.772°N Plg 7.7 (Mw) 33.0 9,272 127.5 T Liao and Lee (2000)
120.982°E
17 Santa Tecla (El Salvador) 2001-01-13/17:33:32 UTC 13.049°N Pt 7.7 (Mw) 60.0 139 N/A N Ministerio de Medio Ambiente y Recursos
88.660°W Naturales, El Salvador (2001)
18 Santa Tecla (El Salvador) 2001-02-13/14:22:05 UTC 13.671°N Pt 6.6 (Mw) 10.0 62 N/A S
EARTHQUAKE-INDUCED LANDSLIDE INVENTORIES
88.938°W
19 Avaj (Iran) 2002-06-22/02:58:21 UTC 35.626°N Pt 6.5 (Mw) 10.0 50 N/A T Mahdavifar et al. (2006)
49.047°E
Journal of Geophysical Research: Earth Surface
20 Denali Alaska (USA) 2002-11-03/22:12:41 UTC 63.517°N Plg 7.9 (Mw) 4.9 1,579 121.2 S Gorum et al. (2014)
147.444°W
21 Lefkada Ionian Islands (Greece) 2003-08-14/05:14:54 UTC 39.160°N Plg 6.3 (Mw) 10.0 274 2.9 S Papathanassiou et al. (2013)
20.605°E
a
22a Mid-Niigata (Japan) 2004-10-23/08:56:00 UTC 37.226°N Plg 6.6 (Mw) 16.0 10,516 14.4 T GSI of Japan (2005)
a
22b Mid-Niigata (Japan) 138.779°E Plg 4,615 12.6 Sekiguchi and Sato (2006)
a
22c Mid-Niigata (Japan) Plg 3,922 8.1 Yagi et al. (2007)
23a Kashmir (India-Pakistan) 2005-10-08/03:50:40 UTC 34.539°N Plg 7.6 (Mw) 26.0 2,424 10.4 T Sato et al. (2007)
23b Kashmir (India-Pakistan) 73.588°E Plg 1,461 49.9 Basharat et al. (2014)
23c Kashmir (India-Pakistan) Plg 2,930 109.4 Basharat et al. (2016)
24 Kiholo Bay (Hawaii) 2006-10-15/17:07:49 UTC 19.878°N Plg 6.7 (Mw) 38.9 383 2.8 N Harp et al. (2014)
155.935°W
a
25a Aysen Fjord (Chile) 2007-04-21/17:53:46 UTC 45.243°S Plg 6.2 (Mw) 36.7 540 17.2 S Sepúlveda et al. (2010)
a
25b Aysen Fjord (Chile) 72.648°W Plg 517 13.2 S Gorum et al. (2014)
10.1002/2017JF004236
26a Niigata Chuetsu-Oki (Japan) 2007-07-16/01:13:22 UTC 37.535°N Plg 6.6 (Mw) 12.0 312 0.4 T Kokusai Kogyo (2007)
26b Niigata Chuetsu-Oki (Japan) 138.446°E Pt 70 N/A Collins et al. (2012)
1996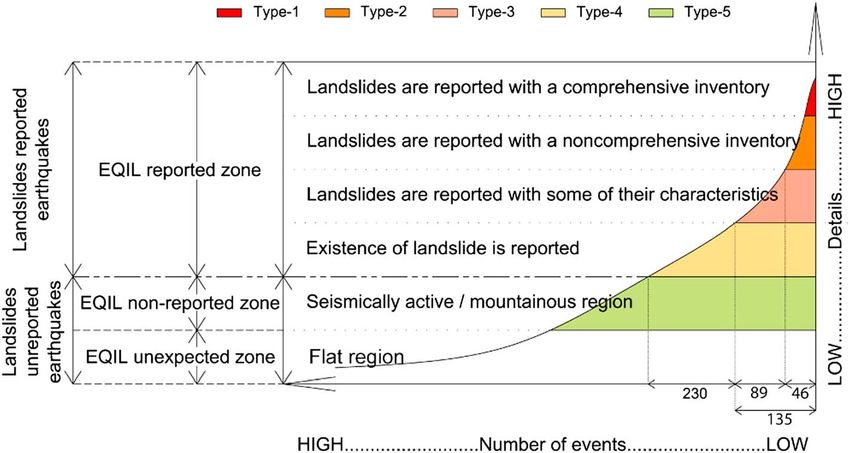
Table 1. (continued)
Epicenter Data Depth Number of Total landslide Fault
2
ID Location Date /time location type Magnitude (km) landslides area (km ) type Reference study
TANYAŞ ET AL.
27 Pisco/(Peru) 2007-08-15/23:40:57 UTC 13.386°S Plg 8.0 (Mw) 39.0 271 1.1 T Lacroix et al. (2013)
76.603°W
28a Wenchuan (China) 2008-05-12/06:28:01 UTC 31.002°N Pt 7.9 (Mw) 19.0 13,114 N/A T Qi et al. (2010)
28b Wenchuan (China) 103.322°E Plg 59,108 812.2 Dai et al. (2011)
28c Wenchuan (China) Pt 60,109 N/A Gorum et al. (2011)
28d Wenchuan (China) Plg 197,481 1159.9 Xu, Xu, Yao et al. (2014)
28e Wenchuan (China) Plg 69,605 530.3 Li et al. (2014)
28f Wenchuan (China) Plg 6,727 54.6 Tang et al. (2016)
29 Iwate-Miyagi Nairiku (Japan) 2008-06-13/23:43:45 UTC 39.030°N Plg 6.9 (Mw) 7.8 4,211 14.4 T Yagi et al. (2009)
140.881°E
a
30a L’Aquila/Abruzzo (Italy) 2009-04-06/01:32:39 UTC 42.334°N Pt 6.3 (Mw) 8.8 570 N/A N Guzzetti et al. (2009)
a
30b L’Aquila/Abruzzo (Italy) 13.334°E Pt 89 N/A Piacentini et al. (2013)
31 Sumatra (Indonesia) 2009-09-30/10:16:09 UTC 0.720°S Pt 7.6 (Mw) 81.0 87 N/A T Umar et al. (2014)
99.867°E
32a Haiti 2010-01-12/21:53:10 UTC 18.443°N Plg 7.0 (Mw) 13.0 4,490 7.98 S Gorum et al. (2013)
32b Haiti 72.571°W Plg 23,567 24.85 Harp et al. (2016)
33 Sierra Cucapah (Mexico) 2010-04-04/22:40:42 UTC 32.286°N Plg 7.2 (Mw) 10.0 453 0.7 S Barlow et al. (2014)
115.295°W
34 Yushu (China) 2010-04-13/23:49:38 UTC 33.165°N Plg 6.9 (Mw) 17.0 2,036 1.2 S Xu et al. (2013)
96.548°E
35 Eastern Honshu (Japan) 2011-03-11/05:46:24 UTC 38.297°N Plg 9.1 (Mw) 29.0 3,475 4.35 T Wartman et al. (2013)
142.373°E
36 Lorca (Spain) 2011-05-11/16:47:25 UTC 37.699°N Pt 5.1 (Mw) 1.0 270 N/A S Alfaro et al. (2012)
1.672°W
37 Sikkim (India) 2011-09-18/12:40:51 UTC 27.730°N Pt 6.9 (Mw) 50.0 164 N/A S Chakraborty et al. (2011)
88.155°E
38a Lushan (China) 2013-04-20/00:02:47 UTC 30.308°N Plg 6.6 (Mw) 14.0 1,289 5.2 T Li et al. (2013)
38b Lushan (China) 102.888°E Pt 15,546 18.5 Xu et al. (2015)
39 Minxian-Zhangxian (China) 2013-07-21/23:45:56 UTC 34.512°N Plg 5.9 (Mw) 8.0 2,330 0.8 T Xu, Xu, Shyu et al. (2014)
104.262°E
40 Cook Straight (New Zealand) 2013-07-21/05:09:31 UTC 41.704°S Pt 6.5 (Mw) 17.0 35 N/A S Van Dissen et al. (2013)
174.337°E
41 Lake Grassmere (New Zealand) 2013-08-16/02:31:05 UTC 41.734°S Pt 6.5 (Mw) 8.2 501 N/A S Van Dissen et al. (2013)
174.152°E
EARTHQUAKE-INDUCED LANDSLIDE INVENTORIES
42 Eketahuna (New Zealand) 2014-01-20/02:52:44 UTC 40.660°S Pt 6.1 (Mw) 28.0 176 N/A N Rosser et al. (2014)
175.814°E
43 Ludian (China) 2014-08-03/08:30:13 UTC 27.189°N Plg 6.2 (Mw) 12.0 1,024 5.2 S Ying-ying et al. (2015)
Journal of Geophysical Research: Earth Surface
103.409°E
44 Wilberforce (New Zealand) 2015-01-05/17:48:42 UTC 43.055°S Pt 5.6 (Mw) 8.1 265 N/A S GNS Science (2015)
171.236°E
45a Gorkha (Nepal) 2015-04-25 06:11:25 UTC 28.231°N Pt 7.8 (Mw) 8.2 4,312 N/A T Kargel et al. (2016)
a
45b Gorkha (Nepal) 84.731°E Plg 2,654 15.6 Zhang et al. (2016)
45c Gorkha (Nepal) Plg 2,513 14.2 H. Tanyas, University of Twente,
unpublished data, 2015
45d Gorkha (Nepal) Plg 24,903 86.5 Roback et al. (2017)
46a Kumamoto (Japan) 2016-04-15/16:25:06 UTC 32.791°N Plg 7.0 (Mw) 10.0 336 1.8 S DSPR-KU (2016)
46b Kumamoto (Japan) 130.754°E Plg 2,742 8.2 NIED (2016)
Note. Inventories having the same number (e.g., 6a and 6b) relate to the same earthquake.
a
Landslides that can be attributed to more than one earthquake (Mw: Moment magnitude; Ms: Surface-wave magnitude; ML: Local magnitude; Plg: Polygon; Pt: Point; S: Strike-slip fault; T: Thrust
fault; N: Normal fault; NDC: Nondouble couple earthquake).
10.1002/2017JF004236
1997Journal of Geophysical Research: Earth Surface 10.1002/2017JF004236
Figure 3. Number of reported EQIL events and digitally available EQIL inventories shown by (a) 10 year period, (b) region, (c) country, and (d) mountain belt.
3.1. Analysis of Reported EQIL Events
Although our database of 363 reported EQIL events includes events as early as the 1840s, more than 85%
of the known events were documented after 1975 (Figure 3a). Since that time, innovations in data acqui-
sition systems and remote sensing techniques have led to a sharp increase in the quantity of reported
EQIL events and digitally available inventories. Because the data provided from the PAGER system only
covers 1968–2008, and we divide the data into 10 year intervals, an artificial decrease is shown in the
number of reported events occurring after 2005 (Figure 3a). Work is ongoing to continue the PAGER-
related work for the period from 2008 until present.
Overall, only 10% of reported EQIL events have available digital inventories. About 90% of the reported
EQIL events are from America, Oceania, and Asia. Only a few inventories are available for Europe, and
none exist for Africa (Figure 3b and Table 2). About half of the inventories come from the USA,
Japan, New Zealand, China, Iran, Taiwan, and Indonesia (Figure 3c and Table 2). For both Iran and
Indonesia, only one digital inventory is available, although almost 20 EQIL events were reported
for each.
From a morphological point of view, about 80% of all reported events and inventories belong to major moun-
tain belts (Figure 3d and Table 2), such as the Andes, Himalayas, Sierra Madre, Japanese Alps, U.S. Coast
Range, New Zealand Southern Alps, and Zagros Mountains.
TANYAŞ ET AL. EARTHQUAKE-INDUCED LANDSLIDE INVENTORIES 1998Journal of Geophysical Research: Earth Surface 10.1002/2017JF004236
Table 2
Number of EQIL Reported Events by Country, Region, and Mountain Belt
a a a
Country # of Inv/# of Eqs Region (# of Inv/# of Eqs ) Mountain Belt # of Inv/# of Eqs
Canada 0/2 North America (9/44) Alaska Range 1/3
Appalachian Mountains 0/3
Cascade Range 0/5
Coastal Mountains 0/1
United States 9/42 Coast Range 6/15
Rocky Mountains 0/2
Sierra Nevada 1/3
Argentina 0/2 South America (3/36) Andes 3/37
Bolivia 0/1
Chile 2/11
Colombia 0/7
Ecuador 0/5
Peru 1/9
Venezuela 0/1
Costa Rica 1/5 Central America and Caribbean Island (8/30) Sierra Madre 4/24
Dominican Rep. 0/1
El Salvador 3/7
Guatemala 1/7
Haiti 2/1
Mexico 1/7
Nicaragua 0/1
Panama 0/1
Bangladesh 0/1 North, East, South, and Southeast Asia (29/113) Alishan Range 2/3
Altay Mountains 0/3
China 10/19 Caucasus 0/7
Central Mountain Range 0/10
India 1/6 Cordillera Central 0/4
Dalou Mountains 3/3
Indonesia 1/16 Himalayas 8/35
Japanese Alps 7/20
Japan 11/37 Kunlan Shan 0/2
Myanmar 0/1 Qinling Mountains 1/3
Nepal 5/4 Pegunungan Barisan 1/7
Philippines 0/7 Xueshan Range 0/5
Russia 0/3 Sierra Madre 0/1
Taiwan 2/18 Tien Shan 0/7
Afghanistan 0/11 West and Central Asia (3/64) Eastern Black Sea Mountains 0/4
Armenia 0/1
Cyprus 0/1 Elburz Mountains 0/6
Georgia 0/6
Iran 1/19 Sulaiman Range 0/1
Kyrgyzstan 0/1
Pakistan 3/7 Tiamat Ash Shan 0/2
Palestine 0/1
Tajikistan 0/5 Toros Mountains 0/6
Turkey 0/9
Uzbekistan 0/1 Zagros 1/13
Yemen 0/2
Guam 0/1 Oceania (5/44) Central Range (Pegunungan Maoke) 1/11
New Zealand 4/28
Papua New Guinea 1/11
Solomon Island 0/1 Southern Alps 3/14
Vanuatu 0/3
Bosnia and Herzegovina 0/1 Europe (8/26) Alps 1/7
Croatia 0/1
France 0/1 Appenines 4/6
Greece 1/6
Iceland 0/1 Cambrian Mountains 0/1
Italy 6/10
Romania 0/1 Carpathian 0/1
TANYAŞ ET AL. EARTHQUAKE-INDUCED LANDSLIDE INVENTORIES 1999Journal of Geophysical Research: Earth Surface 10.1002/2017JF004236
Table 2. (continued)
a a a
Country # of Inv/# of Eqs Region (# of Inv/# of Eqs ) Mountain Belt # of Inv/# of Eqs
Slovenia 0/2
Serbia 0/1 Dinaric Alps 0/3
Spain 1/1 Pindus Mountains 0/6
United Kingdom 0/1 Vatnajökull 0/1
Algeria 0/1 North Africa (0/2) Atlas Mountains 0/2
Morocco 0/1 Drakensberg 0/1
South Africa 0/1 Ethiopian Highlands 0/1
Sudan 0/1 Sub-Saharan Africa (0/4) Kenyan Highlands 0/2
Uganda 0/1
a
Number of digitally available EQIL inventories/number of reported EQIL events.
3.2. Analysis of Reported EQIL Characteristics
Here we examined the relation between documented characteristic features of Type-1, Type-2, and Type-3
EQIL events (Figure 1) and four parameters that are reported for the majority of the events (Table S1): the
approximate area affected by landslides, the total number of landslides, the maximum distance from the
fault-rupture zone, and the epicentral distance. To calculate the approximate area affected by landslides,
we defined a polygon including the all landslides for the analyzed inventory and calculate the area of that
polygon. For the maximum distance measures, we took the farthest landslide and calculated its perpendicu-
lar distance to the fault-rupture zone and earthquake epicenter. To identify the fault-rupture zone, we used
the fault trace if there is no surface rupture. For Type-1 and Type-2 events, we obtained the available fault
plane/surface rupture and epicenter location from the literature.
Figure 4 shows the frequency distribution of the EQIL events for these parameters, without taking into
account different levels of completeness. However, the level of completeness influences the total area
Figure 4. Frequency values and basic statistics for (a) the landslide-affected area, (b) the total number of landslides, (c) the maximum epicentral distance to land-
slides, and (d) the maximum fault-rupture distance to landslides. Red bars show the range of values for 80% of the total number of EQIL events in the database
for which information was available. Since many inventories are not complete, in most cases, these refer to minimum values.
TANYAŞ ET AL. EARTHQUAKE-INDUCED LANDSLIDE INVENTORIES 2000Journal of Geophysical Research: Earth Surface 10.1002/2017JF004236
affected by landslides and the total number of landslides in a given inventory, so these numbers should be
considered minimum values in most cases.
Although there is significant variability, more than 80% of the EQIL events affected areas (area containing all
mapped landslides) less than 10,000 km2; the maximum value is 120,000 km2 for the Wenchuan event
(Figure 4a). Likewise, for about 80% of the inventories, the total number of landslides is less than 4,000; how-
ever, about 200,000 landslides (Figure 4b) were triggered in the 2008 Wenchuan event (Xu, Xu, Yao et al.,
2014). Additionally, for about 80% of the inventories, maximum distances to epicenter and fault-rupture zone
are less than 150 km (Figure 4c) and 100 km (Figure 4d), respectively.
3.3. Analysis of Digital EQIL Inventories
Type-1 and Type-2 data provide means for detailed EQIL characterization. These data sources include 66 EQIL
inventories from 46 earthquakes, and each has a varying level of quality and completeness. Landslides were
delineated as polygon vector data for 44 of the available digital EQIL inventories; the other 22 were repre-
sented as points. To compare both types of inventories during this evaluation, we reduced each polygon
to a single point by assigning a point at the highest elevation of each landslide polygon (as a proxy for the
initial source point of the landslide). By doing so, we have 554,333 landslide-initiation points in this database;
this landslide population is dominated by the Wenchuan earthquake because 406,144 of the landslides
belong to six inventories for this event, which were made by five independent groups. The inventory of
Xu, Xu, Yao et al. (2014) can be considered as an updated version of the Dai et al. (2011) inventory. Even this
single Wenchuan inventory (Xu, Xu, Yao et al., 2014) contains approximately 76,000 more landslides than the
total of all other inventories. The Wenchuan event was an extraordinary EQIL event where a large magnitude
earthquake occurred along the steepest boundary of the Tibetan Plateau (Fielding, 1996; Liu-Zeng et al.,
2011). The anomalously large number of landslides triggered by this event dominates the observations com-
ing from different inventories. Joint evaluation of Wenchuan and other inventories can bias hazard upward.
Therefore, we decided to evaluate these five Wenchuan inventories separately, excluding the Dai et al. (2011)
inventory to avoid duplications.
The landslide points were analyzed first in terms of topographic factors including slope, local relief, dis-
tance to streams, and vector ruggedness measure (VRM). VRM is a terrain ruggedness measure that quan-
tifies local variation in terrain more independently of slope than other methods such as land surface
ruggedness index or terrain ruggedness index (Sappington et al., 2007). It is derived by incorporating
the heterogeneity of both slope and aspect. The Shuttle Radar Topography Mission digital elevation
model (about 30 m resolution) (NASA Jet Propulsion Laboratory, 2013) was used in the analyses.
Frequency distributions for these parameters show that the highest landslide frequencies are concen-
trated in particular intervals for all of these parameters (Figure 5). Landslides related to the Wenchuan
inventories show different distributions and mean values. When we look at the entire data set (excluding
Wenchuan inventories), the mean values for slope, VRM, local relief, and the distance to streams are 27°
(Figure 5a), 0.035 (Figure 5b), 524 m (Figure 5c), and 413 m (Figure 5d), respectively. However, for the
Wenchuan inventories, the mean values for the same parameters are 35° (Figure 5e), 0.09 (Figure 5f), 916 m
(Figure 5g), and 468 m (Figure 5h). Therefore, as explained earlier, we can have a better understanding of
the general characteristics of EQIL if we exclude the Wenchuan event. By excluding Wenchuan, we can con-
clude that about 80% of the remaining population of EQIL occurs within the interval of 10–45° (Figure 5a),
0–0.05 (Figure 5b), 200–800 m (Figure 5c), and 0–700 m (Figure 5d) for slope, VRM, local relief, and distance
to stream, respectively.
We investigated ground-shaking parameters in a similar manner. Estimated values of peak ground accelera-
tion (PGA), peak ground velocity (PGV), and Modified Mercalli Intensity (MMI) were obtained at the location of
each landslide from the U.S. Geological Survey (USGS) ShakeMap Atlas 2.0 (Garcia et al., 2012). As in the pre-
vious analysis, we discussed the Wenchuan inventories separately (Figure 6).
Contrary to what was found for the topographic parameters, the distributions and mean values for the
seismic parameters are quite similar for the Wenchuan inventories and all others. For the inventories exclud-
ing Wenchuan, the mean PGA, PGV, and MMI values are 0.5 m/s2 (Figure 6a), 47 cm/s (Figure 6b), and 7.3
(Figure 6c), and those for the three Wenchuan inventories are 0.6 m/s2 (Figure 6d), 35 cm/s (Figure 6e),
and 7.4 (Figure 6f). For the entire database excluding the Wenchuan event, approximately 80% of the
TANYAŞ ET AL. EARTHQUAKE-INDUCED LANDSLIDE INVENTORIES 2001Journal of Geophysical Research: Earth Surface 10.1002/2017JF004236
Figure 5. Frequency values of earthquake-induced landslides in intervals of (a) slope, (b) vector ruggedness measure (VRM), (c) local relief, and (d) distance to stream
for all EQIL excluding the Wenchuan inventories (in first column), and for the (e–h) Wenchuan inventories separately (in second column). The arrows point out
the mean values.
population of EQIL are observed in the interval for PGA of 0.1–0.8 m/s2 (Figure 6a), for PGV of 0–70 cm/s
(Figure 6b), and for MMI between 6.5 and 7.0 (Figure 6c).
We also analyzed the landslide-size distributions for the collected polygon-based landslide inventories in our
database. Multiple studies have shown that the frequency-area distribution (FAD) of medium and large land-
slides follows a power law (e.g., Guzzetti et al., 2002; Malamud et al., 2004a) with a characteristic power law
exponent. For most landslide inventories, noncumulative power law exponents occur in the range of 1.4–
3.4, with a central tendency of 2.3–2.5 (Stark & Guzzetti, 2009; Van Den Eeckhaut et al., 2007). We calculated
the power law exponents for 43 inventories in our database based on the method proposed by Clauset et al.,
(2009) and analyzed the number of inventories for the obtained power law exponent intervals (Figure 7a).
TANYAŞ ET AL. EARTHQUAKE-INDUCED LANDSLIDE INVENTORIES 2002Journal of Geophysical Research: Earth Surface 10.1002/2017JF004236
Figure 6. Frequency values of earthquake-induced landslides in intervals of (a) PGA, (b) PGV, and (c) MMI for all EQIL excluding the Wenchuan inventories (in first
column) and for the (d–f) Wenchuan inventories separately (in second column). The arrows point out the mean values.
The results showed that the mean exponent value is 2.5, consistent with findings cited above. Due to the high
population of medium-sized landslides, the two polygon-based Wenchuan inventories (Li et al., 2014; Xu, Xu,
Yao et al., 2014) yield the highest power law exponent values, which are 3.1 and 3.2. This could be caused by a
large number of amalgamated smaller landslides that increase the frequency of medium-sized landslides. We
also visually analyzed the range of landslide sizes in the EQIL inventories by combining all landslide polygon
areas from the inventories (separating the Wenchuan inventories from the others) and plotting the FADs
(Figure 7b). Similar to the FADs of the individual EQIL inventories, FADs of the combined inventories follow
the power law distribution, with power law exponent of 3.3 for the Wenchuan inventories and 2.3 for the
combination of all other inventories, which included 43 inventories provided by different groups using
different mapping techniques (Figure 7b). Mapped landslides range from a few square meters to a few
million square meters in area. The smaller landslides constitute the majority of the database. For the
Wenchuan inventories, 80% of all landslides are smaller than 8,000 m2, whereas, for the other inventories,
80% of the landslides are smaller than 4,000 m2. The rollover point (most commonly mapped landslide
size) is about 1,000 m2 for the Wenchuan inventories but only around 100 m2 for the combined FAD of
the other inventories. Also, the rollover in the Wenchuan inventories is relatively sharper in comparison
with the combined FAD of the other inventories. These differences are possibly caused by the mapping
procedure of landslides—so many landslides were triggered by Wenchuan earthquake, that it was not
practical to map the small ones completely.
TANYAŞ ET AL. EARTHQUAKE-INDUCED LANDSLIDE INVENTORIES 2003Journal of Geophysical Research: Earth Surface 10.1002/2017JF004236
Figure 7. (a) Frequencies for estimated power law exponents for the EQIL inventories and (b) the frequency-density distributions for the landslides gathered from all
inventories excluding the Wenchuan event (red) and the landslides gathered from the two Wenchuan inventories (blue). The arrow points out the mean value.
4. Evaluation of EQIL Inventories
A limited number of digital EQIL inventories are available worldwide, and the available ones differ greatly in
quality, completeness, and representation. Therefore, establishing guidelines and adequate metadata for
future inventories is essential (Wasowski et al., 2011).
Several studies analyzed the quality and completeness of landslide inventories using a number of criteria
(Gorum, 2013; Harp et al., 2011; Keefer, 2002; Wasowski et al., 2011). Harp et al. (2011) defined three basic
criteria for evaluating inventories: (1) coverage of the entire area affected by landslides, (2) inclusion of all
landslides down to a small enough scale, and (3) depiction of landslides as polygons rather than points.
They listed 10 inventories that satisfied these criteria and thus can be considered comprehensive: 1976
Guatemala (M = 7.5) (Harp et al., 1981), 1978 Izu Oshima KinKai (M = 6.6) (Suziki, 1979), 1980 Mammoth
Lakes (M = 6.5) (Harp et al., 1984), 1983 Coalinga (M = 6.3) (Harp & Keefer, 1990), 1993 Hakkaido Nansei-oki
(M = 7.8) (Tanaka, 1994), 1994 Northridge (M = 6.7) (Harp & Jibson, 1995), 1995 Hyogoken Nanbu (M = 6.9)
(Nishida et al., 1996), 1999 Chi-Chi (M = 7.7) (Liao & Lee, 2000), 2004 Mid-Niigata (M = 6.6), (GSI, 2005;
Sekiguchi & Sato, 2006; Yagi et al., 2007), and 2008 Iwate-Miyagi-Nairiku (M = 6.9) (Yagi et al.,
2009) earthquakes.
We have only eight of these inventories (Guatemala, Izu Oshima KinKai, Mammoth Lakes, Coalinga,
Northridge, Chi-Chi, Mid-Niigata, and Iwate-Miyagi-Nairiku) reported by Harp et al. (2011). Therefore, the
majority of the EQIL inventories do not meet these criteria. For a robust statistical analysis, however, we need
to maximize the number of inventories used. This creates a trade-off between quality and completeness. The
2007 Niigata Chuetsu-Oki (Japan) event is a good example to illustrate this. Three inventories are available for
this event. The first inventory (Collins et al., 2012) used a combination of field observations and analysis of
oblique aerial photos for a relatively small area. During the detailed field investigation, preearthquake land-
slides were eliminated, and 70 EQIL were mapped as point data. The second study (Kokusai Kogyo, 2007) was
carried out using only 1/6,000 aerial photo interpretation covering about 400 km2 in area and resulted in 312
landslides mapped as polygons. In the third inventory (Sato et al., 2008), 1/10,000 aerial photos covering
about 260 km2 in area were used for image interpretation followed by field verification, which resulted in
172 landslides mapped. These three inventories were prepared following partly the same method but yielded
quite different inventory maps, both in representation and in the number of landslides mapped.
A much more striking example is the 2008 Wenchuan (China) EQIL inventories. Xu, Xu, Yao et al. (2014) com-
pared four inventory maps that they classified as nearly complete and reported significant differences in the
number of landslides mapped. In those studies, about 196,000, 59,000, 60,000, and 11,300 landslides were
mapped by Xu, Xu, Yao et al. (2014), Dai et al. (2011), Gorum et al. (2011), and Huang and Li (2009), respec-
tively. The number of landslides in two inventories called “nearly complete” prepared for the same event
TANYAŞ ET AL. EARTHQUAKE-INDUCED LANDSLIDE INVENTORIES 2004Journal of Geophysical Research: Earth Surface 10.1002/2017JF004236
differs by a factor of about 17. As a consequence, although all inventories contain valuable information, the
use of these in our analysis would yield contrasting results. Therefore, we need a methodology to evaluate
the comprehensiveness of inventories to provide a basis for selecting which inventories to include in a given
analysis. By combining the evaluation of quality, completeness, and representation, we can picture the com-
prehensiveness of any inventory.
The quality of any EQIL inventory can be defined based on its accuracy, which is the geographical and the-
matic correctness of the information shown on the map (Guzzetti et al., 2012). To evaluate the quality of
EQIL inventory, ideally we could address the following questions: (i) Were the landslides mapped at the right
location? (ii) Were the landslides mapped using a comprehensive mapping methodology? (iii) Were the land-
slides mapped by experienced people? (iv) Were the landslides types classified with a consistent classification
method (e.g., Keefer, 1984)? (v) Were the results of individual landslide mappers crosschecked by others? (vi)
How much total time did producer(s) spend on the landslide inventory map? (vii) Were contiguous landslides
mapped separately or as a single landslide? (viii) How long after the earthquake was the inventory com-
pleted? (ix) Were problematic areas field checked after creating the inventory? (x) Was the boundary of
mapped area indicated?Completeness measures the extent to which an EQIL inventory includes all coseismic
landslides for a specific earthquake (Guzzetti et al., 2012). To evaluate the completeness of EQIL inventory, we
need to address the following questions: (i) Were the landslides mapped for the entire landslide-affected area
or only for a part of the area? (ii) Was a minimum size threshold used for mapping landslides? (iii) Were pre-
earthquake and postearthquake landslides removed from the inventory?
Evaluating an EQIL inventory based on these criteria is complicated because many of them, especially the
quality evaluation criteria, cannot be evaluated. For example, evaluating the landslide interpretation skills
of the mapper, the detail of the mapping, and whether coalescing landslides are mapped separately or as
a single polygon are difficult to evaluate without going back and examining the original imagery.
Therefore, any evaluation regarding the quality and completeness of EQIL inventories has some limitations.
Quality and completeness of an inventory are two different terms that do not have to be met for the
same inventory. For instance, a high-quality EQIL inventory can be incomplete if the inventory is pro-
vided partially, or a complete inventory can be low quality if landslides are not located, differentiated,
or classified appropriately. Beyond that, to evaluate the comprehensiveness of the inventory, there is
another component: representation.
The methods of evaluating how well an inventory represents reality will be different depending on the repre-
sentation type. For a point-based inventory, under ideal conditions, the point should be assigned to a consis-
tent and clearly defined part of the landslide, ideally the scarp. Furthermore, we would expect to have the
type and size of landslides in the attribute table. For a polygon-based inventory, we would expect to have
an inventory with different landslide types, and differentiated source and depositional areas.
We have developed an evaluation methodology to provide a basis for selecting which inventories to include
in a given analysis. To accomplish this task, we have defined a mixed set of criteria that we can evaluate with-
out having detailed metadata of each inventory. We have used eight criteria (Table 3) that are partly derived
from earlier studies (Gorum et al., 2011; Harp et al., 2011; Xu, 2014). The criteria defined for the evaluation of
EQIL inventories are described in the following sections.
4.1. Evaluation Criteria
The methodology used for generating an EQIL inventory is very important for the overall evaluation of the
inventory. Guzzetti et al. (2012) categorized the different methods used to prepare landslide inventories into
four groups: (a) (semi) automated satellite image classification; (b) observations based on aerial reconnais-
sance (helicopter flights, fixed-wing aircraft or UAVs (Unmanned Aerial Vehicles); (c) field survey, and (d)
visual image interpretation (using satellite images or aerial photography).
If preearthquake and postearthquake images are utilized, (semi) automated image classification techniques
can be the most effective approach, especially because they provide rapid results (e.g., Lacroix et al., 2013;
Martha et al., 2010). However, these methods are still not capable of identifying coalescing landslides or land-
slides that are mostly vegetated, and they cannot classify landslides by type. Moreover, automated techni-
ques are prone to errors due to misidentification of features such as bare-earth slopes, recent fills, rock
quarries, road cuts, and other excavations as landslides.
TANYAŞ ET AL. EARTHQUAKE-INDUCED LANDSLIDE INVENTORIES 2005Journal of Geophysical Research: Earth Surface 10.1002/2017JF004236
Table 3
Evaluation Scheme for EQIL Inventories, Using Two Sets of Criteria, With Score
Category
(A) (B) Criteria Execution performance Score
Essential criteria Essential criteria (i) Was the study area analyzed systematically by visual interpretation? 0–100% 0–1
(ii) Was the boundary of the mapped area indicated? No/Yes 0/1
(iii) Were the preearthquake and postearthquake landslides eliminated from the 0–100% 0–1
inventory?
(iv) Was the mapping resolution of inventory enough to differentiate the individual L > 25 m: 5 m: ≥0.5
5 m ≥ L: 1
Preferred criteria (v) Were the landslides mapped as polygons? No/Yes 0/1
(vi) Did landslide polygons differentiate source and depositional areas? No/Yes 0/1
Preferred criteria (vii) Were the landslides field checked in problematic areas? 0–100% 0–1
(viii) Were the landslides classified according to type? No/Yes 0/1
As another alternative method, aerial reconnaissance, either by fixed-wing aircraft, helicopter, or UAV, might
provide detailed information for specific areas but cannot cover the entire affected area. Field mapping of
landslides (Brunsden, 1985) allows characterization of landslide features such as type, depth, source, and
depositional area, which might not be obtainable by any other methodology. Nevertheless, mapping land-
slides in the field is hampered by difficulties of landslide detection because it is not straightforward to identify
the boundary of landslides, especially if they are large (Guzzetti et al., 2012). Moreover, this method is limited
by the time and resources available and the accessibility of the area.
Utilization of the multiple approaches to get the most information possible within monetary and time con-
straints could be the idealized method for EQIL mapping. On the other hand, if you evaluate the methods
individually, of all available methods, visual image interpretation leads to the best results, because expert
interpreters can omit nonlandslide features and can systematically scan the whole affected area as long as
cloud-free imagery is available. If high-resolution imagery is available, landslides can be classified by type,
and source and depositional areas can be identified. Visual image interpretation can be carried out for the
entire landslide-affected area or for specific sample areas to support and validate other methods such as
(semi) automatic image classification.
To analyze the conditions that cause landslide initiation, both the presence and absence of landslides are
important information that should be obtained from the inventories. Harp et al. (2011) stress the importance
of indicating the boundaries of the mapped landslide area. Due to limitations in the available images,
resources, time, and cloud cover, mapping of the whole region affected by landslides might not be possible,
but as long as the boundary of the mapped area is defined, it can still be valuable information. If the inven-
tories do not indicate the mapping boundaries, but the extent of the utilized satellite imagery or flight lines of
aerial surveys are indicated, such boundaries can still be defined. Based on this approach, the availability of a
mapping boundary can be evaluated.
Removing landslides that occurred before and after the earthquake is essential to provide an accurate inven-
tory of triggered features. For example, the 2015 Gorkha earthquake in Nepal occurred in a mountainous area
that is highly susceptible to rainfall-induced landslides; thus, if the preearthquake landslides are not elimi-
nated from the inventory, many landslides not caused by this earthquake could be erroneously related to
the seismic triggering event. Therefore, the imagery must be acquired as soon as possible after the earth-
quake to capture the initial aspects of the landslides and the terrain (Harp et al., 2011). Several approaches
can be used to remove preearthquake landslides from the inventory, including through information gathered
from local people (e.g., Chakraborty et al., 2011), field observations (e.g., Harp & Jibson, 1995; Harp & Keefer,
1990), or the use of preevent and postevent imagery (e.g., Barlow et al., 2014; Papathanassiou et al., 2013; Xu,
Xu, Yao et al., 2014). The last method is considered the best option.
Harp et al. (2011) stated that an ideal inventory should include all detectable landslides down to sizes of 1–
5 m in length. However, it is difficult to determine the completeness of the mapping of such small features.
The minimum landslide size observed in an inventory is generally not representative of the resolution of
TANYAŞ ET AL. EARTHQUAKE-INDUCED LANDSLIDE INVENTORIES 2006Journal of Geophysical Research: Earth Surface 10.1002/2017JF004236
inventories because such small landslides might be mapped only for a limited part of inventories where the
imagery is of the highest quality.
Malamud et al. (2004a) suggest a functional definition of completeness that requires a landslide inventory to
include a substantial fraction of all landslides at all scales. In this definition, the rollover point refers to the
most commonly occurring landslide size in the inventory. Parker et al. (2015) take the position of rollover
as the minimum size where landslide mapping is complete. Based on this approach, we evaluated the roll-
over points of the inventories. If the linear resolution of the rollover point is less than 5 m, we assumed that
the inventory satisfies the ideal conditions in terms of mapping resolution, and if it is higher than 25 m, we
assumed that it is far from the ideal conditions. A caveat is that the rollover position may also be controlled
by the mechanical properties of the substrate (Frattini & Crosta, 2013; Stark & Guzzetti, 2009), and therefore,
some inventories may not be “incomplete” but only occur in place where the mechanics do not allow small
landslides (You can also read


