Long-term measurement of sub-3 nm particles and their precursor gases in the boreal forest - ACP
←
→
Page content transcription
If your browser does not render page correctly, please read the page content below
Atmos. Chem. Phys., 21, 695–715, 2021
https://doi.org/10.5194/acp-21-695-2021
© Author(s) 2021. This work is distributed under
the Creative Commons Attribution 4.0 License.

Long-term measurement of sub-3 nm particles
and their precursor gases in the boreal forest
Juha Sulo1 , Nina Sarnela1 , Jenni Kontkanen1 , Lauri Ahonen1 , Pauli Paasonen1 , Tiia Laurila1 , Tuija Jokinen1 ,
Juha Kangasluoma1,2 , Heikki Junninen1,4 , Mikko Sipilä1 , Tuukka Petäjä1 , Markku Kulmala1,2 , and
Katrianne Lehtipalo1,3
1 Institute
          for Atmospheric and Earth System Research/Physics, University of Helsinki, 00014 Helsinki, Finland
2 Aerosol and Haze Laboratory, Beijing Advanced Innovation Center for Soft Matter Science and Engineering,
Beijing University of Chemical Technology, Beijing, China
3 Finnish Meteorological Institute, 00560 Helsinki, Finland
4 Laboratory of Environmental Physics, University of Tartu, Tartu, Estonia

Correspondence: Juha Sulo (juha.sulo@helsinki.fi)

Received: 16 July 2020 – Discussion started: 27 July 2020
Revised: 4 November 2020 – Accepted: 1 December 2020 – Published: 19 January 2021

Abstract. The knowledge of the dynamics of sub-3 nm parti-        concentrations being 2 to 3 times lower. A correlation analy-
cles in the atmosphere is crucial for our understanding of the    sis between the sub-3 nm concentrations and aerosol precur-
first steps of atmospheric new particle formation. Therefore,     sor vapor concentrations indicates that both HOMs (particu-
accurate and stable long-term measurements of the smallest        larly their dimers) and sulfuric acid play a significant role in
atmospheric particles are needed. In this study, we analyzed      new particle formation in the boreal forest. Our analysis also
over 5 years of particle concentrations in size classes 1.1–      suggests that there might be seasonal differences in new par-
1.7 and 1.7–2.5 nm obtained with the particle size magnifier      ticle formation pathways that need to be investigated further.
(PSM) and 3 years of precursor vapor concentrations mea-
sured with the chemical ionization atmospheric pressure in-
terface time-of-flight mass spectrometer (CI-APi-ToF) at the
SMEAR II station in Hyytiälä, Finland. The results show that      1   Introduction
there are significant seasonal differences in median concen-
trations of sub-3 nm particles, but the two size classes behave   Atmospheric aerosols are one of the largest sources of uncer-
partly differently. The 1.1–1.7 nm particle concentrations are    tainty in climate models. To diminish these uncertainties, it
highest in summer, while the 1.7–2.5 nm particle concen-          is vital to understand the sources and formation pathways of
trations are highest in springtime. The 1.7–2.5 nm particles      aerosol particles. New particle formation (NPF) in the atmo-
exhibit a daytime maximum in all seasons, while the 1.1–          sphere has been observed to occur in various environments
1.7 nm particles have an additional evening maximum during        (Kulmala et al., 2004; Kerminen et al., 2018, and references
spring and summer. Aerosol precursor vapors have notable          therein) from megacities (Hofman et al., 2016; Wu et al.,
diurnal and seasonal differences as well. Sulfuric acid and       2007; Qi et al., 2015) rainforests (Wimmer et al., 2018; An-
highly oxygenated organic molecule (HOM) monomer con-             dreae et al., 2018), rural areas (Mäkelä et al., 1997; Vakkari
centrations have clear daytime maxima, while HOM dimers           et al., 2011; Heintzenberg et al., 2017; Nieminen et al., 2014),
have their maxima during the night. HOM concentrations for        and even polar areas (Weller et al., 2015; Kyrö et al., 2013;
both monomers and dimers are the highest during summer            Järvinen et al., 2013; Sipilä et al., 2016). In the laboratory,
and the lowest during winter following the biogenic activity      aerosol particles have been observed to form through vari-
in the surrounding forest. Sulfuric acid concentrations are the   ous pathways involving different chemical compounds and
highest during spring and summer, with autumn and winter          ions (e.g., Kirkby et al., 2016; Lehtipalo et al., 2018). Based
                                                                  on various estimates (Merikanto et al., 2009; Dunne et al.,

Published by Copernicus Publications on behalf of the European Geosciences Union.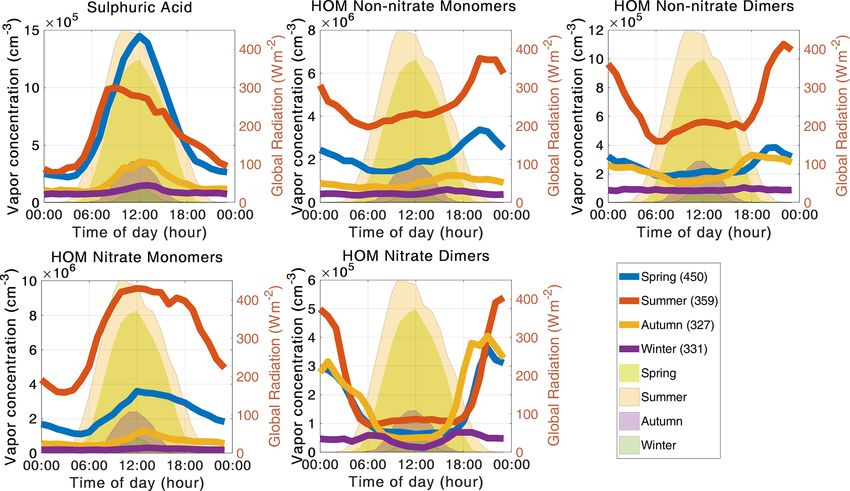
696                                J. Sulo et al.: Long-term measurement of sub-3 nm particles and their precursor gases

2016; Kulmala et al., 2016), 40 %–80 % of aerosol particles          In this study, we analyze a 5-year data set from the
in the atmosphere are formed from condensing vapors, and          SMEAR II station in Hyytiälä, southern Finland, in order
thus NPF contributes significantly to global aerosol number       to investigate the diurnal and seasonal variation of sub-3 nm
concentrations.                                                   particle concentrations in boreal forest and their connection
   It is widely understood that sulfuric acid (SA) plays a sig-   to atmospheric NPF. Additionally, the sub-3 nm particle con-
nificant role in atmospheric NPF (Kulmala et al., 2006; Ri-       centrations are compared with some of their precursor vapor
ipinen et al., 2007; Paasonen et al., 2010). However, SA and      concentrations in order to determine which vapors participate
water alone are not enough to explain atmospheric observa-        in atmospheric NPF and their relative roles in different size
tions in the boundary layer (Chen et al., 2012; Paasonen et       ranges. A secondary goal is to find the optimal settings to
al., 2012). Studies indicate that at least one more vapor, for    operate the PSM in order to detect sub-3 nm particles in field
example a base like amine or ammonia, is needed for sta-          conditions.
bilizing the growing clusters (Almeida et al., 2013; Kirkby
et al., 2016; Kürten et al., 2018). Highly oxygenated organic
molecules (HOMs), formed in the atmosphere through auto-          2     Materials and methods
oxidation from volatile organic compounds, likely partake in
                                                                  2.1    Measurement location
particle growth everywhere in the boundary layer (Ehn et al.,
2014; Mohr et al., 2019). Some HOMs can form charged              All measurements were conducted at the SMEAR II (Sta-
clusters on their own, but it is unclear how important these      tion for Measuring Forest Ecosystem Atmosphere Relations)
pure biogenic clusters are for atmospheric NPF (Kirkby et         station in Hyytiälä, southern Finland (61◦ 50 000 N, 24◦ 1700 E;
al., 2016; Rose et al., 2018; Bianchi et al., 2017).              181 m a.s.l.) (Hari and Kulmala, 2005) between April 2014
   Freshly formed particles have typical sizes of 1–2 nm in       and April 2020. Hyytiälä is roughly 200 km from Helsinki,
diameter and grow to larger sizes by condensation of low-         with the closest urban center Tampere about 60 km to the
volatility vapors (Kulmala et al., 2014). Measuring these sub-    southwest. Tampere has a population of roughly 230 000
3 nm particles is critical to a proper understanding of NPF       people. The SMEAR II station is considered a rural back-
and the early steps of particle growth in the atmosphere. One     ground station for atmospheric measurements and is sur-
method of measuring sub-3 nm particles is the particle size       rounded by a Scots pine (Pinus sylvestris) forest. The emis-
magnifier (PSM) (Vanhanen et al., 2011). The PSM is a two-        sions of volatile organic compounds at the station are dom-
stage condensation particle counter (CPC) used to grow and        inated by biogenic vapors from the surrounding forest,
count sub-3 nm particles. Sub-3 nm particles have been mea-       monoterpenes in particular (Rantala et al., 2015). NPF events
sured with the PSM in various environments (Kontkanen et          including particle growth have been observed only during
al., 2017), from polluted Chinese megacities (Xiao et al.,        daytime (Buenrostro Mazon et al., 2016), while biogenic
2015) to rural areas (Kulmala et al., 2013) and mountain tops     cluster formation is also common during evening and night
(Rose et al., 2015). Measurement devices are prone to errors,     (Rose et al., 2018).
particularly in the field, and understanding the factors that
affect the performance of the PSM and validating data from        2.2    Particle size magnifier
PSM measurements is an ongoing challenge (Kangasluoma
et al., 2013, 2014, 2016b).                                       We used the particle size magnifier (PSM) to measure the
   The long-term measurements at the SMEAR II station             concentrations of sub-3 nm particles. The A11 nCNC-system
in Hyytiälä, Finland, have enabled studying atmospheric           (nano-Condensation Nucleus Counter) is a particle counter
new particle formation and its prerequisites. Prior research      system developed for measuring the concentration of par-
has investigated the frequency of NPF in the boreal forest        ticles larger than 1 nm in size and size distributions in the
(Dal Maso et al., 2005; Nieminen et al., 2014) and how it         sub-3 nm particle size region (Vanhanen et al., 2011). In this
is affected by condensation sink and cloudiness (Dada et al.,     system, the PSM operates as a pre-conditioner, in which the
2017) and other meteorological conditions (Sogacheva et al.,      small particles are first grown before they are funneled into a
2008). These studies have concluded that NPF is most com-         CPC for further growth and optical detection. The PSMs used
mon in Hyytiälä during spring and that NPF occurs most of-        in this study were manufactured by Airmodus (model A10)
ten during days with fewer clouds and a low condensation          and used together with an Airmodus A20 CPC. In the PSM,
sink. Shorter campaign measurements have been used to in-         the sample flow is turbulently mixed in the mixing region
vestigate the connection between NPF and its precursors va-       with a saturated heated flow to achieve supersaturation in the
pors (e.g., Riipinen et al., 2007; Kulmala et al., 2013; Yan      growth tube. Diethylene glycol (DEG) starts to condense on
et al., 2018). They indicate that both sulfuric acid and some     the sample particles, and they are grown up to the size of
organic vapors participate in NPF in Hyytiälä, but the pos-       circa 100 nm in the cooled growth tube. From the growth
sible seasonality of the mechanism and exact identity of the      tube, the flow is directed to a CPC where the particles are
organic compounds are still unclear.                              grown with butanol to optically detectable sizes.

Atmos. Chem. Phys., 21, 695–715, 2021                                                https://doi.org/10.5194/acp-21-695-2021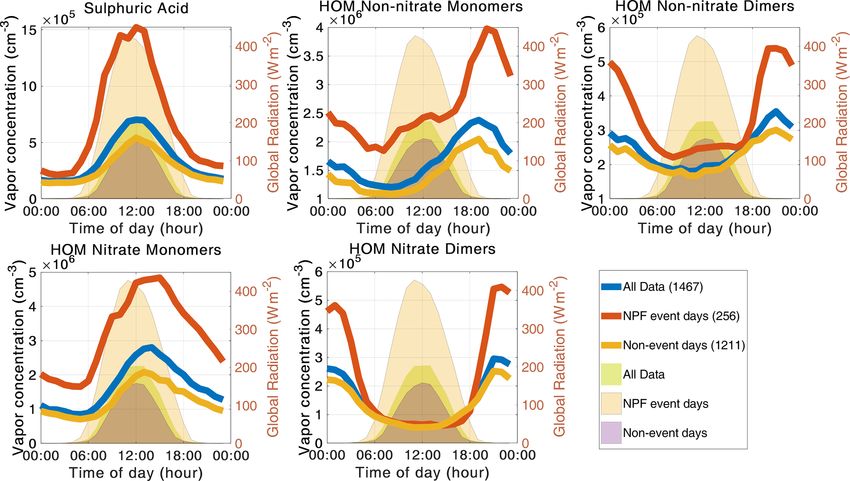
J. Sulo et al.: Long-term measurement of sub-3 nm particles and their precursor gases                                          697

   Particle activation within the PSM depends on the super-        lation with the PSM saturator flow rate (Chan et al., 2020).
saturation level in the PSM, which in turn depends on the          Increasing the flow rate should always result in increased to-
temperature difference between the heated saturated flow, the      tal concentration because we are activating a larger size range
sample flow, and the growth tube, as well as the saturator         of particles. We omitted scans not fulfilling this requirement
flow rate (Kangasluoma et al.. 2016b; Vanhanen et al., 2011;       from further analysis, as they would lead to a negative con-
Okuyama et al., 1984). Because of this, the supersaturation        centration of sub-3 nm particles. These so-called “bad scans”
can be adjusted by changing the saturator flow rate or the         could result from air mass changes or other variations in
temperature difference between these components. A larger          aerosol concentrations that are faster than the scan time or
temperature difference between the heated saturated flow and       when the concentration of sub-3 nm particles is so low that it
the growth tube or a higher saturator flow rate leads to a         cannot be detected with this method.
higher supersaturation level, which means that smaller par-           We inverted the raw PSM data with the kernel method de-
ticles are activated and thus the cutoff size of the instrument,   scribed in (Lehtipalo et. al., 2014) to obtain the size distri-
i.e., the diameter at which 50 % of the particles are activated,   bution of sub-3 nm particles. The kernel method uses a non-
is lower. However, too high a supersaturation level will lead      negative matrix inversion routine to calculate the size distri-
to formation of droplets via homogeneous nucleation caus-          bution based on activation curves measured during the cali-
ing a background signal. Studies have also shown that the          bration of the instrument. The data were inverted to a 16 min
cutoff size for particles depends not only on the supersatu-       resolution (four scans) and two size bins (1.1–1.7 and 1.7–
ration but also on the chemical composition of the sample          2.5 nm) to minimize the effect of noise on the analysis but
particles, particle charge, and the condensing fluid (see Sect     still retain a high enough time resolution for the analysis.
2.2.3.) (Kangasluoma et al., 2016b; Winkler et al., 2012).         The size bin 1.7 nm was chosen as the divider because it is
   The PSM can be run in several measurement modes, but            commonly used for nucleation rate calculations (Lehtipalo
in this study we only used the scanning mode. The scan-            et al., 2018; Kirkby et al., 2016) and because cluster ions are
ning mode makes it possible to determine the particle size         typically smaller than this size (Hirsikko et al., 2011). There-
distribution of sub-3 nm particles. In the scanning mode, the      fore, the smaller size bin probably consists of neutral and ion
PSM scans through saturator flow rates to obtain the parti-        clusters, as well as small recently formed particles, while the
cle size distribution. In our study, the PSM scanned from          larger size bin consists mainly of growing clusters and re-
0.1 to 1.3 L min−1 and back to 0.1 L min−1 in 4 min. Dur-          cently formed particles.
ing the scan, particle counts are saved at a 1 s interval to the      Recently, Cai et al. (2019) recommended another inver-
raw data file. Each measurement corresponds to the total con-      sion routine for PSM data, the expectation-maximization al-
centration of particles above a certain size determined by the     gorithm (EM). However, as our data were already inverted
saturator flow rate, and therefore the changes in the measured     with the kernel method and the EM method is computation-
concentration during a scan can be used to acquire informa-        ally expensive, we decided to stick with the kernel method.
tion about the size distribution (Lehtipalo et al., 2014).         The two inversion methods produce similar concentrations
   The PSM measurements were conducted at the SMEAR II             and size distributions when both are optimized for the data
station in a container at ground level. Due to maintenance,        set in question (Cai et al., 2019). It remains as future work
the instrument was changed on 23 February 2017 and 1 Oc-           to test the applicability of the EM algorithm for SMEAR II
tober 2018. In 2014, the sampling was done with a 40 cm            data and optimize it to conditions with rather low particle
long stainless-steel tube with 2.5 L min−1 flow rate. The dif-     concentrations.
fusion losses were corrected for in the data inversion. From
2015 onward, the sampling was done with the core sam-              2.3   Effect of supersaturation and background counts
pling method, where the air was taken from the outside at
7.5 L min−1 through a 40 cm stainless steel tube and the sam-      At optimal temperature settings the PSM should activate a
ple was taken from the middle of the flow into the PSM             large fraction of even the smallest particles around 1 nm,
at 2.5 L min−1 to minimize sampling losses. The inlet also         while still minimizing the effect of homogenous nucleation
included a mechanism that allowed the bypass flow to be            within the PSM. In practice, a small background from homo-
briefly reversed in order to provide particle-free air in am-      geneous nucleation needs to be tolerated at higher saturator
bient relative humidity for PSM background measurements            flow rates in order to activate the smallest particles, espe-
(Kangasluoma et al., 2016a).                                       cially organic clusters. The amount of homogeneously nucle-
                                                                   ated droplets can be taken as an indicator of the supersatura-
2.2.1   PSM data analysis                                          tion level (activation efficiency) (Jiang et al., 2011). Here we
                                                                   investigate how the background level affects the measured
Before the PSM raw data were inverted, the data were run           concentrations.
through a quality control algorithm in which we assumed               To monitor the instrument operation and supersaturation
that the measured total concentration during each scan should      level, the background counts were automatically measured
have a positive and statistically significant (p < 0.05) corre-    three times a day. Due to changes in external conditions and

https://doi.org/10.5194/acp-21-695-2021                                                Atmos. Chem. Phys., 21, 695–715, 2021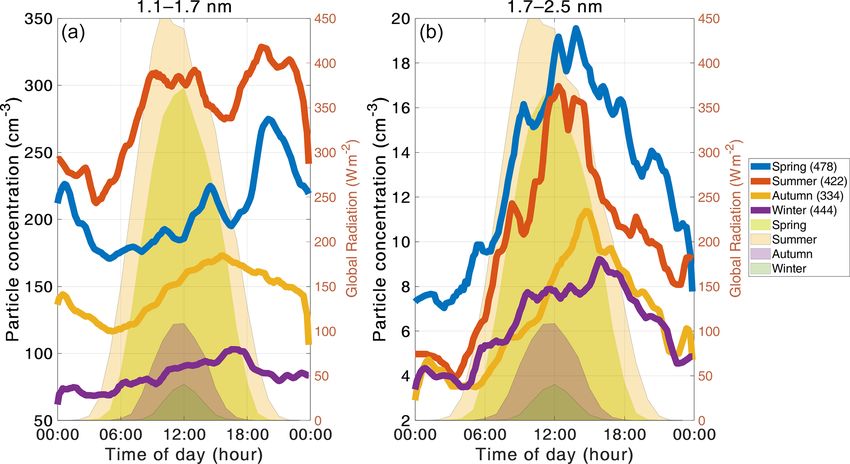
698                                   J. Sulo et al.: Long-term measurement of sub-3 nm particles and their precursor gases

Figure 1. The fraction of scans discarded during data quality check
                                                                      Figure 2. Box plots of the measured 1.1–1.7 nm particle concentra-
plotted against the daily medians of PSM background concentra-
                                                                      tion at SMEAR II grouped with the PSM background concentration.
tion. The color of the circles shows the ambient relative humidity
                                                                      The red line is the median concentration, and the blue box contains
(RH).
                                                                      50 % (25th to 75th percentile) of all data points. The whiskers mark
                                                                      the location of the 95th and 5th percentile data points. The number
                                                                      in parentheses indicates the fraction of all data points in each bin.
the state of the instrument, the background varies, and if the
operator thought it was too high (> ca. 50 cm−3 ) or too low
(< ca. 1 cm−3 ), the temperature settings were adjusted to            ground is under 1 cm−3 , the measured concentrations are
keep the cutoff sizes same as before. During the whole mea-           on average lower than when the background level is above
surement period, the daily averaged (over all saturator flow          1 cm−3 , indicating that we are not activating all of the 1.1–
rates) homogenous background varied from less than 1 cm−3             1.7 nm particles at those settings. However, if the background
to almost a 1000 cm−3 . The background counts were sub-               level rises to over 10 cm−3 , the variation also becomes no-
tracted from the data during data processing.                         tably larger, underlining the various factors affecting the con-
   We investigated the fraction of scans discarded during data        centration at higher background. At high background levels
quality control as a function of the background concentra-            the PSM likely activates large vapor molecules or clusters
tions (daily median) (Fig. 1). The u shape of the bad scan            whose concentrations are not stable, leading to larger varia-
percentage clearly shows that the quality of the scans goes           tion in the concentration. When these species dominate the
down if the PSM background is either too low (< 0.1–1) or             activated particles, the particle size distribution cannot be
too high (> 10). If the supersaturation level and consequently        easily resolved from the scans. Other causes for higher varia-
the background level inside the PSM is too low, the smallest          tion at high background include, but are not necessarily lim-
particles cannot be activated and there is no detectable signal,      ited to, faulty instrumentation, dirty sample lines, and domi-
which leads to noisy scans. A high background, on the other           nant homogeneous nucleation of the working fluid.
hand, can indicate that the PSM is not functioning properly.             The analysis described above leads to the conclusion that
Thus, based on the quality of the scans alone, the PSM ap-            in the conditions of the SMEAR II station, the optimal set-
pears to work best when the background signal at the highest          tings for the PSM are found when the measured background
saturator flow rate is between 1 and 10 cm−3 . However, in            is between 1 and 10 cm−3 . As mentioned before, the PSM
our measurements, the devices were never intentionally run            could be run stably at background levels above 10 cm−3 as
at background levels higher than circa 50 cm−3 . For this rea-        well, but due to the results discussed above, we selected
son, the PSM could be stable at higher background levels              only PSM data with the instrument background between 1
as well, but our data does not allow us to draw conclusions           and 10 cm−3 for further analysis. The optimal settings de-
on that. Furthermore, this behavior seems to be uncorrelated          termined here can likely be used in measurement sites with
with the measured relative humidity at the measurement lo-            similar particle concentrations and composition. However, if
cation, although laboratory studies have shown that RH can            a measurement location has much higher particle concentra-
affect the particle activation efficiency with DEG (Kangaslu-         tions or the changes in particle concentration are much more
oma et al., 2013; Jiang et al., 2011).                                rapid than in a boreal forest, for example in an urban mea-
   To investigate the effect of the background level (supersat-       surement location, they will have to be adjusted. In addi-
uration) on the activation of the smallest particles, we split        tion, the composition of the smallest particles might affect
the data points to groups where the background is below               the ideal level of supersaturation to activate most of them
1 cm−3 , above 10 cm−3 , or between these two limits. The             without too much disturbance from homogenous nucleation.
limits were chosen based on the observed fraction of bad
scans in Fig. 1. We then studied 1.1–1.7 nm concentration as
a function of the PSM background (Fig. 2). When the back-

Atmos. Chem. Phys., 21, 695–715, 2021                                                     https://doi.org/10.5194/acp-21-695-2021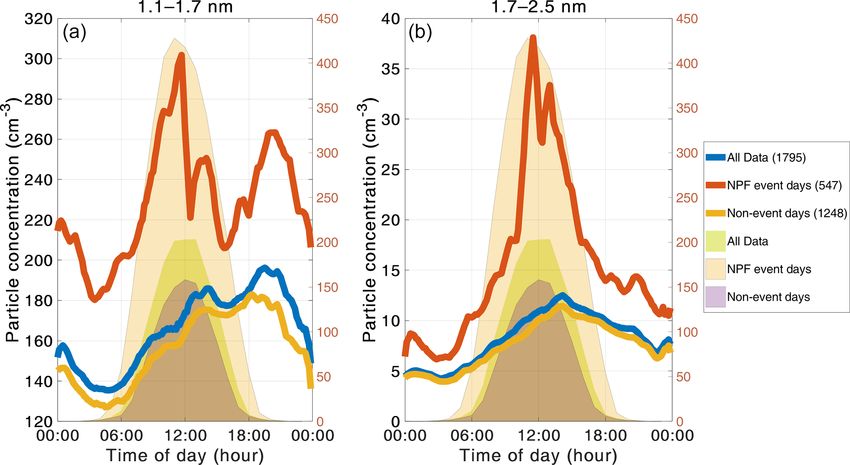
J. Sulo et al.: Long-term measurement of sub-3 nm particles and their precursor gases                                           699

2.3.1   Measurement uncertainties                                  measurement PSM. The neutral PSM data were measured
                                                                   between April 2017 and April 2019. The setup is otherwise
Measuring sub-3 nm particles involves notable uncertainties,       similar to the PSM used in the rest of this study, but the ion
as small particles are very difficult to detect. Both PSM cali-    trap is switched on every 8 min and then off again after 8 min.
bration and measurement are sensitive to the chemical com-         This allows us to differentiate between neutral particle and
position of the particles being measured. The activation prob-     total particle concentrations and acquire the ambient ion con-
ability with DEG seems to be lower for organic particles than      centration from the PSM.
for inorganic particles. The cutoff size, the diameter at which       The comparison shows that the PSM detects small ions
50 % of the particles are activated in the PSM, can be over        and charged particles fairly well and that the overall con-
a nanometer larger for organic particles than for inorganic        centrations measured with the PSM and the NAIS are of the
particles (Kangasluoma et al., 2014, 2016b), but there are no      same magnitude in the size range used in this study (Fig. 3).
systematic studies for different kinds of ambient particles.       The relative concentration (from binned y directional medi-
Because we do not know the exact chemical composition of           ans) measured by the PSM is between 29 % and 100 %, with
the particles in the ambient air, the sizing in the measurement    the median relative concentration being 65 %. This suggests
contains uncertainties. In addition, the activation probabil-      that most but not all of the ambient ions are activated by
ity of particles is also slightly different for charged and non-   the PSM and that we are more likely underestimating than
charged (neutral) particles (Kangasluoma et al., 2016b). Due       overestimating the ambient concentrations of small particles.
to the uncertainties, we chose to compare two rather wide          It should be noted that the ions are a mixture of different
size ranges, 1.1–1.7 and 1.7–2.5 nm, although the PSM data         chemical compounds, and the ion composition varies diur-
would allow also more detailed sizing.                             nally and seasonally in boreal forest (Ehn et al., 2010), so
   The PSM is calibrated by measuring particles from a             we expect that their activation fraction (relative to tungsten
known source. A certain particle size is selected with a dif-      oxide ions used for calibrating the PSM), varies as well. De-
ferential mobility analyzer (DMA), and an electrometer is          tailed analysis of the activation of different types of ambient
used as a reference instrument. This gives us the PSM detec-       ions in the PSM is subject to future studies. Based on labora-
tion efficiency for each selected size. The PSMs in this study     tory experiment, which conclude that the effect of charge on
were calibrated using charged tungsten oxide particles in the      the cutoff size is between 0 and 0.50 nm (Kangasluoma et al.,
size range between 1.0 and 3.2 nm in mobility diameter, as         2016b), the above results mean that we likely activate neutral
there is no good calibration method and reference instrument       particles as well, but their activation efficiency is difficult to
readily available for neutral particles. Therefore, the diame-     quantify.
ters given should be taken as activation-equivalent sizes (we
assume that the particles would activate as charged tungsten       2.4   CI-APi-ToF
oxide particles do). The PSM may also be sensitive to ambi-
ent conditions, mainly relative humidity (Kangasluoma et al.       We used a chemical ionization atmospheric pressure inter-
2013; Jiang et al., 2011). More discussion on the uncertain-       face time-of-flight mass spectrometer (CI-APi-ToF, Jokinen
ties can be found in Kangasluoma et al. (2020) and references      et al., 2012) with a nitrate ion as a reagent ion to measure
therein.                                                           low-volatility vapors at the SMEAR II station. The detection
   When dealing with long time series, an additional com-          of CI-APi-TOF is based on proton transfer reactions or clus-
plication arises from changing and maintaining equipment.          tering with the nitrate ion through collisions with nitrate ions
While the different PSMs used in the study over the years are      (NO−                                                 −
                                                                        3 ), nitrate ion–nitric acid dimers (HNO3 NO3 ), and ni-
                                                                                                                −
essentially similar devices, they have slightly varying cutoff     trate ion–nitric acid trimers ((HNO3 )2 NO3 ). The nitrate ion
limits and detection efficiency curves, which has been taken       chemical ionization is a very selective method as nitrate ions
into account during data processing but which could still af-      react only with strong acids, such as malonic acid, sulfuric
fect the final inverted concentrations. The data preprocessing     acid, and methane sulfonic acid (Eisele and Tanner, 1993,
and inversion method can also produce additional uncertain-        and oxidized organic compounds that have at least two hy-
ties that are difficult to quantify (Lehtipalo et al., 2014; Cai   droperoxy (OOH) groups or other H-bond-donating groups
et al., 2019).                                                     (Hyttinen et al., 2015).
   To estimate the magnitude of error in the concentrations           In the chemical ionization inlet ∼ 20 L min−1 of sheath
caused by the uncertainties related to PSM measurement,            flow is mixed with ∼ 5 milliliters per minute flow of air sat-
we compared the ion concentrations detected by the PSM             urated with nitric acid (HNO3 ) and then guided to the ion-
to those from a Neutral Cluster and Air Ion Spectrometer           ization source. In the ionization source, nitric acid is ionized
(NAIS, described briefly in Sect. 2.4), which is the only other    with a soft x-ray source (Hamamatsu). The sheath flow with
instrument measuring in the same size range at SMEAR II.           nitrate ions is guided to the drift tube where it gets mixed
The ion concentrations were acquired from a PSM with               with the sample flow (10 L min−1 ). The nitrate ions (or ion
an ion trap inlet (Wagner et al., 2017, Kangasluoma et al.,        clusters) and the molecules of the sample have around 200 ms
2016a) measuring in the same container as the long-term            to react with each other in the drift tube before they enter the

https://doi.org/10.5194/acp-21-695-2021                                                Atmos. Chem. Phys., 21, 695–715, 2021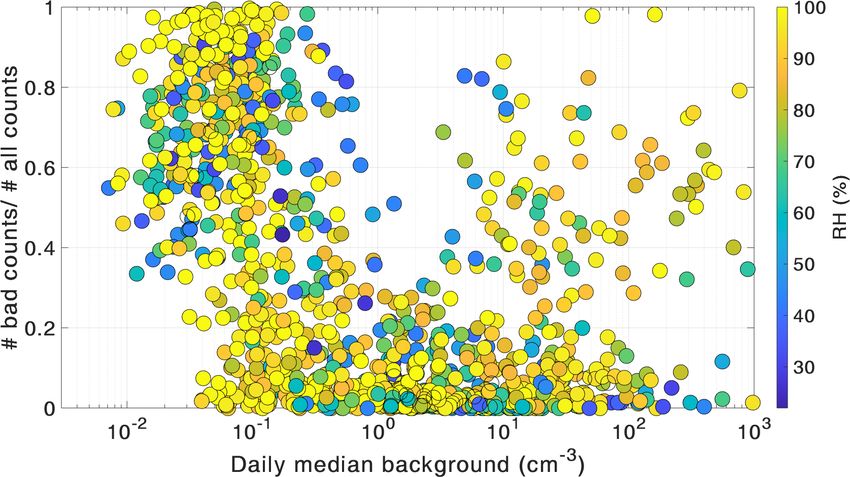
700                                 J. Sulo et al.: Long-term measurement of sub-3 nm particles and their precursor gases

Figure 3. Comparison of 1.1–2.5 nm ambient ions measured by PSM and NAIS at SMEAR II. The orange line is the 1 : 1 line, the blue data
points are hourly medians, and the red points are log-normally binned y directional medians, with the red whiskers showing the 75th and
25th percentile.

APi of the mass spectrometer through a 0.3 mm critical ori-           2.5   Complementary data
fice with flow of ∼ 0.8 L min−1 . In the APi the molecules of
the sample are gradually pumped out while the ions are kept           The NAIS measures the mobility distribution of ions in the
in the middle of the stream by quadrupoles and ion lenses             atmosphere between 0.8 and 40 nm, and it can be used to
(Junninen et al., 2010). In the ToF chamber the ions are accel-       measure either naturally charged ions or the particles can
erated with an energy pulse, and they are separated by their          be charged with a corona discharge to measure total parti-
time of flight to reach the detector in the chamber.                  cle concentration (Kulmala et al., 2007). We used an auto-
   The CI-APi-TOF measurements were conducted at a 35 m               matic atmospheric NPF event classification algorithm devel-
altitude in a tower right next to the ground-level particle           oped by Dada et al. (2018) to determine NPF event times
measurements. The measurement height is above the forest              during the investigated time span. The event classification
canopy. Zha et al. (2018) found that the HOM concentrations           algorithm provided the start, peak, and end times of NPF
above and inside the canopy are similar when the boundary             events using data from the NAIS. Relative humidity data are
layer is well-mixed. The concentrations between these alti-           from the Rotronic MP102H RH sensor in the measurement
tudes may differ during a strong temperature inversion or a           mast at the SMEAR II station, measured at 16 (before Febru-
shallow surface layer in nighttime.                                   ary 2017) and 35 m heights. The global radiation data were
   All the low-volatility vapor measurements were performed           measured at the same measurement mast, with the Middleton
with the same instrument that was calibrated twice dur-               SK08 pyranometer at 18 m height (before September 2019)
ing this measurement period with a sulfuric acid calibra-             and the EQ09 pyranometer at 35 m height.
tor (Kürten et al., 2012). In the calibrations we achieved
calibration coefficients 2.4 × 109 cm−3 for 2014–2018 and             2.6   Analysis methods for comparing PSM and
4.6 × 109 cm−3 for 2019 onwards and used the same coef-                     CI-APi-TOF data
ficient for all detected compounds. This assumption is valid
                                                                      We used the time series of quality-controlled and inverted
for compounds that cluster with nitrate ions at the collision
                                                                      sub-3 nm particle concentrations to study the diurnal and sea-
limit and have equal collision rates. The collision rates of ni-
                                                                      sonal patterns of sub-3 nm aerosol particles. The same sea-
trate ions with SA and with HOMs are approximated to be
                                                                      sonal analysis was performed on the available CI-APi-ToF
very similar (Ehn et al., 2014). Mass spectra obtained from
                                                                      data.
the instrument were analyzed using the “tofTools” program
                                                                         Measured sub-3 nm particle concentrations were then
described in Junninen et al. (2010) and unit mass resolution
                                                                      compared to the vapor concentrations to determine corre-
was used in peak integration. The uncertainty of the concen-
                                                                      lations between observed particle and vapor concentrations
trations is estimated to be −50 %/ + 100 %.
                                                                      during NPF events. In order to ignore the effect of the diur-
                                                                      nal cycles on the analysis, only events that occurred between
                                                                      10:00 and 14:00 LT were included in the correlation analy-

Atmos. Chem. Phys., 21, 695–715, 2021                                                    https://doi.org/10.5194/acp-21-695-2021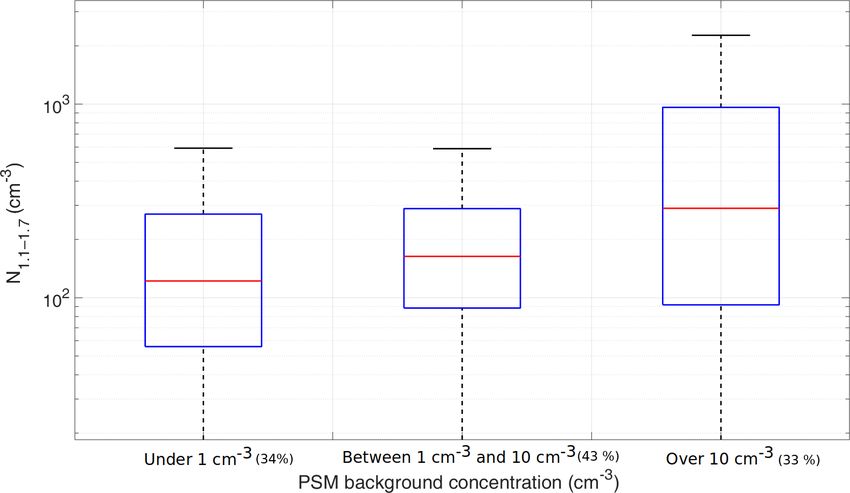
J. Sulo et al.: Long-term measurement of sub-3 nm particles and their precursor gases                                                    701

Table 1. The mass peaks selected for analysis and their molecu-      studies because there was not one dominant peak to choose.
lar formulas. Sulfuric acid and HOM monomer peaks were selected      For HOM non-nitrate dimers we selected 480 (C18 H26 O11
based on correlation with the bolded mass peaks and summed to-       (NO−                              −
                                                                          3 )), 494 (C19 H28 O11 (NO3 )), 510 (C20 H32 O11 (NO3 )),
                                                                                                                                         −
gether in order to increase the signal-to-noise ratio. HOM nitrate                             −                                 −
                                                                     542 (C20 H32 O13 (NO3 )), 556 (C20 H30 O14 (NO3 )), 574
monomer peaks listed as “several compounds” contain HOM ni-          (C20 H32 O15 (NO−                                 −
trate monomers and radicals, but a single peak cannot necessarily                       3 )), 588 (C20 H30 O16 (NO3 )), and 620 Th
                                                                                         −
                                                                     (C20 H30 O18 (NO3 )) based on Sarnela et al. (2018). For
be identified as the main compound.
                                                                     HOM nitrate dimers we selected 538 (C20 H32 O11 N2 (NO−             3 )),
                                                                     555 (C20 H31 O13 N(NO−    3 )), 570 (C20 H 32 O 13 N 2 (NO   −
                                                                                                                                  3  )), 586
          Sulfuric acid              HOM non-nitrate dimers
                                                                     (C20 H32 O14 N2 (NO−  3 )), and  602 Th  (C  20 H 32 O  15 N 2 (NO   −
                                                                                                                                          3 ))
 97 Th     HSO−4                 480 Th C18 H26 O11 (NO− 3)          from known peaks (Zha et al., 2018). The complete list of
 160 Th    H2 SO4 (NO−
                     3)          494 Th C19 H28 O11 (NO− 3)          peaks used in our analysis and their molecular formulas is
 195 Th    H2 SO.4 HSO−          510 Th C20 H32 O11 (NO− 3)
                      4                                              listed in Table 1.
 HOM Non-nitrate Monomers        542 Th C20 H32 O13 (NO− 3)             Sub-3 nm particle concentrations were also compared to
 298 Th C8 H12 O8 (NO−3)         556 Th C20 H30 O14 (NO− 3)          combinations of different precursor molecule concentrations
 308 Th C10 H14 O7 (NO−3)        574 Th C20 H32 O15 (NO− 3)
 310 Th C10 H16 O8 (NO−          588 Th C20 H30 O16 (NO−             since particle formation might involve several different vapor
                       3)                                3)
 340 Th C10 H14 O9 (NO3− )       620 Th C20 H30 O18 (NO−             species. Laboratory experiments replicating boundary-layer
                                                         3)
 HOM Nitrate Monomers            HOM Nitrate Dimers                  NPF in forested regions (Riccobono et al., 2014; Lehtipalo
 297 Th Several compounds        538 Th C20 H32 O11 N2 (NO−3)
                                                                     et al., 2018) and previous analysis of field data sets (Paa-
 311 Th Several compounds        555 Th C20 H31 O13 N(NO− 3)         sonen et al., 2010) have shown that particle formation rates
 327 Th Several compounds        570 Th C20 H32 O13 N2 (NO−3)        can be parameterized using a product of sulfuric acid con-
 339 Th C10 H15 O8 N2 (NO−3)     586 Th C20 H32 O14 N2 (NO−3)        centration and organics concentrations. Therefore, we expect
                                 602 Th C20 H32 O15 N2 (NO−3)        that sulfuric acid and HOMs or some combination of them
                                                                     should correlate well with new particle formation in a boreal
                                                                     forest and the correlations in different size ranges might re-
sis. Correlations were also separately investigated for spring,      veal which precursors are most important at different stages
summer, and autumn NPF events. There were not enough                 of the process.
data points for events during winter for separate analysis.
   We compared the particle concentrations with measured
SA and HOM concentrations since they have been identified            3     Results
to directly participate in NPF in laboratory studies (Sipilä
et al., 2010; Kirkby et al., 2016). The HOM molecules were           In the following section we present the 74 month time series
further divided to monomers and dimers, as well as nitrates          of sub-3 nm particle concentrations and the 31 month time
and non-nitrates, according to their elemental composition.          series of aerosol precursor vapors measured at the SMEAR II
The molecules were divided into nitrates and non-nitrates be-        station in Hyytiälä, southern Finland, and their comparison
cause nitrate HOMs typically have a higher volatility than           for the overlapping time period. The descriptive statistics
non-nitrate molecules (Yan et al., 2020), and it is possible         for both particle and precursor vapor concentrations are pre-
that their contribution to NPF is different (Lehtipalo et al.,       sented in Table 2.
2018). For each category, we summed up the concentrations
of the selected peaks. For our purposes, it is not necessary         3.1    Time series of particle concentrations
to identify all possible peaks in each category but instead to
obtain the temporal variation of different types of particle         The entire time series of the particle concentrations are
precursors.                                                          shown in Fig. 4, and their annual variations are shown in
   For SA, HOM non-nitrate monomers, and HOM nitrate                 Fig. 5. The concentrations show a clear seasonal pattern
monomers, we chose mass peaks 97 Th (HSO−          4 ), 340 Th       for both size bins: 1.1–1.7 and 1.7–2.5 nm. We observe the
(C10 H14 O9 (NO− 3 )), and 339  Th  (C  H   O
                                      10 15 8 2N  (NO   −
                                                        3 )), re-    highest concentrations of 1.1–1.7 nm particles in late spring
spectively (Sarnela et al., 2018; Kulmala et al., 2013). In or-      and summer (maxima in May and July), while 1.7–2.5 nm
der to increase the signal-to-noise ratio, we also chose extra       particles have a clear annual maximum during early spring
mass peaks based on correlation and added up their signal.           (March). We also observe the lowest concentrations for both
For SA, we chose all mass peaks for which the logarithmic            size classes during the winter months, consistent with earlier
correlation coefficient with the SA monomer was higher than          observations at the same site (Kontkanen et al., 2017). The
0.95, and for the organic molecules we chose mass peaks for          end of year 2016 and early 2017 show lower total concen-
which the logarithmic correlation with the original peak was         trations than the rest of the time series. This could be due
higher than 0.85. Some of the selected peaks can contain sev-        to atypical environmental conditions, but we cannot exclude
eral compounds, including HOM nitrate monomers and radi-             technical reasons leading to diminished detection efficiency
cals. For HOM dimers, we chose known peaks from previous             (the instrument was thereafter exchanged in spring 2017).

https://doi.org/10.5194/acp-21-695-2021                                                    Atmos. Chem. Phys., 21, 695–715, 2021
702 J. Sulo et al.: Long-term measurement of sub-3 nm particles and their precursor gases
Figure 4. The monthly variation of the particle concentration in the two PSM size bins. The red line shows the median concentration for
each month and the blue box contains 50 % (25th to 75th percentile) of all data points. The whiskers mark the location of the 95th and
5th percentile data points. The areas with the green background are spring months, the yellow background represents summer months, the
brown background represents autumn months, and the blue background represents winter months. The tick marks visible are in the middle
of each month.
in concentrations is similar. That is likely because of the
slightly wider size range in that study (up to 3 nm, where the
largest size bin was obtained from the difference between
PSM and a differential mobility particle sizer) and because
their data were not filtered to remove scans with too high
background. Additionally, the background was measured and
subtracted manually from the signal in data before 2015. This
may have resulted in an underestimation of the background.
The 2 months of measurements from 2014 at the beginning
of the time series indeed show a higher median concentra-
tion than the rest of the data. However, the exact reason for
the difference is not clear and might be a combination of true
variability between years and technical reasons.
Figure 5. The annual variation of the particle concentration in the The diurnal patterns of particle concentrations are shown
two PSM size bins. The red line shows the median concentration for
in Fig. 6. For the entire data set, we observe a maximum
each month and the blue box contains 50 % (25th to 75th percentile)
of all data points. The whiskers mark the location of the 95th and
for the 1.1–1.7 nm concentration in the evening and a sec-
5th percentile data points. ond smaller peak in the afternoon. In this size bin, the mea-
sured concentrations can consist of both very small particles,
large gas molecules, and/or molecular clusters (Ehn et al.,
The median sub-3 nm concentration of the entire data set 2014); the distinction between them cannot be made based
from 2014 to 2020 was 4.1 × 102 cm−3 , with the spring and on the measurement. Consequently, the maximum can result
summertime concentration being 5.3 × 102 cm−3 and the au- from a combined effect of the diurnal behaviors of large or-
tumn and wintertime concentration being 3.3 × 102 cm−3 . ganic molecules and newly formed molecular clusters. The
Kontkanen et al. (2017) ended up with somewhat higher con- diurnal variation of organic compounds is discussed below.
centrations (median 2.0 × 103 cm−3 ), although the variation The evening maximum can be due to organic molecules or
Atmos. Chem. Phys., 21, 695–715, 2021 https://doi.org/10.5194/acp-21-695-2021J. Sulo et al.: Long-term measurement of sub-3 nm particles and their precursor gases 703 Figure 6. The median diurnal cycles of the particle concentrations for the 1.1–1.7 nm (a) and 1.7–2.5 nm (b) size ranges. The blue, red, and yellow lines show the concentrations for the entire data set, new particle formation events, and non-event days, respectively. The light green, light red, and lilac shading are the diurnal cycles of global radiation for all data, NPF event days, and non-event days, respectively (right y axis). The number of days included in the median day is presented by the number in parentheses in the legend. molecular clusters, which have been observed to form dur- size range during event times is not the largest contributing ing the evening via a biogenic ion-induced mechanism (Rose factor in the concentration. It also confirms that there is a et al., 2018). The 1.7–2.5 nm particle concentration exhibits a constant concentration of small particles and clusters present daytime maximum in the afternoon around the same time as in the atmosphere, much like ion clusters (Kulmala et al., the smaller size range, but the evening maximum is missing 2007; 2013; Kontkanen et al., 2017). in this size range. Because the formation mechanism and thus particle con- During regional NPF events, we expect the sub-3 nm size centrations can vary depending on the season, we studied the distribution to behave differently than when there is no event, diurnal cycles separately for each season (Fig. 7). We ob- in the case that the formation of small particles takes place serve the largest concentrations of 1.1–1.7 nm particles dur- at our measurement location. In Fig. 6, we also present di- ing summer and the lowest during winter, which is likely urnal cycles for NPF event and non-event days separately. connected to the biogenic activity in the surrounding forest. Even though the event classification algorithm gives us ex- During spring and summer, the concentrations of 1.1–1.7 nm act event times, we used entire event days in this part of the particles have distinct maxima in the early afternoon and also analysis. The most noticeable difference between NPF event in the evening. These evening peaks have been linked to the and non-event days is the strong midday maximum for both formation of large organic clusters (Rose et al., 2018). Thus, 1.1–1.7 and 1.7–2.5 nm particle concentrations on NPF event it is not surprising that they are absent in the autumn and win- days. This maximum does not appear during non-event days, ter data. However, autumn and winter concentrations have a leading to the conclusion that the increase in midday concen- single maximum in the late afternoon. These late afternoon trations can be attributed to regional NPF. This is also sup- and evening peaks all occur several hours after global radi- ported by the 1.7–2.5 nm concentrations starting to rise later ation has gone down to essentially zero, indicating that the than the 1.1–1.7 nm concentration, consistent with the fact formation mechanism does not require sunlight. However, it that it takes a while to grow the particles into the larger size should be kept in mind that the boundary layer dynamics can range. The concentrations are also generally higher during also affect the measured concentrations. NPF than non-NPF days, indicating that conditions are favor- The size bin of 1.7–2.5 nm particles exhibits the largest able for cluster/particle formation. However, the 1.1–1.7 nm median concentrations during spring and summer, but the particle concentration only shows a 40 % relative increase diurnal variation is rather similar in all seasons. The higher during NPF in comparison to non-NPF days, while the 1.7– concentration during spring can be at least partially attributed 2.5 nm particle concentration increases by over 250 %. This to an increased frequency of regional NPF (Nieminen et al., suggests that the 1.7–2.5 nm particle concentration is more 2014). Additionally, we observe clear early afternoon max- directly related to new particle formation. It may also mean ima during spring, summer, and autumn that can likely be that the production and sinks of 1.1–1.7 nm particles are large linked to new particle formation, while the concentrations enough that the enhanced growth into the 1.7–2.5 nm particle during nighttime are very low. Concentrations during winter https://doi.org/10.5194/acp-21-695-2021 Atmos. Chem. Phys., 21, 695–715, 2021
704                                   J. Sulo et al.: Long-term measurement of sub-3 nm particles and their precursor gases

Figure 7. The median diurnal cycles of the particle concentrations in different seasons. Panel (a) shows the 1.1–1.7 nm particle concentration
seasonal diurnal cycles and (b) shows the 1.7–2.5 nm particle concentration seasonal cycles. The blue, red, yellow, and purple lines show the
seasonal diurnal cycles spring, summer, autumn, and winter, respectively. The area plots in the background present the seasonal diurnal cycle
for each season. The light green, light yellow, lilac, and dark green shading represent spring, summer, autumn, and winter, respectively. The
number of days included in the median day is presented by the number in parentheses in the legend.

have a weaker diurnal cycle and lower median concentration,              tion exhibits a single daytime peak around midday, similar to
consistent with observations that NPF is rare during winter-             the sulfuric acid concentration, but a slower decrease towards
time.                                                                    the night following the diurnal behavior of NO in the atmo-
                                                                         sphere (Yan et al., 2016, ACP). HOM dimer (both nitrate and
3.2   Time series of vapor concentrations                                non-nitrate) concentrations have different diurnal cycles than
                                                                         the other vapors, exhibiting minima during daytime and an
The time series of the precursor vapors are shown in Fig. 8,             increased concentration at night. During nighttime the ter-
and their annual variation is presented in Fig. 9. We ob-                mination reactions of RO2 radicals with NO and HO2 are
serve the highest concentrations of all studied vapors be-               less likely, and thus a termination reaction with another RO2
tween late spring and early autumn and the lowest concen-                radical, resulting in dimer formation, is more plausible. Sim-
trations in either late autumn, winter, or early spring. This            ilar patterns have been found by Bianchi et al. (2017) using
can be explained by the annual behavior of the precursors of             CI-APi-ToF data from spring 2013 in Hyytiälä and Jokinen
the studied vapors. The main pathway for sulfuric acid for-              et al. (2017) during a solar eclipse.
mation is oxidation of SO2 by OH, and formation of OH is                    During regional NPF event days, the concentrations of
dependent on radiation, whereas the monoterpene emissions                all analyzed aerosol precursor vapors are higher than dur-
are strongly dependent on the temperature (Guenther et al.,              ing non-event days (Fig. 10). However, the diurnal patterns
1995) and thus are highest from late spring and to early au-             of the precursor vapors are otherwise rather similar on event
tumn (Rantala et al., 2015; Hakola et al., 2003). There are no           and non-event days. The non-nitrate monomers and dimers
visible differences in concentrations between different years.           show a small increase during daytime on NPF days that is
   We also analyzed the diurnal behavior of the measured                 absent on non-event days. Additionally, we observe that the
aerosol precursor vapors in the same fashion as the par-                 aerosol precursor vapor concentrations rise earlier and the
ticle concentrations discussed above. The diurnal patterns               difference in concentrations between the nighttime and the
of SA, HOM monomer (nitrate and non-nitrate), and HOM                    daytime is larger on NPF event days. These observations, to-
dimer (nitrate and non-nitrate) concentrations for the entire            gether with the diurnal patterns of global radiation in Figs. 6
data set are shown in Fig. 10. SA concentration has a sim-               and 9, suggest that during event days there is more photo-
ilar diurnal pattern to that of global radiation, which is ex-           chemical production and potentially also higher emissions of
pected as sulfuric acid is formed in the atmosphere mainly               biogenic vapors. However, it is not possible to point out a
through photochemical oxidation (Lucas and Prinn, 2005;                  single vapor explaining the difference between NPF events
Petäjä et al., 2009). HOM non-nitrate monomer concentra-                 and non-events from the diurnal variations.
tion has a minimum in the early morning, with the concentra-                In Fig. 11, we show the diurnal patterns of precursor vapor
tion rising throughout the day until the maximum is reached              concentrations separately for each season. Sulfuric acid ex-
after 18:00 LT. In contrast, HOM nitrate monomer concentra-

Atmos. Chem. Phys., 21, 695–715, 2021                                                         https://doi.org/10.5194/acp-21-695-2021
J. Sulo et al.: Long-term measurement of sub-3 nm particles and their precursor gases 705
Figure 8. The time series of the selected atmospheric aerosol precursor vapors. From the top down, the time series are shown for sulfuric acid,
HOM non-nitrate monomer, HOM non-nitrate dimer, HOM nitrate monomer, and HOM nitrate dimer concentrations, respectively. The time
series are from April 2014 to April 2020. The red line is the median concentration for each month, and the blue box contains 75 % of all data
points. The whiskers mark the location of the 95th and 5th percentile data points. The areas with the green background are spring months,
the yellow background represents summer months, the brown background represents autumn months, and the blue background represents
winter months.
hibits the largest overall peak concentrations during spring, 3.3 The connection between precursor vapors and the
when we have the highest frequency of NPF events (Niem- formation of sub-3 nm particles
inen et al., 2014). All organic vapors we analyzed exhibited
the highest median concentrations during summer and the
We used correlation analysis to investigate the relationship
lowest median concentrations during winter, which can be
between atmospheric sub 3 nm-particle concentrations and
explained by the seasonality of solar radiation and volatile
the selected atmospheric vapors. Here, the NPF data are from
organic compound emissions (Hellén et al., 2018).
event times as specified by the NPF event algorithm and only
Sulfuric acid follows the diurnal behavior of solar radia-
from events occurring between 10:00 and 14:00 LT as to di-
tion in each season, as expected. HOM non-nitrate monomers
minish the effect of the diurnal cycles on the correlations.
and dimers both have an evening peak, and the time of the
Limiting our data selection to this time range diminishes the
maximum shifts seasonally. HOM nitrate monomers have a
effect of meteorological variables on our analysis. Because
daytime maximum, while HOM nitrate dimers have a day-
absolute vapor concentrations are not needed for this anal-
time minimum during all seasons but summer. During sum-
ysis, we used the aerosol precursor vapor data without the
mer, both HOM nitrate and non-nitrate dimers have a small
calculated calibration coefficients to eliminate this source of
midday maximum with two minima: one in the morning and
uncertainty. The results are shown in Table 3.
one in the evening. The seasonal changes in the HOM diur-
Particle concentrations show positive correlation with all
nal cycles result from the seasonality in solar radiation, emis-
the measured precursor vapors, but we can see slight differ-
sions, and boundary layer dynamics.
ences between the two size ranges and between NPF event
times and the whole data set. The smallest particles correlate
better with HOMs than SA when looking at the whole data
https://doi.org/10.5194/acp-21-695-2021 Atmos. Chem. Phys., 21, 695–715, 2021706 J. Sulo et al.: Long-term measurement of sub-3 nm particles and their precursor gases
Figure 9. The annual variation of the analyzed precursor vapors. The red line shows the median concentration for each month, and the blue
box contains 50 % (25th to 75th percentile) of all data points. The whiskers mark the location of the 95th and 5th percentile data points.
Figure 10. The diurnal cycle for each selected atmospheric precursor vapor for the entire data set (blue), for new particle formation event
days (red), and for non-event days (orange). The number of days included in the median day is presented by the number in parentheses in
the legend. The light green, light red, and lilac shading are the diurnal cycles of global radiation for all data, NPF event days, and non-event
days, respectively (right y axis).
set, confirming that this size range is influenced by organic is crucial in determining when the particles grow over the
molecules or clusters. In the larger size range the correlations 1.7 nm threshold.
are quite similar for all vapors when looking at the whole data The best correlations during NPF events were found be-
set, but during NPF events the correlation with SA is higher tween the particle concentrations and the product of SA and
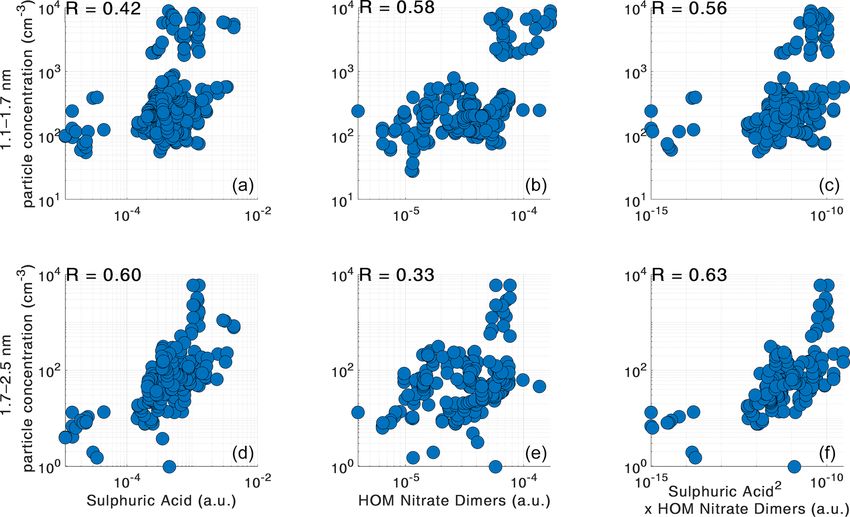
than with the organic precursors. This could indicate that SA HOM nitrate dimers in both size classes. The scatterplots for
the best correlations between atmospheric vapors and sub-
Atmos. Chem. Phys., 21, 695–715, 2021 https://doi.org/10.5194/acp-21-695-2021J. Sulo et al.: Long-term measurement of sub-3 nm particles and their precursor gases 707 Figure 11. The diurnal cycles of precursor vapors in different seasons. The number of days included in the median day is presented by the number in parentheses in the legend. The light green, light yellow, lilac, and dark green shading represent spring, summer, autumn, and winter, respectively. Figure 12. The best logarithmic correlations between particle concentrations measured by PSM and precursor vapors during NPF events occurring between 10 and 14. The correlations of sub-3 nm particle concentrations and sulfuric acid are in (a, d), the correlations of sub-3 nm particle concentrations and HOM nitrate dimers are in (b, e), and the correlations of sub-3 nm particle concentrations and the product of sulfuric acid and HOM nitrate dimers are in (c, f). 3 nm concentrations are shown in Fig. 12. It is quite interest- also point to two separate formation pathways, organic and ing that including HOM nitrate dimers improves the correla- inorganic (Yan et al., 2018). Laboratory experiments in the tion slightly compared to just SA, even though they have a CLOUD chamber have shown that particle formation rates at completely different diurnal variation. It is possible that both 1.7 nm correlate with the product of sulfuric acid, ammonia, sulfuric acid and large organic molecules are required for and non-nitrate HOM dimers (Lehtipalo et al., 2018). How- the formation and growth of new particles, which would ex- ever, we observe that HOM nitrate dimers have a better cor- plain the observed correlations. However, the correlation can relation with the particle concentrations than the HOM non- https://doi.org/10.5194/acp-21-695-2021 Atmos. Chem. Phys., 21, 695–715, 2021
708 J. Sulo et al.: Long-term measurement of sub-3 nm particles and their precursor gases
nitrate dimers. We would expect the opposite, as non-nitrate
with the 25th and 75th percentiles included in parentheses.
Table 2. The descriptive statistics of both particle and vapor concentrations used in the data both for the entire data set and for each season separately. The median values are bolded
HOM nitrate dimers
monomers
HOM nitrate
dimers
HOM non-nitrate
monomers
HOM non-nitrate
Sulfuric acid
1.7–2.5 nm particles
1.1–1.7 nm particles
Concentration (cm−3 )
HOMs have lower volatility than nitrate HOMs (Yan et al.,
2020). This discrepancy with the laboratory results could be
explained by the nitrate HOMs being better correlated with
global radiation (Fig. 10), as NPF most frequently occurs at
the SMEAR II station during the global radiation maximum.
However, the difference in correlation coefficients is not very
large considering the uncertainties involved, so it could also
1.13e+05 (4.17e+04–3.00e+05)
1.52e+06 (3.22e+05–5.68e+06)
2.36e+05 (1.02e+05–5.68e+05)
1.63e+06 (4.87e+05–4.32e+06)
2.97e+05 (9.33e+04–9.65e+05)
8 (3–19)
163 (88–289)
Median concentration (25th–75th)
mean that at least some of the nitrate dimers already have low
enough volatility to participate in NPF, especially together
with SA.
Due to the differences observed in the diurnal cycles of
both sub-3 nm particle concentrations and vapor concentra-
tions between different seasons, we investigated the corre-
lation between sub-3 nm particle concentrations and atmo-
spheric vapors separately in different seasons. Because of the
lack of data for both vapor and particle concentrations dur-
1.25e+05 (7.83e+04–2.98e+05)
2.20e+06 (6.33e+05–6.23e+06)
2.42e+05 (1.01e+05–4.84e+05)
2.08e+06 (7.13e+05–4.82e+06)
5.26e+05 (1.72e+05–1.14e+06)
12 (5–31)
206 (116–395)
(25th–75th)
Median spring concentration
ing winter NPF events, we were only able to analyze spring,
summer, and autumn events. The results of the seasonal NPF
analysis are shown in Table 4.
The analysis reveals clear seasonal differences between
correlations of precursor vapors and sub-3 nm particle con-
centrations. During springtime NPF events, HOM nitrate
dimers correlate with both size bins of measured sub-3 nm
particle concentrations. Additionally, sulfuric acid corre-
lates fairly well with 1.7–2.5 nm particle concentrations.
The springtime correlations are qualitatively similar than
1.50e+05 (7.83e+04–3.61e+05)
6.79e+06 (3.40e+06–1.20e+07)
6.17e+05 (3.20e+05–1.28e+06)
4.49e+06 (2.68e+06–8.44e+06)
5.53e+05 (2.51e+05–1.28e+06)
9 (4–21)
281 (181–445)
(25th–75th)
Median summer concentration
in the whole data set, probably because majority of NPF
events happen in spring. During summertime events, HOM
monomers correlate with the particle concentrations while
HOM nitrate dimers anticorrelate slightly. The non-nitrate
dimers correlate especially well with 1.1–1.7 nm particle
concentrations, which reinforces the earlier observation that
we likely measure some organic clusters in the smallest size
bin. It is possible that HOM nitrate dimer anticorrelation this
is caused by the higher evaporation rate of HOM dimers with
1.15e+05 (4.43e+04–4.57e+05)
6.38e+05 (2.31e+05–2.74e+06)
2.11e+05 (1.16e+05–4.63e+05)
8.89e+05 (3.07e+05–2.49e+06)
1.57e+05 (5.76e+04–4.97e+05)
6 (2–16)
144 (78–222)
(25th–75th)
Median autumn concentration
the increased temperature (Donahue et al., 2011). However,
due to the lack of vapor concentration data from summer
months, the amount of data available for analysis here is lim-
ited and thus correlations may not be representative.
Also during autumn, the HOM monomers and the non-
nitrate dimer correlate better with the particle concentrations
than the nitrate dimer or sulfuric acid, a notable difference
from spring. The correlation coefficients are rather high in
both size ranges, perhaps the diminishing concentrations of
organics make them a limiting factor for particle formation
4.06e+04 (1.19e+04–1.20e+05)
2.23e+05 (9.42e+04–6.61e+05)
8.83e+04 (4.92e+04–1.65e+05)
4.31e+05 (1.40e+05–1.11e+06)
8.86e+04 (4.43e+04–1.78e+05)
6 (2–15)
84 (45–137)
(25th–75th)
Median winter concentration
in autumn. All in all, although the correlation analysis alone
cannot resolve the relative contributions of the different pre-
cursors, these differences in correlations between particle
and vapor concentrations point to an annual variation in the
formation mechanisms of sub-3 nm particles.
It should be noted that SA do not form particles by it-
self at concentrations relevant to the atmospheric boundary
layer (Kirkby et al., 2011). Rather, it needs ammonia (NH3 )
or amines to stabilize the forming clusters. It is yet unclear
Atmos. Chem. Phys., 21, 695–715, 2021 https://doi.org/10.5194/acp-21-695-2021You can also read


