Panoptic vDISCO imaging reveals neuronal connectivity, remote trauma effects and meningeal vessels in intact transparent mice - bioRxiv
←
→
Page content transcription
If your browser does not render page correctly, please read the page content below
bioRxiv preprint first posted online Jul. 23, 2018; doi: http://dx.doi.org/10.1101/374785. The copyright holder for this preprint
(which was not peer-reviewed) is the author/funder, who has granted bioRxiv a license to display the preprint in perpetuity.
                               It is made available under a CC-BY-NC 4.0 International license.

          Panoptic vDISCO imaging reveals neuronal
       connectivity, remote trauma effects and meningeal
               vessels in intact transparent mice
   Ruiyao Cai1,8, Chenchen Pan1,8, Alireza Ghasemigharagoz1, Mihail I. Todorov1, Benjamin
   Förstera1, Shan Zhao1, Harsharan S. Bhatia1, Leander Mrowka1, Delphine Theodorou3,4,
   Markus Rempfler5, Anna Xavier6, Benjamin T. Kress6,7, Corinne Benakis1, Arthur Liesz1,2,
   Bjoern Menze5, Martin Kerschensteiner2,3,4, Maiken Nedergaard6,7 and Ali Ertürk1,2

   1                                                                                                                                2
     Institute for Stroke and Dementia Research, Klinikum der Universität München, Ludwig-Maximilians University Munich, Germany, Munich
                                                                       3
   Cluster for System Neurology (SyNergy), 80336 Munich, Germany, Institute of Clinical Neuroimmunology, Klinikum der Universität
                                                               4
   München, Ludwig-Maximilians University Munich, Germany, Biomedical Center, Ludwig-Maximilians University Munich, Germany,
   5                                                                                                                  6
     Department of Computer Science & Institute for Advanced Study, Technical University of Munich, Munich, Germany, Center for
                                                                           7
   Translational Neuromedicine, University of Rochester, NY 14642, USA, Center for Translational Neuromedicine, Faculties of Health and
                                                                               8
   Medical Sciences, University of Copenhagen, 2200 Copenhagen, Denmark, These authors contributed equally to this work

   Correspondence: Ali.Ertuerk@med.uni-muenchen.de

   Note: Manuscript videos are available at ‘Supplementary material’ section of BioRxiv
   and at the following link http://vdisco.isd-muc.de/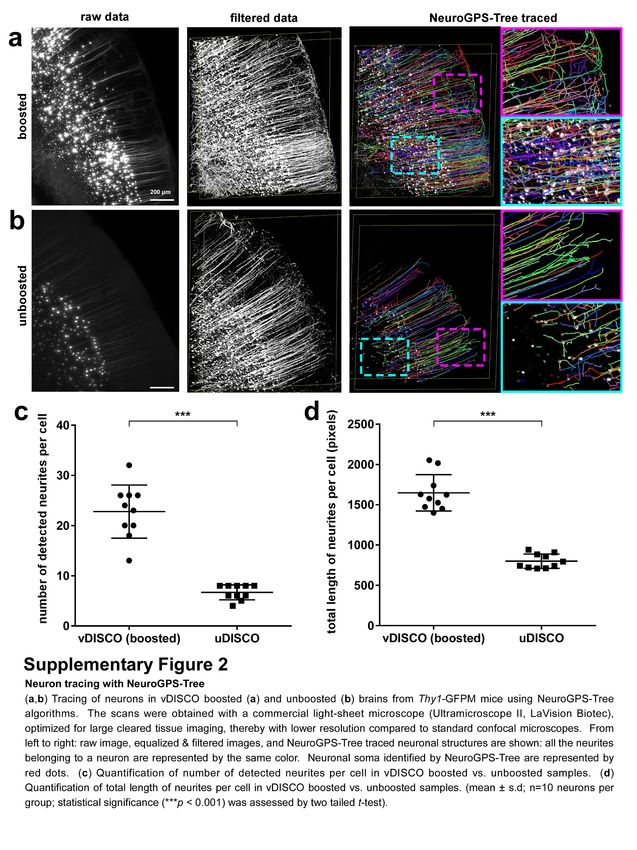
bioRxiv preprint first posted online Jul. 23, 2018; doi: http://dx.doi.org/10.1101/374785. The copyright holder for this preprint
(which was not peer-reviewed) is the author/funder, who has granted bioRxiv a license to display the preprint in perpetuity.
                               It is made available under a CC-BY-NC 4.0 International license.

   Abstract
   Analysis of entire transparent rodent bodies could provide holistic information on biological systems in
   health and disease. However, it has been challenging to reliably image and quantify signal from
   endogenously expressed fluorescent proteins in large cleared mouse bodies due to the low signal
   contrast. Here, we devised a pressure driven, nanobody based whole-body immunolabeling
   technology to enhance the signal of fluorescent proteins by up to two orders of magnitude. This
   allowed us to image subcellular details in transparent mouse bodies through bones and highly
   autofluorescent tissues, and perform quantifications. We visualized for the first-time whole-body
   neuronal connectivity of an entire adult mouse and discovered that brain trauma induces degeneration
   of peripheral axons. We also imaged meningeal lymphatic vessels and immune cells through the intact
   skull and vertebra in naïve animals and trauma models. Thus, our new approach can provide an
   unbiased holistic view of biological events affecting the nervous system and the rest of the body.

   Introduction

   Most diseases, even when arising in a specific lesion or locus, eventually come to affect the entire
   organism. Histological techniques developed in the last century have been the standard procedure for
   charting pathology, yet, a more complete understanding of biological mechanisms requires an
   unbiased exploration of the whole organism, not just selected tissue slices.

   However, mammalian tissues are naturally opaque, hindering high-resolution imaging in any tissue
   deeper than a few hundred micrometers– a major reason why sectioning is needed for histological
   examination of target organs1. Recent innovations in tissue clearing technology now allow 3D
   histological examination of intact organs2-15. Tissue clearing is a chemical process aiming to match
   refractive indices throughout intact tissues, thus rendering them transparent and allowing deep tissue
   fluorescent microscopy. Most initial applications of tissue clearing have focused on clearing and
   imaging of endogenous fluorescent proteins expressed in the mouse brain. More recently, deep tissue
   immunolabeling methods have enhanced the quality of imaging for whole rodent organs as well as
   human embryos thanks to conjugation of bright fluorescent dyes with secondary antibodies4,16,17. A
   few studies have even rendered entire adult mouse bodies transparent3,18, and allowed head-to-toe
   light-sheet microscopy imaging of intact adult mice19. All whole-body clearing and imaging methods
   up to date relies on transgene expression of fluorescent proteins such as EGFP, EYFP and
   mCherry19,20. While these fluorescent proteins emit light in the visible spectrum, skeletal muscle and
   other bodily tissues have obstructive autofluorescence in this range21. In addition, fluorescent proteins
   are often less bright compared to most of the synthetic fluorophores and their signal intensity is further
   attenuated during the clearing and imaging procedures. Together, these bottlenecks hinder the reliable
   detection and quantification of subcellular details in centimeters-thick transparent mice, thereby
   needing imaging of dissected organs for quantifications, compromising the benefit of whole-body
   transparency.

   Here, we developed a whole-body immunolabeling method to boost the signal of fluorescent proteins
   (named vDISCO). This technology enhances the fluorescent signals up to 118 times, and thereby
   allows panoptic imaging and quantification of subcellular details in transparent mice including changes
   in neuronal connectivity at the neuromuscular junctions upon brain trauma.

                                                                                                                                    2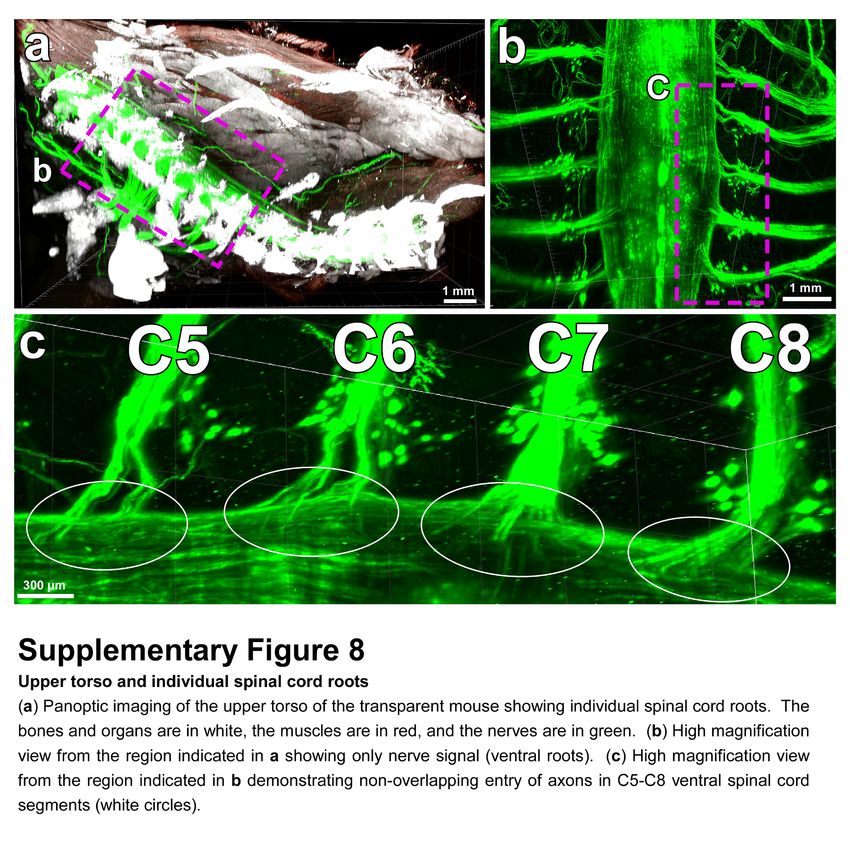
bioRxiv preprint first posted online Jul. 23, 2018; doi: http://dx.doi.org/10.1101/374785. The copyright holder for this preprint
(which was not peer-reviewed) is the author/funder, who has granted bioRxiv a license to display the preprint in perpetuity.
                               It is made available under a CC-BY-NC 4.0 International license.

   Results

   vDISCO principles and signal enhancement
   We reasoned that enhancing the signal of fluorescent proteins via whole-body immunolabeling with
   brighter and more stable fluorescent dyes could provide a much higher contrast (signal-to-background
   ratio = SBR) in cleared mice. Furthermore, using fluorescent dyes with emission peaks in the far-red
   range could help to overcome tissue autofluorescence, thus affording reliable detection of subcellular
   details in all tissues4,21 (Supplementary Fig. 1). We reasoned that nanobodies are particularly suited
   to achieve a thorough immunolabeling throughout adult mice because of their small molecular weight
   (12-15 kDa) compared to that of conventional antibodies (~150 kDa)3,22. For whole-body labeling, we
   delivered anti-XFP nanobodies conjugated to bright Atto dyes (called nanoboosters) using a pressure
   driven peristaltic pump to enhance their penetration deep into tissues.

   We first tested the signal quality of nanobody labeling in dissected mouse brains coming from Thy1-
   GFPM mice, in which a subset of neurons express EGFP23. Following the nanoboosting, the tissues
   were cleared using organic solvents6,7. We found that nanoboosting enhanced the signal quality one
   to two order of magnitude compared to direct imaging of fluorescent proteins (Fig. 1a-k). In the
   nanoboosted samples, fine details of neurons were evident even in the regions with fewer neurons
   labelled in Thy1-GFPM mice such as the midbrain (Fig. 1c,d vs. Fig. 1g,h). We obtained a similar
   signal quality increase in the cerebellum of Thy1-GFPM brains (Fig. 1i vs. Fig. 1j), which is notoriously
   difficult to clear due to the high lipid content.

   A major aim of tissue clearing approaches is to perform automated quantifications in large imaging
   datasets in an unbiased and timely way. Towards this goal, we used the NeuroGPS-Tree algorithm, a
   robust automated neuron-tracing tool that was recently developed for tracing cortex regions obtained
   by high-resolution confocal microscopy24. We found that, virtually all of the neuronal cell bodies and
   neurites were detected and linked to each other as complete neurons upon nanoboosting
   (Supplementary Fig. 2). In contrast, in unboosted samples, many fine extensions of neurons were
   not identified or not connected to neuronal trees (Supplementary Fig. 2). Nanoboosting allowed
   imaging of not only neuronal details, but also smaller individual cells such as immune cells
   (Supplementary Fig. 3). Compared to unboosted samples, we could resolve fine details of microglia
   cells in intact transparent brains of CX3CR1GFP/+ mice25 using light-sheet microscopy (Fig. 1l-o).
   Nanoboosting also enabled automated quantification of CX3CR1 GFP+ cells: using ClearMap
   algorithms26 we found approximately 2.59 million microglia cells in the adult mouse brain. We also
   automatically quantified microglia in all brain regions annotated by the Allen brain atlas. Thereby we
   found for example ~150,000 microglia in the hippocampus and ~50,000 in the thalamus of adult mice
   (Supplementary Fig. 4). Furthermore, we found no significant decrease of signal quality suggesting
   that nanoboosting stabilizes the fluorescent signal (Fig. 1p,q). Thus, owing to the enormous
   enhancement and stabilization of signal with nanobodies, we could use available computational tools
   to automatically trace neurons and count cell numbers in even low resolution light-sheet microscopy
   imaging datasets.

                                                                                                                                    3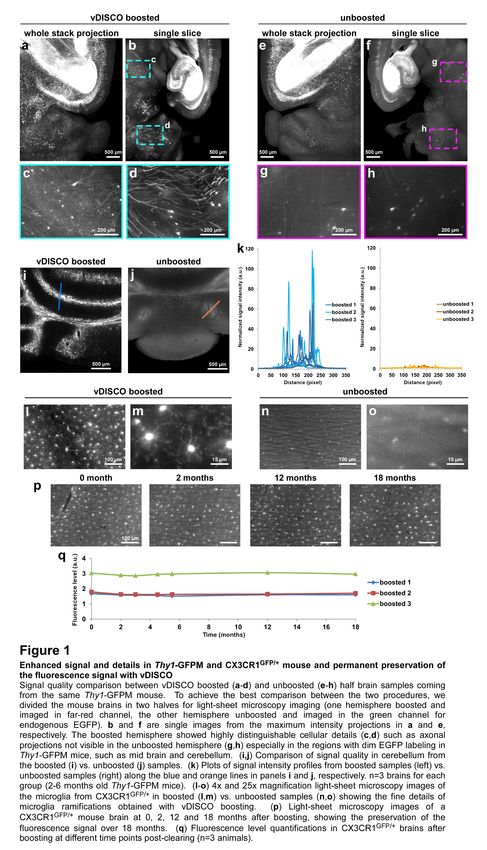
bioRxiv preprint first posted online Jul. 23, 2018; doi: http://dx.doi.org/10.1101/374785. The copyright holder for this preprint
(which was not peer-reviewed) is the author/funder, who has granted bioRxiv a license to display the preprint in perpetuity.
                               It is made available under a CC-BY-NC 4.0 International license.

                                                                                                                                    4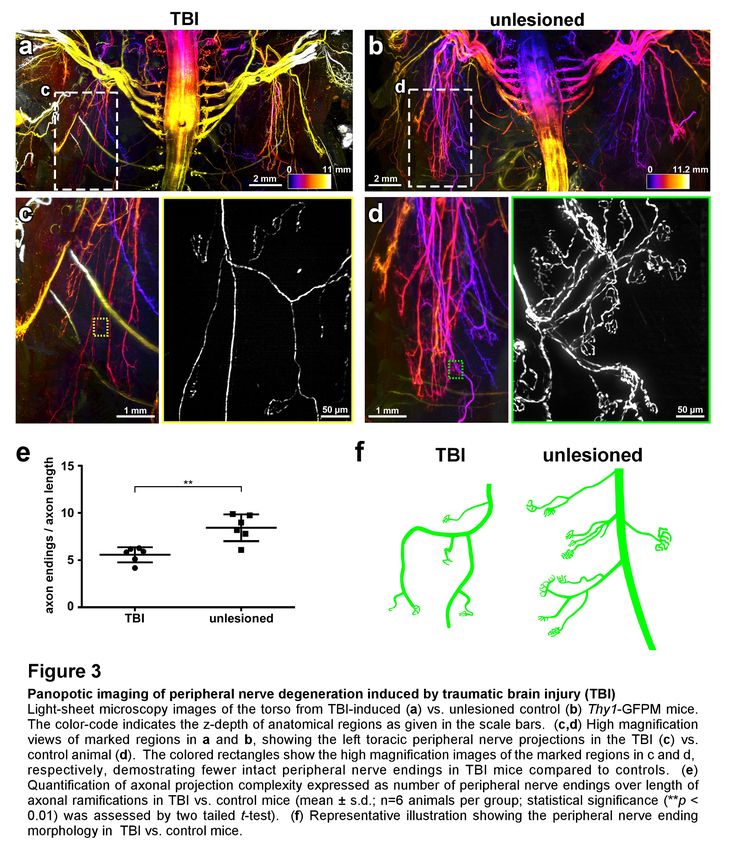
bioRxiv preprint first posted online Jul. 23, 2018; doi: http://dx.doi.org/10.1101/374785. The copyright holder for this preprint
(which was not peer-reviewed) is the author/funder, who has granted bioRxiv a license to display the preprint in perpetuity.
                               It is made available under a CC-BY-NC 4.0 International license.

   Figure 1. Enhanced signal and details in Thy1-GFPM and CX3CR1GFP/+ mouse and permanent preservation of
   the fluorescence signal with vDISCO
   Signal quality comparison between vDISCO boosted (a-d) and unboosted (e-h) half brain samples coming from the
   same Thy1-GFPM mouse. To achieve the best comparison between the two procedures, we divided the mouse brains
   in two halves for light-sheet microscopy imaging (one hemisphere boosted and imaged in far-red channel, the other
   hemisphere unboosted and imaged in the green channel for endogenous EGFP). b and f are single images from the
   maximum intensity projections in a and e, respectively. The boosted hemisphere showed highly distinguishable cellular
   details (c,d) such as axonal projections not visible in the unboosted hemisphere (g,h) especially in the regions with
   dim EGFP labeling in Thy1-GFPM mice, such as mid brain and cerebellum. (i,j) Comparison of signal quality in
   cerebellum from the boosted (i) vs. unboosted (j) samples. (k) Plots of signal intensity profiles from boosted samples
   (left) vs. unboosted samples (right) along the blue and orange lines in panels i and j, respectively. n=3 brains for each
   group (2-6 months old Thy1-GFPM mice). (l-o) 4x and 25x magnification light-sheet microscopy images of the
   microglia from CX3CR1GFP/+ in boosted (l,m) vs. unboosted samples (n,o) showing the fine details of microglia
   ramifications obtained with vDISCO boosting. (p) Light-sheet microscopy images of a CX3CR1GFP/+ mouse brain at 0,
   2, 12 and 18 months after boosting, showing the preservation of the fluorescence signal over 18 months. (q)
   Fluorescence level quantifications in CX3CR1GFP/+ brains after boosting at different time points post-clearing (n=3
   animals).

   vDISCO allows panoptic imaging of intact adult mouse bodies
   To understand how the organisms function at the systems biology level, it is critical to obtain a
   subcellular resolution view not only on single organs but also on intact organisms. Towards this goal,
   we established an approach to achieve nanoboosting in the entire mouse body (Fig. 2a,
   Supplementary Fig. 5). We used a pressure delivery of a permeabilization solution containing Triton
   X-100, methyl-β-cyclodextrin (to extract the cholesterol from membranes), and trans-1-acetyl-4-
   hydroxy-L-proline (to loosen the collagen network)27. To further reduce the background caused by the
   residual blood and to decalcify the bones, we treated whole mouse bodies with aminoalcohols18 and
   EDTA20,28, before the whole-body immunolabeling step. In addition to the specific boosted signal, we
   also visualized other major tissues in the transparent body: muscles by their autofluorescence at the
   blue-green spectra, bones and internal organs by propidium iodide (PI) labeling (Fig. 2b-c,
   Supplementary Fig. 6a-d). Usage of organic solvents inducing shrinkage19 allowed us to perform a
   head-to-toe panoptic imaging of a whole mouse by light-sheet microscopy.

   Being able to image subcellular details of neurons through intact bones and highly autofluorescent
   muscles in whole mouse body with vDISCO panoptic imaging, we constructed the first whole-body
   neuronal connectivity map of a Thy1-GFPM transgenic mouse (Fig. 2 d,e Supplementary Fig. 6,
   Video 1). We noticed that in the peripheral nervous system (PNS) mainly axons innervating
   neuromuscular junctions were labelled in this mouse line. We also observed fluorescent labeling of
   the internal organs in rare cases such as kidneys of Thy1-YFPH mice, which was not reported before23
   (Supplementary Fig. 7). Owing to the great increase in SBR by vDISCO, we could readily visualize
   details of axonal extensions from spinal cord through intact vertebra, until their terminals into the
   muscles and toes (Fig. 2f-i, Videos 2,3). Panoptic imaging of individual neuronal connections through
   intact bones can now provide more details on neuroanatomy. For example, how axons coming from
   consecutive roots enter the spinal cord i.e., in an overlapping or non-overlapping manner has been
   unclear29. Using our technology, we observed that in mice, the axonal bundles coming from different
   roots enter the spinal cord at non-overlapping territories (Supplementary Fig. 8). Thus, vDISCO
   approach provides a holistic view of the intact mouse, which should lead to novel discoveries on how
   interconnected organ systems function in health and what happens during their perturbation in
   disease.

                                                                                                                                    5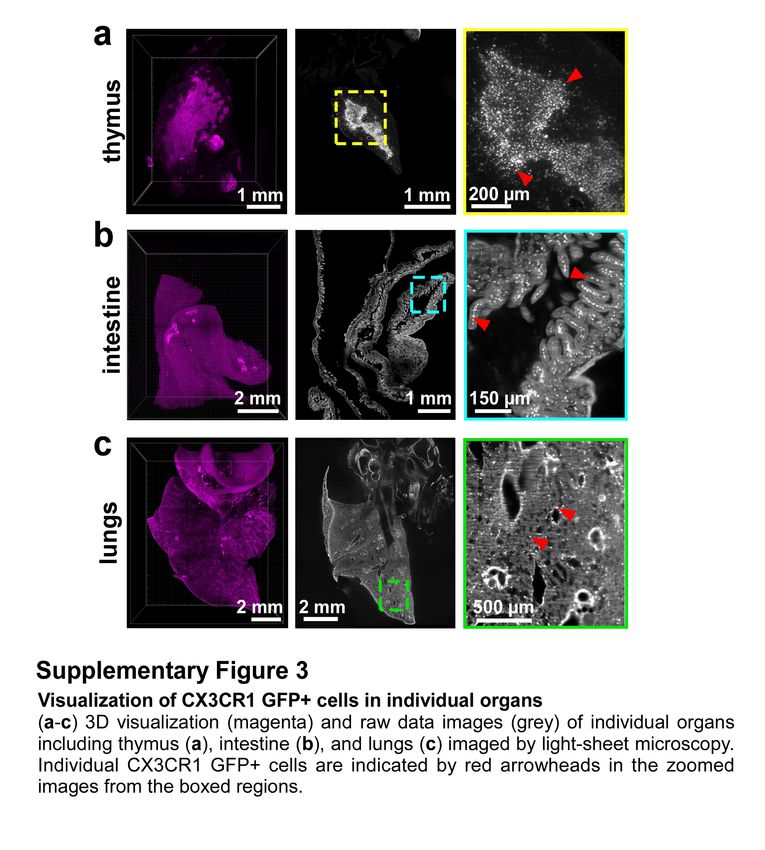
bioRxiv preprint first posted online Jul. 23, 2018; doi: http://dx.doi.org/10.1101/374785. The copyright holder for this preprint
(which was not peer-reviewed) is the author/funder, who has granted bioRxiv a license to display the preprint in perpetuity.
                               It is made available under a CC-BY-NC 4.0 International license.

   Figure 2. Panoptic imaging of intact Thy1-GFPM mouse
   (a) An example of “invisible mouse” generated by vDISCO. (b-e) Whole body 3D reconstructions from light-sheet
   microscopy imaging of a Thy1-GFPM animal. vDISCO boosted EGFP+ neuronal structures are shown in green, bones
   and internal organs that are prominent with PI labeling in white, and the muscles visualized by autofluorescence
   background imaging are in red (a-c). The depth color-coding shows the neuronal projections at different z-levels in 2.5
   cm thick whole mouse body (d). (f,g) High resolution 3D reconstruction views of the left torso and forelimb from the
   same animal in a-d. Details of innervation throughout muscles and bones are evident. (h,i) The surface reconstruction
   of the paw (h) and its nerves (i) from the marked region in e. See also Video 1-3.

                                                                                                                                    6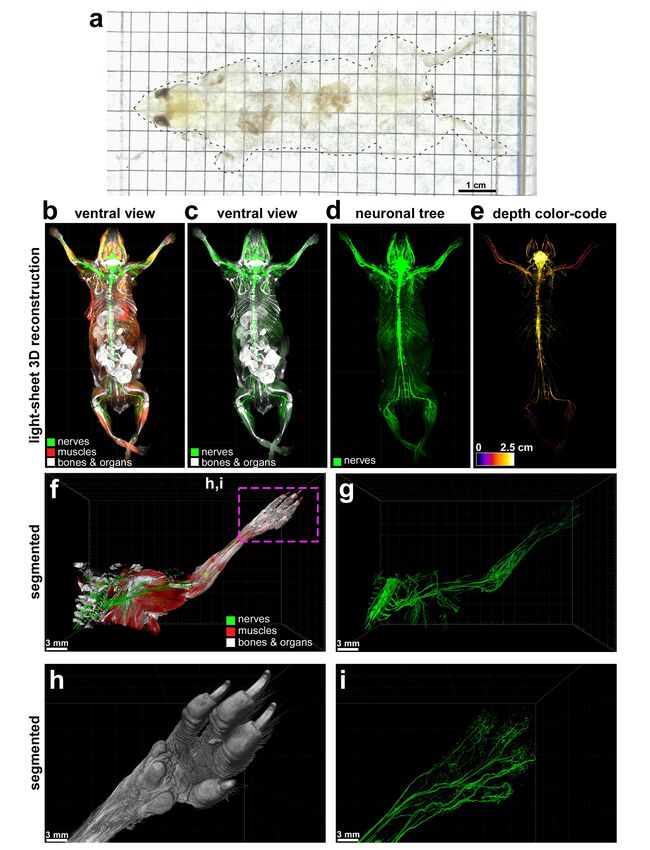
bioRxiv preprint first posted online Jul. 23, 2018; doi: http://dx.doi.org/10.1101/374785. The copyright holder for this preprint
(which was not peer-reviewed) is the author/funder, who has granted bioRxiv a license to display the preprint in perpetuity.
                               It is made available under a CC-BY-NC 4.0 International license.

   Degeneration of peripheral nerve terminals after brain injury
   Traumatic brain injury (TBI) is a major cause of death and disability and currently there is no disease
   modifying treatment available. It often leads to chronic focal and global neurological impairments, such
   as dementia, epilepsy and progressive motor decline30. However, it is unclear whether and where
   neuronal connectivity is altered in remote body regions upon acute brain injuries. Here, we used
   panoptic imaging to examine neuronal changes throughout the body more than a month after brain
   injury in comparison to control animals. As mainly axonal extensions innervating muscles are labelled
   in Thy1-GFPM mice, we primarily focused on these nerve terminals. Our quantifications on intact
   cleared mouse bodies demonstrated that the complexity of nerve terminals at the neuromuscular
   junctions was reduced after TBI, especially in the upper torso compared to unlesioned control mice
   (Fig. 3a-d). We observed that nerve endings were largely reduced in size, with fewer axonal
   ramifications left, implying partial degeneration of these axon terminals (Fig. 3e,f). These data show
   that light-sheet microscopy imaging data of transparent mouse bodies by vDISCO can be quantified
   to obtain previously unknown biological information.

    Figure 3. Panoptic imaging of peripheral nerve degeneration induced by traumatic brain injury (TBI)
    Light-sheet microscopy images of the torso from TBI-induced (a) vs. unlesioned control (b) Thy1-GFPM mice. The
    color-code indicates the z-depth of anatomical regions as given in the scale bars. (c,d) High magnification views of
    marked regions in a and b, showing the left toracic peripheral nerve projections in the TBI (c) vs. control animal (d).
    The colored rectangles show the high magnification images of the marked regions in c and d, respectively,
    demostrating fewer intact peripheral nerve endings in TBI mice compared to controls. (e) Quantification of axonal
    projection complexity expressed as number of peripheral nerve endings over length of axonal ramifications in TBI
    vs. control mice (mean ± s.d.; n=6 animals per group; statistical significance (**p < 0.01) was assessed by two tailed
    t-test). (f) Representative illustration showing the peripheral nerve ending morphology in TBI vs. control mice.

                                                                                                                                    7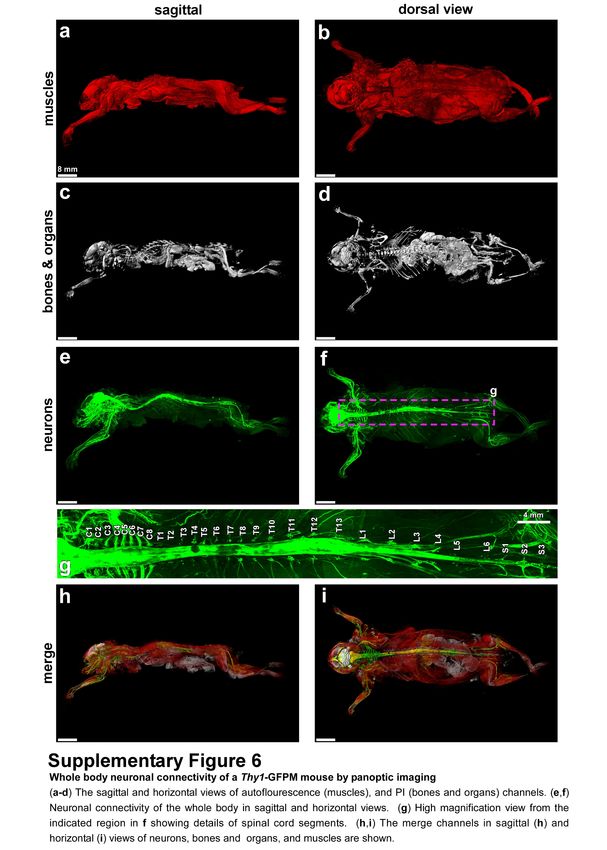
bioRxiv preprint first posted online Jul. 23, 2018; doi: http://dx.doi.org/10.1101/374785. The copyright holder for this preprint
(which was not peer-reviewed) is the author/funder, who has granted bioRxiv a license to display the preprint in perpetuity.
It is made available under a CC-BY-NC 4.0 International license.
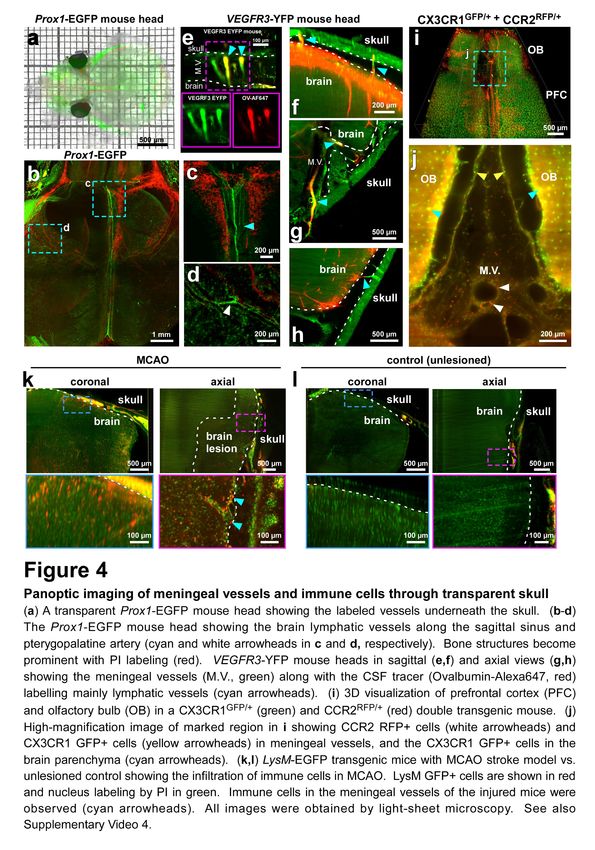
Imaging meningeal vessels of the central nervous system (CNS)
The lymphatic system, which connects various lymphatic organs in the body, is crucial for immune
responses. Until recently, the brain was considered to be devoid of any lymphatic vessels. In the recent
years, however, existence of brain lymphatic vessels was discovered, which calls for a re-evaluation
of immune cell trafficking routes between the CNS and the rest of the body31-33. As these lymphatic
vessels are located between the brain and skull, their connections are largely destroyed when the
brain is harvested for standard histology.
We utilized panoptic imaging to overcome this hurdle and image details of meningeal vessels in intact
transparent mice. We first used Prox1-EGFP reporter mice, in which lymphatic endothelial cells
express EGFP34. We readily observed previously described brain lymphatic structures in complete,
particularly along the sagittal sinus and pterygopalatine artery (Fig. 4a-d). Next, we injected a cerebral
spinal fluid (CSF) tracer (fluorophore-conjugated ovalbumin) into the cisterna magna in VEGFR3-YFP
mice, another commonly used reporter line for meningeal vessels. We could clearly visualize vascular
connections between the brain and skull, which were labelled with CSF tracer (Fig. 4e-h). Next, we
imaged multiple subtypes of immune cells within and outside the meningeal vessels using the
CX3CR1GFP/+ x CCR2RFP/+ mice by multiplexing with two different nanoboosters (anti-GFP conjugated
to Atto-647N and anti-RFP conjugated to Atto-594N). The CX3CR1 GFP+ microglia cells in the brain
parenchyma (Fig. 4i,j, cyan arrowheads) and CCR2 RFP+ peripheral immune cells in the meningeal
vessels were clearly identifiable (Fig. 4i,j, white arrowheads and Video 4). As expected, we observed
CX3CR1 GFP+ immune cells also in meningeal vessels, which likely represent the peripheral
macrophages and monocytes (Fig. 4j, yellow arrowheads). Thus, vDISCO panoptic imaging of
transparent mice is a powerful tool to study the intact anatomy of meningeal vessels in their native
environment.
It remains unclear, how the immune cells within meningeal vessels contribute to the pathology of acute
brain injuries (or other neurological diseases), although they may be in an advantageous position to
invade the brain. To start addressing this query, we used the middle cerebral artery occlusion (MCAO)
model of stroke, which was performed on LysM-EGFP mice, a transgenic mouse line expressing
EGFP in neutrophils, monocytes and macrophages but not in microglial cells35. The mice with MCAO
showed an invasion of LysM GFP+ cells into the brain parenchyma especially in the peri-infarct region
compared to sham controls (Fig. 4k,l). LysM GFP+ cells also increased in the meningeal structures
of MCAO mice (Fig. 4k cyan arrowheads) suggesting that the meninges might be playing a role as
entry and/or exit route of the brain in addition to the disrupted blood brain-barrier and the choroid
plexus36. Finally, we explored the inflammatory reaction after spinal cord injury (SCI) using panoptic
imaging. To this end, we induced a SCI in CD68-EGFP transgenic mice expressing EGFP in
monocytes and macrophages37. Upon SCI, we observed an influx of CD68 GFP+ cells at the spinal
lesion site as well as a rather widespread increase in CD68 GFP+ cells around the site of the spinal
cord trauma including in the adjacent muscles, spinal cord roots and meningeal vessels
(Supplementary Fig. 9, Video 5) suggesting that a broader view on inflammation in SCI pathology is
needed.
8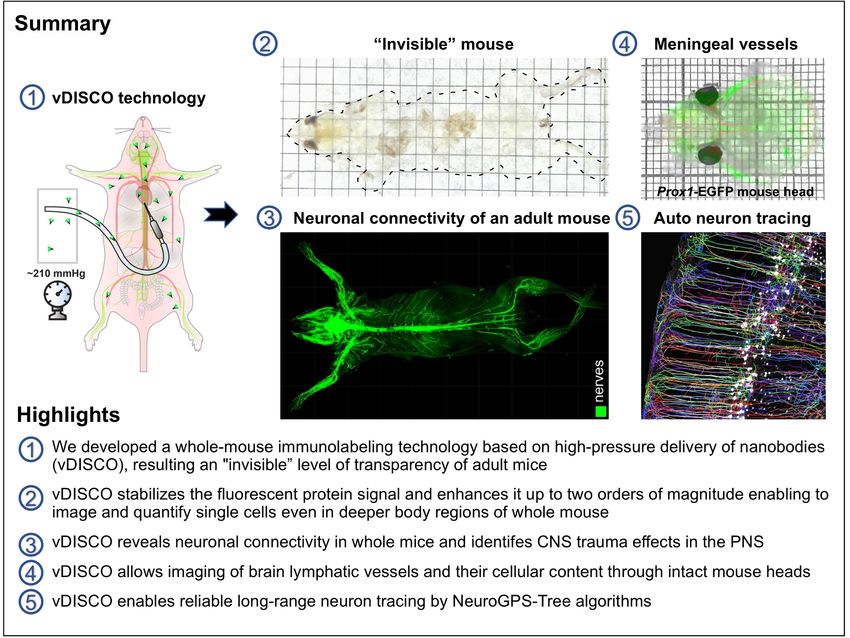
bioRxiv preprint first posted online Jul. 23, 2018; doi: http://dx.doi.org/10.1101/374785. The copyright holder for this preprint
(which was not peer-reviewed) is the author/funder, who has granted bioRxiv a license to display the preprint in perpetuity.
                               It is made available under a CC-BY-NC 4.0 International license.

   Figure 4. Panoptic imaging of meningeal vessels and immune cells through transparent skull
   (a) A transparent Prox1-EGFP mouse head showing the labeled vessels underneath the skull. (b-d) The Prox1-EGFP
   mouse head showing the brain lymphatic vessels along the sagittal sinus and pterygopalatine artery (cyan and white
   arrowheads in c and d, respectively). Bone structures become prominent with PI labeling (red). VEGFR3-YFP mouse
   heads in sagittal (e,f) and axial views (g,h) showing the meningeal vessels (M.V., green) along with the CSF tracer
   (Ovalbumin-Alexa647, red) labelling mainly lymphatic vessels (cyan arrowheads). (i) 3D visualization of prefrontal
   cortex (PFC) and olfactory bulb (OB) in a CX3CR1GFP/+ (green) and CCR2RFP/+ (red) double transgenic mouse. (j) High-
   magnification image of marked region in i showing CCR2 RFP+ cells (white arrowheads) and CX3CR1 GFP+ cells
   (yellow arrowheads) in meningeal vessels, and the CX3CR1 GFP+ cells in the brain parenchyma (cyan arrowheads).
   (k,l) LysM-EGFP transgenic mice with MCAO stroke model vs. unlesioned control showing the infiltration of immune
   cells in MCAO. LysM GFP+ cells are shown in red and nucleus labeling by PI in green. Immune cells in the meningeal
   vessels of the injured mice were observed (cyan arrowheads). All images were obtained by light-sheet microscopy.
   See also Video 4.

                                                                                                                                    9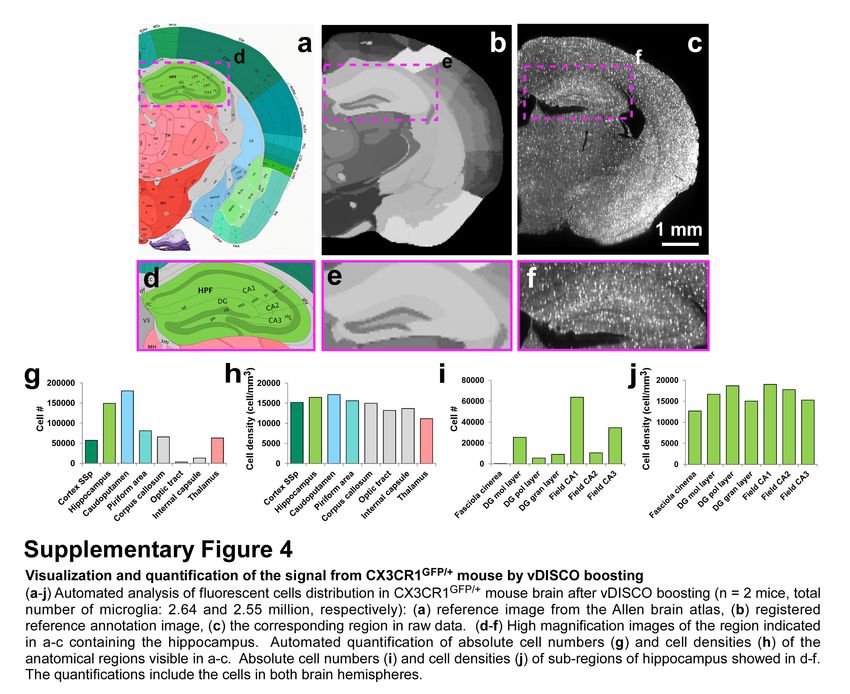
bioRxiv preprint first posted online Jul. 23, 2018; doi: http://dx.doi.org/10.1101/374785. The copyright holder for this preprint
(which was not peer-reviewed) is the author/funder, who has granted bioRxiv a license to display the preprint in perpetuity.
                               It is made available under a CC-BY-NC 4.0 International license.

   Discussion
   Imaging of transparent adult mouse bodies from head to toe holds the promise of providing an
   unbiased and highly resolved view of entire organ systems in health and disease. Here, we developed
   a new whole-body nanobody labeling method in conjunction with whole-body tissue clearing, enabling
   a reliable visualization and quantification of subcellular details throughout the centimeters-thick tissues
   of intact mouse bodies. This new panoptic imaging technology is straightforward in application, and
   suitable for systemic analysis of a vast range of biomedical inquires, as demonstrated here in the
   mapping of the neuronal connectome, and investigation of meningeal vessels and immune cell
   infiltrations through intact bones in acute CNS trauma models.

   The panoptic imaging of nervous and immune systems in intact mouse bodies was achieved owing to
   the enhancement of signal quality by one to two orders of magnitude via whole-body immunolabeling
   with nanobodies conjugated to bright dyes in far-red spectra. Therefore, autofluorescence in shorter
   wavelength spectra, in which traditional fluorescent proteins such as GFP are excited and imaged, is
   avoided. Here, we primarily used Atto dyes at 647 nm, and additional Atto 594 nm for multiplexing 2
   different cell types. In the future, usage of nanobodies conjugated to dyes that emit in the near infrared
   range38 can further facilitate multiplexed detection of more than 2 targets. While the number of
   commercially available nanobodies is still limited, the nanoboosters used in this study can stain a
   broad selection of 21 different fluorescent proteins including EGFP, YFP, Venus, mCherry, and mRFP.
   Here, we used transgenic mice endogenously expressing fluorescent proteins, however, the labeling
   can also be achieved by rabies virus retrograde tracing, systematic AVV injections39 or transplantation
   of genetically engineered cells (such as stem cells or adoptive transfer of immune cells). Another key
   advantage of vDISCO panoptic imaging is that upon staining with Atto dyes through nanoboosting the
   signal becomes permanent, permitting long-term imaging sessions and also future re-analysis of the
   same sample as needed. It is notable that, while we developed vDISCO for panoptic imaging of the
   whole mouse body, it is readily applicable for individual organs, using a simplified protocol to drastically
   increase and stabilize the signal contrast, as we show for mouse brains imaged more than a year after
   clearing (Video 6).

   A current limitation is the absence of light-sheet microscope systems that could image the entire body
   of a mouse in one session without any displacement and turning of the sample. Construction of such
   new light-sheet microscopes should further decrease the time needed for data acquisition and simplify
   data processing for 3D reconstruction. In fact, as shown here, optics and light sources of current
   commercial light-sheet microscopes are sufficient to image intact mouse bodies at subcellular
   resolution, albeit the whole body has to be manually moved in the imaging chamber to achieve the
   scanning of different body regions. In addition, development of algorithms to automatically identify and
   quantify cellular changes on the whole organism scale will be important to further scale up this
   technology in the future.

   Using panoptic imaging, we constructed a neuronal connectivity map for the Thy1-GFPM transgenic
   mouse, showing subcellular details of long-range neuronal connections from CNS to the most distal
   body regions. Here, we visualized neuronal details in Thy1-GFPM mice, where 5-10% of CNS neurons
   and PNS neurons innervating skeletal muscles are labelled. In the future, panoptic imaging of other
   transgenic lines labeling a greater and more diverse subset of neurons will allow the exploration of
   other biological systems such as the autonomic nerve innervation of internal organs.

   In recent years, researchers have been providing more evidences on post TBI changes that seem to
   form the basis of chronic complications, such as epilepsy, neuropsychiatric disorders, dementia and
   progressive motor decline among others30. However, the effects of a localized brain lesion on the rest
   of the body have been poorly understood mainly due to the technical challenges in studying long-
   range neuronal connectivity. Because vDISCO fluorescent signal boosting allows both imaging and
   quantifications on light-sheet microscopy images of transparent mouse bodies, we identified TBI-

                                                                                                                                    10
bioRxiv preprint first posted online Jul. 23, 2018; doi: http://dx.doi.org/10.1101/374785. The copyright holder for this preprint
(which was not peer-reviewed) is the author/funder, who has granted bioRxiv a license to display the preprint in perpetuity.
It is made available under a CC-BY-NC 4.0 International license.
induced changes at the peripheral axonal projections innervating the skeletal musculature of the torso.
These data are in line with our recent results demonstrating functional deficits in fine motor movements
in mice upon TBI in the same experimental model40. Here, we also demonstrated that meningeal
vessels extending between the cranium and CNS tissue and their cellular content can readily be
imaged by vDISCO panoptic imaging in naïve animals and acute CNS injury models (stroke and spinal
cord injury). As neuroinflammation is a major determinant of neuronal function and survival following
CNS insults of various aetiologies, our technology should accelerate the study of brain lymphatic
vessels in various CNS pathologies.
Thus, vDISCO enhancement and stabilization of fluorescent proteins combined with signal acquisition
in far-red spectra should facilitate discovery of previously inaccessible biological information. For
example, imaging and quantification of neuronal connectivity and immune cell populations in the entire
mouse body should contribute to a more comprehensive understanding of the degenerative and
inflammatory pathways in disease states such as dementia and neuropsychiatric disorders.
Acknowledgements:
This work was supported by the Vascular Dementia Research Foundation, Synergy Excellence
Cluster Munich (SyNergy), ERA-Net Neuron (01EW1501A, A.E.), NIH (A.E. and M.N.), the Novo
Nordisk Foundation (M.N.), the Howard Hughes (B.T.K.), and the Lundbeck Foundation (to A.X. and
M.N.). We thank Antonia Weingart for illustrations, Farida Hellal for technical advice and critical
reading of the manuscript, and Arnaldo Parra Damas, Francesca Quacquarelli, and Giuseppe Locatelli
for help during initial optimization. A.E, C.P., R.C., A.L. and M.I.T. are members of the Graduate School
of Systemic Neurosciences (GSN) at the Ludwig Maximilians University of Munich.
Author contributions:
A.E. initiated and led all aspects of the project. R.C. and C.P. developed the method and conducted
most of the experiments. R.C. and A.G. analyzed data. M.I.T. stitched and analyzed the whole mouse
body scans. B.F. and S.Z. helped to optimize the protocols. H.S.B., L.M., M.R. and B.M., analyzed
data. D.T. and M.K. contributed spinal cord injury experiments; C.B. and A.L. MCAO experiments; and
A.X., B.K., and M.K., CM injection experiments. A.E. wrote the paper. All the authors edited the
manuscript.
Competing financial interests:
A.E. filed a patent on some of the technoloies presented in this work.
MATERIALS AND METHODS
Animals
We used the following animals in the study: mixed gender CX3CR1GFP/+ (B6.129P-Cx3cr1tm1Litt/J,
Jackson Laboratory strain code: 005582), Thy1-GFPM , Thy1-YFPH23, Prox1-EGFP (Tg(Prox1-
EGFP)KY221Gsat/Mmucd, MMRRC strain code: 031006-UCD), VEGFR3-YFP, CX3CR1GFP/+ x
CCR2RFP/+ (B6.129(Cg)-Ccr2tm2.1Ifc/J, Jackson Laboratory strain code: 017586), LysM-EGFP
(Lyz2tm1.1Graf, MGI: 2654931), CD68-EGFP (C57BL/6-Tg(CD68-EGFP)1Drg/j), Jackson Laboratory
strain code: 026827). The animals were housed under a 12/12 hours light/dark cycle. The animal
experiments were conducted according to institutional guidelines: Klinikum der Universität München /
Ludwig Maximilian University of Munich and after approval of the Ethical Review Board of the
Government of Upper Bavaria (Regierung von Oberbayern, Munich, Germany) and the Animal
Experiments Council under the Danish Ministry of Environment and Food (2015-15-0201-00535) and
in accordance with the European directive 2010/63/EU for animal research. All data are reported
according to the ARRIVE criteria. Sample sizes were chosen based on prior experience with similar
models. Sample sizes are specified in figure legends. Within each strain, animals were randomly
selected.
11bioRxiv preprint first posted online Jul. 23, 2018; doi: http://dx.doi.org/10.1101/374785. The copyright holder for this preprint
(which was not peer-reviewed) is the author/funder, who has granted bioRxiv a license to display the preprint in perpetuity.
It is made available under a CC-BY-NC 4.0 International license.
Traumatic brain injury
Traumatic brain injury was performed using a Controlled Cortical Impact (CCI) device (Leica
Benchmark Stereotaxic Impactor, 39463923). 30 minutes before surgery, we administered Carprofen
(4 mg/kg) and Buprenorphin (0.05 mg/kg) to the animals via subcutaneous injection. Then,
anaesthesia was induced in animals with 4% isoflurane in N2O/O2 (70%/30%) mixture and afterwards
maintained with 1.5% isoflurane in the same mixture for the whole surgery. As soon as the animals
did not show any pedal reflex, they were placed in the associated stereotaxic apparatus and their body
temperature was kept at 37°C using a heating pad for the whole surgery procedure. Next, the scalp of
the animals was shaved, aseptically prepared by wiping with Octenisept (Schülke, 22580-A) as
disinfectant and the skin of the scalp was incised longitudinally between the occiput and forehead. We
identified the target area of the injury, which was the right somatosensory cortex, using the stereotaxic
frame (bregma coordinates: 2-mm posterior, 5-mm right lateral). The injury was then triggered via CCI
machine using the following parameters: impact speed: 6.9 m/s; impact duration: 400 ms and impact
depth: 2 mm. With these parameters, the injury resulted severe with cracks of the skull, bleeding and
exposed brain tissue. After the impact, the skin was sutured with metallic wound closure clips (VWR,
203-1000) and the animals were kept at 31°C in a recovery chamber (Mediheat, 34-0516) for at least
30 minutes until they recovered from the anesthesia. In the following days, animals were
subcutaneously injected with Carprofen (4 mg/kg) once every day for 4 days and sacrificed at > 1
month post injury by transcardial perfusion according to the ‘perfusion and tissue preparation’ section
below.
MCAO model
Experimental stroke was induced using the intraluminal filament model of middle cerebral artery (MCA)
occlusion for transient, focal brain ischemia. Mice were anesthetized with isoflurane delivered in a
mixture of 30% O2 and 70% N2O. A heat-blunted nylon suture (6/0) was inserted into the external
carotid artery and advanced until it obstructed the MCA together with the ligation of the common
carotid artery for 30 min. Regional cerebral blood flow (CBF, bregma coordinates: 2-mm posterior, 5-
mm lateral) was continuously recorded by transcranial laser Doppler flowmetry from the induction of
ischemia until 10 min after reperfusion. Following fMCAO, mice were placed in temperature-controlled
recovery cages for 2 h to prevent post-surgery hypothermia. For the survival period (3 days), the mice
were kept in their home cage with facilitated access to water and food. Sham-operated mice received
the same surgical procedure without insertion of the filament. Body temperature was maintained
throughout surgery using a feedback-controlled heating pad and kept constant (37.0 ± 0.5 °C).
Exclusion criteria were as follows: insufficient MCA occlusion (a reduction in blood flow to 15% of the
baseline value) and blood flow recovery >80% within 10 min of reperfusion. Mice were sacrificed at 3
days post injury by transcardial perfusion according to the ‘perfusion and tissue preparation’ section
below.
CM injection for meningeal vessel labeling
For the cisterna magna injections, mice (VEGFR3-YFP; 6 months old) were anesthetized with a
mixture of ketamine and xylazine (100 mg/kg; 10 mg/kg, respectively) via intraperitoneal (i.p.) injection.
Upon toe pinch reflexes ceased, mice were fixed in a stereotaxic frame by the zygomatic arch, with
the head slightly tilted to form an angle of 120° in relation to the body. The head and neck regions
were shaved to expose the neck muscles, which were bluntly dissected to expose the cisterna magna
(CM). Cannulas composed of a dental needle (SOPIRA® Carpule 30G 0.3 x 12mm; Kulzer; AA001)
and polyethylene tubing (0.024” OD x 0.011” ID; Scandidact; PE10-CL-500) were used to perform the
CM injections. A cannula filled with cerebrospinal fluid (CSF) tracer (2% ovalbumin 45 kDa – Alexa
Fluor 647 conjugated; Thermo Fisher Scientific, O34784, diluted in artificial CSF: 126 mM NaCl, 2.5
mM KCl, 1.25 mM NaH2PO4, 2 mM Mg2SO4, 2 mM CaCl2, 10 mM glucose, 26 mM NaHCO3; pH 7.4
when gassed with 95% O2 and 5% CO2) was inserted into the CM. With the aid of an injection pump
(LEGATO 130 Syringe pump, KD Scientific, 788130), 10 µl of CSF tracer was injected into the CM at
a rate of 1 µl/min. At the end of the injection, CSF tracer was allowed to circulate in the subarachnoid
and paravascular spaces for 1 hour. Mice were then transcardially perfused according to the ‘perfusion
12bioRxiv preprint first posted online Jul. 23, 2018; doi: http://dx.doi.org/10.1101/374785. The copyright holder for this preprint
(which was not peer-reviewed) is the author/funder, who has granted bioRxiv a license to display the preprint in perpetuity.
It is made available under a CC-BY-NC 4.0 International license.
and tissue preparation’ section below.
Spinal cord injury model
Mice were deeply anaesthetized by i.p. injection of a combination of midazolam (5 mg/kg body weight),
medetomidine (0.5 mg/kg) and fentanyl (0.05 mg/kg). The mid-thoracic spinal cord of anaesthetized
CD68-EGFP mice was surgically exposed by a dorsal laminectomy as previously described41. A
hemisection of the spinal cord was performed using fine-tip surgical scissors (F.S.T 15000-08 spring
scissor 2,5 mm cutting edge). Muscle tissue and skin were then sutured with a surgical thread (Ethilon
suture 6-0, 667H) and animals were allowed to recover on a heating pad. After 48 hours, mice were
transcardially perfused according to the ‘perfusion and tissue preparation’ section below.
Perfusion and tissue preparation
Mice were deeply anesthetized using a combination of midazolam, medetomidine and fentanyl (MMF)
(1ml/100g of body mass for mice; i.p.). As soon as the animals did not show any pedal reflex, they
were intracardially perfused with heparinized 0.1 M PBS (10 U/ml of Heparin, Ratiopharm; 100-125
mmHg pressure using a Leica Perfusion One system) for 5-10 minutes at room temperature until the
blood was washed out, followed by 4% paraformaldehyde (PFA) in 0.1 M PBS (pH 7.4) (Morphisto,
11762.01000) for 10-20 minutes Next, skin, optionally eyes, premaxilla and maxilla bones were
carefully removed and the palate of the animal was opened (without damaging the tissue beneath),
and the feces were gently washed out from the intestine with 0.1 M PBS through small cuts using a
syringe. Then, the bodies were post-fixed in 4% PFA for 1 day at 4 °C and later washed with 0.1 M
PBS for 10 minutes 3 times at room temperature. The whole-body nanoboosting procedure was
started immediately or whole mouse bodies were stored in PBS at 4 °C for up to 4 weeks or in PBS
containing 0.05% sodium azide (Sigma, 71290) for up to 6 months.
For the quantification of fluorescence signal, CX3CR1GFP/+ and Thy1-GFPM mice were perfused with
PBS and PFA as described above. Subsequently, brains from these animals were dissected out and
post-fixed in 4% PFA overnight at 4°C, washed with 0.1 M PBS for 10 minutes 3 times at room
temperature and kept in PBS plus 0.05% sodium azide up to 3 weeks.
Clearing of unboosted samples
For the quantification of fluorescence signal after clearing, without boosting, we followed the uDISCO
passive clearing protocol as described in Pan et al., 201619. In brief, dissected brains were placed in
5 ml tubes (Eppendorf, 0030 119.401) and covered with 4.5 ml of clearing solution. All incubation steps
were performed in a fume hood with gentle shaking or rotation, with the samples covered with
aluminum foil to keep them in dark. To clear the samples, we incubated them in a gradient of tert-
butanol (Sigma, 360538): 30 Vol%, 50 Vol%, 70 Vol%, 80 Vol%, 90 Vol%, 96% Vol% (in distilled
water), 100 Vol% twice at 35°C for 12 hours each step, followed by immersion in dichloromethane
DCM (Sigma, 270997) for 45-60 minutes at room temperature and finally incubated with the refractive
index matching solution BABB-D15 containing 15 parts BABB (benzyl alcohol + benzyl benzoate 1:2,
Sigma, 24122 and W213802), 1 part diphenyl ether (DPE) (Alfa Aesar, A15791) and 0.4% Vol vitamin
E (DL-alpha-tocopherol, Alfa Aesar, A17039), for at least 6 hours at room temperature until achieving
transparency.
vDISCO whole-body immunostaining, PI labeling and clearing
The following nanobodies and dyes were used for whole body immunostaining: Atto594 conjugated
anti RFP nanobooster (Chromotek, rba594-100), Atto647N conjugated anti GFP nanobooster
(Chromotek, gba647n-100), Atto488N conjugated anti GFP nanobooster (Chromotek, gba488-100),
Propidium iodide (PI, Sigma, P4864).
In order to remove remaining blood and heme after PFA perfusion, and to decalcify the bones, the
animals were subjected to perfusion with decolorization solution and decalcification solution before
immunostaining. The decolorization solution was made with 25-30 Vol% dilution of CUBIC reagent 15
13bioRxiv preprint first posted online Jul. 23, 2018; doi: http://dx.doi.org/10.1101/374785. The copyright holder for this preprint
(which was not peer-reviewed) is the author/funder, who has granted bioRxiv a license to display the preprint in perpetuity.
It is made available under a CC-BY-NC 4.0 International license.
in 0.1 M PBS. CUBIC reagent 1 was prepared with 25 wt% urea (Carl Roth, 3941.3), 25 wt%
N,N,N´,N´-tetrakis (2-hydroxypropyl)ethylenediamine (Sigma, 122262) and 15 wt% Triton X-100
(AppliChem, A4975,1000) in 0.1 M PBS. The decalcification solution consisted of 10 wt/Vol% EDTA
(Carl Roth, 1702922685) in 0.1 M PBS adjusting the pH to 8-9 with sodium hydroxide NaOH (Sigma,
71687).
The solutions for the immunolabeling pipeline were pumped inside the body of the animal by
transcardial-circulatory perfusion exploiting the same entry point hole into the heart created during the
PBS and PFA perfusion step (see above, perfusion and tissue preparation paragraph) and following
the procedure already described in Pan et al., 2016. In brief, the mouse body was placed in a 300 ml
glass chamber (Omnilab, 5163279) filled with 250-300 ml of appropriate solution, which covered the
body completely. Next, the transcardial-circulatory system was established involving a peristaltic pump
(ISMATEC, REGLO Digital MS-4/8 ISM 834; reference tubing, SC0266) keeping the pressure at 180-
230 mmHg (50-60 rpm). One channel from the pump, made by a single reference tube, was set for
circulation of the solution through the heart into the vasculature: one ending of the tube was connected
to the tip of a syringe (cut from a 1 ml syringe-Braun, 9166017V) which held the perfusion needle
(Leica, 39471024) and the other ending was immersed in the solution chamber where the animal was
placed. The perfusion needle pumped the appropriate solution into the mouse body, and the other
ending collected the solution exiting from the mouse body in order to recirculate the solution, pumping
it back into the animal. To fix the needle tip in place and to ensure extensive perfusion, we put a drop
of super glue (Pattex, PSK1C) at the level of the hole where the needle was inserted inside the heart.
Using the setting explained above, after post-fixation and PBS washing, the mice were first perfused
with 0.1 M PBS overnight at room temperature, then the animals were perfused with 250 ml of
decolorization solution for 2 days at room temperature, exchanging with fresh decolorization solution
every 6-12 hours until the solution turned from yellowish to clear and the spleen became lighter colour
(indicating that the blood heme was extracted). Then, they were perfused with 0.1 M PBS, washing
for 3 hours 3 times, followed by perfusion with 250 ml of decalcification solution for 2 days at room
temperature and again perfused/washed with 0.1 M PBS for 3 hours 3 times. After this, the animals
were perfused with 250 ml of permeabilization solution containing 1.5% goat serum (Gibco,
16210072), 0.5% Triton X-100, 0.5 mM of Methyl-beta-cyclodextrin (Sigma, 332615), 0.2% trans-1-
Acetyl-4-hydroxy-L-proline (Sigma, 441562) and 0.05% Sodium Azide (Sigma, 71290) in 0.1 M PBS
for half a day at room temperature. Subsequently, the perfusion proceeded further, connecting a 0.20
µm syringe filter (Sartorius, 16532) to the ending of the tube not holding the needle, in order to
efficiently prevent accumulation of dye aggregates into the sample. At the same time, from this step
we used an infrared lamp (Beuer, IL21) directed to the chamber to heat up the solution to 26-28°C.
With this setting, the animals were perfused for 6 days with 250 ml of the same permeabilization
solution containing 35 µl of nanobooster (stock concentration 0.5 – 1 mg/ml) (the amount of nanobody
was adjusted depending on the expected presence of fluorescent protein in the mouse body) and 290
µl of propidium iodide (stock concentration 1 mg/ml). Next, we removed the animals from the chamber
and with fine scissors we removed a tiny piece of skull from the back of the skull (above the cerebellum)
at the level of the occipital bone, and we placed the bodies in a 50 ml tube (Falcon, 352070), filled with
the same permeabilization solution, containing an extra 5 µl of nanobooster and incubated the tubes
at 37°C with gentle shaking for an additional 2-3 days of labeling. After that, the mice were placed
back in the perfusion system and labeling solution was washed out by perfusing with washing solution
(1.5% goat serum, 0.5% Triton X-100, 0.05% of sodium azide in 0.1 M PBS) for 3 hours per 3 times
at room temperature and 0.1 M PBS for 3 hours per 3 times at room temperature.
After the staining, the animals were cleared using a 3DISCO based passive whole-body clearing
protocol optimized for big samples. The mice were incubated at room temperature in dehydration and
clearing solutions inside a 300 ml glass chamber, kept with gentle rotation on top of a shaking rocker
(IKA, 2D digital) inside a fume hood. For dehydration, mice bodies were incubated in 200 ml of the
following gradient of tetrahydrofuran THF (Sigma, 186562) in distilled water (12 hours for each step):
50 Vol% THF, 70 Vol% THF, 80 Vol% THF, 100 Vol% THF and again 100 Vol% THF, followed by 3
14bioRxiv preprint first posted online Jul. 23, 2018; doi: http://dx.doi.org/10.1101/374785. The copyright holder for this preprint
(which was not peer-reviewed) is the author/funder, who has granted bioRxiv a license to display the preprint in perpetuity.
It is made available under a CC-BY-NC 4.0 International license.
hours in dichloromethane and finally in BABB. During all incubation steps, the glass chamber was
sealed with parafilm and covered with aluminum foil.
vDISCO whole-mount immunolabeling of individual organs
For the quantification of fluorescence signal after nanoboosting, dissected brains were stained using
the immunolabeling protocol for dissected organs: first the post-fixed brains were pretreated,
incubating them for 2 days at 37°C with gentle shaking in 4.5 ml of same solution used at the
permeabilization step (see paragraph above) (1.5% goat serum, 0.5% Triton X-100, 0.5 mM of Methyl-
beta-cyclodextrin, 0.2% trans-1-Acetyl-4-hydroxy-L-proline, 0.05% sodium azide in 0.1 M PBS).
Subsequently, the brains were incubated in 4.5 ml of this same permeabilization solution + Atto647N
conjugated anti GFP nanobooster (dilution 1:600) for 12-14 days at 37°C with gentle shaking, then
brains were washed for 2 hours 3 times and once overnight with the washing solution (1.5% goat
serum, 0.5% Triton X-100, 0.05% of sodium azide in 0.1 M PBS) at room temperature and in the end
washed for 2 hours 4 times with 0.1 M PBS at room temperature. The immunostained brains were
cleared with 3DISCO clearing: first they were put in the Eppendorf 5 ml tubes and then incubated at
room temperature with gentle shaking in 4.5 ml of the following gradient of THF in distilled water (2
hours for each step): 50 Vol% THF, 70 Vol% THF, 80 Vol% THF, 100 Vol% THF and overnight 100
Vol% THF; after dehydration, the samples were incubated for 1 hour in dichloromethane, and finally
in BABB until transparency. During all the clearing steps, the tubes were wrapped with aluminum foil
to keep them in dark.
Light-sheet microscopy imaging
Single plane illuminated (light-sheet) image stacks were acquired using an Ultramicroscope II
(LaVision BioTec), featuring an axial resolution of 4 μm with following filter sets: ex 470/40 nm, em
535/50 nm; ex 545/25 nm, em 605/70 nm; ex 560/30 nm, em 609/54 nm; ex 580/25 nm, em 625/30
nm; ex 640/40 nm, em 690/50 nm. For low magnification-whole-body imaging of the Thy1-GFPM
mouse, we used a 1x Olympus air objective (Olympus MV PLAPO 1x/0.25 NA [WD = 65mm]) coupled
to an Olympus MVX10 zoom body, which provided zoom-out and -in ranging from 0.63x up to 6.3x.
Using 1x objective and 0.63x of zoom, we imaged a field of view of 2 x 2.5 cm, covering the entire
width of the mouse body. Tile scans with 60% overlap along the longitudinal y-axis of the mouse body
were obtained from ventral and dorsal surfaces up to 13 mm in depth, covering the entire volume of
the body using a z-step of 8 µm. Exposure time was 120 ms, laser power was adjusted depending on
the intensity of the fluorescent signal (in order to never reach the saturation) and the light-sheet width
was kept at maximum. After tile imaging of the sample within the entire field of view, already scanned
regions were cut using a thin motorized dental blade (0.2 mm) (Dremel 8200) for further imaging. After
low magnification imaging of the whole body, a forelimb of the Thy1-GFPM animal was imaged with a
2x objective (Olympus MVPLAPO2XC/0.5 NA [WD = 6 mm]) coupled with the same Olympus MVX10
zoom body at zoom magnification 1.6x. Moreover, the same 2x objective was used to perform high
magnification imaging of specific body regions (e.g back of the animal at the level of lumbar vertebra
or the head). Individual organs (including brain, lungs, intestine and thymus) were imaged individually
using high magnification objectives: 2x objective (Olympus MVPLAPO2XC/0.5 NA [WD = 6 mm])
coupled with the same Olympus MVX10 zoom body, 4x objective (Olympus XLFLUOR 4x
corrected/0.28 NA [WD = 10 mm]), 25x objective (Olympus XLPLN 25x/0.95 NA [WD 4mm]) and 20x
objective (Zeiss 20x Clr Plan-Neofluar/0.1 NA [WD 4 = mm]) coupled to an Olympus revolving zoom
body unit (U-TVCAC) kept at 1x. High magnification tile scans were acquired using 10-30% overlap
and the light-sheet width was reduced to obtain maximum illumination in the field.
Reconstructions of whole-mouse body scans
We acquired light-sheet microscope stacks using ImSpector (Version 5.295, LaVision BioTec GmbH)
as 16-bit grayscale TIFF images for each channel separately. In each pair of neighbouring stacks,
alignment was done by manually selecting 3 to 4 anatomic landmarks from the overlapping regions,
then the stitching was done sequentially with the Scope Fusion module of the Vision4D (Version 2.12.6
x64, Arivis AG) software. Landmarks were mainly chosen from the skeletal bones or fewer from the
15bioRxiv preprint first posted online Jul. 23, 2018; doi: http://dx.doi.org/10.1101/374785. The copyright holder for this preprint
(which was not peer-reviewed) is the author/funder, who has granted bioRxiv a license to display the preprint in perpetuity.
It is made available under a CC-BY-NC 4.0 International license.
neuronal structures based on visual inspection of the anatomical features. After completing the 3D
reconstructions, the data visualization was done with Amira (Version 6.3.0, FEI Visualization Sciences
Group), Imaris (Version 9.1, Bitplane AG) and Vision4D in both volumetric and maximum intensity
projection color mapping. Depth coding was done using Temporal-Color Code plugin in Fiji.
Neuron tracing
For automated neuron tracing in our light-sheet datasets obtained with Zeiss 20x Clr Plan-Neofluar/0.1
NA [WD 4 = mm] objective, we used NeuroGPS-Tree algorithm24. The NeuroGPS-Tree was developed
for tracing relatively small volumes of confocal microscopy data, therefore, we initially reduced the file
size to under 1 GB (approximate maximum data size for NeuroGPS-Tree computation) by using Fiji
scale function. Due to high signal intensity discrepancy between soma and neurites, we next
processed the data with a custom-made macro in Fiji (available upon request), which consisted of
background removal, pseudo background correction, noise filtering and sharpening. Next, the pre-
processed data was loaded and analysed first in NeuroGPS for soma detection and later in
NeuroGPS-Tree for neurite detection (both steps are part of the same algorithm package). The best
parameters of soma and neurite detection were chosen following the original publication. To quantify
the features (such as number and total length of neurites per cell) of these detected neuronal cells,
we used Amira software: we chose the 10 neurons with the biggest file size per each group and we
analyzed them using the Spatial Graph Statistics function of the software.
Quantifications
Analysis of fluorescence signal profiles from light-sheet images:
The fluorescence signal profiles from each channel (excitation 470 nm, 560 nm and 647 nm) were
plotted in the same z-stack and normalized as percentage over the maximum peak using Fiji.
(Supplementary Fig.1).
To compare vDISCO boosted vs. unboosted protocols and consequently the reduction of the
background and the improvement of the signal over background ratio in far-red and near far-red
channels, we analyzed neurons and axonal bundles expressing EGFP imaged with excitation at 470
nm, and neurons and axonal bundles labelled with anti-EGFP nanobody conjugated with Atto647N
imaged with excitation at 640 nm at the same anatomic region (n=9 neuronal structures per each
experimental group which consisted of 3 animals per each imaging modality). The signal profile was
analyzed in Fiji and measured from a defined straight line covering the neuronal structure and
surrounding tissue background and the normalized plots of the signal profile (Fig. 1k) were calculated
by normalizing the plots of neuronal structures obtained as described above over the average signal
intensity of the respective surrounding background. Each experimental group consisted of 3 animals
and per each animal at the same anatomic region we plotted 3 profiles.
Fluorescence level:
Fluorescence level quantification was expressed as a signal-to-background ratio and was calculated
using Fiji19 at the following time points: 0, 2, 3, 4 and half, 5 and half, 12 and 18 months after
nanoboosting (Fig. 1p,q). Each 4x light-sheet microscopy brain scan was taken with the same imaging
parameters, and an image in Tiff format of the same anatomic region for all the samples was
quantified. The mean value of the background for each image was obtained by averaging the
background values of 12-40 regions from equally sized areas of the image in regions of the sample
without signal. To calculate the mean value of the signal per each image, we used the threshold
function of the software: the threshold was adjusted to consider the fluorescence signal visible in the
image. After adjusting the threshold, only the sharp signal from specific cellular structures was
analyzed per image. To this end, we used Fiji’s “analyse particles” function to measure the signal
intensity only of particles sized between 5-10 and 100-150 pixels (visible fluorescent cells), and
calculated the average value from all the particles. Next, this value was divided by the mean value of
the background of the respective image, obtaining the fluorescence level over the background. The
corresponding images, visually showing the preservation of signal over time in relation to the
16bioRxiv preprint first posted online Jul. 23, 2018; doi: http://dx.doi.org/10.1101/374785. The copyright holder for this preprint
(which was not peer-reviewed) is the author/funder, who has granted bioRxiv a license to display the preprint in perpetuity.
It is made available under a CC-BY-NC 4.0 International license.
respective fluorescence levels, were processed using Enhance Local Contrast (CLAHE) function in
Fiji to increase the contrast of fluorescent cells in the tissue.
ClearMap
To quantify microglia distribution we used ClearMap26. Since the script was originally developed for
quantification of the cFos+ cells, to comply with offered method, we did the following pre-processing
steps on our microglia data using Fiji before ClearMap:
• Background equalization to homogenize intensity distribution and appearance of the microglia
cells over different regions of the brain, using pseudo flat-field correction function from Bio-
Voxxel toolbox.
• Convoluted background removal, to remove all particles bigger than relevant cells. This was
done with the median option in Bio-Voxxel toolbox.
• 2D median filter to remove remaining noise after background removal. The filter radius was
chosen to ensure the removal of all particles smaller than microglia cells.
• Unshapen mask to amplify the high-frequency components of a signal and increase overall
accuracy of the cell detection algorithm of ClearMap.
After pre-processing, ClearMap was applied by following the original publication and considering the
threshold levels that we obtained from the pre-processing steps. As soon as the quantification was
completed, the data was exported as excel file for further analysis. For example, the cellular density
per each brain region was obtained considering the absolute number of cells detected by ClearMap
and the volume of that specific brain region, which was calculated using a custom script (available
upon request) based on ClearMap (Elastix registration).
Quantification of peripheral neuronal degeneration in acute brain injury
Peripheral neuronal degeneration in TBI animals versus unlesioned control animals was assessed
considering the complexity of axonal ramifications that projected from the left cervical and thoracic
vertebra to the left muscles of the back at the level of the torso of the mouse, including the left
spinotrapezius and latissimus dorsi. The complexity was expressed as number of axonal endpoints
(nerve terminals that appear as button-like shape (See Fig. 3) over the total length of axonal
ramifications that were protruding from a main branch. To calculate this index, first a 3x3 tile z-stacks
of this anatomic region was taken from the animals by light-sheet microscopy using the 2x objective
described in “light-sheet microscopy imaging section” (Olympus MVPLAPO2XC/0.5 NA objective
coupled with the Olympus MVX10 zoom body) with a total magnification of 5x, in order to have enough
resolution to manually trace the axonal ramifications and axonal end-feet. Then, the analysis was done
over the max intensity projections of the tile scans with Fiji software. To measure the length of the
ramifications, we used the “free hand line” function and the “ROI manager tool” of Fiji, in order to
record all the traced axonal ramifications of interest, which were coming from a main branch; later we
calculated the sum of the length of all of the recorded ramifications with “measure” function of Fiji. To
count the nerve terminals, we used the “point tool” function and the same “ROI manager tool” in order
to record all the visible axonal endpoints protruding from the traced ramifications. The analysis was
performed over 2-4 branches from this same anatomic region per each animal, considering 3 animals
per each experimental group.
Statistical analysis
Data are presented as mean ± s.d. The data distribution in each experiment was checked for normality
using Shapiro-Wilk Test. P values were calculated using two tailed unpaired t-test to compare data
between two groups. A p valueYou can also read


