Tissue-resident natural killer (NK) cells are cell lineages distinct from thymic and conventional splenic NK cells
←
→
Page content transcription
If your browser does not render page correctly, please read the page content below
RESEARCH ARTICLE
           elifesciences.org

                                      Tissue-resident natural killer (NK) cells are
                                      cell lineages distinct from thymic and
                                      conventional splenic NK cells
                                      Dorothy K Sojka1, Beatrice Plougastel-Douglas1, Liping Yang1, Melissa A Pak-Wittel1,
                                      Maxim N Artyomov2, Yulia Ivanova2, Chao Zhong3, Julie M Chase1, Paul B Rothman4,
                                      Jenny Yu1, Joan K Riley5, Jinfang Zhu3, Zhigang Tian6,7, Wayne M Yokoyama1,8*
                                      1
                                       Rheumatology Division, Washington University School of Medicine, St. Louis,
                                      United States; 2Department of Pathology and Immunology, Washington University
                                      School of Medicine, St. Louis, United States; 3Molecular and Cellular Immunoregulation
                                      Unit, Laboratory of Immunology, National Institute of Allergy and Infectious Diseases,
                                      National Institutes of Health, Bethesda, United States; 4The Johns Hopkins University
                                      School of Medicine, Baltimore, United States; 5Obstetrics and Gynecology Division,
                                      Washington University School of Medicine, St. Louis, United States; 6Department
                                      of Immunology, School of Life Sciences, University of Science and Technology China,
                                      Hefei, China; 7Hefei National Laboratory for Physical Sciences at the Microscale,
                                      Hefei, China; 8Howard Hughes Medical Institute, Washington University School of
                                      Medicine, St. Louis, United States

                                      Abstract Natural killer (NK) cells belong to the innate immune system; they can control virus
                                      infections and developing tumors by cytotoxicity and producing inflammatory cytokines. Most
                                      studies of mouse NK cells, however, have focused on conventional NK (cNK) cells in the spleen.
                                      Recently, we described two populations of liver NK cells, tissue-resident NK (trNK) cells and
                                      those resembling splenic cNK cells. However, their lineage relationship was unclear; trNK cells
*For correspondence:                  could be developing cNK cells, related to thymic NK cells, or a lineage distinct from both cNK
yokoyama@dom.wustl.edu
                                      and thymic NK cells. Herein we used detailed transcriptomic, flow cytometric, and functional
Competing interests: The              analysis and transcription factor-deficient mice to determine that liver trNK cells form a distinct
authors declare that no               lineage from cNK and thymic NK cells. Taken together with analysis of trNK cells in other tissues,
competing interests exist.            there are at least four distinct lineages of NK cells: cNK, thymic, liver (and skin) trNK, and uterine
Funding: See page 18                  trNK cells.
                                      DOI: 10.7554/eLife.01659.001
Received: 09 October 2013
Accepted: 02 March 2014
Published: 08 April 2014

Reviewing editor: Diane Mathis,
                                      Introduction
Harvard Medical School, United
                                      Immune cells migrate throughout the body where they search tissues for pathological events induced
States                                by invading pathogens or emerging tumors, for example. Upon encounter with these events, circu-
                                      lating immune cells stop and respond in collaboration with yet other immune cells, often in organized
    This is an open-access article,   lymphoid tissues. The subsequent orchestrated host immune response controls the pathological pro-
free of all copyright, and may be
                                      cess by directing relevant immune cells to the damaged tissue. In contrast to circulating immune cells
freely reproduced, distributed,
                                      are tissue-resident immune cells which already reside in selected organs where they appear to be
transmitted, modified, built
upon, or otherwise used by
                                      poised to deliver immune responses. However, how tissue-resident immune cells contribute to host
anyone for any lawful purpose.        responses is less well understood and will be aided by identifying factors that distinguish circulating
The work is made available under      and tissue-resident immune cells.
the Creative Commons CC0                  Natural killer (NK) cells are components of the innate immune system (Yokoyama, 2013). Initially
public domain dedication.             described on the basis of their inherent capacity to kill tumor cells without prior sensitization, NK cells

Sojka et al. eLife 2014;3:e01659. DOI: 10.7554/eLife.01659                                                                                1 of 21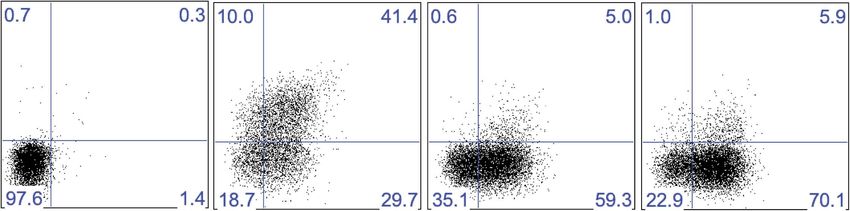
Research article                                                                                                      Immunology

                                   eLife digest Our immune system has white blood cells that migrate throughout the body in
                                   search of invading microbes or diseased and damaged cells. When these events are encountered,
                                   the white blood cells move into the affected tissue and launch an immune response to eliminate the
                                   threat.
                                       Natural killer cells are white blood cells that kill cells that are infected with viruses or are
                                   cancerous. Most of what is known about conventional natural killer cells is derived from studying
                                   the spleen, which filters the blood and contains many immune cells. Natural killer cells also circulate
                                   around the body or are found within other tissues, and it was thought that both types of cells were
                                   either the same, or that one type could develop into the other. However, the thymus—an organ that
                                   is another source of white blood cells—contains a sub-population of natural killer cells that are
                                   distinct from the conventional splenic natural killer cells. Furthermore, recent work revealed the
                                   existence of two types of natural killer cells within the liver: some of these cells were similar to the
                                   conventional splenic natural killer cells that circulate throughout the body, while others appeared to
                                   be ‘tissue-resident’ natural killer cells that were poised to deliver an immune response.
                                       Now Sojka et al. show that the tissue-resident natural killer cells found in the liver are a distinct
                                   lineage of cells. These cells mature independently from the conventional natural killer cells found in
                                   the spleen, and the natural killer cells found in the thymus. Moreover, the skin contains tissue-
                                   resident natural killer cells similar to those in the liver; whilst natural killer cells that had previously
                                   been discovered in the uterus were shown to contain a fourth distinct tissue-resident lineage.
                                       The work of Sojka et al. will encourage a full re-evaluation of the roles played by natural killer
                                   cells to determine which populations of these cells are responsible for implementing immune
                                   responses. Furthermore, a more thorough understanding of how tissue-resident natural killer cells
                                   function to eliminate diseased or damaged cells, such as cancerous cells, could also contribute to
                                   future efforts to develop new anti-cancer treatments.
                                   DOI: 10.7554/eLife.01659.002

                                   are now known to participate in a wide variety of immune responses, such as early control of viral
                                   infections. In addition, they can respond to pro-inflammatory cytokines by producing yet other
                                   inflammatory cytokines, such as interferon-γ (IFNγ), their signature cytokine that can influence adap-
                                   tive immune cells.
                                       NK cells require IL-15 and its cognate receptor, IL-15R, for development (Cao et al., 1995; DiSanto
                                   et al., 1995; Suzuki et al., 1997; Lodolce et al., 1998; Kennedy et al., 2000). In knockout mice
                                   lacking IL-15 or any chain of the trimeric IL-15R (α, β, γ), splenic NK cells are absent. The development
                                   of splenic NK cells is thought to occur largely if not exclusively in the bone marrow (BM) where cells
                                   committed to the NK cell lineage undergo a series of putative developmental stages, characterized by
                                   acquisition and loss of various surface markers, including cytokine receptors, NK cell receptors, and
                                   integrins (Kim et al., 2002; Yokoyama et al., 2004; Di Santo, 2006). Out in the periphery, mature
                                   splenic NK cells can be further distinguished by differential expression of CD11b and CD27 (Kim
                                   et al., 2002; Hayakawa and Smyth, 2006). Thus, conventional splenic NK cells display developmental
                                   markers associated with maturation.
                                       NK cells require certain transcription factors for development (Hesslein and Lanier, 2011), in partic-
                                   ular NFIL3 (E4BP4), described as the NK cell-specification factor (Di Santo, 2009). Mice lacking NFIL3
                                   have essentially no splenic NK cells though other organs were not thoroughly examined (Gascoyne
                                   et al., 2009; Kamizono et al., 2009; Kashiwada et al., 2010). The related t-box transcription factors,
                                   Tbet (Tbx21) and eomesodermin (Eomes), play more complex roles in NK cell development (Townsend
                                   et al., 2004; Gordon et al., 2012). In the absence of Tbet, splenic NK cells display an immature phe-
                                   notype, and a subpopulation of NK cells in the liver is absent, consistent with overlapping and coop-
                                   erative roles of Tbet and Eomes in NK cell development. Alternatively, Tbet may direct the development
                                   of a separate lineage of NK cells. Current data cannot definitively distinguish between these possibili-
                                   ties for the role of Tbet and Eomes in NK cell development.
                                       Classically studied in the mouse spleen and expressing the NK1.1 antigen on CD3ε-negative cells,
                                   NK cells are also present in solid organs, such as the thymus, uterus, and liver (Yokoyama, 2013). Like
                                   the conventional NK (cNK) cells in the spleen, thymic NK cells are cytotoxic and require IL-15 but they

Sojka et al. eLife 2014;3:e01659. DOI: 10.7554/eLife.01659                                                                              2 of 21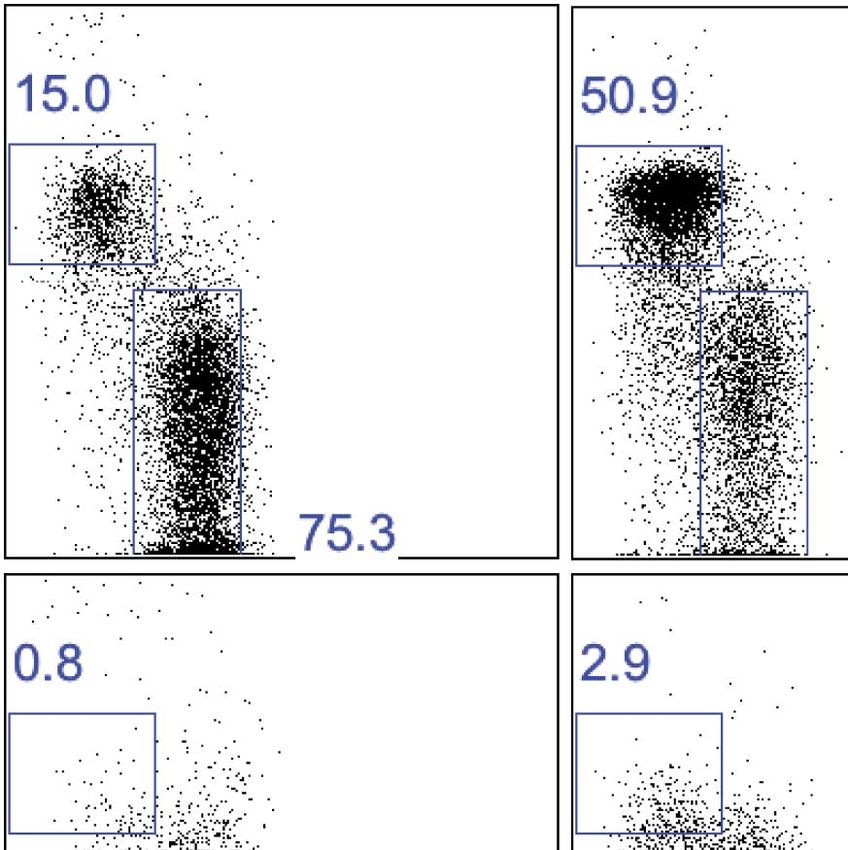
Research article                                                                                                     Immunology

                                   differ from cNK cells by their characteristic expression of CD127 (IL-7 receptor α) and requirement for
                                   a thymus where they can arise from early thymocyte precursors (Vosshenrich et al., 2006; Ribeiro
                                   et al., 2010; Vargas et al., 2011). Furthermore, thymic NK cells uniquely require the transcription
                                   factor GATA-3 for development (Vosshenrich et al., 2006). NK cells are normally present in the non-
                                   pregnant uterus (Parr et al., 1991; Yadi et al., 2008; Mallidi et al., 2009) but have been mostly stud-
                                   ied after they expand at the site of embryo implantation during pregnancy (Moffett and Loke, 2006;
                                   Hatta et al., 2012). Like cNK cells, uterine NK (uNK) cells require IL-15 for development (Ashkar et al.,
                                   2003). In addition, they are cytotoxic as they express perforin and granzymes, and they produce IFNγ
                                   (Parr et al., 1990; Ashkar et al., 2000). Interestingly, however, uNK cells appear relatively normal
                                   in Tbet-deficient mice (Tayade et al., 2005) and recent studies suggest that a subset of uNK cells
                                   can be distinguished from cNK cells (Yadi et al., 2008). Thus, NK cell subsets can be identified in
                                   different tissues that appear to be distinguishable from cNK cells.
                                       In the liver, we recently showed that there are two populations of NK cells, distinguished by
                                   mutually exclusive expression of CD49a and DX5 (Peng et al., 2013). Phenotypically, CD49a−DX5+
                                   are very similar to splenic cNK cells whereas CD49a+ DX5– are unlike splenic cNK cells. In parabiotic
                                   mice, the host liver contains CD49a+ DX5− NK cells of host origin and circulating CD49a−DX5+ NK
                                   cells derived from both host and the other parabiont, indicating that the CD49a+ DX5− cells are tissue-
                                   resident NK (trNK) cells whereas the CD49a−DX5+ cells are cNK cells. The trNK cells appear similar
                                   to immature cNK cells because they express similar markers (NK1.1, NKp46) but low levels of CD11b,
                                   are DX5−, and display high levels of TNF-related apoptosis-inducing ligand (TRAIL) (Kim et al., 2002;
                                   Di Santo , 2006; Peng et al., 2013). However, the liver trNK cells appear to be distinct from imma-
                                   ture BM cNK cells because they are cytotoxic and express CD49a. Nonetheless, the liver trNK cells
                                   could represent an intermediate cell stage in the development of mature splenic cNK cells from NK
                                   cell precursors.
                                       Consistent with this possible developmental intermediate stage, there is a complete absence of
                                   TRAIL+ NK cells in the livers of Tbet-deficient mice (Gordon et al., 2012). Importantly, this analysis was
                                   done before the CD49a+ DX5− trNK cells in the liver were described. Therefore, while the subset of
                                   TRAIL+ liver NK cells lacking in Tbet-deficient mice could represent a failure of maturation of cNK cells,
                                   an alternative interpretation of these results is that there may be two different NK cell lineages, one of
                                   which is completely Tbet-dependent.
                                       The current data therefore suggest that there are three possible origins of the liver trNK cells.
                                   (1) They could be related to thymic NK cells because GATA-3-deficient NK cells are defective in
                                   homing to the liver (Samson et al., 2003). (2) They could represent an intermediate stage in the
                                   development of NK cell precursors into mature splenic NK cells. (3) They could represent an alter-
                                   native NK cell lineage, distinct from both cNK and thymic NK cells. If these relationships can be
                                   resolved, it will then be important to determine how liver trNK cells are related to other trNK cells,
                                   such as uNK cells, and to the expanding list of innate lymphoid cells (ILCs) (Spits and Cupedo,
                                   2012; Spits et al., 2013).
                                       Herein we examined the liver trNK cells in detail with respect to thymic NK, splenic cNK, and trNK
                                   cells in other organs. Based on phenotypic characteristics and transcription factor requirements, our
                                   studies support the presence of at least four populations of NK cells: cNK (spleen and circulating),
                                   thymic, liver (and skin) trNK cells, and uNK cells. Furthermore, these studies indicate that trNK cells can
                                   be distinguished from each other and from ILCs.

                                   Results
                                   CD49a+DX5− trNK cells in the liver are distinct from CD127+ thymic NK
                                   cells
                                   Thymic NK cells require GATA-3 (Vosshenrich et al., 2006), and GATA-3-deficient NK cells have a
                                   defect in liver migration and IFNγ production (Samson et al., 2003), raising the possibility that the
                                   liver trNK cells may be related to thymic CD127+ NK cells. However, as compared to thymic NK cells,
                                   liver trNK (CD49a+ DX5−) cells did not clearly express the prototypic thymic NK cell marker, CD127
                                   (Figure 1A). To more definitively determine the relationship between these NK cell subsets, we exam-
                                   ined athymic nude mice (Foxn1−/−) which lack thymic NK cells but possess liver trNK cells at a some-
                                   what higher percentage when compared to wildtype (WT) controls (Figure 1B,C). Also, liver trNK
                                   cell numbers are preserved or higher in nude mice (Figure 1D). In addition, we examined mice with

Sojka et al. eLife 2014;3:e01659. DOI: 10.7554/eLife.01659                                                                             3 of 21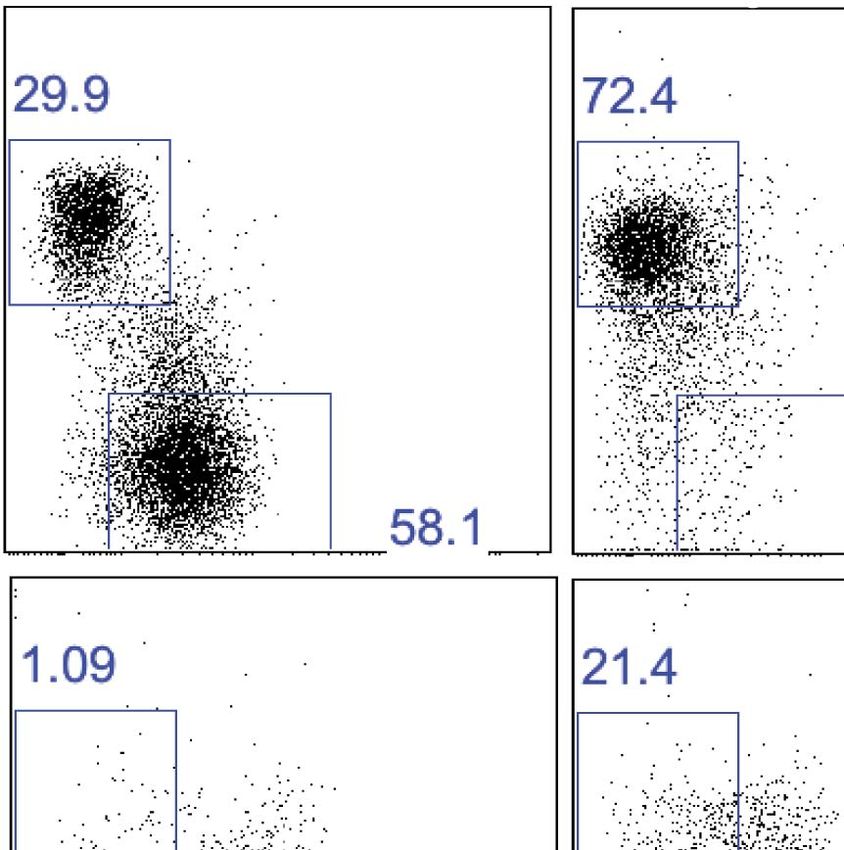
Research article                                                                                                              Immunology

Figure 1. CD49a+ DX5− trNK cells in the liver are distinct from the CD127+ thymic NK cells. (A) CD127 is poorly expressed on liver trNK cells. Thymi and
livers were isolated from WT C57BL/6NCr mice, stained, and flow cytometry was performed. The histogram displays the expression level of CD127 on
thymic NK cells and CD49a+DX5− and CD49a−DX5+ NK cells in the liver. Gated on live CD3−CD19−NK1.1+ cells. (B–D) Liver trNK cells are present in nude
mice. Spleens and livers were isolated from WT C57BL/6NCr and Foxn1−/− mice, stained, and flow cytometry performed. The dot plots (B) were gated
on live CD3−CD19−NK1.1+ cells and display the percentage expressing CD49a and DX5 in each mouse strain in the liver and spleen, as indicated.
Stacked bar graphs represent the percentage (C) and total number (D) of CD3−CD19−NK1.1+ cells that express CD49a and DX5 in the liver and spleen of
the WT and Foxn1−/− mice. Experiments were performed three independent times. (E) Liver trNK cells are present in GATA-3 conditional-deficient mice.
Spleens and livers were isolated from WT and Gata3fl/fl-Vav-Cre mice, stained, and flow cytometry was performed. The dot plots were gated on live
CD3−CD19−NK1.1+ cells and display the percentage expressing CD49a and DX5 in each mouse strain in the liver (top panels) and the spleen (bottom
panels). Dot plots represent one of two independent experiments performed. (F) Thymic NK cells are absent in Gata3fl/fl-Vav-Cre mice. Cells from the
thymi of WT and Gata3fl/fl-Vav-Cre mice were isolated, stained, and flow cytometry performed. The histogram displays the expression level of CD127
on thymic NK cells gated on live CD3−CD19−NK1.1+ cells. Histogram represents one of two independent experiments performed.
DOI: 10.7554/eLife.01659.003

                                     hematopoietic cell deficiency of GATA-3 due to expression of Cre under control of Vav which is
                                     expressed in all hematopoietic cells. The liver trNK cells from Gata3fl/fl-Vav-Cre mice were present
                                     (Figure 1E) whereas CD127+ thymic NK cells were absent in these mice (Figure 1F), as previously shown
                                     (Vosshenrich et al., 2006). Taken together, these data indicate that the trNK cells from the liver develop
                                     independent of the thymus or GATA-3, and can be clearly distinguished from thymic NK cells.

Sojka et al. eLife 2014;3:e01659. DOI: 10.7554/eLife.01659                                                                                       4 of 21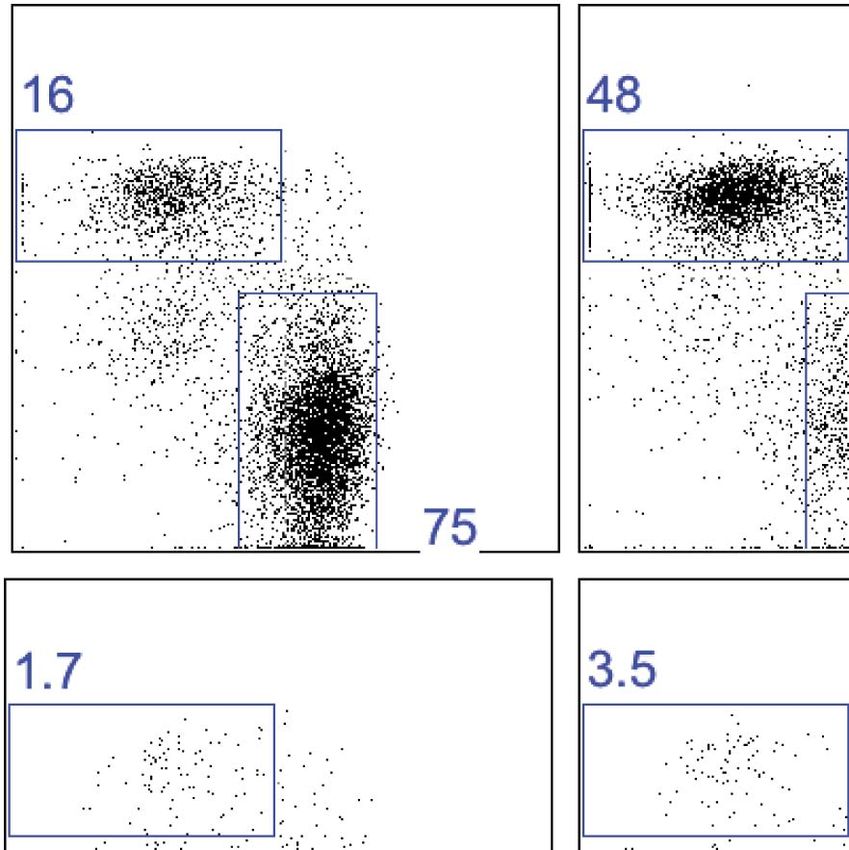
Research article Immunology
Distinct lineages of NK cells suggested by RNA-seq analysis
To further define the molecular similarities and differences between trNK cells in the liver, and circu-
lating liver and splenic cNK cells, we performed RNA deep sequencing (RNA-seq) of sorted NK cells
from Rag1−/− mice. Basic hierarchical clustering of the three populations revealed that liver trNK cells
are distinct from the liver and splenic cNK cells, which in turn, are more closely related to each other
than to liver trNK cells (Figure 2A). (A higher resolution figure displaying genes most differentially
expressed on liver trNK cells is shown in Figure 2—figure supplement 1.) Liver trNK cells could
be dissimilar from liver and splenic cNK cells perhaps due to their ‘immature’ phenotype, that is,
CD27+CD11blow (Figure 2B) and TRAIL+ (Figure 2C). To further explore this possibility, we obtained
transcriptome RNA-seq profiles from ‘immature’ bone marrow (BM) CD49a+DX5− and CD49a−DX5+
NK cell samples and extracted CD49a+DX5− and CD49a−DX5+-specific signatures. When we com-
pared the levels of genes specific to immature CD49a+DX5− NK cell in the BM (Supplementary file 1)
to levels of these genes in the other cell subsets, we found that the CD49a+DX5– cells in the liver
did not display this cell-type specific pattern (Figure 2D). Since there was some variability in the
relative expression levels of individual genes, further examination was performed by gene set enrich-
ment analysis (GSEA) in which the genes differentially expressed in the DX5− BM subset was compared
to the other NK cell subsets and plotted (Figure 2—figure supplement 2). Similar analysis was done
for genes differentially expressed in the DX5+ BM subset. These relative comparisons to the DX5− sub-
sets showed that the CD49a−DX5+ subsets in BM, liver and spleen were similar to each other (p=0.01).
However, the CD49a+DX5− BM NK cells and liver CD49a+DX5− trNK cells were dissimilar (p=0.5)
(Figure 2—figure supplement 2). Taken together with our previous analysis with a much more limited
panel of cell surface markers (Peng et al., 2013), these transcriptome data strongly suggest that the
trNK cells in the liver are not a population of immature NK cells that are transitioning to mature cNK
cells rather they represent a separate lineage of NK cells and indicate the CD49a−DX5+ subsets in BM,
liver, and spleen likely represent the same recirculating population of cNK cells.
Liver trNK cells are phenotypically distinct from cNK cells
To further analyze the similarities and differences between the NK cells of interest with greater precision,
we examined their detailed phenotypes by flow cytometry. First, we examined the expressed repertoire
of Ly49 receptors which are stably expressed on peripheral NK cells. The liver trNK cells express Ly49A,
C/I, I, F, and G2 at much lower frequencies than cNK cells from both the liver and spleen (Figure 3A,B).
Indeed, some receptors, such as the Ly49D and Ly49H activation receptors, are not expressed on trNK
cells. However the frequencies of liver trNK cells expressing Ly49E (Ly49EF+ but Ly49F−) and NKG2A are
much higher than liver and splenic cNK cells. In addition, the liver trNK cells appear larger and more
granular by scatter parameters when compared to the liver and splenic cNK cells (Figure 3C). Since these
parameters are associated with activated cNK cells, we examined expression of other activation mark-
ers. In naïve mice, the liver trNK cells express higher levels of CD69, CD44, CD160 and do not express
CD62L as compared to the cNK cells in the liver and spleen, consistent with a more activated state.
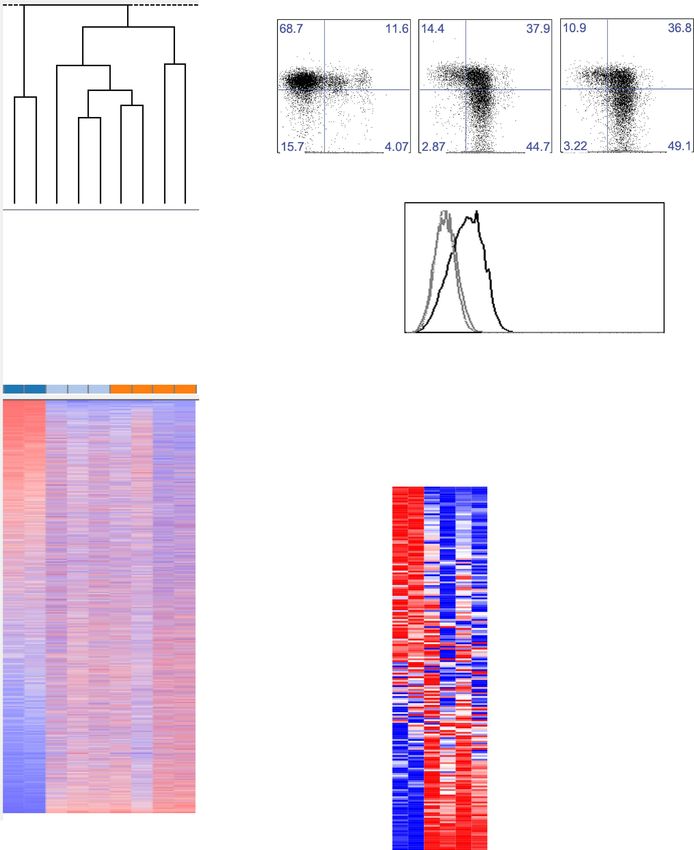
To assess the cytokine profile of the liver trNK cells, we stimulated total liver lymphocytes with PMA
and ionomycin and measured cytokine production (Figure 4A–C). The liver trNK cells specifically made
easily detectable tumor necrosis factor-α (TNFα) and granulocyte macrophage colony-stimulating
factor (GM-CSF) while liver and splenic cNK cells produced these cytokines at much lower levels, if at
all (Figure 4A). By contrast, the liver trNK cells made similar amounts of interferon-γ (IFNγ) when com-
pared to liver and splenic cNK cells. Interestingly when we analyzed IFNγ and TNFα simultaneously, we
found a significant proportion of the liver trNK cells were IFNγ+TNFα+ double producers (Figure 4B,C),
a population essentially absent among the cNK cells from the liver and spleen. Finally, we examined
the responses of liver trNK cells to YAC-1 targets (Figure 4D). Although both trNK and cNK cells
showed degranulation, as evidenced by CD107a expression, the degranulating liver trNK cells also
produced TNFα that was rarely seen among the responding cNK cells. Thus, liver trNK cells display
phenotypic differences from liver and spleen cNK cells whereas both cNK cell populations are similar,
confirming and extending the transcriptome analysis.
Liver trNK cells have differential transcription factor requirements than
cNK cells
We analyzed liver trNK cells in IL-15Rα-deficient mice which have a deficiency in splenic cNK cells
(Lodolce et al., 1998). The development of all NK1.1+ CD3− cells was negatively impacted by the
Sojka et al. eLife 2014;3:e01659. DOI: 10.7554/eLife.01659 5 of 21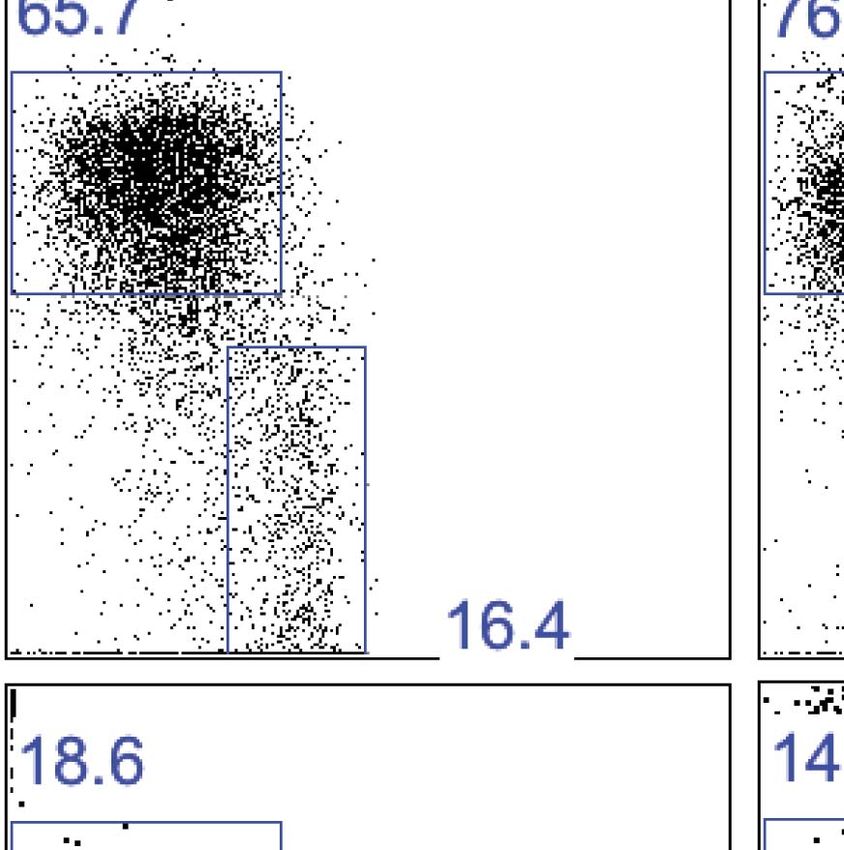
Research article                                                                                                            Immunology

                                   Figure 2. Distinct lineages of NK cells suggested by RNA-seq analysis. (A) Heat map showing cluster analysis
                                   of the entire gene set between the liver trNK cells and the cNK cells from the liver and spleen. We obtained
                                   expression profiles from sorted CD49a+DX5− NK cells in the liver and CD49a−DX5+ cNK cells in the liver and
                                   spleen using the same small input RNA-seq approach. (For a heat map of a smaller number of genes highly
                                   expressed in liver trNK cells, see Figure 2—figure supplement 1.) (B) The trNK cells in liver display an ‘immature’
                                   phenotype by flow cytometry. Cells from the liver and spleen were isolated, stained, and flow cytometry was
                                   performed. Dot plots were gated on live CD3−CD19−NK1.1+ cells and percentages in each dot plot represent
                                   the percentages of the subpopulations, CD49a+DX5− cells in the liver and CD49a−DX5+ in the liver and spleen,
                                   that express CD11b and CD27. Dot plot profiles are representative of at least three experiments. (C) Liver trNK
                                   CD49a+DX5- cells express TRAIL. Spleens and livers were isolated from WT C57BL/6NCr mice, stained, and flow
                                   cytometry was performed. The histogram was gated on live CD3−CD19−NK1.1+ cells and displays the expression
                                   level of TRAIL on CD49a+DX5− liver trNK cells and CD49a−DX5+ cNK cells in the liver and spleen. (D) Expression of
                                   genes specific to DX5– population of BM cells in DX5− liver NK cells and DX5+ liver and spleen cNK cells shows
                                   non-specific pattern. Shown are ∼200 genes most highly expressed in DX5− BM NK cells as compared to DX5+
                                   BM NK cells (genes shown in Supplementary file 1). Approximately half of the DX5– BM NK cell-specific genes
                                   are upregulated in the liver CD49a+DX5– NK cells and the other half is upregulated in the CD49a−DX5+ BM NK cells.
                                   Figure 2. Continued on next page

Sojka et al. eLife 2014;3:e01659. DOI: 10.7554/eLife.01659                                                                                     6 of 21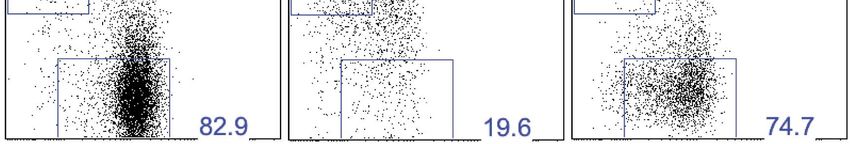
Research article                                                                                                                Immunology

                                   Figure 2. Continued
                                   Gene set enrichment analysis also shows non-significant relationship between BM DX5− cells and CD49a+ NK
                                   cells (Figure 2—figure supplement 2).
                                   DOI: 10.7554/eLife.01659.004
                                   The following figure supplements are available for figure 2:
                                   Figure supplement 1. Heat map showing the top differentially expressed genes between the liver trNK cells and
                                   the cNK cells from the liver and spleen.
                                   DOI: 10.7554/eLife.01659.005
                                   Figure supplement 2. Gene set enrichment analysis (GSEA) indicates relationships between BM NK cell and cNK
                                   cells in liver and spleen.
                                   DOI: 10.7554/eLife.01659.006

                                   IL-15Rα deficiency, resulting in an absence of liver trNK cells as well as liver and splenic cNK cells
                                   (Figure 5A). Thus, despite their differences, the requirement for IL-15Rα suggests that the trNK cells
                                   and cNK cells are more related to each other than the non-NK cell members of the ILC family that
                                   do not require IL-15 (Spits and Cupedo, 2012; Spits et al., 2013).
                                       While our RNA-seq and phenotypic analysis strongly suggest that the liver trNK cells represent a
                                   different NK cell lineage from cNK cells, an alternative hypothesis is that the liver trNK cells could be
                                   immature NK cells that ultimately become cNK cells, as suggested by their ‘immature’ phenotype
                                   (Figure 2B) and previous publications (Townsend et al., 2004; Gordon et al., 2012; Peng et al.,
                                   2013). To directly test these hypotheses and gain insight into the developmental relationship of liver

                                   Figure 3. Liver trNK cells are phenotypically distinct from cNK cells. (A and B) Differential expression of NK cell
                                   receptors on liver trNK and splenic and liver cNK cells. Spleens and livers were isolated from WT C57BL/6NCr mice,
                                   stained, and flow cytometry performed. The histograms were gated on live CD3−CD19−NK1.1+ cells and display
                                   the expression level of NK receptors on CD49a+DX5- liver trNK cells and CD49a−DX5+ cNK cells in the liver and
                                   spleen (A). A summary bar graph of the percentage of CD49a+DX5− liver trNK cells and CD49a−DX5+ cNK cells in
                                   the liver and spleen that express the various NK receptors (B). (C) The liver trNK cells display an activated phenotype.
                                   Spleens and livers were isolated from WT C57BL/6NCr mice, stained, and flow cytometry performed. The histograms
                                   were gated on live CD3−CD19−NK1.1+ cells and display the expression level of activation markers that are
                                   expressed on CD49a+DX5− liver trNK cells and CD49a−DX5+ cNK cells in the liver and spleen.
                                   DOI: 10.7554/eLife.01659.007

Sojka et al. eLife 2014;3:e01659. DOI: 10.7554/eLife.01659                                                                                         7 of 21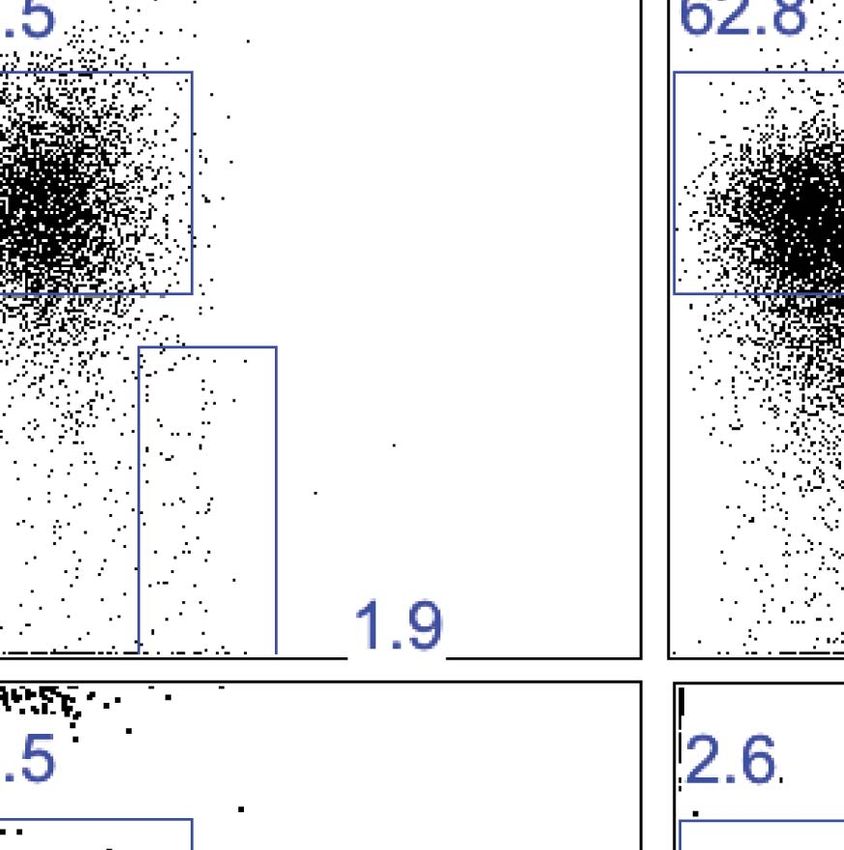
Research article Immunology
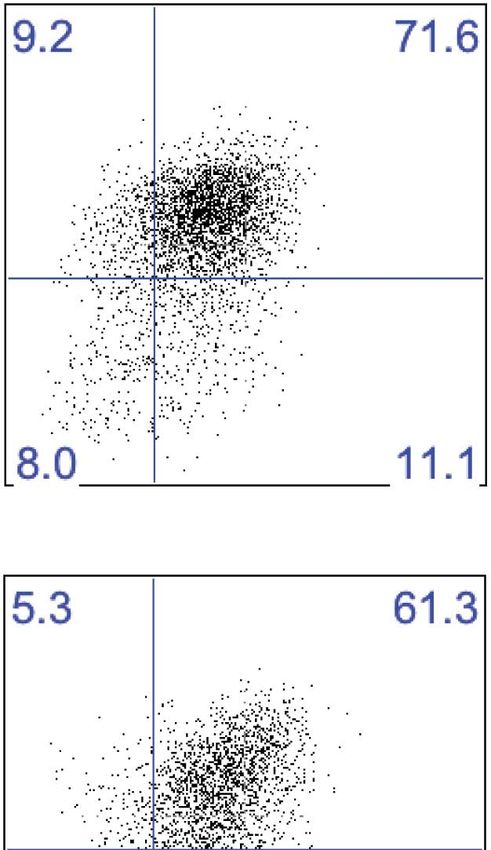
Figure 4. CD49a + DX5- trNK cells of the liver have a unique cytokine profile. (A) The liver trNK cells differentially express cytokines when activated.
Spleens and livers were isolated from WT C57BL/6NCr mice stimulated with PMA/ionomycin for 4 hr, stained, and IFNγ, TNFα, and GM-CSF cytokine
production was analyzed by flow cytometry. The cells were gated on live CD3−CD19−NK1.1+ and the graphs represent the percentage of indicated
cytokine produced by CD49a+DX5− liver trNK cells and CD49a−DX5+ cNK cells in the liver and spleen 4 hr post stimulation. (B and C) The liver trNK cells
produce both IFNγ and TNFα when stimulated. Shown are dot plots of cells prepared and stimulated as in A. Each dot plot (B) was gated on live
CD3−CD19−NK1.1+ cells and further gated on CD49a+DX5- liver trNK cells and CD49a−DX5+ cNK cells in the liver and spleen. Cells were co-stained
for IFNγ and TNFα and the percentage produced of each cytokine is presented in each quadrant. Bar graphs (C) indicate the percentage of IFNγ and
TNFα-double producers shown in B. (D) The liver trNK cells degranulate and produce TNFα upon stimulation with YAC-1 targets. Liver lymphocytes
were co-cultured at a 1:1 ratio with YAC-1 target cells for 6 hr. The cells were stained for the indicated markers and flow cytometry performed. The dot
plots were gated on live CD3−CD19−NK1.1+ CD49a+DX5− liver trNK cells or CD3−CD19−NK1.1+ CD49a−DX5+ cNK cells in the liver for CD107a degranulation
and TNFα production.
DOI: 10.7554/eLife.01659.008
trNK cells to cNK cells, we analyzed the mRNA levels of several transcription factors involved in cNK
cell development. Particularly informative was decreased transcript levels of eomesodermin (Eomes)
in the liver trNK cells as compared to liver and splenic cNK cells (Figure 5B). The differences in Eomes
transcript levels were verified by flow cytometry which showed lower levels of Eomes protein in liver
trNK as compared to cNK cells (Figure 5C), consistent with previous reports (Gordon et al., 2012). By
contrast, there was no relative difference between liver trNK cells and liver and splenic cNK cells in
Tbx21 (Tbet) expression at either the transcript or protein level (Figure 5B,C). Transcription factor
staining was performed as previously described for Tbx21 (Sojka and Fowell, 2011). Thus, liver
trNK cells express different levels of Eomes compared to spleen cNK cells, suggesting different
Sojka et al. eLife 2014;3:e01659. DOI: 10.7554/eLife.01659 8 of 21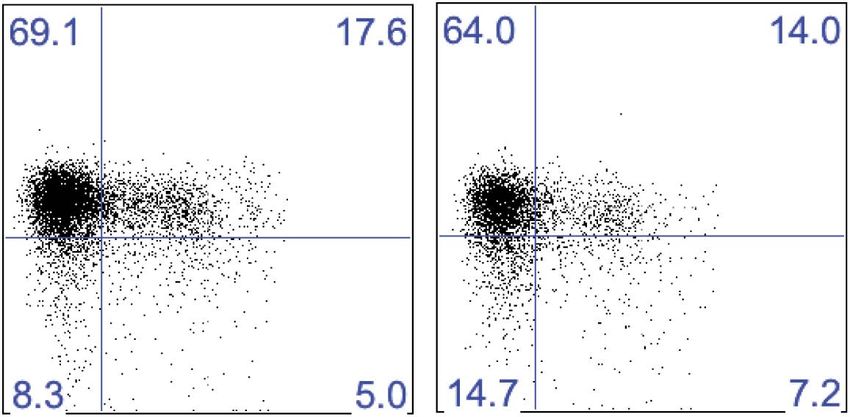
Research article                                                                                                                Immunology

Figure 5. Liver trNK cells have different transcription factor requirements than cNK cells. (A) All liver NK cells require IL-15Rα. Spleens and livers were
isolated from WT mice and Il15ra−/− mice, stained, and flow cytometry performed. The bar graph displays the percentage of CD3−CD19−NK1.1+ cells in
the liver and spleen of each strain of mice. (B) Eomes transcripts are expressed at lower levels in liver trNK cells. Spleens and livers were isolated from
Rag1−/− mice and NK1.1+ cells sorted for CD49a+DX5− liver trNK and liver and spleen CD49a−DX5+ cNK cells. RNA-seq was performed on the sorted
populations and the expression levels of indicated transcription factors plotted. RPKM = reads per kilobase per million mapped reads. Normalization
of read counts by length of transcripts allowed comparison of expression levels of different genes. One of two independent experiments. (C) Eomes
protein expression is decreased in liver trNK cells. Spleens and livers were isolated from Rag1−/− mice, stained, and flow cytometry performed for
indicated transcription factors. The histograms were gated on live CD3−CD19−NK1.1+ cells and display the expression level of transcription factors
Figure 5. Continued on next page

Sojka et al. eLife 2014;3:e01659. DOI: 10.7554/eLife.01659                                                                                          9 of 21
Research article                                                                                                                 Immunology

Figure 5. Continued
expressed in CD49a+DX5− liver trNK cells and CD49a−DX5+ cNK cells in the liver and spleen. Histogram plots are representative of three independent
experiments. (D and E) The liver trNK cells are present in NFIL3-deficient mice but absent in Tbx21 (Tbet)-deficient mice. Spleens and livers were isolated
from WT, Nfil3−/−, and Tbx21−/− mice, stained, and flow cytometry performed. Representative dot plots (D) were gated on live CD3−CD19−NK1.1+ and display
the expression level of CD49a and DX5 in the liver (top panels) and the spleen (bottom panels). Bar graphs (E) display the percentages (left column) and
total NK cell number (right column) of CD3−CD19−NK1.1+ cells that express CD49a and DX5 in the liver and spleen of WT, Nfil3−/−, and Tbx21−/− mice. (F) The
Nfil3−/− liver trNK cells display an activated phenotype, like liver trNK cells in WT mice. Spleens and livers were isolated from WT C57BL/6NCr and Nfil3−/−
mice, stained, and flow cytometry was performed. The histograms were gated on live CD3−CD19−NK1.1+ cells and display the expression level of activation
markers expressed on CD49a+DX5− liver trNK cells and CD49a−DX5+ cNK cells in the liver and spleen in WT compared to the trNK cells from the Nfil3−/−
mice. (G) Nfil3−/− liver trNK CD49a+DX5− cells do not express Eomesodermin. Livers were isolated from WT C57BL/6NCr and Nfil3−/− mice, stained, and flow
cytometry was performed. The histogram was gated on live CD3−CD19−NK1.1+ cells and displays the expression level of Eomes on WT and Nfil3−/−
CD49a+DX5− liver trNK cells and CD49a−DX5+ cNK cells in the liver. (H) The Nfil3−/− trNK cells in liver display an ‘immature’ phenotype by flow cytometry,
similar to trNK cells in WT mice. Cells from the liver were isolated, stained, and flow cytometry was performed. Dot plots were gated on live CD3−CD19−NK1.1+
cells and numbers in each dot plot represent the percentages of the subpopulations, that is, liver CD49a+DX5- cells and CD49a−DX5+ that express CD11b
and CD27. Dot plot profiles are representative of two experiments. (I) Stimulated Nfil3−/− liver trNK cells produce cytokines similar to WT liver trNK cells.
Livers were isolated from WT C57BL/6NCr and Nfil3−/− mice stimulated with PMA/ionomycin for 4 hr, and cells were co-stained for IFNγ and TNFα and
analyzed by flow cytometry. The graphs were gated on live CD3−CD19−NK1.1+ cells and represent the percentage of cytokine+ (or cytokine−) cells among the
CD49a+DX5− liver trNK cells from WT and Nfil3−/− mice, as indicated. Dot plot profiles are representative of two experiments.
DOI: 10.7554/eLife.01659.009

                                      requirements for the related Tbox transcription factor, Tbet, which plays an overlapping role with
                                      Eomes in cNK cell development (Gordon et al., 2012).
                                          To directly test specific transcription factor requirements, and to gain additional insight into the
                                      developmental relationship between the liver trNK cells vs liver and spleen cNK cells, we analyzed
                                      these cells in mice lacking NFIL3 and Tbet (Tbx21). Surprisingly, in NFIL3-deficient mice, liver trNK cells
                                      were present in total cell number (Figure 5D,E). Conversely, as previously reported, NFIL3-deficient
                                      mice had no cNK cells in the spleen (Gascoyne et al., 2009; Kamizono et al., 2009; Kashiwada et al.,
                                      2010). As well, there were no cNK cells in the liver (Figure 5D,E), consistent with their relationship
                                      to splenic cNK cells and raising the percentage of liver trNK cells. By contrast, liver trNK cells were
                                      absent in Tbet-deficient mice in both percentage and total cell number, when compared to WT controls
                                      and in contradistinction to both cNK cell populations (Figure 5D,E). The requirement for Tbet is con-
                                      sistent with an intrinsic requirement for Tbet in development of TRAIL+ liver NK cells (Gordon et al.,
                                      2012). Thus, these data demonstrate a unique developmental pathway of liver trNK cells that does not
                                      require NFIL3 but depends on Tbx21, indicating that the liver trNK cells are not precursors of cNK cells.
                                          To assess the phenotype and function of the trNK cells in the liver of the NFIL3-deficient mice we
                                      assessed the cells at steady state and upon activation by flow cytometry. We found that much like the
                                      liver trNK cells from a WT mouse, the trNK cells from Nfil3−/− mice also express markers correlated with
                                      activation, that is, higher FSC and SSC, higher levels of CD69 and CD44 and lower levels of CD62L
                                      (Figure 5F) and do not express Eomes (Figure 5G). They have an ‘immature’ phenotype similar to the WT
                                      trNK cells in that they express CD27 and generally lack CD11b expression on most cells (Figure 5H). Upon
                                      stimulation, the Nfil3−/− trNK cells in the liver produce both IFNγ+ and TNFα+ simultaneously in a manner
                                      comparable to WT trNK cells (Figure 5I). Thus, NFIL3 is not required for normal trNK cells in the liver.
                                          Taken together, these data indicate that liver trNK cells require different transcription factors than liver
                                      and splenic cNK cells, providing strong evidence that the liver trNK cells are a distinct lineage from the
                                      liver and splenic cNK cells, whereas both cNK cell populations are likely to be developmentally identical.

                                      Tissue-resident NK cells in other organs
                                      Inasmuch as NK cells have been described in other solid organs, we next determined if CD49a
                                      could also mark trNK cells in other tissues. In addition to the liver, we found large percentages of
                                      CD49a+DX5− NK cells in the uterus and skin but not in other organs examined (Figure 6A,B), sug-
                                      gesting that CD49a may be a marker of trNK cells in these organs. The CD49a+ NK cells in the
                                      uterus and skin also generally lacked expression of DX5 (Figure 6B) and displayed constitutive
                                      expression of CD69, much like the liver trNK cells (Figure 6C). To determine if the CD49a+DX5–
                                      cells were resident to the uterus and skin, we studied parabiotic mice as we had done previously
                                      to help establish the tissue residency of CD49a+ DX5− NK cells in the liver (Peng et al., 2013). At
                                      2 weeks post surgery, we assessed both the trNK and cNK cells in the uterus and skin in each

Sojka et al. eLife 2014;3:e01659. DOI: 10.7554/eLife.01659                                                                                          10 of 21
Research article Immunology Figure 6. Tissue-resident NK cells in other organs. (A) CD49a+DX5− NK cells are present in liver, skin, and uterus. Various organs were isolated from WT C57BL/6NCr mice, stained, and flow cytometry performed. The stacked bar graph represents the percentage of live CD3−CD19−NK1.1+ cells that either express CD49a or DX5 in the indicated organs. (B) CD49a expression on skin and uterine trNK cells. The dot plot displays cells that were isolated from the uterus and skin of WT C57BL/6NCr mice. The dot plots were gated on live CD3−CD19−NK1.1+ cells and the percentage of cells expressing CD49a and DX5 are shown. (C) CD49a+DX5– NK cells in liver, skin, and uterus express higher levels of CD69. Spleen, liver, uterus, and skin were isolated from WT C57BL/6NCr mice, stained, and flow cytometry performed. The histograms were gated on live CD3−CD19−NK1.1+ cells and display the expression level of CD69 on CD49a+DX5− trNK cells and CD49a−DX5+ cNK cells in the spleen, and indicated tissues. (D and F) CD49a+DX5– NK cells in uterus and skin are tissue-resident as revealed by parabiotic mice. The uterus (left two panels) and skin (right two panels) were isolated from day 14 parabiosed mice. (E) Chimerism in the spleen. The spleen was analyzed for the degree of chimerism by analyzing the percentage of gated live CD45.1 and CD45.2 cells in each parabiont on day 14-post parabiosis surgery. These data correspond to data shown in Figure 6D,F. (F) Each parabiont was analyzed for its host and migratory cells using the congenic markers CD45.1 and CD45.2. The cells were Figure 6. Continued on next page Sojka et al. eLife 2014;3:e01659. DOI: 10.7554/eLife.01659 11 of 21
Research article                                                                                                       Immunology

Figure 6. Continued
further gated on live CD3−CD19−NK1.1+ cells and the percentages of cells expressing CD49a and DX5 are shown in the representative dot plots
(D). Stacked bar graphs (F) show the percentages of cells expressing CD49a and DX5, the gated populations in (D). The experiment was performed
two independent times with four parabiosed animals in each experiment (total of 8 pairs).
DOI: 10.7554/eLife.01659.010

                                   parabiont by flow cytometry by gating on the appropriate CD45.1 or CD45.2 congenic marker in
                                   order to differentiate host-derived cells from circulating cells from the other parabiont. In both the
                                   uterus and skin, host CD49a+ DX5− NK cells were primarily found in the indicated host tissue
                                   (Figure 6D,F), similar to the CD49a+ DX5− trNK cells in the liver (Peng et al., 2013). By contrast, CD45
                                   allotype-disparate mice reached nearly complete chimerism in the spleen (Figure 6E) (Wright
                                   et al., 2001; Peng et al., 2013). Moreover, the CD49a−DX5+ NK cells of both allotypes were found in
                                   both parabionts, indicating that they were circulating NK cells, akin to the CD49a−DX5+ cNK cells
                                   in the liver (Figure 6D,F). Thus, the uterus and skin contain both trNK (CD49a+ DX5−) and circu-
                                   lating cNK (CD49a−DX5+) cNK cells, with the trNK cells appearing to dominate the uterine NK cell
                                   population.
                                       Although uterine NK cells have not been studied previously in the context of trNK cells, they
                                   are known to be IL-15-dependent (Ashkar et al., 2003) and thus IL-15Rα-dependent. Since little is
                                   known about NK cells in the skin, we analyzed them further. The skin trNK cells do not express Eomes
                                   and are absent in IL-15Rα-deficient mice (Figure 7A,B). Furthermore the trNK cells in the uterus and
                                   skin produce more IL-2 than cNK cells in the liver and spleen (Figure 7C). These features are similar
                                   to liver trNK cells.
                                       We evaluated whether the trNK cells in the uterus and skin are related to the CD127+ thymic NK by
                                   two independent ways. First, we found no detectable CD127 expression on uterine and skin trNK cells
                                   when compared to the CD127 expression on the thymic NK cells (Figure 7D). Second, we found uterine
                                   and skin trNK cells are present in Foxn1−/−(athymic) mice (Figure 7E), indicating that they develop
                                   independent of a thymus, unlike thymic NK cells.
                                       To determine if the trNK cells in the liver, uterus, and skin are related lineages, we examined the
                                   NFIL3- and Tbet-deficient mice. Strikingly, trNK cells were present in the liver, uterus and skin of NFIL3-
                                   deficient mice (Figure 8A,B), indicating that these trNK cells represent a distinct lineage from cNK
                                   cells. Moreover, the circulating CD49a−DX5+ NK cells were absent in these tissues, indicating that
                                   these CD49a−DX5+ NK cells are related to the cNK cells in the liver and spleen. In Tbet-deficient mice,
                                   the trNK cells were absent in skin (Figure 8A,B) akin to liver trNK cells (Figure 5D,E), implying a devel-
                                   opmental link between the trNK cells in the liver and skin. Interestingly, however, the uterine trNK cells
                                   were still present in Tbet-deficient mice (Figure 8A,B), strongly suggesting that uterine trNK cells
                                   represent yet another NK cell lineage.

                                   Discussion
                                   Many immune cell lineages migrate throughout the body via the circulatory system. However,
                                   emerging data indicate that a number of different immune cell types appear to be tissue-resident
                                   and rarely recirculate. Here we demonstrate that NK cells are also comprised of circulating and
                                   several tissue-resident cell types in the liver, skin and uterus. Our comprehensive transcriptome
                                   and FACS analyses on liver trNK cells and liver and splenic cNK cells suggested that they may be
                                   distinct lineages of NK cells. Indeed, circulating liver and splenic cNK cells were absent in NFIL3-
                                   deficient mice, further demonstrating their lineage relationship to each other. On the other hand,
                                   NFIL3-deficient mice still possessed trNK cells in the liver, skin, and uterus. Moreover, Tbet-
                                   deficient mice lacked trNK cells in the liver and skin but uterine trNK cells and cNK cells in the liver
                                   and spleen were largely intact. Finally, thymic NK cells represent a distinct NK cell lineage because
                                   they are absent in nude and GATA-3-deficient mice which generally possess cNK and trNK cells.
                                   Taken together, these data suggest that there are at least four lineages of NK cells: cNK cells cir-
                                   culating in spleen, blood and other organs, thymic, and two trNK cell lineages—liver (and skin),
                                   and uterine.
                                      The trNK cells can be distinguished from cNK cells in several different ways. Most importantly, trNK
                                   cells do not require the putative NK cell specification factor, NFIL3 (Di Santo, 2009; Gascoyne et al.,
                                   2009; Kamizono et al., 2009; Kashiwada et al., 2010), indicating that they belong to a different cell

Sojka et al. eLife 2014;3:e01659. DOI: 10.7554/eLife.01659                                                                              12 of 21
Research article Immunology
lineage. In the liver, skin, and uterus, they differ-
entially express CD49a, though it is possible that
trNK cells in other organs preferentially express
another marker. Concomitantly, they lack DX5
expression which is generally expressed as a late
maturation marker on most cNK cells (Kim et al.,
2002; Peng et al., 2013). Interestingly, trNK cells
from unmanipulated mice display markers asso-
ciated with cNK cell activation, such as CD69, in
contrast to cNK cells which do not express CD69
until activated (Karlhofer and Yokoyama, 1991;
Wang et al., 2000). The trNK cells also express
a different repertoire of Ly49 receptors, suggest-
ing that they may be tolerant to self by using
mechanisms that do not strictly employ MHC
class I-dependent licensing by Ly49 receptors, as
has been shown for cNK cells in the spleen (Kim
et al., 2005; Elliott and Yokoyama, 2011). The
trNK cells efficiently produce other cytokines,
particularly TNFα and GM-CSF which may contrib-
ute to inflammatory conditions in a manner dis-
tinct from cNK cells which predominantly produce
IFNγ. TNFα production occurs following stimula-
tion by target cells and also occurs in trNK cells
producing IFNγ. Finally, trNK cells utilize a sepa-
rate set of transcription factors which may endow
trNK cells with other unique functions, in addition
to lineage commitment. As such, due to their
Figure 7. trNK cells in the liver resemble trNK cells in tissue localization and these distinctive features,
the skin and not the uterus, and all develop independent trNK cells most likely play important roles in innate
of a thymus. (A) Eomes is poorly expressed in skin trNK defense in ways that should be distinguishable
cells. Skin was isolated from WT C57BL/6NCr mice,
from cNK cells. Future investigations to re-examine
stained, and flow cytometry performed. The histogram
the contribution of NK cells in different organs with
was gated on live CD3−CD19−NK1.1+ cells and displays
a focus on trNK cells should reveal these roles.
the expression level of Eomes on CD49a+DX5− skin trNK
cells and CD49a−DX5+ cNK cells in the skin and spleen. Among the various NK cell lineages, the liver
(B) Skin trNK cells are absent in IL-15Rα-deficient and skin trNK cells appear to be highly related.
mice. Skin was isolated from WT mice and Il15ra−/− They are phenotypically similar and both are
mice, stained, and flow cytometry performed. The bar absent in Tbet-deficient mice. Although it remains
graph displays the number of events captured in the to be formally shown that a common precursor
CD3−CD19−NK1.1+ gate. (C) CD49a+DX5− trNK cells of can give rise to liver and skin trNK cells but not
the liver and skin produce IL-2. Spleen, liver, uterus and other NK cell lineages, these data indicate that
skin were isolated from WT C57BL/6NCr mice stimulated they are more related to each other than to other
with PMA/ionomycin for 4 hr, stained, and IL-2 production
NK cell lineages, including cNK cells. uNK cells
was analyzed by intracellular staining and flow
appear distinct from the liver and skin trNK cells
cytometry. To obtain the percentage of IL-2+ cells in
because they are Tbet-independent, even though
each population, the graphs were derived from gated
live CD3−CD19−NK1.1+ cells and represent the all are NFIL3-independent. Perhaps this is due to
percentage of IL2+ cells among the CD49a−DX5+ cNK concomitant expression of Eomes at high levels
cells in the liver and spleen and the CD49a+DX5− in uNK cells (Tayade et al., 2005). Alternatively,
liver, uterus and skin trNK cells. (D) Tissue-resident uterine trNK cells may depend on other tran-
CD49a+DX5− cells in the liver, uterus and skin do not scription factors unique for this NK cell lineage.
express CD127. Thymus, liver, uterus and skin were The liver, skin, and uterine trNK cell lineages
isolated from WT C57BL/6NCr mice, stained, and flow can be distinguished from thymic NK cells in sev-
cytometry was performed. The histograms are from eral ways. Both trNK (as shown here) and cNK
gated live CD3−CD19−NK1.1+ cells and display the
cells do not express high levels of CD127 that
expression levels of CD127 on CD49a+DX5− liver, uterus
is characteristic of thymic NK cells (Vosshenrich
Figure 7. Continued on next page
et al., 2006; Yadi et al., 2008). Moreover, thymic
Sojka et al. eLife 2014;3:e01659. DOI: 10.7554/eLife.01659 13 of 21Research article Immunology
Figure 7. Continued NK cells are absent in nude mice and in mice
and skin trNK cells and CD49a−DX5+ cNK cells in the lacking GATA-3 which possess cNK cells, as reca-
liver, uterus and skin and NK1.1+ thymic NK cells. pitulated here. By contrast, we showed liver trNK
(E) Tissue-resident CD49a+DX5− cells in the liver, uteruscells are present in nude and GATA-3 deficient
and skin develop independent of a thymus .The uterus mice, suggesting that skin trNK cells will show
and skin were isolated from WT and Foxn1−/− mice, these features, although the skin and uterine
stained, and flow cytometry was performed. Bar graphs trNK cells need to be further studied in these
display the total number of CD3−CD19−NK1.1+ cells mice. The trNK cells in the uterus in virgin mice as
that express CD49a and DX5 in the uterus and skin of
studied here will also need to be studied with
WT and Foxn1−/− mice. Experiments were performed
respect to other subsets of uNK cells which have
three independent times.
DOI: 10.7554/eLife.01659.011
been described previously, including endometrial
vs decidual NK cells, and NK1.1– DX5– uterine
NK cells (Yadi et al., 2008; Mallidi et al., 2009).
Inasmuch as liver, skin, and uterine trNK cells can be distinguished from cNK cells, it is important
to note that they do share some important similarities, in addition to surface expression of NK1.1 and
NKp46 but not CD3ε. As shown here and previously published, cNK, uterine and liver trNK cells
can respond to YAC-1 targets by degranulation and killing (Kiessling et al., 1975; Linnemeyer and
Pollack, 1991; Peng et al., 2013), though this needs to be further detailed for the skin trNK cells
described here. Moreover, cNK cells require IL-15 or IL-15Rα (Lodolce et al., 1998; Kennedy et al.,
2000) and here we showed that IL-15Rα-deficient mice have no cNK or trNK cells, such that no NK1.1+
CD3− cells were identifiable in spleen, liver, and skin of the knockout mice. Similarly, IL-15-deficient
mice lack NK1.1+ CD3− cells in the uterus (Ashkar et al., 2003; Barber and Pollard, 2003), indicating
that trNK cells in the uterus as well as liver and skin are IL-15Rα-dependent. While more detailed anal-
ysis of the progenitors for NK cells will be required to establish the precise lineage relationship of
trNK and cNK cells to each other, current data, particularly cytotoxic potential and IL-15-dependence,
support their intimate relationship, despite differences in transcription factor requirements.
Recent studies indicate that cNK cells are related to innate lymphoid cells (ILCs) (Spits and
Cupedo, 2012; Spits et al., 2013). While this area of research is fluid with potentially more cells to
be identified and additional characteristics to be discovered, it now appears that ILCs can be sepa-
rated into three groups, based on shared characteristics (Spits et al., 2013). cNK cells are now
classified as belonging to the group 1 ILCs, due to their shared production of IFNγ. cNK cells can be
distinguished from other group 1 ILCs by their cytotoxic capacities, dependence on IL-15, and general
lack of IL7Rα expression, features shared between cNK and liver, skin, and uterine trNK cells. Recently,
a new IFNγ-producing ILC1 cell was identified which demonstrated dependence on NFIL3, Tbx21,
and IL-15 but not IL-15Rα (Fuchs et al., 2013), unlike the trNK cells described here. Finally, while the
relationship of thymic NK cells expressing CD127 to ILCs which also express CD127 may need fur-
ther refinement, current knowledge suggest that the liver (skin) and uterine trNK cells are more related
to cNK cells than ILCs.
Future studies, however, may continue to blur the lines between ILCs and NK cells. Already, it has
been noted that markers previously thought to be exclusively expressed on NK cells, such as NKp46,
are expressed on ILCs that now can be distinguished from classical NK cells (Walzer et al., 2007;
Cella et al., 2009; Spits et al., 2013). A further confounding issue is the apparent plasticity of ILCs
with potential interconversion between ILC groups (Cella et al., 2010; Vonarbourg et al., 2010),
indicating the increasing complexities of definitively identifying ILC types and potentially distin-
guishing ILCs from other immune cells. Thus, it is possible that trNK cells may be more closely related
to certain ILCs than currently appreciated.
Tissue-resident NK cells are more closely related to ILCs in that both the trNK cells and the ILCs
have extended their place of residency outside the traditional secondary lymphoid organs. Originally
most ILCs were considered in the context of gut or lymphoid tissues (Spits and Cupedo, 2012) but
recently they have been identified in other nonlymphoid tissues such as the skin and the uterus. ILC2s
in the skin have been reported to regulate cutaneous inflammation but they are unaffected by
IL15-deficiency (Roediger et al., 2013), unlike trNK cells as shown here. In the uterus, immature
NK cells have been described as well as a phenotypically related but distinct population of cells that
express the transcription factor RORC and produce IL-22, suggesting that they may be ILC3s rather
than NK cells (Crellin et al., 2010; Male et al., 2010). Additional studies will be needed to more
finely localize the anatomic location of trNK cells in these tissues and the transcription factors required
Sojka et al. eLife 2014;3:e01659. DOI: 10.7554/eLife.01659 14 of 21Research article Immunology
Figure 8. Liver, uterus, and skin trNK cells have different requirements for NFIL3 and Tbet (Tbx21). (A) The liver, uterus and skin were isolated from WT,
Nfil3−/−, and Tbx21−/− mice, stained, and flow cytometry performed. Representative dot plots were gated on live CD3−CD19−NK1.1+ cells and display
the expression level of CD49a and DX5 in the liver (top panels) and the uterus (middle panels) and skin (bottom panels). Percentages indicate the
gated populations. Bar graphs (B) display the total number of CD3−CD19−NK1.1+ cells that express CD49a and DX5 in the liver, uterus and skin of WT,
Nfil3−/−, and Tbx21−/− mice. Experiments were performed five independent times.
DOI: 10.7554/eLife.01659.012
for their development and maintenance, work that will be aided by development of new tools to
distinguish trNK cells from cNK cells and ILCs.
The trNK cells should also be considered in the context of other non-lymphoid tissue-resident
immune cells, including NKT cells, tissue-resident memory T cells, γδ T cells, B1 B cells, and tissue
macrophages, among others. Of these, NKT cells are of special interest because they share several
characteristics with trNK cells in the liver. NKT cells were first identified because they express markers
associated with NK cells, such as NK1.1, but are not cNK cells because they express rearranged TCR
genes (Bendelac et al., 2007). While they are now known to recognize glycolipids presented by
CD1 molecules, a large number of NKT cells also reside in the liver, though they can be found in other
tissues. In the liver, NKT cells crawl within the sinusoidal space by patrolling sinusoidal endothelial cells
(Geissmann et al., 2005). This is reminiscent of early electron microscopy studies of the rat liver which
identified ‘pit cells’, now recognized as NK cells (Wisse et al., 1976; Bouwens et al., 1987). Pit cells are
found in the sinusoidal space usually adjacent to sinusoidal endothelial cells. Although liver trNK cells
have not been formally examined vis-à-vis pit cells, it seems likely that they are related, if not equivalent.
The trNK cell populations also are potentially related to tissue-resident memory T cells which had
been previously activated by antigen-stimulation and differentiated into effector cells that then reside
Sojka et al. eLife 2014;3:e01659. DOI: 10.7554/eLife.01659 15 of 21Research article Immunology
in non-lymphoid tissues (Sheridan and Lefrancois, 2011; Gebhardt et al., 2013). Our studies indicate
that trNK cells appear to have an activated phenotype with expression of CD69 and other activation
markers as well as other phenotypic changes. However, it is not yet clear if trNK cells differentiate
from a circulating precursor that then differentiates into a cell taking up tissue residency, akin to tissue-
resident memory T cells (Masopust et al., 2010). Our studies do not rule out this possibility although
the transcription factor requirements make it unlikely that a putative circulating precursor is an NK
cell that had previously differentiated into a cNK cell.
An alternative possible origin of trNK cells is a progenitor that seeds the peripheral organs during
embryonic or fetal life. In particular, due to early hematopoiesis occurring in the fetal liver, liver trNK
cell precursors may seed the liver during embryonic life. In this regard, it is interesting to note that
Ly49E was first noted to be almost exclusively expressed on fetal NK cells (Toomey et al., 1998).
However, recent findings (Filtjens et al., 2013) and those reported here indicate that liver trNK
cells in adult mice also selectively express Ly49E, raising the possibility that Ly49E+ NK cells in the
fetus reflect trNK cells already present in the embryonic liver, at a time when cNK cells are poorly
developed (Bukowski et al., 1985; Dorfman and Raulet, 1998). As such, since the liver is the major
site for fetal hematopoiesis, Ly49E+ NK cells may not reflect fetal NK cells per se but instead the pos-
sibility that precursor of trNK cells seeds the liver during early life. Consistent with this possibility,
we recently showed that precursors of liver trNK cells are present in the adult liver (Peng et al.,
2013). Moreover, adult BM hematopoietic stem cells do not fully reconstitute the liver trNK cell pop-
ulation in irradiated mice. Thus, precursors of trNK cells, like γδT cells and certain tissue macrophages
(Havran and Allison, 1990; Schulz et al., 2012), may seed tissues early in life, a topic that will require
further evaluation.
In conclusion, we provide molecular evidence that trNK cells are distinct from circulating cNK cells
in their cytokine profiles, expression of NK cell receptors and most importantly their transcription
factor requirements. Their tissue residency feature suggests that they have tissue-specific homeostatic
functions. Our studies should prompt a re-examination of the myriad roles of NK cells in many immune
responses which could be due to trNK cells, rather than cNK cells. Finally, our studies may also be
applicable to emerging data on other hematopoietic cells that circulate throughout the body in that
there may be related but distinct cell types that are tissue-resident.
Material and methods
Mice
All mice were housed in a pathogen-free facility and procedures performed in accordance with the
animal protocol approved by the Washington University School of Medicine (WUSM) Animal Studies
Committee or the NIAID Animal Care and Use Committee. WT C57BL/6NCr and B6-LY5.2/Cr mice
were purchased from the National Cancer Institute (Frederick, MD). Foxn1−/− (nude), Tbx21−/− (Tbet-
deficient), Il15ra−/− and Rag1−/− were purchased from Jackson Laboratory (Bar Harbor, ME). The Il15ra−/−
were backcrossed to C57BL/6 background by speed congenics (Wakeland et al., 1997). Nfil3−/− and
Gata3fl/fl mice were previously described (Zhu et al., 2004; Kashiwada et al., 2010). Gata3fl/fl mice
were bred onto C57BL/6 background for at least nine generations before they were bred with Vav-Cre
transgenic mice (JAX line 8610) on a C57BL/6 background to generate Gata3fl/fl-Vav-Cre line.
Cell isolation
Single cell suspensions were made from spleen, bone marrow, peripheral and mesenteric lymph nodes,
spinal cord, omentum, peritoneal cavity, pancreas, lung, liver, skin, and uterus for flow cytometry analysis.
Briefly, all organs isolated were mechanically dissociated and put through a 100 µm or 70 µm cell strainer.
The liver single cell suspension was resuspended in 40% Percoll and centrifuged for 20 min at 2000 rpm
at room temperature. Bone marrow was isolated from femurs. Spinal cord, omentum, pancreas, lung,
uterus and skin were all incubated in 167 µg/ml liberase TL (Roche Applied Science, Indianapolis, IN)
and 100 µg/ml of DNase (Roche Applied Science) for 1 hr at 37°C in shaking incubator. Skin lymphocytes
were isolated from ears; each ear was split into dorsal and ventral sides prior to liberase treatment.
Cell stimulation
Single cell suspensions of spleen and liver were cultured in 10% heat inactivated fetal calf serum and
RPMI 1640 and stimulated with phorbol 12-myristate 13-acetate (PMA, 200 ng/ml) and Ionomycin
(5 µg/ml) for 4 hr in the presence of Brefeldin A (BD Pharmingen, San Jose, CA) to analyze cytokine
Sojka et al. eLife 2014;3:e01659. DOI: 10.7554/eLife.01659 16 of 21You can also read