Diverse climate actors show limited coordination in a large-scale text analysis of strategy documents - Nature
←
→
Page content transcription
If your browser does not render page correctly, please read the page content below
ARTICLE
                  https://doi.org/10.1038/s43247-021-00098-7                   OPEN

                  Diverse climate actors show limited coordination in
                  a large-scale text analysis of strategy documents
                  Angel Hsu            1,2 ✉   & Ross Rauber3

                  Networks of non-state actors and subnational governments have proliferated since the Paris
1234567890():,;

                  Agreement formally recognized their contributions to global climate change governance.
                  Understanding the ways these actors are taking action and how they align with each other
                  and national governments is critical given the need for coordinated actions to achieve
                  ambitious global climate goals. Here, we present a large analysis (n = 9,326), applying large-
                  scale natural language processing methods and social network analysis to the climate strat-
                  egy documents of countries, regions, cities and companies. We find that climate mitigation in
                  employee travel and office operations, green building standards, and municipal and citizen
                  actions are common themes in climate actions across companies and city and regional
                  governments, whereas approaches to setting targets in specific sectors and emissions scopes
                  are more diverse. We also find links between the strategies of regions and countries, whereas
                  companies are disconnected. Gaps in climate action for most actors include adaptation and
                  consumption/supply-chain emission reduction efforts. We suggest that although actors may
                  appear to be self-organizing and allocating climate actions in a mutually beneficial and
                  synergistic way, there may also be missed opportunities for deeper coordination that could
                  result in more ambitious action.

                  1 Yale-NUS     College, Singapore, Singapore. 2 University of North Carolina-Chapel Hill, Department of Public Policy, Abernethy Hall, Chapel Hill, NC, USA.
                  3 University   of Chicago, Department of Computer Science, Chicago, IL, USA. ✉email: angel.hsu@unc.edu

                  COMMUNICATIONS EARTH & ENVIRONMENT | (2021)2:30 | https://doi.org/10.1038/s43247-021-00098-7 | www.nature.com/commsenv                                         1
ARTICLE                                             COMMUNICATIONS EARTH & ENVIRONMENT | https://doi.org/10.1038/s43247-021-00098-7

N
         etworks of non-state actors (e.g., business and civil             led to specialization in climate actions (e.g., suggesting gaps or
         society) and subnational (e.g., cities and regions) gov-          redundancies in climate action) are questions that have been
         ernments have proliferated in number and membership               unexplored in the growing universe of polycentric climate action.
since the 2015 Paris Agreement formally recognized their con-              Unpacking the “black box of orchestration” is needed to better
tributions to global climate change governance. They range in              understand the mechanisms for how coordination within a
diversity from small clubs of specific actors, such as the U.S.             polycentric system might occur21.
Climate Alliance that includes 25 states collectively pledging                While information on the characteristics (e.g., governance
action on climate change, to the Global Covenant of Mayors for             function, the composition of participants, and thematic focus
Climate and Energy, a network of more than 10,000 cities and               areas) and potential mitigation impact of subnational and non-
subnational actors that includes nearly 10 percent of the global           state action has grown22, there is a dearth of information as to
population (GCoM)1. The latter is an example of a transnational            how climate action “initiatives align, scale‐up, and form low‐
climate action network, which links non-state and subnational              carbon pathways.”23 Moreover, as Jordan et al.9 identify, there is a
actors across national borders and often performs governance               lack of empirical evaluation of how non-state and subnational
functions including norm coordination, capacity building, rule             climate actors are governing climate change, specifically whether
implementation, and collective learning facilitation. Such net-            they are filling “gaps” in regimes or simply reproducing already
works also help to pool and distribute financial, managerial, and           existing functions. Although ex-post performance evaluation data
technical resources across cities aiming to take actions on climate        that would allow evaluation of the latter two gaps is scarce, there
change2. Frequently, transnational climate initiatives include             has been a proliferation in the number of non-state and subna-
national government actors, such as the New York Declaration on            tional actors self-reporting climate commitments through trans-
Forests, which pledges an ambitious goal to halt deforestation by          national climate initiatives and disclosure platforms like CDP
2030, and suggests that the structure and composition of global            (formerly Carbon Disclosure Project)24. The content in these
climate governance has changed3,4.                                         databases, however, varies widely: some platforms are pledge-
   This shift to a more polycentric climate governance system5,6           based and only require actors to report climate commitment (e.g.,
has raised questions about how to ensure policy coherence and              “commitments to commit”) with little supporting information,
integration7–9 and avoid fragmentation that could undermine                while others require their members to include detailed documents
progress towards achieving collective climate goals7,10–12. Many           regarding specific actions and policies. The EUCoM, for instance,
scholars underline the need to orchestrate13 efforts from inter-           requires its members to submit a Sustainable Energy and Climate
governmental organizations like the United Nations Framework               Action Plan (SEAP) that details specific measures and policies
Convention on Climate Change (UNFCCC), nation states, and                  they intend to implement to achieve their targets, as well as
non-state and subnational entities. This approach involves using           regularly biennial monitoring and progress reports that include
indirect strategies, such as endorsements, convenings, agenda              emissions inventories25. CDP’s annual disclosure asks companies
setting, or the provision of resources and assistance, to achieve          and subnational governments to respond to a lengthy survey on
policy coherence, in which multiple institutions work to achieve a         mitigation targets, risks, adaptation measures, including green-
shared goal10,12,13. Scholars suggest that “alignment,” “inter-            house gas (GHG) emissions inventory data. Countries’ own
linkages,” “overlaps,” “interactions,” and “interplay” can generate        submitted Nationally Determined Contributions (NDCs) to the
synergies and avoid “conflictive fragmentation” that disrupts and           Paris Agreement have also been criticized for the lack of stan-
dilutes climate action coordination10,14. Several researchers posit        dardization and comparability in structure and content26.
that links between different actors and regimes can generate                  Due to the heterogeneity and size of these political texts, sys-
interaction effects15–17 that lead to convergence, and potentially,        tematic analysis can be unwieldy and challenging. Natural lan-
coherence, across different actors.                                        guage processing (NLP) and automated content analysis
   The degree of orchestration, defined as coordination and                 techniques such as topic modeling apply statistical and machine
linking of non-state climate actions, to each other, and to national       learning methods to text allowing scholars to quantitatively and
and international climate initiatives, is an active area of research       systematically analyze large corpora of text (i.e., “text as big data”
in global climate governance. When actions are coordinated at a            techniques)27,28. Compared to “top-down” qualitative coding
global level, regional and national orchestrators of climate action        techniques29, topic modeling enable researchers “to discover
work to fill strategic gaps, act on comparative advantages, give            topics from the data, rather than assume them.”30 They may
voice to the underrepresented demographics, and address ques-              counter certain biases introduced through non-automated coding
tions of equity in specific regional contexts18. This finding echoes         that relies on subjective interpretations or can be influenced by
Abbott19 in that transnational initiatives perform activities, such        selection biases31.
as information sharing and capacity-building, that national gov-              Here, in this study, we address this critical gap in under-
ernments may be less suited to implement. As Jordan et al.9 point          standing how various actors are pledging climate actions to better
out, this dispersion of different types of activities across different     understand their role and function in the new polycentric climate
actors may suggest that actors are dividing up labor in a mutually         governance system. We apply NLP techniques, including topic
beneficial way, fulfilling Ostrom’s6 description of effective                modeling—an unsupervised machine learning method that allows
polycentricity.                                                            for “discovery” of topics in a text corpus30, to what we believe to
   But scarce evidence exists regarding whether such linking and           be the largest cross-sectional database of 9326 actors, including
coordination amongst climate actors occur. Do cities, regions,             5536 cities, 76 regions, 3542 companies, and 172 countries’
countries, and companies—primary climate actors—take actions               actions on climate change. We also employ network analysis
in similar ways, or are they divvying them in a way that may be            techniques to understand connections and disconnections in
coordinated, or worse, dispersed and redundant? Kuyper et al.20            actors’ commitments. Although network analysis is usually
note that “sites of climate governance are crowded, highly con-            applied to describe relationships between individuals, researchers
tested, and often disjointed from one another,” particularly across        have increasingly applied these tools to describe various actors
multiple governance levels. Whether there are commonalities                and the types of texts and messages they produce32,33. We use
between the ways in which non-state and subnational actors take            these techniques to identify common (or diverse) themes in cli-
climate action (e.g., suggesting coordination or orchestration at          mate actions; and second, to examine linkages (or disconnec-
best, or potential overlaps at worst) or whether atomization has           tions) between these actions and the actors themselves with the

2           COMMUNICATIONS EARTH & ENVIRONMENT | (2021)2:30 | https://doi.org/10.1038/s43247-021-00098-7 | www.nature.com/commsenv
COMMUNICATIONS EARTH & ENVIRONMENT | https://doi.org/10.1038/s43247-021-00098-7 ARTICLE
aim of characterizing the expanding universe of global climate We observe substantial differences in the ways in which
action and identify where greater coordination and orchestration different actors are committing to climate change actions. The
may be needed. topic model predicts the probability of actors’ documents
belonging to each topic, with Fig. 1 illustrating the per-document,
Results per topic probabilities for groups of climate actors. Some topics
What climate actions are being taken? We identified a 30-topic are more likely to appear in some actor groups’ climate actions
model as the most robust model after comparing 20, 30, and 40- than others, which is apparent in Fig. 1, where some clear trends
topic models (see “Methods”). The 30 topics in our document emerge. Countries’ NDCs have on average a 70% probability of
corpus (see Supplementary Table 3 for high probability keywords consisting of Topic 11 on climate change adaptation, while cities’
and representative document excerpts that were used to identify climate actions have a much smaller probability of mentioning
and label topics) identify the most common strategies and actions adaptation (2.5%). Companies’ climate strategies are most likely
actors employ to address climate change. The majority of these to focus on LED lighting (8.5%), air and HVAC systems (12.8%),
actions are focused on climate change mitigation (29 out of 30), presumably within office buildings and other facilities. In
although one topic emerged that focused on climate change articulating mitigation strategies that focus on employee travel
adaptation, primarily mentioned in countries’ Paris Agreement (7%) and offsets for business and employee travel (4.3%),
pledges. The other mitigation-focused topics range from a focus companies are the only actor type to explicitly mention focus
on employee travel and office operations, to green building stan- on “scope 3” or indirect emissions34, although regions have a high
dards that include certification schemes, to offsets, and climate probability of mentioning waste and transport efficiency, which
change adaptation. The most prevalent topics that appear in the could apply to scope 3 emissions if downstream (57%).
document corpus are topics that relate to city or municipal-level Companies also tend to focus on “scope 1” (direct emissions)
climate actions, focused on citizen actions (8%) and municipal site-specific energy sources and efficiency, including a focus on
public actions (8%). These topics appear most commonly for boilers and furnaces (8%), natural gas (8%), and fuel efficiency
cities, which are the most dominant actor type represented in the within fleet vehicles (5.1%). These topics, while represented to
corpus, although their mean document lengths are below average some degree as top topics for cities, have a much smaller
compared to other actor types (Table 1; Supplementary Fig. 1). probability of occurring in their climate actions. Regions have a
much higher probability of mentioning public and community
water management (26%), while cities and municipal govern-
Table 1 Descriptive statistics of document length (i.e., ments tend to focus on the building sector, specifically lighting
number of words) in the text corpus. (8.4%) and energy efficiency (7%). Cities also have a higher
probability of mentioning sustainable transportation (9.7%),
Actor type n Mean Median Min Max sd
lighting specifically in schools and public buildings (8.5%), and
citizen actions (23%).
City 5536 312.28 117.00 25 16575 864.65
Examining the top terms for each actor type and most
Company 3542 706.65 246.00 25 20002 1261.93
Country 172 2605.64 2194.50 100 11274 2216.37
commonly occurring words alongside them (i.e., word colloca-
Region 76 1353.58 579.50 25 14247 2348.95 tions, skip or n-grams)35 can help to understand strategies actors
employ and the commonalities in approaches. These word
Fig. 1 Per-document-per-topic probabilities for four groups of climate actors show the estimated proportion of words from actors’ documents that are
generated from one of 30 topics in the topic model. For example, our topic model estimates that countries’ documents have an average 70% probability
of coming from topic 11 on climate change adaptation. Regions have a higher probability of reflecting topic 20, which includes keywords that indicate
government promotion of waste and transport efficiency. Cities’ climate actions have higher likelihoods to reflect citizen and public actions and focus on
sustainable transportation, and lighting and energy efficiency within municipal buildings. Company actors dominate topics that include employee travel,
and technology upgrades, including renewable energy, boilers and furnaces, and air and HVAC systems.
COMMUNICATIONS EARTH & ENVIRONMENT | (2021)2:30 | https://doi.org/10.1038/s43247-021-00098-7 | www.nature.com/commsenv 3ARTICLE COMMUNICATIONS EARTH & ENVIRONMENT | https://doi.org/10.1038/s43247-021-00098-7 Fig. 2 25 most frequently occurring four-word collocations in actors’ climate documents shows words that commonly occur together. These skip or n- grams provide more context surrounding an actor’s climate actions than single word probabilities since they provide more context for how an actor is referring to a particular word. For example, companies (b) tend to emphasize estimating annual CO2 emissions savings the most frequently, while cities (a) tend to emphasize public participation and stakeholder engagement. Countries (c) refer to international institutions and processes, such as the United Nations Framework Convention on Climate Change and Intended Nationally Determined Contributions. Regions (d) mention increasing resiliency as a common strategy. collocations are in some ways more informative than simply observed through word collocations on improving fuel economy considering single-word probabilities, such as those included in (second most frequent) and building on-site renewable energy Supplementary Table 3, because they provide more context for generation. Policy approaches such as building codes and commonly occurring words and phrases. For instance, a standards, and fuel economy standards for private transportation frequently appearing word in actors’ climate actions may be are commonly referenced. Cities are also the only actor group to “emissions,” but without additional context, it’s not clear whether articulate strategies for preserving biodiversity in green spaces. an actor is referring to “reducing emissions” or perhaps the Companies tend to emphasize monetary savings, payback opposite, “increasing emissions.” Figure 2 shows the top 25 4- periods, efficiency, and investment requirements. Several of the word n-grams by actor type, providing insight into actors’ word collocations emphasize reducing scope 2 or indirect approaches to climate change. For instance, cities’ top four-word emissions from purchased electricity, including neutrality targets collocation is “public participation stakeholder engagement,” applied to these emissions. Like cities, companies’ actions tend to suggesting involving the public to implement climate mitigation focus on buildings: green building standards such as Leadership measures such as recycling and composting, which shows up as in Energy and Environmental Design (LEED) show up frequently, the fourth most frequent. Cities demonstrate technological as well as actions that mention heating, ventilation and cooling approaches in their climate mitigation actions, which can be (HVAC) systems. 4 COMMUNICATIONS EARTH & ENVIRONMENT | (2021)2:30 | https://doi.org/10.1038/s43247-021-00098-7 | www.nature.com/commsenv
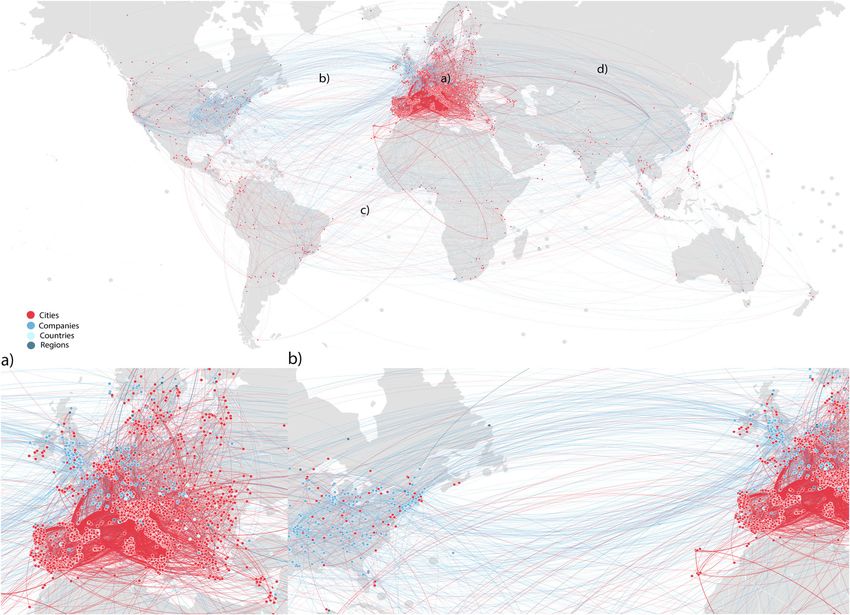
COMMUNICATIONS EARTH & ENVIRONMENT | https://doi.org/10.1038/s43247-021-00098-7                                                         ARTICLE

Fig. 3 Comparison of topic prevalences by actor type and by developed or developing country. Developed countries include industrialized countries that
were members of the Organisation for Economic Cooperation and Development (OECD) in 1992 when the UNFCCC was founded, as well as economies in
transition, such as South Korea, Russia and countries in Central and Eastern Europe. Error bars represent standard errors from the mean topic prevalences.

   Regions and countries are more similar to each other in their              emphasize citizen actions (15% versus 2%) and sustainable
climate action strategies. They are the only actors to frequently             transport (11% versus 2.5%), while cities in developing countries
mention adaptation and resilience as some of the most common                  tend to emphasize waste and public transport (21% versus 1.7%).
word collocations. Many of the countries’ common word
collocations seem to relate to the articulation of Intended
Nationally Determined Contributions (INDCs) and reporting                     How do actors’ climate efforts relate to each other? We
requirements through the UNFCCC, which emphasize the need                     employed network analysis in two ways: to illustrate relationships
for transparency, clarity in reporting and publishing commu-                  between topics and actor groups (Fig. 4), and to understand
nications. Regions, on the other hand, do show similarity to cities           connections between different actors and the strength of these
and companies’ climate action strategies, with frequently                     relationships through their climate commitments (Fig. 5)36 (see
occurring phrases emphasizing heating and cooling efficiency                   “Methods” for more details). Figure 4 shows a network displaying
and audits in the building sector, reducing the cost of public                significant positive correlations between topics, with nodes
transport, investing in more efficient public lighting, and                    colored according to the actor type with the highest per-
installing white roofs and insulation. Regions are the only actor             document probability of a particular topic and sized according
group to have sustainable farming practices commonly men-                     to the overall prevalence of the topic. From the network visuali-
tioned as well as the installation of on-shore wind power. They               zation, three clear topic clusters are observed, which appear to be
also mention collaboration with local governments and increasing              closely related to actor types: one that is comprised primarily of
awareness among the public as implementation methods.                         company-actor dominated topics; a second cluster primarily
Increasing resilience appears as the most common word                         comprised of country-actor dominated topics, including target-
collocations for region actors.                                               setting and climate change adaptation; and a third based on city-
   We also discovered some clear trends when comparing actors                 dominated topics. Region-dominated topics are linkages between
in developed versus developing countries (Fig. 3). With the                   different actor types: community-building programs and gov-
exception of national government actors, where there are more                 ernment promotion of waste, transport and efficiency appear to
developing country actors (130 out of 172 countries), there are               be linkages between company and city actors, while public and
more climate actors from developed countries reflected in our text             community water management appear as a linkage between the
corpus. Comparing developed versus developed countries’ Paris                 company, country, and city actors, suggesting that this topic is
Agreement pledges, developing countries’ documents reflected                   positively correlated between all actor groups.
the climate adaptation topic in much higher frequency than                       To examine spatial relationships between actors’ climate
developed countries (85% versus 24%). Developed country actors                commitments, we developed a geographic-based network analy-
also tend to focus on mitigation target-setting in their Paris                sis. All 6498 actors with available geolocation information are
pledges compared to developing countries (69% versus 20%).                    represented as nodes in the geographically explicit network
Regions in developing countries tend to emphasize waste and                   linkages map in Fig. 5. This map includes 8133 edges, which are
transport efficiency (59% versus 51%), compared to regions in                  directed connections from an actor to the actor it is most similar
developed countries. Cities in developed countries tend to                    to. There are more edges than actors, as in some cases an actor is

COMMUNICATIONS EARTH & ENVIRONMENT | (2021)2:30 | https://doi.org/10.1038/s43247-021-00098-7 | www.nature.com/commsenv                                  5
ARTICLE                                             COMMUNICATIONS EARTH & ENVIRONMENT | https://doi.org/10.1038/s43247-021-00098-7

Fig. 4 Network map based on the topic modeling reveals three community clusters of climate actions: each dominated by cities, countries, and
companies. Nodes are sized by mean topic prevalence and colored according to the most likely actor type.

equally similar to a number of actors, in which case an edge is            actions are most closely connected to other cities and regions
drawn to each of those actors. Similarities between actors are             within their own geographies (Supplementary Figs. 4 and 5),
based on the euclidean distance (see “Methods” for additional              which could explain the close within-region connections overall.
details) between 30-dimensional vectors containing the preva-              Ninety-eight percent of city connections originating in Europe
lence of each topic in the text associated with an actor. Visual           (n = 4803) are connected to another city in Europe, and close to
inspection of this map (Fig. 5) reveals a density of city-actor            83 percent of city connections originating in North America (n =
connections within Europe, company-actor connections between               185) are most similar to another city in North America. Of city
Europe (panel a), North America (panel b), and city-actor                  connections originating from the Middle East and North Africa
connections between actors in the global South (panel c). There            (n = 27), however, 70% are most similarly connected to cities in
are also some linkages in company and city actors in Europe and            Europe. Companies appear to be the most connected to actors
East Asia (panel d).                                                       outside of their own region, with companies in Europe (n =
   The overall size of a network can indicate how similar actors’          1296), North America (n = 1068) and East Asia and the Pacific
climate actions are by measuring the network diameter - the                (n = 697) connected with (Supplementary Fig. 6). North Amer-
maximum distance between any two actors in the network. As                 ican companies still have high similarities to other companies in
Table 2 shows, the average network diameter is 9, meaning that             North America (64%).
within nine steps all actors’ commitments are connected,
although the diameter is shorter for some actors (i.e., companies
(5), regions (6), and countries (6)) than others. The average              Discussion
distance (1.82) between any two actors, however, is much smaller           Based on our analysis, we observe distinctions between actors’
(Table 2). When considering the network’s eccentricity distribu-           climate actions that illustrate both jurisdictional and sectoral
tion by actor, which shows the longest shortest path between an            differences in emissions sources and power to manage them. The
actor node and all other nodes (Supplementary Fig. 2), this short          greater likelihood of some topics to appear in some actors’ climate
path length suggests that most actors’ climate actions are not too         actions over others suggests that actors of a certain type tend to
dissimilar from each other in terms of the strategies they are             act more similarly to actors of the same type, rather than another
adopting, and that a small number of outliers are driving up the           entity type. In other words, cities tend to describe climate actions
diameter statistic.                                                        that are more similar to other cities than to companies. While
   The geographic actor similarity network map in Fig. 5 reveals           there are some similarities and overlaps in the topics, sectors, and
connections between actors located within different regions, the           ways in which cities, regions, companies, and countries take cli-
density of which appear to differ based on actor type. When                mate action, this finding of group similarity is consistent with
examining the density of edges within certain regions, it appears          previous research that has documented the heterogeneity of
that the highest proportion of actors’ edges are connected to              country, industry, and firm responses to environmental issues37.
actors within the same region (Supplementary Fig. 3). Actors               Considering the various motivations for these different actor
within Europe, for example, are most similarly connected to other          groups to address climate change, these conclusions may be
actors within Europe in 95% of connections originating from                unsurprising. Corporate climate responses have been primarily
Europe. Disaggregating these connections based on actor type,              influenced by internal economic motivations38 that frame a
however, different trends emerge. Cities’ and regions’ climate             “business case” for climate action in terms of cost-cutting and

6           COMMUNICATIONS EARTH & ENVIRONMENT | (2021)2:30 | https://doi.org/10.1038/s43247-021-00098-7 | www.nature.com/commsenv
COMMUNICATIONS EARTH & ENVIRONMENT | https://doi.org/10.1038/s43247-021-00098-7                                                                                                       ARTICLE

Fig. 5 A network visualization of the similarity between municipal, regional, and national actors based on the text of their commitments. Each actor is
represented by a node placed over its geographic coordinates. Edges are directed, meaning they are drawn from an actor to the actor it is most similar to,
calculated using euclidean distance between actors’ topic vector representations. Each edge is colored based on its source’s longitude. Bottom panels are
insets showing company connections between North America and Europe (a) and density of city connections within Europe (b). The map also reveals
strong city-actor connections between actors in the global South (c) and some linkages in company and city actors in Europe and East Asia (d). Basemap
source: Wikimedia Commons96.

 Table 2 Metrics for social network analysis by actor type.

 Actor type                   Different region                        Same region                      Avg. path length                  Diameter                   Weighted degree
 City                         791                                     13156                            1.796                             9                          0.597
 Company                      37                                      121                              1.932                             6                          0.189
 Country                      218                                     95                               1.611                             6                          0.245
 Region                       1016                                    956                              1.820                             9                          0.524
 All

 The first two columns describe the number of linkages actors of that type have within the same region versus with other regions. The last three columns describe network metrics that indicate the degree
 of connectivity of nodes in that actor class. Average path length is the average shortage path length between two nodes—the shorter the distance, the closer two actors are connected. Diameter indicates
 the maximum distance between two nodes within an actor group. Weighted degree is the average sum of the weights connected to a node, or a measure of how connected a particular node is.

revenue-generating opportunities39. We observed this rationale in                                       that their larger jurisdiction necessitates more broad, cross-
companies’ emphasis on monetary savings, payback periods, and                                           cutting approaches, which we observed in our network analysis,
investment costs in commonly co-occurring phrases. Cities have                                          although it is well-documented in the literature the inconsistency
asserted themselves as climate change actors to demonstrate                                             with which countries articulated their Paris NDCs26.
leadership, but also due to the increasing climate risks they per-                                         We also observe similarities in climate actors between actors
ceive and experience40. Although we did not observe many cities’                                        within geography, although we acknowledge (see Methods: Actor
climate actions referring to climate change risks and adaptation,                                       Similarity) that the strength of these similarities depends on the
this gap may be likely due to the fact that the transnational cli-                                      type of distance metric selected. We observe in-region similarity
mate initiatives many cities participate within have a tendency to                                      particularly for actors in Europe and marginally so for those in
focus on climate mitigation rather than adaptation. Regions and                                         the United States, echoing prior research on the city and corpo-
countries are more similar in their approach to climate policy in                                       rate climate actions that have found geographical region is an

COMMUNICATIONS EARTH & ENVIRONMENT | (2021)2:30 | https://doi.org/10.1038/s43247-021-00098-7 | www.nature.com/commsenv                                                                                       7
ARTICLE                                             COMMUNICATIONS EARTH & ENVIRONMENT | https://doi.org/10.1038/s43247-021-00098-7

important factor influencing climate actions41,42. Overarching                 Third, reported climate actions primarily seem to take two
policy frameworks that are influenced by a country’s international          broad approaches: technological solutions and “soft” policy or
obligations to the UNFCCC, for example, explain why developed              management approaches, with businesses seeming to favor the
countries’ climate actions emphasize target-setting and develop-           former and cities, regions and countries relying more on the
ing countries mention climate change adaptation at a much                  latter. Companies’ emphasis on renewable energy, LED lighting,
higher frequency (Fig. 2). The presence of market-based                    boiler and furnace efficiency, and air and HVAC systems reflect
mechanisms, such as the EU Emissions Trading Scheme, has                   technocratic climate strategies, a finding consistent with a sur-
resulted in European companies viewing climate change as a core            vey42 of corporate climate management that identified plant
business issue, which may explain why cost and monetary savings            retrofits, clean technologies, fuel switching, offset projects, and
is a frequent topic for companies in our corpus, and reducing              energy efficiency as primary strategies. Companies’ utilization of
carbon emissions as a central policy43. Different country contexts,        more technology-focused methods to address climate change may
which determine varying market structures and characteristics,             be in response to what scholars43 identify as the “recognized
business cultures, and regulatory environments, also play a role in        weaknesses in public policy frameworks for corporate action on
shaping business responses to climate change44. The high parti-            climate change,” which include gaps in regulation (i.e., not all
cipation of cities in the EU Covenant of Mayors for Climate and            greenhouse gases being covered), low economic incentives (i.e.,
Energy (EUCoM), which encompasses more than 9000 primarily                 cost of carbon not sufficiently high enough), and regulatory
small cities (population
COMMUNICATIONS EARTH & ENVIRONMENT | https://doi.org/10.1038/s43247-021-00098-7                                                                              ARTICLE

   While our analysis provides a broad survey of major actorsʼ                             from the semantic content of actors’ commitments. The WordNet Lemmatizer in
climate actions, it is limited by the lack of time-series data, regular                    the python NLTK package was used to remove inflectional affixes from words with
                                                                                           the same stem (e.g. produced, production, producing, producer, etc. become pro-
and repeated reporting on climate actions, strategies, and policies.                       duce). The final corpus of climate action text totaling 4,064,798 words and contains
Data on their effectiveness and performance could provide a                                climate actions from 9326 actors with a document on average of 436 words,
deeper, longitudinal analysis of how climate actions are evolving,                         although the range of document length by actor group is quite variable (Table 1;
converging or diverging. Regular reporting or collection of cli-                           Supplementary Fig. 1).
mate action and policy documents over time could allow for
examinations of changes over time to better connect actions to                             Topic modeling. The topic modeling used in this analysis builds on Latent
specific outcomes.                                                                          Dirichlet Allocation or LDA28, a common text analysis technique that identifies
                                                                                           and allows for prediction of topic probabilities in a text corpus. The topic model
   Despite these data limitations, this study provides a proof of                          represents the overall themes present in a corpus—topics—as probability dis-
concept to understand how NLP and network analysis techniques                              tributions over words in a vocabulary; so while the probability of the word train
may be useful to evaluate policy inputs that are by nature qua-                            might be high in a topic relating to public transportation, it might be relatively low
litative and challenging to empirically evaluate, but could yield                          in one relating to building sector emissions. Documents are modeled as being
                                                                                           formed word-by-word by a generative process where first a topic is selected
insights as to the ways climate actors could better link and learn                         according to some probability distribution specific to each document, and then a
from each other. Such learning could establish new norms for                               word is selected from that topic in accordance with the topic’s distribution over
ambitious climate action and build coalitions and support to                               vocabulary words. Using what the model considers to be outputs of this process—
pursue them7,59–65; and help actors explore policy pathways and                            the documents in our corpus—we can infer the probabilities of each topic given a
                                                                                           document, and each word given a topic through a training process.
mechanisms that could help to identify political mechanisms to                                 We implemented our topic modeling using the stm package for R75. We
help scale and implement decarbonization66. These “indirect                                specifically used the Spectral algorithm, which is the stm’s default76 without the
effects” could catalyze necessary know-how and support for                                 inclusion of covariates. When the structural topic modeling (STM) algorithm is
governments to pursue national climate policies and international                          used without covariates it is a correlated topic model but has several additional
commitments with greater ambition19,67–70 but that are inher-                              benefits over LDA. One major advantage, however, of STM over LDA is that it
                                                                                           allows for groups of documents to vary word usage within topics. While LDA
ently difficult to quantify7,71. These next steps could address calls9                      assumes that all documents in a corpus discuss topics with the same diction, STM
for more empirical analysis of the ways in which climate actors                            allows groups of documents to vary word usage within topics75. Specifically, the
operating at multiple levels and domains interact and whether                              Spectral algorithm implemented in the stm package provides more stable and
such interactions are ultimately positive for global climate                               consistent results because it is deterministic, an advantage over LDA, which is
                                                                                           prone to problems of multi-modality in which there are multiple and sometimes
governance.                                                                                equally likely outcomes77. When the number of documents is large, as is in our
                                                                                           case, the Spectral algorithm has been shown to perform very well and is consistent
                                                                                           across machines75. We experimented with several algorithm specifications,
Methods                                                                                    including the LDA algorithm, and found that the Spectral algorithm as
Data collection and preparation of climate actions database and text corpus.
                                                                                           implemented by the stm package yielded the most coherent and consistent topics,
We collated sources of mostly publicly available information on country, corporate,
                                                                                           after multiple runs and across various machines.
subnational climate actors and commitments from a range of data providers,
                                                                                               To determine the number of topics in the text, we examined metrics provided
including the CDP Annual Supply Chain Disclosure Survey, Carbonn Climate
                                                                                           by the STM package, including exclusivity (e.g., uniqueness), held-out likelihood
Registry, CDP Cities, EU Covenant of Mayors, Global Covenant of Mayors,
                                                                                           (e.g., cross-validation), semantic coherence of models (e.g., whether the topics
Compact of States and Regions, Under 2 Coalition, C40 Cities for Climate Lea-
                                                                                           contain words that are representative of a single coherent concept), and
dership, RE100, We Mean Business, Compact of Mayors, We Are Still In, Climate
                                                                                           minimizing residuals (e.g., error). To guide our choice of the number of topics we
Mayors, Climate Alliance (see Supplementary Table 1 for more details on the data
                                                                                           optimized for two metrics: held-out likelihood, which favors topics that are likely to
sources compiled). Data were available in tabular format (.csv or.xlsx) or we
                                                                                           produce documents held out of the training set, and semantic coherence78, which
scraped data from the reporting website using the Beautiful Soup Python pack-
                                                                                           favors topics that assign high probabilities to words that appear close to one
age72. Data on the actors’ location (i.e., country, region), actor type (e.g., country,
                                                                                           another in the corpus. From maximizing over these two metrics of performance
city, region, company), and climate actions were compiled for this analysis. Climate
                                                                                           and comparing 20, 30, and 40 topic models, we found that a model with 30 topics
actions in this analysis primarily refer to specific sectors (e.g., buildings, transport,
                                                                                           best-maximized distinctness and coherence between topics, while minimizing
waste) and actions (e.g., installing LED lighting, increasing percentage of electric
                                                                                           overlap and the number of “junk” topics (i.e., words that commonly co-occur but
vehicles) actors take to implement specific climate mitigation and adaptation
                                                                                           together as keywords lack coherence as a singular topic). We found that this
activities. We did not include specific emission reduction target commitments (e.g.,
                                                                                           balance of examining statistical parameters and our own evaluation of topic models
reducing emissions 20% from 2005 baseline by 2020) because we did not observe
                                                                                           yielded the best result79.
syntactic diversity in these targets that provided much variation or insight into the
                                                                                               After selecting the 30-topic model, we produced brief summaries of each topic
strategies and ways in which these actors are tackling climate change.
                                                                                           (i.e., topic labels; see Supplementary Table 3) by taking into account both the
                                                                                           probability of words being generated by a specific topic, and by looking at how the
Data limitations. Available data for country and non-state actor climate action is         topic was expressed in documents with a high probability of producing the topic.
limited to self-reported data by the actors themselves and largely restricted to the       We do acknowledge, however, that these topic labels are subjective interpretations.
networks and registries listed in Supplementary Table 1, which others73 have found         This is a common limitation for topic modeling and other unsupervised statistical
mainly cover actors in developed countries. These climate action initiatives are           classification techniques, particularly as labeling is often determined through
driven by an agenda developed in the Global North18, and under-represent small             examination of the most probable words, which are not necessarily exclusive to a
and medium enterprises (SMEs), as well as smaller cities and regions. Smaller              topic and represent a small fraction of the probability distribution80.
entities, or those based in the Global South, may be taking climate action, but may
not have incentives or resources to report to these platforms. The cost of collecting      Actor similarity analysis
and reporting data can also form a barrier; the costs of monitoring transportation         Topic network analysis. The network map (Fig. 4) of the topics identified in the
and energy use vary, for instance, depending on access to technology and human             STM was developed using the topicCorr function in the STM package75 to find
resources. Our analysis, therefore, is limited to what data are available, which are       positive correlations between topics in our selected 30-topic model. This function
not necessarily representative of all existing climate actions because of the reporting    uses the estimated marginal topic proportion correlation matrix and eliminates
gaps mentioned above. There have been recent efforts, such as the SME Climate              edges where the correlation falls below 0, resulting in a network graph that only
Hub launched in partnership with the UNFCCC in September 2020, to further                  shows topics with positive correlations. Community clusters are determined using
engage smaller private actors to report on climate actions (https://smeclimatehub.         the fast greedy hierarchical clusterization algorithm, which is based on a mod-
org).                                                                                      ularity measure that reaches a maximum in each cluster, so detected topics are
                                                                                           most likely to appear together in given texts81. The network is visualized according
Text preprocessing. All non-English text data was translated into English using            to a standard Fructerman Reingold layout employed in R using the ggplot pack-
the Google Cloud Translate API. We eliminated all commitments where actors                 age82. Nodes were sized according to the mean topic prevalence and colored
report climate actions that are
ARTICLE COMMUNICATIONS EARTH & ENVIRONMENT | https://doi.org/10.1038/s43247-021-00098-7
corresponds to an actor, and each edge is weighted by the inverse of the euclidean from publicly available sources, which are detailed in Supplementary Table 1. Contextual
distance between 30-dimensional vector representations of the actors it connects. data for subnational actors was extracted from the ClimActor database (https://doi.org/
Following methods similar to the previous studies80, we compared topic dis- 10.1038/s41597-020-00682-0)95.
tributions between documents, since topic proportions per document are vectors of
the same length. Each value in these vector representations corresponds to the
prevalence of one of the 30 topics listed in Supplementary Table 3, meaning the
Code availability
All statistical analyses were conducted using the R statistical programming environment
euclidean distance metric reflects the degree to which actors discuss different
(Version 3.6.2) and the stm package75 for the topic analysis. The quanteda package89 was
topics.
There are trade-offs and limitations in the selection of similarity metrics, with used for word collocation analysis. Figures were made using the ggplot package in R82.
cosine similarity and euclidean distance being two common metrics in NLP and For the network analysis, the tidytext83, stm75 and Textnets32 were used. Gephi was used
text clustering77,84,85. In some cases, researchers84 found euclidean distance to to generate and analyze the geographic network graphs presented, and the Python
perform worst in unsupervised clustering of similar text documents, while others85 package NLTK90 was used for minor pre-processing tasks. Pandas91 and Numpy92 were
found it to perform the best in their evaluation of short texts of 20 words long. also used for dataframe and matrix manipulations, and some additional plotting was
Another study77 further found issues when applying cosine similarity: they found done with Matplotlib93. R and python code to reproduce the figures is available upon
slightly less clear correlations between cosine similarity and top words and top reasonable request.
documents, where there were multiple cases where high cosine similarity appears
with comparatively low number of top words or documents in common. As a Received: 1 July 2020; Accepted: 12 January 2021;
sensitivity check, we then calculated the similarity between all topic-document
distribution pairs using both euclidean distance and cosine similarity
(Supplementary Figs. 3–7) and then visually inspected documents to evaluate the
better metric. Our evaluation is similar to that of Roberts et al.77 regarding cosine
similarity, we observed more similarity in action plans of European city actors,
which is observed through the euclidean distance metric, rather than European and
Middle East/North African actors, which is suggested are more similar through a References
cosine similarity metric. This finding makes sense, considering most European city 1. Global Covenant of Mayors. Global Covenant of Mayors for Climate and
actors pledge and report actions through the EU Covenant of Mayors for Climate Energy. (2020).
and Energy, which provides specific guidance on how actors should develop their 2. Andonova, L. B., Betsill, M. M. & Bulkeley, H. Transnational climate
action plans to meet the requirements of the initiative86,87. governance. Glob. Environ. Politics 9, 52–73 (2009).
The most prevalent topic representations for each actor node were used to 3. Hale, T. “All hands on deck”: the Paris agreement and nonstate climate action.
construct the network map. Edges are directed, and are drawn from an actor to the Glob. Environ. Politics 16, 12–22 (2016).
actor it is closest to by this metric. The edges are also shaded based on the source’s 4. Hsu, A., Moffat, A. S., Weinfurter, A. J. & Schwartz, J. D. Towards a new
longitude. climate diplomacy. Nat. Clim. Change 5, 501–503 (2015).
To understand what Fig. 5 reveals about how actors from different regions 5. Ostrom, E. Polycentric systems for coping with collective action and global
interact, we matched each actor to one of eight regions and computed the environmental change. Glob. Environ. Change https://doi.org/10.1016/j.
proportion of the total number of edges that we observed between each pair of gloenvcha.2010.07.004 (2010).
regions: 6. Ostrom, E. Coping with tragedies of the commons. Annu. Rev. Polit. Sci.
Frequencyi;j ¼ https://doi.org/10.1146/annurev.polisci.2.1.493 (1999).
7. Chan, S. et al. Reinvigorating international climate policy: a comprehensive
Number of edges from an actor in region i to an actor in region j framework for effective nonstate action. Glob. Policy https://doi.org/10.1111/
total number of edges observed for actors in region j 1758-5899.12294 (2015).
These values were calculated for all of the edges in the network as well as 8. Hale, T. & Roger, C. Orchestration and transnational climate governance. Rev.
disaggregated by actor type and placed into corresponding heat maps Int. Organ. https://doi.org/10.1007/s11558-013-9174-0 (2014).
(Supplementary Figs. 3–7). 9. Jordan, A. J. et al. Emergence of polycentric climate governance and its future
prospects. Nat. Clim. Change 5, 977–982 (2015).
Sensitivity analysis. We conducted several sensitivity analyses and robustness 10. Biermann, F., Pattberg, P., van Asselt, H. & Zelli, F. The fragmentation of
checks to evaluate our choice of topic model and algorithm selection. We first global governance architectures: a framework for analysis. Glob. Environ.
evaluated results in relation to the length and number of actors included in our text Politics https://doi.org/10.1162/glep.2009.9.4.14 (2009).
corpus, given the variation in the number of actors(min 76 regional actors, max 11. van Asselt, H. The fragmentation of global climate governance: Consequences
5536 city actors) and the length of their climate actions in our database (min length and management of regime interactions. The Fragmentation of Global
25 words to maximum over 20,000 words) (Table 1). First, we assessed whether the Climate Governance: Consequences and Management of Regime Interactions.
dominance of one data source for cities affected the topic model by randomly https://doi.org/10.4337/9781782544982 (2014).
selecting 400 texts from the CDP (n = 535) and EU Covenant of Mayors (n = 12. van Asselt, H. & Zelli, F. Connect the dots: managing the fragmentation of
4699), which represented the largest sources of data. Second, we randomly selected global climate governance. Environ. Econ. Policy Stud. https://doi.org/10.1007/
a number of actors’ texts to achieve a balanced corpus length for each actor group, s10018-013-0060-z (2014).
since previous studies88 have found that relatively shorter (between 300 and 600 13. Abbott, K. W., Genschel, P., Snidal, D. & Zangl, B. International organizations
words) documents improve the accuracy and consistency of the topic modeling as orchestrators. International Organizations as Orchestrators. https://doi.org/
approach. We also repeated our topic model using a noun-only, lemmatized (i.e., 10.1017/cbo9781139979696 (2015).
root form) version of the text corpus to evaluate whether reporting styles or dif- 14. Hsu, A., Weinfurter, A. J. & Xu, K. Aligning subnational climate actions for
ferences in writing about climate actions impacted the topic model or results. The the new post-Paris climate regime. Clim. Change https://doi.org/10.1007/
results of the sensitivity analysis are in Supplementary Table 5 and Supplementary s10584-017-1957-5 (2017).
Figs. 8–10. 15. Young, O. R. Institutional linkages in international society: polar perspectives.
Through visual inspection, we determined that the 30-topic model developed Global Governance: A Review of Multilateralism and International
from our corpus that includes all actors’ text is not affected by variable lengths in Organizations 2, 1–23 (1996).
actors’ documents or dominance of one data source. For the noun-only, 16. Stokke, O. S. The interplay of international regimes: putting effectiveness
lemmatized text corpus, we found that the topics were very similar to those of the theory to work. FNI Rep. 14, (2001).
unlemmatized text—a topic on climate adaptation, for instance, still appeared and 17. Oberthür, S. & Gehring, T. Institutional interaction in global environmental
to be most commonly found in the country’s action plans. As Supplementary governance: the case of the Cartagena Protocol and the World Trade
Figs. 8 and 9 reveal, topics on business travel and employee commuting, Organization. Glob. Environ. Politics 6, 1–31 (2006).
consumption, renewable energy, efficiency, were still most common amongst
18. Chan, S., Ellinger, P. & Widerberg, O. Exploring national and regional
business actors. Topics focused on municipal climate actions, public buildings,
orchestration of non-state action for a < 1.5 °C world. Int. Environ.
waste and transport, and mobility are prevalent amongst city climate actors. We
Agreements Polit. Law Econ. https://doi.org/10.1007/s10784-018-9384-2
also still found the same tendency for climate actions within the same regions to be
(2018).
more similar than for actors located in different regions (Supplementary Fig. 10).
19. Abbott, K. W. The transnational regime complex for climate change. Environ.
Plan. C Gov. Policy https://doi.org/10.1068/c11127 (2012).
Data availability 20. Kuyper, J. W., Linnér, B. O. & Schroeder, H. Non-state actors in hybrid global
Code and data to reproduce figures is available on figshare (https://doi.org/10.6084/m9. climate governance: justice, legitimacy, and effectiveness in a post-Paris era. Wiley
figshare.13501701)94. CDP data were provided under a license to A.Hsu and prohibits Interdisciplinary Rev. Climate Change https://doi.org/10.1002/wcc.497 (2018).
public resharing of climate strategy disclosure data that was used for this analysis. All 21. Widerberg, O. The ‘Black Box’ problem of orchestration: how to evaluate the
other data were compiled into a single database in comma delimited format (.csv) format performance of the Lima-Paris Action Agenda. Env. Polit. 26, 715–737 (2017).
10 COMMUNICATIONS EARTH & ENVIRONMENT | (2021)2:30 | https://doi.org/10.1038/s43247-021-00098-7 | www.nature.com/commsenvCOMMUNICATIONS EARTH & ENVIRONMENT | https://doi.org/10.1038/s43247-021-00098-7 ARTICLE
22. Kuramochi, T. et al. Beyond national climate action: the impact of region, city, 49. C-40 Cities for Climate Leadership. Consumption-based GHG emissions of
and business commitments on global greenhouse gas emissions. Clim. Policy C40 Cities. (2018).
https://doi.org/10.1080/14693062.2020.1740150 (2020). 50. Hsu, A. et al. Performance determinants show European cities are delivering
23. Widerberg, O. & Stripple, J. The expanding field of cooperative initiatives for on climate mitigation. Nat. Clim. Change (2020)
decarbonization: a review of five databases. vol. 7 (Wiley Interdisciplinary Rev. 51. Ibrahim, N., Sugar, L., Hoornweg, D. & Kennedy, C. Greenhouse gas
Climate Change). emissions from cities: Comparison of international inventory frameworks.
24. Hsu, A. et al. A research roadmap for quantifying non-state and subnational Local Environ. https://doi.org/10.1080/13549839.2012.660909 (2012).
climate mitigation action. Nat. Clim. Change https://doi.org/10.1038/s41558- 52. Palermo, Valentina; Bertoldi, Paolo; Apostolou, Malvina; Kona, Albana; Rivas,
018-0338-z (2019). S. Assessment of climate change mitigation policies in 315 cities in the
25. Kona, A., Bertoldi, P., Monforti-Ferrario, F., Rivas, S. & Dallemand, J. F. Covenant Covenant of Mayors initiative. Sustain. Cities Soc. (2020).
of mayors signatories leading the way towards 1.5 degree global warming 53. Widerberg, O. Mapping institutional complexity in the Anthropocene: A
pathway. Sustain. Cities Soc. https://doi.org/10.1016/j.scs.2018.05.017 (2018). network approach. in Environmental Politics and Governance in the
26. Pauw, W. P. et al. Beyond headline mitigation numbers: we need more Anthropocene: Institutions and legitimacy in a complex world. https://doi.org/
transparent and comparable NDCs to achieve the Paris Agreement on climate 10.4324/9781315697468 (2016).
change. Clim. Change https://doi.org/10.1007/s10584-017-2122-x (2018). 54. (EUCoM), E. C. of M. The Covenant of Mayors for Climate and Energy
27. Grimmer, J. & Stewart, B. M. Text as data: the promise and pitfalls of Reporting Guidelines. https://www.covenantofmayors.eu/IMG/pdf/
automatic content analysis methods for political texts. Polit. Anal. 21, 267–297 Covenant_ReportingGuidelines.pdf (2016).
(2013). 55. Initiative, S. T. Companies taking Action. (2020).
28. Blei, D. M., Ng, A. Y. & Jordan, M. I. Latent Dirichlet allocation. J. Mach. 56. Galaz, V., Crona, B., Österblom, H., Olsson, P. & Folke, C. Polycentric systems
Learn. Res. https://doi.org/10.1016/b978-0-12-411519-4.00006-9 (2003). and interacting planetary boundaries - Emerging governance of climate
29. Bowen, G. A. Document analysis as a qualitative research method. Qual. Res. change-ocean acidification-marine biodiversity. Ecol. Econ. https://doi.org/
J. https://doi.org/10.3316/QRJ0902027 (2009). 10.1016/j.ecolecon.2011.11.012 (2012).
30. Roberts, M. E. et al. Structural topic models for open‐ended survey responses. 57. Simmons, B. A., Dobbin, F. & Garrett, G. Introduction: the international
Am. J. Pol. Sci. 58, 1064–1082 (2014). diffusion of liberalism. International Organization https://doi.org/10.1017/
31. King, G. & Lowe, W. An Automated Information Extraction Tool for S0020818306060267 (2006).
International Conflict Data with Performance as Good as Human Coders: A 58. Gilardi, F. Four Ways We Can Improve Policy Diffusion Research. State Polit.
Rare Events Evaluation Design. Int. Organ. https://doi.org/10.1017/ Policy Q. https://doi.org/10.1177/1532440015608761 (2016).
s0020818303573064 (2003). 59. Andonova, L. B., Betsill, M. M. & Bulkeley, H. Transnational climate governance.
32. Bail, C. A. Combining natural language processing and network analysis to Glob. Environ. Politics https://doi.org/10.1162/glep.2009.9.2.52 (2009).
examine how advocacy organizations stimulate conversation on social media. 60. Acuto, M. & Rayner, S. City networks: breaking gridlocks or forging (new)
Proc. Natl. Acad. Sci. USA https://doi.org/10.1073/pnas.1607151113 (2016). lock-ins? Int. Aff. https://doi.org/10.1111/1468-2346.12700 (2016).
33. Farrell, J. Network structure and influence of the climate change counter- 61. Hakelberg, L. Governance by Diffusion: Transnational Municipal Networks
movement. Nat. Clim. Change https://doi.org/10.1038/nclimate2875 (2016). and the Spread of Local Climate Strategies in Europe. Glob. Environ. Politics
34. World Business Council for Sustainable Development (WBCSD) & World https://doi.org/10.1162/GLEP_a_00216 (2014).
Resources Institute (WRI). A Corporate Accounting and Reporting Standard. 62. Kern, K. & Bulkeley, H. Cities, Europeanization and multi-level governance:
Greenh. Gas Protoc. https://doi.org/10.1196/annals.1439.003 (2004). governing climate change through transnational municipal networks. J. Common
35. Guthrie, D., Allison, B., Liu, W., Guthrie, L. & Wilks, Y. A closer look at skip- Mark. Stud. https://doi.org/10.1111/j.1468-5965.2009.00806.x (2009).
gram modelling. in Proceedings of the 5th International Conference on 63. Lee, T. & Koski, C. Building green: local political leadership addressing climate
Language Resources and Evaluation, LREC 2006 (2006). change. Rev. Policy Res. https://doi.org/10.1111/j.1541-1338.2012.00579.x (2012).
36. Wasserman, S. Social Network Analysis in the Social and Behavioral Sciences. 64. Purdon, M. Advancing comparative climate change politics: Theory and
Soc. Netw. Anal. Methods Apl. (1994). method. Glob. Environ. Politics https://doi.org/10.1162/GLEP_e_00309 (2015).
37. Backman, C. A., Verbeke, A. & Schulz, R. A. The Drivers of Corporate Climate 65. Toly, N. J. Transnational municipal networks in climate politics: From global
Change Strategies and Public Policy: A New Resource-Based View Perspective. governance to global politics. Globalizations https://doi.org/10.1080/
Bus. Soc. https://doi.org/10.1177/0007650315578450 (2017). 14747730802252479 (2008).
38. Cadez, S., Czerny, A. & Letmathe, P. Stakeholder pressures and corporate 66. B Bernstein, S. & Hoffmann, M. The politics of decarbonization and the
climate change mitigation strategies. Bus. Strateg. Environ. https://doi.org/ catalytic impact of subnational climate experiments. Policy Sci. 51, 189–211
10.1002/bse.2070 (2019). (2018).
39. Walenta, J. The Limits to Private-sector Climate Change Action: The 67. Abbott, K. W. Strengthening the transnational regime complex for climate
Geographies of Corporate Climate Governance. Econ. Geogr. https://doi.org/ change. Transl Environ. Law. https://doi.org/10.1017/S2047102513000502
10.1080/00130095.2018.1474078 (2018). (2014).
40. Erickson, P., Lazarus, M., Chandler, C. & Schultz, S. Technologies, policies and 68. Carmin, J. A., Anguelovski, I. & Roberts, D. Urban climate adaptation in the
measures for GHG abatement at the urban scale. Greenh. Gas Meas. Manag. global south: planning in an emerging policy domain. J. Plan. Educ. Res.
https://doi.org/10.1080/20430779.2013.806866 (2013). https://doi.org/10.1177/0739456X11430951 (2012).
41. Reckien, D. et al. How are cities planning to respond to climate change? 69. Goldthau, A. Rethinking the governance of energy infrastructure: Scale,
Assessment of local climate plans from 885 cities in the EU-28. J. Clean. Prod. decentralization and polycentrism. Energy Res. Soc. Sci. https://doi.org/
https://doi.org/10.1016/j.jclepro.2018.03.220 (2018). 10.1016/j.erss.2014.02.009 (2014).
42. Weinhofer, G. & Hoffmann, V. H. Mitigating climate change - How do 70. Gore, C. D. The limits and opportunities of networks: municipalities and
corporate strategies differ? Bus. Strateg. Environ. https://doi.org/10.1002/ Canadian climate change policy. Rev. Policy Res. https://doi.org/10.1111/
bse.618 (2010). j.1541-1338.2009.00425.x (2010).
43. Gouldson, A. & Sullivan, R. Long-term corporate climate change targets: 71. Michaelowa, K. & Michaelowa, A. Transnational climate governance
What could they deliver? Environ. Sci. Policy https://doi.org/10.1016/j. initiatives: designed for effective climate change mitigation? Int. Interact. 43,
envsci.2012.11.013 (2013). 129–155 (2017).
44. Sullivan, R. & Gouldson, A. The Governance of Corporate Responses to 72. Richardson, L. Beautiful soup. (2007).
Climate Change: An International Comparison. Bus. Strateg. Environ. https:// 73. Hsu, A., Cheng, Y., Weinfurter, A., Xu, K. & C. Yick. Track climate pledges of
doi.org/10.1002/bse.1925 (2017). cities and companies. Nature 532, 303–305 (2016).
45. Melica, G. et al. Multilevel governance of sustainable energy policies: The role 74. Lewis, D. D., Yang, Y., Rose, T. G. & Li, F. RCV1: a new benchmark collection
of regions and provinces to support the participation of small local authorities for text categorization research. J. Mach. Learn. Res. (2004).
in the Covenant of Mayors. Sustain. Cities Soc. https://doi.org/10.1016/j. 75. Roberts, M. E., Stewart, B. M., Dustin, P. & Harvard, T. stm: R Package for
scs.2018.01.013 (2018). Structural Topic Models. J. Stat. Softw. https://doi.org/10.18637/jss.v000.i00
46. Heidrich, O. et al. National climate policies across Europe and their impacts (2014).
on cities strategies. J. Environ. Manage. https://doi.org/10.1016/j. 76. Arora, S. et al. A practical algorithm for topic modeling with provable
jenvman.2015.11.043 (2016). guarantees. in 30th International Conference on Machine Learning, ICML
47. Reckien, D. et al. Dedicated versus mainstreaming approaches in local climate 2013 (2013).
plans in Europe. Renew. Sustain. Energy Rev. https://doi.org/10.1016/j. 77. Roberts, M. E., Stewart, B. M. & Tingley, D. Navigating the Local Modes of Big
rser.2019.05.014 (2019). Data: The Case of Topic Models. Comput. Social Sci. https://doi.org/10.1017/
48. Berrang-Ford, L. et al. Tracking global climate change adaptation among cbo9781316257340.004 (2016).
governments. Nat. Climate Change https://doi.org/10.1038/s41558-019-0490- 78. Mimno, D., Wallach, H. M., Talley, E., Leenders, M. & McCallum, A.
0 (2019). Optimizing semantic coherence in topic models. in EMNLP 2011 -
COMMUNICATIONS EARTH & ENVIRONMENT | (2021)2:30 | https://doi.org/10.1038/s43247-021-00098-7 | www.nature.com/commsenv 11You can also read