Impact of reduced anthropogenic emissions during COVID-19 on air quality in India
←
→
Page content transcription
If your browser does not render page correctly, please read the page content below
Atmos. Chem. Phys., 21, 4025–4037, 2021
https://doi.org/10.5194/acp-21-4025-2021
© Author(s) 2021. This work is distributed under
the Creative Commons Attribution 4.0 License.

Impact of reduced anthropogenic emissions
during COVID-19 on air quality in India
Mengyuan Zhang1 , Arpit Katiyar2 , Shengqiang Zhu1 , Juanyong Shen3 , Men Xia4 , Jinlong Ma1 , Sri Harsha Kota2 ,
Peng Wang4 , and Hongliang Zhang1,5
1 Department    of Environmental Science and Engineering, Fudan University, Shanghai 200438, China
2 Department    of Civil Engineering, Indian Institute of Technology, Delhi, 110016, India
3 School of Environmental Science and Engineering, Shanghai Jiao Tong University, Shanghai 200240, China
4 Department of Civil and Environmental Engineering, The Hong Kong Polytechnic University,

Hong Kong SAR, 99907, China
5 Institute of Eco-Chongming (IEC), Shanghai 200062, China

Correspondence: Peng Wang (peng.ce.wang@polyu.edu.hk) and Hongliang Zhang (zhanghl@fudan.edu.cn)

Received: 28 August 2020 – Discussion started: 9 October 2020
Revised: 8 February 2021 – Accepted: 8 February 2021 – Published: 17 March 2021

Abstract. To mitigate the impacts of the pandemic of coro-        1   Introduction
navirus disease 2019 (COVID-19), the Indian government
implemented lockdown measures on 24 March 2020, which
prohibited unnecessary anthropogenic activities, thus lead-       India, the second-most populous country in the world, has
ing to a significant reduction in emissions. To investigate the   been suffering from severe air pollution along with rapid ur-
impacts of this lockdown measure on air quality in India,         banization and industrialization in recent decades (Karam-
we used the Community Multi-Scale Air Quality (CMAQ)              belas et al., 2018), and 13 Indian cities were among the
model to estimate the changes of key air pollutants. From         world’s top 20 most polluted cities according to the World
pre-lockdown to lockdown periods, improved air quality is         Health Organization (WHO) (WHO, 2018). High-level pol-
observed in India, indicated by the lower key pollutant levels    lution leads to health risks and ecosystem damage, which
such as PM2.5 (−26 %), maximum daily 8 h average ozone            caused 1.24 million deaths in India in 2017 (Balakrishnan et
(MDA8 O3 ) (−11 %), NO2 (−50 %), and SO2 (−14 %).                 al., 2019) and a great loss of crops (Oksanen et al., 2013; Lal
In addition, changes in these pollutants show distinct spa-       et al., 2017). To mitigate air pollution, the Indian government
tial variations with the more important decrease in northern      has been promoting effective emission control strategies such
and western India. During the lockdown, our results illus-        as the conversion of fossil fuels to clean fuels in the nation-
trate that such emission reductions play a positive role in the   wide Clean India Mission (CIM). However, such long-term
improvement of air quality. Significant reductions of PM2.5       or short-term reduction strategies seem to show insufficiency
concentration and its major components are predicted, espe-       in the restoration of ambient air quality (Beig et al., 2013;
cially for secondary inorganic aerosols that are up to 92 %,      Purohit et al., 2019; Banerjee et al., 2017).
57 %, and 79 % for nitrate (NO−                   2−                 Due to the pandemic of coronavirus disease 2019
                                  3 ), sulfate (SO4 ), and am-
               +
monium (NH4 ), respectively. On average, the MDA8 O3              (COVID-19), nationwide or partial lockdown measures have
also decreases 15 % during the lockdown period although           been implemented in many countries (Chintalapudi et al.,
it increases slightly in some VOC-limited urban locations,        2020; Dantas et al., 2020; Ehrlich et al., 2020). The Indian
which is mainly due to the more significant reduction of NOx      government declared corresponding bans since the detection
than VOCs. More aggressive and localized emission control         of the first confirmed case on 30 January 2020. Then, to
strategies should be implemented in India to mitigate air pol-    counter the fast contagion of COVID-19, a 3-week nation-
lution in the future.                                             wide lockdown was imposed in India on 24 March, which
                                                                  was extended until 30 June. The lockdown measures miti-

Published by Copernicus Publications on behalf of the European Geosciences Union.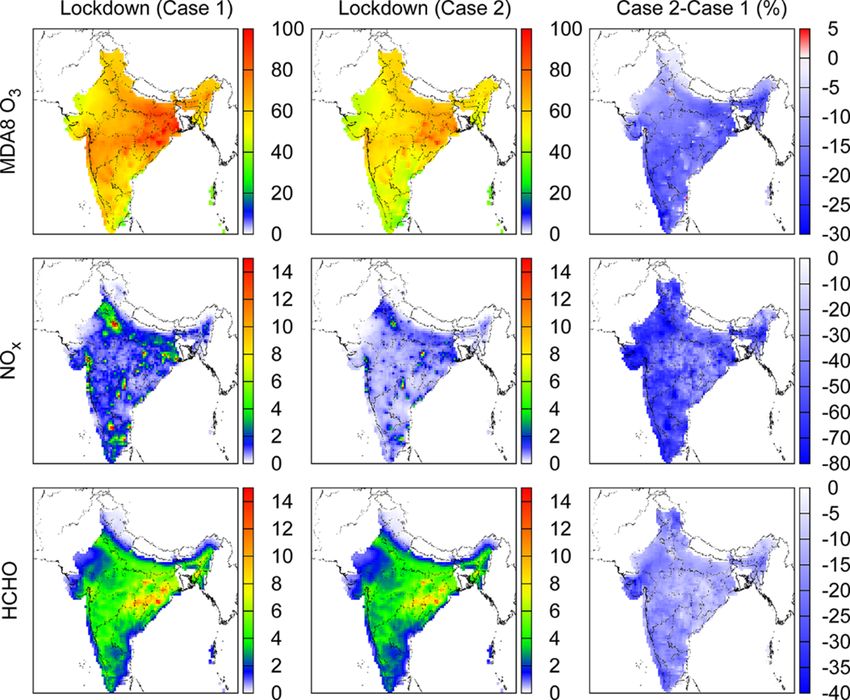
4026              M. Zhang et al.: Impact of reduced anthropogenic emissions during COVID-19 on air quality in India

gate the impact of COVID-19 on Indian health infrastructure        ever, the role of meteorological conditions and chemical re-
and it also helped in curbing the rate of the spread of this in-   actions involving changes in air quality is not clear from
fectious disease among people (Pai et al., 2020; Anderson et       these observation-based studies, which only showed the phe-
al., 2020). Because of the prohibition of industrial activities    nomenon of concentration reduction and switch of major pri-
and mass transportation, anthropogenic emissions showed a          mary pollutants mainly in urban cities. Further, the number
tremendous reduction. As well as this, several studies showed      of monitoring stations in the country is way below the guide-
that dramatic emission reductions had an enormous impact           lines given by the governing bodies and not uniformly dis-
on the formation of air pollution and positively influenced air    tributed, which results in observation data limitations in India
quality (Isaifan, 2020; Bao and Zhang, 2020; Gautam, 2020).        (Sahu et al., 2020).
Thus, the lockdown also provides a valuable opportunity to            In this study, the Community Multi-Scale Air Quality
assess the changes in air pollutants with significantly reduced    (CMAQ) model was used to investigate changes in air pol-
anthropogenic emissions in a short time.                           lutants before the lockdown (from 21 February to 23 March
   Conspicuous reductions in concentrations of pollutants          2020) and during the lockdown (from 24 March to 24 April
were also claimed in different regions (Otmani et al., 2020;       2020) periods throughout the Indian region. We explored the
Dantas et al., 2020; Nakada and Urban, 2020). Most Indian          synergetic impacts from the meteorological conditions and
studies claimed the greatest reduction of particulate matter       anthropogenic emissions during the pre-lockdown and lock-
with an aerodynamic diameter of less than 2.5 µm (PM2.5 ),         down periods. As well as this, we directly quantified the
up to 50 % (Kumar et al., 2020; Mahato et al., 2020; Sharma        change in air quality during the lockdown due to the reduced
et al., 2020). However, an increase in ozone (O3 ) concen-         anthropogenic emissions by comparing the differences be-
trations was observed (Collivignarelli et al., 2020; Sicard et     tween Case 1 (without emission reductions) and Case 2 (with
al., 2020) and severe air pollution events still occurred after    emission reductions). The model performance was evalu-
large emission reductions due to unfavorable meteorologi-          ated by comparing the simulation results with the observa-
cal conditions (Wang et al., 2020). Moreover, another analy-       tion data, which is collected by the Central Pollution Control
sis showed that the effects of lockdown during the COVID-          Board (CPCB). This study has important implications for de-
19 pandemic on PM2.5 and O3 pollution levels were smaller          veloping control strategies to improve air quality in India.
than the expected response to the enacted stay-at-home order
(Bujin et al., 2020). Hence, the significance and impacts of
lockdown measures are still not well understood.                   2     Methodology
   Therefore, it is significant to understand the mechanisms
                                                                   2.1    Data collection
involved in air pollution formation before and after dramatic
emission changes comprehensively, in addition to the com-          We used observed hourly PM2.5 , O3 , carbon monoxide
parison of air pollution levels. Mahato et al. (2020) con-         (CO), and nitrogen dioxide (NO2 ) data from 21 February to
cluded that air quality in India from 24 March to 14 April im-     24 April 2020 from the CPCB online database (https://app.
proved sharply according to the change of the National Air         cpcbccr.com/ccr/#/caaqm-dashboard-all/caaqm-landing, last
Quality Index, especially for Delhi. Srivastava et al. (2020)      access: 20 January 2021), which is widely applied in previ-
reported the concentrations of primary air pollutants were         ous studies (Kumar, 2020; Sharma et al., 2020; Srivastava et
drastically lowered as a result of emission reductions. Ku-        al., 2020; Shehzad et al., 2020). The CPCB database provides
mari and Toshniwal (2020) also stated that the concentration       data quality assurance (QA) or quality control (QC) pro-
of key pollutants such as PM2.5 in both Delhi and Mumbai           grams by establishing strict procedures for sampling, anal-
shows a decreasing trend. These studies pointed out that the       ysis, and calibration (Gurjar et al., 2016). As well as this,
air quality was improved during the lockdown period com-           the observed daily averages of PM2.5 and maximum daily
pared with the period before lockdown and depends on the           8 h average ozone (MDA8 O3 ) have been further calculated
duration of the lockdown (Kumar et al., 2020; Mor et al.,          to analyze the change in air quality during the pre-lockdown
2021). As well as this, compared with the same period in           (from 21 February to 23 March 2020) and lockdown (from
previous years, Gautam (2020) claimed that aerosol concen-         24 March to 24 April 2020). The satellite-observed NO2
tration levels are at their lowest in the last 20 years during     and formaldehyde (HCHO) column number density datasets
lockdown based on satellite data. Selvam et al. (2020) stated      are from the Sentinel-5 Precursor TROPOspheric Monitoring
that the Air Quality Index (AQI) was improved by 58 % in           Instrument (S-5P TROPOMI) (https://scihub.copernicus.eu,
Gujarat state in western India during lockdown (24 March–          last access: 7 February 2021). As well as this, we effectively
20 April 2020) compared to 2019. Kabiraj and Gavli (2020)          removed the pixels with a QA value less than 0.75 for NO2
concluded that the mean concentration of PM2.5 decreased           tropospheric column density and 0.5 for HCHO from the
by 42.25 % from January to May in 2020 compared with               datasets to exclude the interferences such as clouds and snow
2019. Similarly, Das et al. (2020) also showed that great          or ice (Apituley et al., 2018).
reductions of PM2.5 were found across cities in the Indo-
Gangetic Plain (IGP) compared with 2018 and 2019. How-

Atmos. Chem. Phys., 21, 4025–4037, 2021                                              https://doi.org/10.5194/acp-21-4025-2021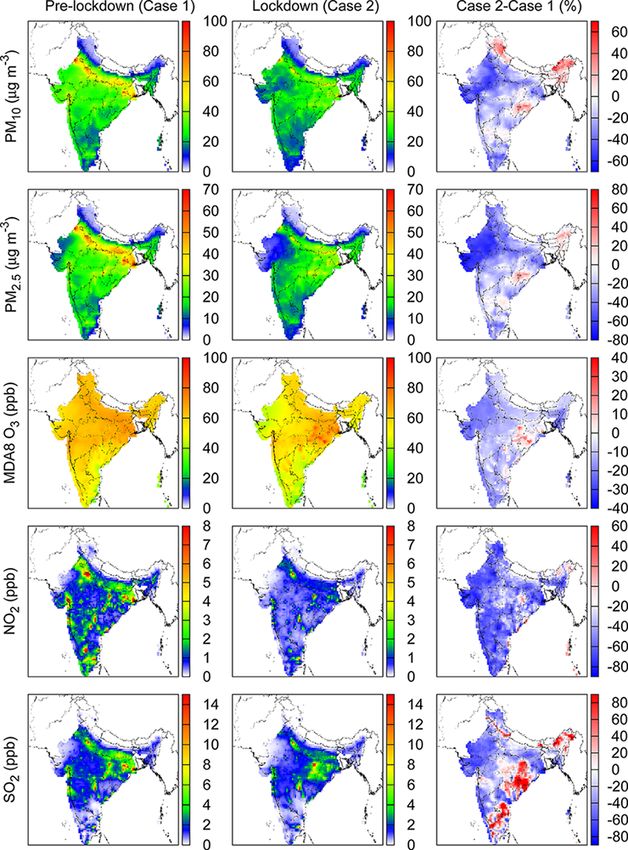
M. Zhang et al.: Impact of reduced anthropogenic emissions during COVID-19 on air quality in India                                         4027

                                                                    Table 1. The criteria on the “range of pollution index” for the pur-
                                                                    pose of categorization of industrial sectors.

                                                                                Categories∗                       Pollution index
                                                                                                                            score
                                                                                Very polluting (VP)                            ≥ 60
                                                                                Medium polluting (MP)                         41–59
                                                                                Low polluting (LP)                            21–40
                                                                              Note: ∗ VP, MP, and LP industries are also defined as the
                                                                              red, orange, and green categories of industrial sectors
                                                                              respectively, based on the Indian Ministry of Environment,
                                                                              Forest and Climate Change website (https:
                                                                              //pib.gov.in/newsite/printrelease.aspx?relid=137373).

                                                                    biomass burning for 2018 were based on the Fire Inventory
                                                                    from the National Center for Atmospheric Research (FINN)
                                                                    (Wiedinmyer et al., 2011).

Figure 1. The simulation domain with the location of major Indian   2.3   Emission reduction during COVID-19
cities selected for analysis.
                                                                    Due to the COVID-19 lockdown, human activities were lim-
                                                                    ited and related anthropogenic emissions were reduced. Dif-
                                                                    ferent sources were used to obtain changes in anthropogenic
2.2   Model description
                                                                    emissions from different sectors in comparison to 2019.
                                                                       For the sectors of on-road and off-road, the vehicle emis-
This study applied CMAQ (Byun and Schere, 2006) ver-
                                                                    sion changes were based on the number of registered vehicles
sion 5.0.2 with an updated SAPRC-11 photochemical mech-
                                                                    verified from the article (ET Bureau, 2020). The changes in
anism (Carter, 2011; Hu et al., 2016) and aerosol mod-
                                                                    energy demand were obtained from official data released by
ule (AERO6) (Binkowski and Roselle, 2003) to simulate
                                                                    the Power System Operation Corporation (POSOCO) (Abdi,
air pollution across India with a horizontal resolution of
                                                                    2020). Residential and agricultural emissions remain un-
36 km × 36 km (117 × 117 grid cells). Figure 1 shows the
                                                                    changed due to a lack of sufficient information.
simulation domain with positions of the main Indian cities.
                                                                       For the industrial sector, we classify the Indian in-
The simulation was conducted from 21 February to 23 March
                                                                    dustries into three different classes based on the de-
as a pre-lockdown and 24 March to 24 April as a lockdown
                                                                    gree of air pollution caused (https://www.indianmirror.com/
period.
                                                                    indian-industries/environment.html, last access: 7 Febru-
   The Weather Research & Forecasting model (WRF) ver-
                                                                    ary 2021) (Table S4) including very polluting (VP), medium
sion 3.6.1 was utilized to generate meteorology fields driven
                                                                    polluting (MP), and low polluting (LP) industries. The pol-
by the latest FNL (Final) Operational Global Analysis
                                                                    lution index (PI) of any industry is a number ranging from
data. Anthropogenic emissions were from the monthly data
                                                                    0 to 100 and the increasing value of PI denotes the increas-
from the Emissions Database for Global Atmospheric Re-
                                                                    ing degree of pollution load from the industry. As well as
search (EDGAR) version 4.3 (http://edgar.jrc.ec.europa.eu/
                                                                    this, CPCB, State Pollution Control Boards (SPCBs), and
overview.php?v=431, last access: 20 September 2020). The
                                                                    the Ministry of Environment, Forest and Climate Change
monthly emissions from different source sectors were di-
                                                                    (MoEFCC) have finalized the criteria on the range of PI for
vided into six major groups, residential, industrial, agricul-
                                                                    the purpose of categorization of the industrial sector (https:
ture, on-road, off-road, and energy, before being adjusted
                                                                    //pib.gov.in/newsite/printrelease.aspx?relid=137373, last ac-
from the base year of 2010 to 2019 based on population
                                                                    cess: 7 February 2021) (Table 1).
and economic growths similar to Guo et al. (2017), and the
                                                                       Based on the above definition of the VP, MP, and LP in-
adjustment factors are shown in Tables S1–S3 in the Sup-
                                                                    dustry, the emissions before lockdown can be expressed as
plement. Weekly and diurnal profiles were used to convert
                                                                    follows:
monthly emissions to hourly inputs, and the US EPA’s SPE-
CIATE 4.3 source profiles were used to speciate total partic-       E1 = NVP-pre × SVP + NMP-pre × SMP + NLP-pre × SLP , (1)
ulate matter (PM) and volatile organic compounds (VOCs)
to model species (Wang et al., 2014).                               where SVP , SMP , and SLP are 1, 0.6, and 0.4 as the assigned
   The biogenic emissions were derived from The Model of            scores, and NVP-pre , NMP-pre , and NLP-pre are the number of
Emissions of Gases and Aerosols from Nature (MEGAN)                 each category industry before the lockdown. Similarly, the
version 2.1 (Guenther et al., 2012), and the emissions from         emissions during the lockdown are as follows:

https://doi.org/10.5194/acp-21-4025-2021                                               Atmos. Chem. Phys., 21, 4025–4037, 2021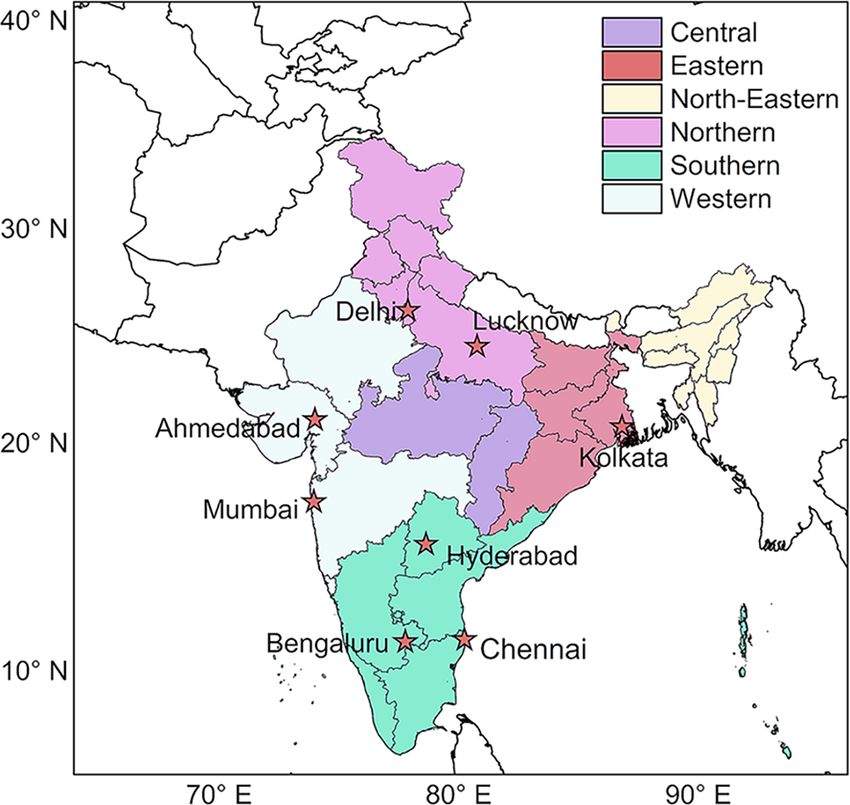
4028               M. Zhang et al.: Impact of reduced anthropogenic emissions during COVID-19 on air quality in India

Table 2. Percentage reduction in anthropogenic emissions in India   (lockdown), satisfying the suggested criteria of 2.0 %, and
during the COVID-19 lockdown.                                       RMSE was slightly over the criteria. The MB values for
                                                                    WD were 3.2 and 2.6◦ during the two periods, which are
               Sector        Percentage reduction                   within the criteria of ±10◦ . The GE and RMSE for WD were
               Residential                      0                   slightly out of the benchmarks. The under-predicted RH was
               Industrial                      82                   also observed in this study, which was reported in other Asian
               Agriculture                      0                   studies (Hu et al., 2015). Those statistic values that did fall in
               On-road                         85                   the benchmark were mainly due to the resolution (36 km) ap-
               Off-road                        85                   plied in this study compared to the finer resolution (4–12 km)
               Energy                          26                   suggested in Emery et al. (2001) and Sahu et al. (2020).
                                                                       Table S7 shows the model performance of MDA8 O3 ,
                                                                    PM2.5 , CO, and NO2 in five major cities in India includ-
                                                                    ing Delhi, Mumbai, Chennai, Hyderabad, and Bengaluru.
E2 = NVP-lock × SVP + NMP-lock × SMP + NLP-lock × SLP , (2)         For PM2.5 , after excluding some abnormally high values of
                                                                    greater than 300 µg m−3 , the averaged mean fractional bias
where NVP-lock , NMP-lock , and NLP-lock are the number of          (MFB) (−0.48) and mean fractional error (MFE) (0.61) val-
functioning industries during the lockdown. Therefore, the          ues in all the five urban cites met the criteria limits of ±0.6
percentage reduction of industrial emissions can be calcu-          and 0.75 claimed by the EPA (2007). And the recommended
lated as follows:                                                   criteria are commonly used for validating air quality model
                                                                    performance in the Indian region (Mohan and Gupta, 2018;
                E1 − E2                                             Kota et al., 2018). For O3 , a cut-off value of 40 ppb is applied,
%reduction =            × 100.                               (3)
                  E1                                                which is based on EPA’s recommendations (EPA, 2005). As
                                                                    well as this, the model was able to reproduce the variation
In this study, two sensitivity simulations were conducted dur-
                                                                    trends of observed hourly O3 in all these major cities, al-
ing the lockdown periods. Case 1 assumes business as usual
                                                                    though slightly over-estimations have occurred. And aver-
with the same emissions as in 2019, while Case 2 adjusts an-
                                                                    aged MFB (−0.05) and MFE (0.25) values of O3 also satisfy
thropogenic emissions using factors obtained above for dif-
                                                                    the benchmarks of ±0.15 and 0.30 set by the EPA (2005) in
ferent sectors (Table 2). The differences between Case 2 and
                                                                    most of these cities with Chennai and Hyderabad exceeding
Case 1 can be assumed as the effects of COVID-19 lock-
                                                                    the limits slightly. The performance of PM2.5 , NO2 , O3 , and
downs.
                                                                    CO in these urban areas was also similar to Kota et al. (2018),
                                                                    which could provide robust results for the following air qual-
3     Results and discussion                                        ity study.
                                                                       To further validate modeled HCHO and NO2 , we com-
3.1    WRF-CMAQ model validation                                    pared our simulated results with satellite-observed data dur-
                                                                    ing pre-lockdown and lockdown periods (Fig. S1). The
Meteorology plays an important role in emissions, trans-            CMAQ predicted vertical column densities (VCDs) of tropo-
port, deposition, and formation of air pollutants (Zhang et         spheric NO2 and HCHO were calculated using Eq. (4) (Eskes
al., 2015). Hence, the performance of WRF is validated to           et al., 2020).
ensure accurate air pollution simulation against available ob-                Xn
servation from the National Climate Data Center (NCDC).             VCD =            C × Hi × α,
                                                                                  i=1 i
                                                                                                                                   (4)
There are more than 1300 stations within the simulation do-
main with hourly observations. The variables considered in-         where n equals 17 as the number of vertical layers in the
clude temperature at 2 m above the surface (T2), wind speed         model (with the highest layer height of ∼ 10 km), Ci means
(WS), wind direction (WD), and relative humidity (RH). Ta-          species concentration (ppm), Hi represents each layer height
ble S5 shows the statistics of mean observation and mean            (m), and α is the coefficient for converting units from ppm
prediction of meteorological parameters, along with mean            to molec. cm−2 . The predicted regional distribution of tro-
bias (MB), gross error (GE), and root mean squared error            pospheric column NO2 and HCHO is similar to satellite ob-
(RMSE), which are compared to benchmarks suggested by               servations. Overall, HCHO and NO2 are higher in eastern
Emery et al. (2001). All the statistical indexes are listed in      and northern India than in other regions. And their varia-
Table S6.                                                           tion trends from CMAQ and TROPOMI are consistent so that
   In general, the WRF model performance is similar to              NO2 decreases while HCHO increases during the lockdown.
previous studies in India (Kota et al., 2018). For the pre-         We also acknowledge that the uncertainty of the emission in-
lockdown and lockdown period, predicted T2 was under-               ventory and chemical mechanism in the modeling may affect
estimated with MB values of −1.5 and −1.2 K, respectively.          the simulated results (Dominutti et al., 2020; Kitayama et al.,
The GE values for WS were 1.7 % (pre-lockdown) and 1.8 %            2019).

Atmos. Chem. Phys., 21, 4025–4037, 2021                                               https://doi.org/10.5194/acp-21-4025-2021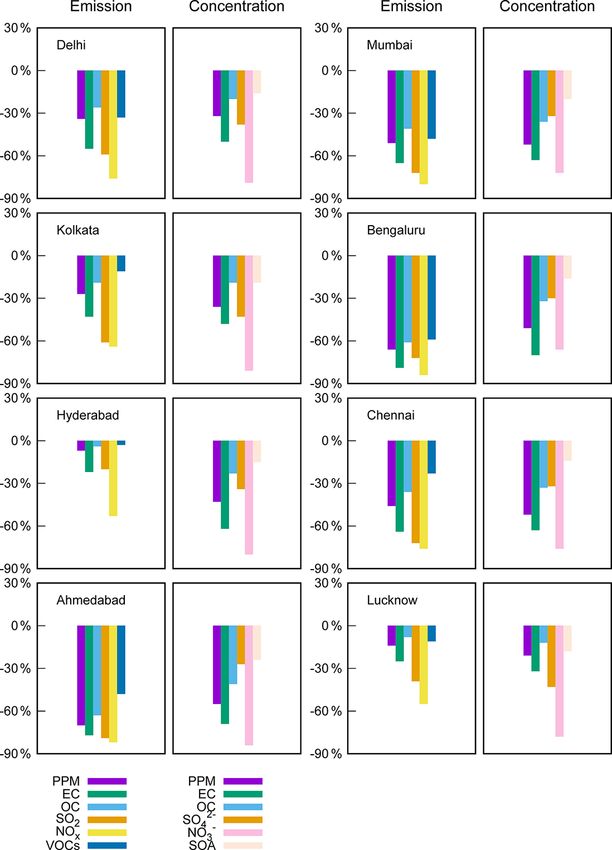
M. Zhang et al.: Impact of reduced anthropogenic emissions during COVID-19 on air quality in India                         4029

3.2   Changes in air quality from pre-lockdown to
      lockdown periods

Figure 2 shows predicted and observed PM2.5 from 21 Febru-
ary to 24 April in Delhi, Mumbai, Chennai, Hyderabad, and
Bengaluru. The model succeeds in estimating the observed
peak and valley values with slight under-estimation in all
these cities. Overall, sharp decreases are found in the ob-
served PM2.5 in all these cities, and the averaged PM2.5
level drops from 43.18 to 27.62 µg m−3 . The mean observed
PM2.5 concentrations during lockdown are 42.47 µg m−3
(Delhi), 24.53 µg m−3 (Mumbai), 15.73 µg m−3 (Chennai),
31.29 µg m−3 (Hyderabad), and 24.08 µg m−3 (Bengaluru),
which are reduced by 41 %, 40 %, 42 %, 10 %, and 43 % re-
spectively compared with that of the pre-lockdown period.
As well as this, the observed peak values of PM2.5 in each
city also decrease appreciably (up to 57 %) during the lock-
down period. On 24 March, the first day of lockdown, a sig-
nificant drop in PM2.5 concentration due to the emission re-
duction of primary pollutants is observed (Fig. S2). However,
most of the PM2.5 concentrations are still above the WHO an-
nual guideline values of 10 µg m−3 (WHO, 2016) during the
lockdown period, with peak values over 60 µg m−3 occasion-
ally.
   Figure 3 shows the temporal variation of MDA8 O3 in
these five cities. The predicted MDA8 O3 is consistent in
trend with observation values on most days, while simulated
concentrations are overall higher, particularly in Hyderabad.
The observed average MDA8 O3 during lockdown is higher
than that before the lockdown in Delhi (2 %), Hyderabad            Figure 2. Comparison of predicted and observed PM2.5 from
(12 %), and Bengaluru (2 %). This is likely due to the fact that   21 February to 24 April 2020 in Delhi, Mumbai, Chennai, Hyder-
O3 formation in these cities is under VOC control (Sharma          abad, and Bengaluru. The unit is µg m−3 .
et al., 2020), and a nitrogen oxide (NOx ) reduction leads to
an O3 increase by enhanced hydrogen oxide radical (HOx )
concentrations (Zhao et al., 2017). The increase in monthly        with reductions of PM2.5 and PM10 of up to 79 %. In par-
average T2 from before the lockdown (281.0 K) to lockdown          ticular, the most significant decreases during the lockdown
(285.1 K) could also lead to an increase in O3 (Chen et al.,       are found in the populated, industrialized, and polluted IGP
2019). In contrast, the observed average MDA8 O3 during            region. The average PM2.5 even drops from approximately
lockdown is reduced compared with the pre-lockdown period          35–70 µg m−3 (pre-lockdown) to 15–40 µg m−3 (lockdown)
in both Mumbai (−35 %) and Chennai (−13 %). This could             in these regions because local emissions are generally the
be caused by a much larger reduction in emissions as Mum-          largest contributor (38 %–78 %) to PM2.5 in India (David
bai and Chennai with high urbanization and industrialization       et al., 2019). However, increases in these key pollutants are
are the most affected areas. Specifically, more stringent lock-    found mainly in the northeastern, eastern, and parts of south-
down measures may be implemented in Mumbai than we as-             ern India.
sumed, which accounted for more than a fifth of infections in         As well as this, changes in PM2.5 also show prominent
India (Mukherjee, 2020).                                           differences in the rural and urban areas. In India, rural ar-
   Figure 4 shows the comparison of predicted air pollu-           eas have different emission sources from urban areas and
tants before and during the lockdown throughout India.             are less influenced by lockdown measures (Garaga et al.,
Generally, decreases in key pollutants including particulate       2020). In megacities such as Delhi, the predicted concentra-
matter with an aerodynamic diameter of less than 10 µm             tions of PM2.5 declined during the lockdown, which is con-
(PM10 ) (−16 %), PM2.5 (−26 %), MDA8 O3 (−11 %), NO2               sistent with previous results (Kumari and Toshniwal, 2020;
(−50 %), and sulfur dioxide (SO2 ) (−14 %) are calculated          Chauhan and Singh, 2020). For instance, a reduction of over
across India. Changes in these pollutants present distinct re-     60 % in PM2.5 is estimated in Delhi and Ahmedabad. How-
gional variations. In northern and western India, the lower        ever, increases in PM2.5 (∼ 20 %) are observed in the remote
levels of these pollutants are observed during the lockdown,       northeastern part of India. Variations in near-surface mete-

https://doi.org/10.5194/acp-21-4025-2021                                           Atmos. Chem. Phys., 21, 4025–4037, 2021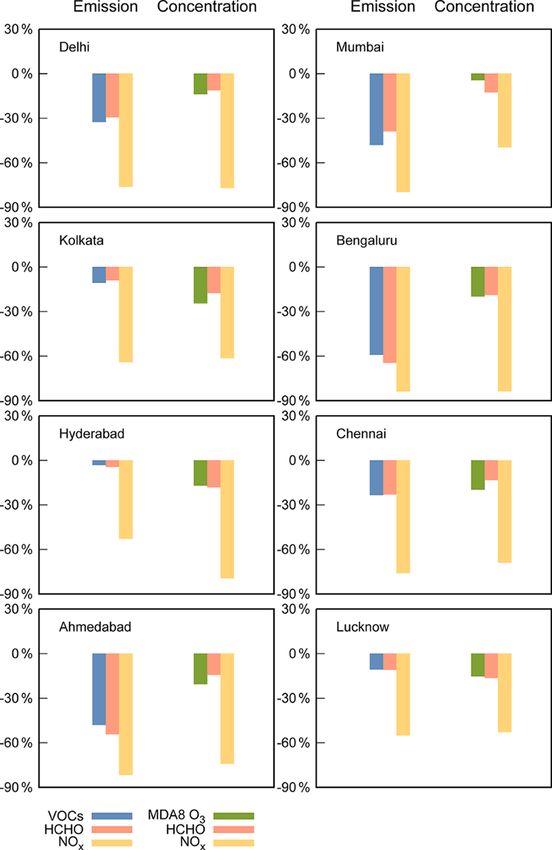
4030              M. Zhang et al.: Impact of reduced anthropogenic emissions during COVID-19 on air quality in India

                                                                 Figure 4. Predicted PM10 (µg m−3 ), PM2.5 (µg m−3 ), MDA8 O3
Figure 3. Comparison of predicted and observed MDA8 O3 from      (ppb), NO2 (ppb), and SO2 (ppb) before lockdown, during the lock-
21 February to 24 April 2020 in Delhi, Mumbai, Chennai, Hyder-   down and the changes between them in India. “Case 2 − Case 1”
abad, and Bengaluru. The unit is ppb.                            indicates (Case 2 − Case 1) / Case 1, reported as %.

orological factors during lockdown also play an important        duces them (Chen et al., 2019; Zhao et al., 2017; Ali et al.,
role in PM2.5 changes. As is shown in Fig. S3, lower PM2.5       2012).
in urban areas during lockdown (Fig. 4) may be attributed to        In summary, the decrease in PM2.5 , PM10 , NO2 , and SO2
the decrease in RH and increase in planetary boundary layer      and the increase in MDA8 O3 during lockdown are consis-
(PBL) height, while the decrease in precipitation and WS al-     tent with previous results (Srivastava et al., 2020; Mahato et
lows PM2.5 to accumulate in some rural areas (Schnell et al.,    al., 2020). In the case of Delhi, compared with the previ-
2018; Le et al., 2020).                                          ous studies, the PM2.5 reduction (34 %) is comparable with
   As gaseous precursors of major components to PM2.5 (Jain      35 % reported by Chauhan and Singh (2020), with less than
et al., 2020), concentrations of NO2 and SO2 also decrease       53 % stated by Mahato et al. (2020) and 49 % calculated by
significantly in most regions by up to 90 % and 87 %, respec-    Kumari and Toshniwal (2020) during the first phase of lock-
tively. However, their levels increase in parts of eastern and   down (from 24 March to 15 April 2020). These differences
southern India, thus leading to higher levels of PM2.5 and       may be caused by the considered duration of the lockdown
PM10 in the same regions. MDA8 O3 is also rising in eastern      period. Our study concerns the later lockdown period (af-
India by the highest increasing rate of 29 %, while a 30 % re-   ter 15 April 2020) when there is an increase in traffic flow
duction is observed in northern and western India. Although      and some relaxation of lockdown measures (Kumar, 2020).
significant reductions are found in O3 precursor emissions       Moreover, the different characteristics of these air pollutants
throughout India during the lockdown, the MDA8 O3 has not        in rural and urban areas have not been investigated compre-
shown a comparable decrease, which is affected by meteo-         hensively in previous studies. Kumari and Toshniwal (2020)
rological conditions such as an increase in temperature and      also concluded that concentrations of PM10 , PM2.5 , and SO2
decrease in RH (Fig. S3). Higher temperatures speed up pho-      tended to rise in Singrauli (rural area, located in central In-
tochemical processes that produce O3 , while a higher RH re-     dia) during the lockdown, contrary to the results of Delhi and

Atmos. Chem. Phys., 21, 4025–4037, 2021                                            https://doi.org/10.5194/acp-21-4025-2021
M. Zhang et al.: Impact of reduced anthropogenic emissions during COVID-19 on air quality in India 4031
primary organic aerosols (POAs), and secondary organic
aerosols (SOAs) decreased significantly in Case 2 compared
to Case 1, indicating the positive effects of emission reduc-
tion. Primary components of PM2.5 (EC and POAs) are low-
ered by an average of 37 % and 14 %, respectively. EC is
usually emitted from combustion sources and a drastic de-
crease of up to 74 % directly reflected the impact of emission
reductions from industry and transportation. Secondary inor-
2−
ganic aerosols (SIAs) including NO− +
3 , SO4 , and NH4 and
SOAs accounted for most of the PM2.5 bulk mass (39 %) and
showed greater decreases than primary components. More-
over, the spatial distribution of SIAs is similar to PM2.5 in
that the reduction is more significant in the north of India
2−
where the decrease in NO− +
3 , SO4 , and NH4 are up to 92 %,
57 %, and 79 % respectively. The largest reduction of NO− 3,
averaging 62 %, resulted from transportation reduction, and
the SO2−4 reduction (averaging 31 %) is likely due to the
falling industry emissions (Gawhane et al., 2017; Wang et al.,
2020). On average, NH+ 4 and SOAs are decreased by 41 %
and 14 %, respectively. The significant decrease in NH+ 4 can-
not be attributed to the absence of reduced agricultural emis-
sions in the simulation but may be due to the relatively re-
duced (NH4 )2 SO4 and NH4 NO3 in the CMAQ chemistry-
transport model (Fountoukis and Nenes, 2007). By contrast,
compared with VOCs, an important precursor of SOAs, the
smaller reduction of SOAs may be related to the weakening
of the atmospheric oxidizing capacity (AOC), which plays an
important role in the formation of SOAs (Feng et al., 2019).
As well as this, the reduction of NOx may lead to an increase
in SOAs offsetting some of the influence by the reduction in
VOC emissions (Kroll et al., 2020).
Figure 6 shows the predicted response of changes in con-
centration of primary PM2.5 (PPM) and secondary compo-
Figure 5. Predicted PM2.5 components and the changes caused nents to the reduced emissions of related precursors in Delhi,
by lockdown measures from 24 March to 24 April 2020 Mumbai, Kolkata, Bengaluru, Hyderabad, Chennai, Ahmed-
in India. The unit is µg m−3 . “Case 2 − Case 1” indicates abad, and Lucknow. Generally, all species decreased with the
(Case 2 − Case 1) / Case 1, reported as %.
reduced emissions and the great sensitivity of PM2.5 compo-
nent concentrations to emissions showed the important role
of meteorology and the effectiveness of stringent measures
Mumbai. Therefore, our results have important implications to reduce emissions.
for the study of air quality changes and their regional distri- On average, NO− 3 shares the largest reduction of 77 %
bution across India and indicate more strident emission re- mainly driven by the decrease in its gaseous precursor NOx
duction policies should be implemented across India, espe- (71 %). At least a 27 % decrease in SO2− 4 is found in each city
cially in the later phases of lockdown and in rural areas. caused by the largest reduction of SO2 (averaged 59 %). An
average reduction of over 70 % in NOx and NO− 3 may still
3.3 Effects of emission reductions on PM2.5 during the be related to the reduction of vehicles. And SOAs dropped
lockdown by an average of 18 % because of the lack of precursors due
to the emission reduction of VOCs (29 %). Due to the re-
There are significant changes in PM2.5 between the lockdown duction of emitting precursors, the concentration reduction
and pre-lockdown periods. Moreover, we directly quantify of PM2.5 secondary components is less than that of primary
the change in PM2.5 during the lockdown. Figure 5 shows the components. The ratios of PPM reduction in emission (av-
differences in major PM2.5 components during the lockdown eraged 39 %) are larger than the reduction in concentration
period with (Case 2) and without (Case 1) control measures. (averaged 43 %) in five selected cities. In particular, a 7 %
Major components of PM2.5 including nitrate (NO− 3 ), sul- reduction in emission of PPM caused a 43 % decline in its
fate (SO2−
4 ), ammonium (NH +
4 ), elemental carbon (EC), concentration in Hyderabad. Emissions of EC and organic
https://doi.org/10.5194/acp-21-4025-2021 Atmos. Chem. Phys., 21, 4025–4037, 20214032 M. Zhang et al.: Impact of reduced anthropogenic emissions during COVID-19 on air quality in India
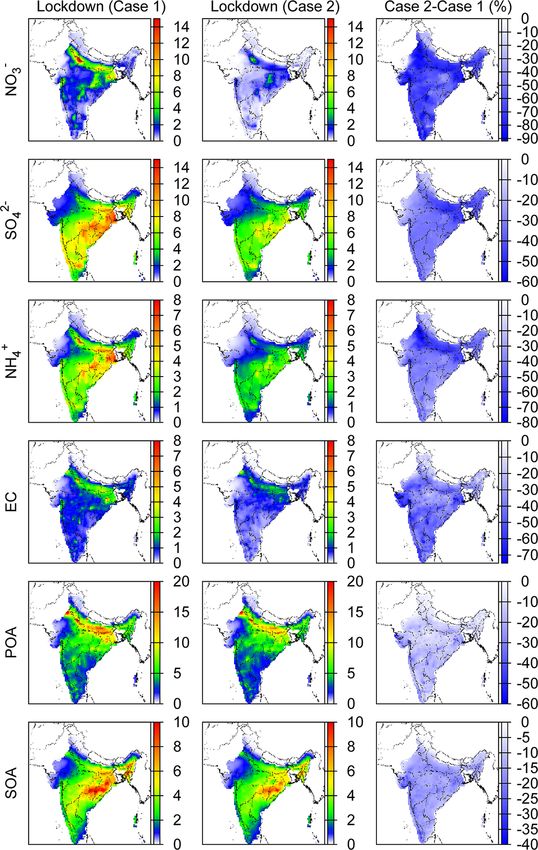
Figure 7. Predicted O3 , NOx , HCHO, and the changes caused
by nationwide lockdown measures from 24 March to 24 April
2020 in India. The unit is ppb. “Case 2 − Case 1” indicates
(Case 2 − Case 1) / Case 1, reported as %.
nents) in Bengaluru is not as significant as in Ahmedabad
although a similar reduction in emissions is observed.
3.4 Effects of emission reductions on O3 during the
lockdown
Figure 6. Predicted relative changes in concentrations of primary We investigated the changes of MDA8 O3 and its major
and secondary components, and emissions of their precursors in precursors NOx and HCHO during the lockdown period.
eight cities of India in Case 2 to Case 1. HCHO is one of the major contributors to total VOC reac-
tivity (Zhang et al., 2012; Steiner et al., 2008). It also has a
strong correlation with VOC (R 2 up to 0.93) (Fig. S4) and
performs well when validated by comparing with satellite-
carbon (OC) have also been reduced by a certain proportion observed data. As a result, HCHO is used as a good proxy in
resulting in a similar or greater reduction in concentrations. the model for the total VOCs, consistent with previous stud-
The response of concentration to emissions in all cities ies such as Palmer et al. (2003). Figure 7 shows that MDA8
presented a nonlinear change that has been confirmed pre- O3 , NOx , and HCHO decreased all over India. The average
viously by Zhao et al. (2017), which is related to various me- reduction rates of MDA8 O3 , NOx , and HCHO are approxi-
teorological conditions (Wang et al., 2020). For example, in mately 15 %, 50 %, and 15 %, respectively. For both Case 1
Lucknow, PPM, EC, OC, SO2 , NOx , and VOCs decreased by and Case 2, the higher levels of MDA8 O3 are in eastern In-
14 %, 25 %, 8 %, 39 %, 55 %, and 11 % respectively, while dia (over 60 ppb, Case 1) in which the higher NOx is also ob-
the concentration of PPM, EC, OC, SO2− −
4 , NO3 , and SOAs served (over 12 ppb, Case 1) during the lockdown. Compared
dropped by 21 %, 32 %, 12 %, 43 %, 78 %, and 18 %. As well to PM2.5 , no significant north–south differences are found in
as this, the concentration response to emission reduction is the change of O3 . The NOx concentration has the greatest
likely to be more prominent in highly polluted and industri- reduction that is mostly driven by the large cutting of energy
alized areas. The highest reductions in PPM and these sec- emission by 26 %, which is consistent with the decline of In-
ondary components of PM2.5 happened in Ahmedabad (an dia’s electricity consumption (9.2 %) (Reuters, 2020).
industrial city located in western India) with high vehicular Figure S5 shows the O3 production sensitivity (O3 / NOy )
populations. Bengaluru, a major southern Indian city, is con- in India during the lockdown, which is considered as an in-
sidered as one of the cleaner Indian major cities because of dicator of O3 sensitivity to NOx and VOCs (Sillman, 1995;
its low PM2.5 concentrations with no heavy industries (Gut- Sillman and He, 2002). As well as this, O3 / NOy < 6 indi-
tikunda et al., 2019). Consequently, the reduction in PM2.5 cates that O3 formation is VOC-limited, O3 / NOy > 8 indi-
and its major components (especially for secondary compo- cates NOx -limited, and intermediate values are transitional.
Atmos. Chem. Phys., 21, 4025–4037, 2021 https://doi.org/10.5194/acp-21-4025-2021M. Zhang et al.: Impact of reduced anthropogenic emissions during COVID-19 on air quality in India 4033
In India, NOx -limited regimes are found in vast areas from
both Case 1 and Case 2, which was also reported in previous
studies (Mahajan et al., 2015). As a result, the large reduc-
tion of NOx leads to decreased MDA8 O3 in most Indian
regions. Compared to Case 1, the VOC-limited area expands
mainly in the northwest and south of India from Case 2 dur-
ing the lockdown. Simultaneously, the rise of MDA8 O3 (av-
eraged 5 % and up to 21 %) is found sporadically in these
VOC-limited areas in which more significant decreases in
NOx (compared with VOCs) reduce the O3 consumption
(NO + O3 = NO2 + O2 ) and enhance HOx concentrations,
resulting in an increase in O3 levels. It may also indicate that
the increase in O3 is amplified regionally by the expansion of
the VOC-limited regimes due to the lockdown.
Figure 8 compares the concentrations of MDA8 O3 ,
HCHO, and NOx with emissions of VOCs, HCHO, and
NOx in eight major cities of India, Delhi, Mumbai, Kolkata,
Bengaluru, Hyderabad, Chennai, Ahmedabad, and Lucknow.
Generally, the decline in O3 concentration in Delhi (14 %),
Mumbai (23 %), Kolkata (24 %), Bengaluru (20 %), Hyder-
abad (17 %), Chennai (20 %), Ahmedabad (21 %), and Luc-
know (15 %) showed that effectiveness of emission reduc-
tions that play an important role in the control of O3 pollu-
tion, even in these VOC-limited areas.
The changes in emissions and concentrations of MDA8
O3 , HCHO, and NOx showed a non-linear response. In
Delhi, a 76 % reduction in NOx emissions resulted in a 77 %
reduction in its concentration, while a 29 % reduction in
HCHO resulted in only an 11 % reduction. In a megacity like
Delhi, about 7 million vehicles and many fossil-fuel-based
plants lead to high NOx emissions, and local restricted trans-
portation and industrial activities during lockdown could lead
to a significant reduction of primary NOx emissions (Sharma Figure 8. Predicted relative changes in concentrations of O3 ,
et al., 2016). The concentration of NOx is appreciably highly HCHO, and NOx and emissions of VOCs, HCHO, and NOx in eight
sensitive to a primary NOx emission reduction. However, the major cities of India in Case 2 to Case 1.
VOCs emission reduction resulting from the lockdown is rel-
atively less than NOx in each city. And most of the reduction
of HCHO concentration is less than that of emission reduc- ern, and parts of southern India covering most of the rural
tion, which is different from NOx , which indicated that the areas. As well as this, it can be concluded that the syner-
change of HCHO concentrations is not dominated by primary getic impact from the meteorological conditions and anthro-
HCHO emission reduction. pogenic emissions plays an important role in those increases
from pre-lockdown to lockdown periods.
The drastic decline in PM2.5 and its major components
4 Conclusion during the lockdown period in Case 2 compared with Case 1
shows the positive impacts of emission control measures,
Compared with before the lockdown, observed PM2.5 during especially for SIAs. During the lockdown, the decrease in
the lockdown in Delhi, Mumbai, Chennai, Hyderabad, and MDA8 O3 (averaged 15 %) occurs in most regions in India,
Bengaluru shows an overall decrease. In contrast, MDA8 O3 which is attributed to the lower emissions of NOx (48 %) and
increases in three of these cities. The comparison of predicted VOCs (6 %) that are precursors of O3 . Our results demon-
air pollutants across India before and during the lockdown strate that the strident emission controls due to the lockdown
shows distinct regional characteristics. The most significant have mitigated air pollution in India. However, more strin-
reductions of PM2.5 and PM10 (up to 79 %) are observed gent mitigation measures are needed to achieve effective con-
in most of northern and western India including all these trol of air pollution from secondary air pollutants and their
megacities. However, increases in MDA8 O3 (up to 29 %) components, particularly in rural areas. We also find the scat-
and other key pollutants are reported in northeastern, east- tered increases in MDA8 O3 (up to 21 %) in some urban lo-
https://doi.org/10.5194/acp-21-4025-2021 Atmos. Chem. Phys., 21, 4025–4037, 20214034 M. Zhang et al.: Impact of reduced anthropogenic emissions during COVID-19 on air quality in India
cations in the VOC-limited areas due to the emission reduc- 5 Precursor/TROPOMI Level 2 Product User Manual
tion. This indicates that a more localized control policy with Carbon Monoxide, SRON-S5P-LEV2-MA-002, avali-
the consideration of the O3 sensitivity regime should be im- able at: http://www.tropomi.eu/sites/default/files/files/
plemented in India to improve the air quality, especially for Sentinel-5P-Level-2-Product-User-Manual-CarbonMonoxide_
secondary pollutants such as O3 . v1.00.02_20180613.pdf (last access: 7 February 2021), 2018.
Balakrishnan, K., Dey, S., Gupta, T., Dhaliwal, R. S., Brauer, M.,
Cohen, A. J., Stanaway, J. D., Beig, G., Joshi, T. K., Aggar-
wal, A. N., Sabde, Y., Sadhu, H., Frostad, J., Causey, K., God-
Data availability. The datasets used in the study can be ac-
win, W., Shukla, D. K., Kumar, G. A., Varghese, C. M., Mu-
cessed from websites listed in the references or by contact-
raleedharan, P., Agrawal, A., Anjana, R. M., Bhansali, A., Bhard-
ing the corresponding authors (peng.ce.wang@polyu.edu.hk and
waj, D., Burkart, K., Cercy, K., Chakma, J. K., Chowdhury, S.,
zhanghl@fudan.edu.cn).
Christopher, D. J., Dutta, E., Furtado, M., Ghosh, S., Ghoshal,
A. G., Glenn, S. D., Guleria, R., Gupta, R., Jeemon, P., Kant, R.,
Kant, S., Kaur, T., Koul, P. A., Krish, V., Krishna, B., Larson,
Supplement. The supplement related to this article is available on- S. L., Madhipatla, K., Mahesh, P. A., Mohan, V., Mukhopad-
line at: https://doi.org/10.5194/acp-21-4025-2021-supplement. hyay, S., Mutreja, P., Naik, N., Nair, S., Nguyen, G., Odell, C.
M., Pandian, J. D., Prabhakaran, D., Prabhakaran, P., Roy, A.,
Salvi, S., Sambandam, S., Saraf, D., Sharma, M., Shrivastava,
Author contributions. MZ conducted the modeling and led the A., Singh, V., Tandon, N., Thomas, N. J., Torre, A., Xavier, D.,
writing of the paper. AK carried out the data collection and initial Yadav, G., Singh, S., Shekhar, C., Vos, T., Dandona, R., Reddy,
analysis. SZ, JS, and JM assisted with the data analysis. MX and K. S., Lim, S. S., Murray, C. J. L., Venkatesh, S., and Dan-
SHK assisted with the interpretation of the results and the writing dona, L.: The impact of air pollution on deaths, disease burden,
of the paper. HZ and PW designed the study, discussed the results, and life expectancy across the states of India: the Global Bur-
and edited the paper. den of Disease Study 2017, Lancet Planet. Health, 3, e26–e39,
https://doi.org/10.1016/S2542-5196(18)30261-4, 2019.
Banerjee, T., Kumar, M., Mall, R. K., and Singh, R. S.: Airing ’clean
Competing interests. The authors declare that they have no conflict air’ in Clean India Mission, Environ. Sci. Pollut. Res., 24, 6399–
of interest. 6413, https://doi.org/10.1007/s11356-016-8264-y, 2017.
Bao, R. and Zhang, A.: Does lockdown reduce air pollution? Evi-
dence from 44 cities in northern China, Sci. Total Environ., 731,
Acknowledgements. We acknowledge the publicly available WRF 139052, https://doi.org/10.1016/j.scitotenv.2020.139052, 2020.
and CMAQ models that make this study possible. Beig, G., Chate, D. M., Ghude, S. D., Mahajan, A. S.,
Srinivas, R., Ali, K., Sahu, S. K., Parkhi, N., Suren-
dran, D., and Trimbake, H. R.: Quantifying the effect of
air quality control measures during the 2010 Common-
Financial support. This research has been supported by the Insti-
wealth Games at Delhi, India, Atmos. Environ., 80, 455–463,
tute of Eco-Chongming (grant no. ECNU-IEC-202001).
https://doi.org/10.1016/j.atmosenv.2013.08.012, 2013.
Binkowski, F. S. and Roselle, S. J.: Models-3 Community
Multiscale Air Quality (CMAQ) model aerosol component
Review statement. This paper was edited by Frank Dentener and 1. Model description, J. Geophys. Res.-Atmos., 108, 4183,
reviewed by three anonymous referees. https://doi.org/10.1029/2001JD001409, 2003.
Bujin, B., Joshua, S. A., Dylan, B. M., Allen, R., Kelley,
C. W., and Julian, D. M.: PM2.5 and Ozone Air Pol-
References lution Levels Have Not Dropped Consistently Across the
US Following Societal Covid Response, ChemRxiv [preprint],
Abdi, B.: The Economic Times, Coronavirus impact: Within ten https://doi.org/10.26434/chemrxiv.12275603.v3, 2020.
days, 26 per cent fall in India’s energy consumption, available at: Byun, D. and Schere, K. L.: Review of the governing equations,
https://energy.economictimes.indiatimes.com/news/power/, last computational algorithms, and other components of the models-
access: 27 August 2020. 3 Community Multiscale Air Quality (CMAQ) modeling system,
Ali, K., Inamdar, S. R., Beig, G., Ghude, S., and Peshin, S.: Surface Appl. Mech. Rev., 59, 51–77, https://doi.org/10.1115/1.2128636,
ozone scenario at Pune and Delhi during the decade of 1990s, J. 2006.
Earth Syst. Sci., 121, 373–383, https://doi.org/10.1007/s12040- Carter, W. P. L.: SAPRC Atmospheric Chemical Mechanisms and
012-0170-1, 2012. VOC Reactivity Scales, available at: https://intra.engr.ucr.edu/
Anderson, R. M., Heesterbeek, H., Klinkenberg, D., and ~carter/SAPRC/ (last access: 26 August 2020), 2011.
Hollingsworth, T. D.: How will country-based mitigation mea- Chauhan, A. and Singh, R. P.: Decline in PM2.5 con-
sures influence the course of the COVID-19 epidemic?, Lancet, centrations over major cities around the world asso-
395, 931–934, https://doi.org/10.1016/s0140-6736(20)30567-5, ciated with COVID-19, Environ. Res., 187, 109634,
2020. https://doi.org/10.1016/j.envres.2020.109634, 2020.
Apituley, A., Pedergnana, M., Sneep, M., Pepijn Veefkind,
J., Loyola, D., Landgraf, J., and Borsdorff, T.: Sentinel-
Atmos. Chem. Phys., 21, 4025–4037, 2021 https://doi.org/10.5194/acp-21-4025-2021M. Zhang et al.: Impact of reduced anthropogenic emissions during COVID-19 on air quality in India 4035
Chen, Z., Zhuang, Y., Xie, X., Chen, D., Cheng, N., Yang, able at: https://sentinel.esa.int/documents/247904/3541451/
L., and Li, R.: Understanding long-term variations of me- Sentinel-5P-Nitrogen-Dioxide-Level-2-Product-Readme-File
teorological influences on ground ozone concentrations in (last access: 7 February 2021), 2020.
Beijing During 2006–2016, Environ. Pollut., 245, 29–37, ET Bureau: The Economic Times, Move only essential items:
https://doi.org/10.1016/j.envpol.2018.10.117, 2019. Transport body to members, available at: https://economictimes.
Chintalapudi, N., Battineni, G., and Amenta, F.: COVID- indiatimes.com/industry/transportation/shipping-/-transport/
19 virus outbreak forecasting of registered and recovered move-only-essential-items-transport-body-to-members/
cases after sixty day lockdown in Italy: A data driven articleshow/75016374.cms?from=mdr, last access: 27 Au-
model approach, J. Microbiol. Immunol., 53, 396–403, gust 2020.
https://doi.org/10.1016/j.jmii.2020.04.004, 2020. Feng, T., Zhao, S., Bei, N., Wu, J., Liu, S., Li, X., Liu, L., Qian,
Collivignarelli, M. C., Abba, A., Bertanza, G., Pedrazzani, R., Ric- Y., Yang, Q., Wang, Y., Zhou, W., Cao, J., and Li, G.: Sec-
ciardi, P., and Carnevale Miino, M.: Lockdown for CoViD-2019 ondary organic aerosol enhanced by increasing atmospheric ox-
in Milan: What are the effects on air quality?, Sci. Total Environ., idizing capacity in Beijing–Tianjin–Hebei (BTH), China, At-
732, 139280, https://doi.org/10.1016/j.scitotenv.2020.139280, mos. Chem. Phys., 19, 7429–7443, https://doi.org/10.5194/acp-
2020. 19-7429-2019, 2019.
Dantas, G., Siciliano, B., Franca, B. B., da Silva, C. M., and Arbilla, Fountoukis, C. and Nenes, A.: ISORROPIA II: a computa-
G.: The impact of COVID-19 partial lockdown on the air quality tionally efficient thermodynamic equilibrium model for K+ –
2−
of the city of Rio de Janeiro, Brazil, Sci. Total Environ., 729, Ca2+ –Mg2+ –NH+ + − −
4 –Na –SO4 –NO3 –Cl –H2 O aerosols, At-
139085, https://doi.org/10.1016/j.scitotenv.2020.139085, 2020. mos. Chem. Phys., 7, 4639–4659, https://doi.org/10.5194/acp-7-
Das, M., Das, A., Sarkar, R., Saha, S., and Mandal, A.: Ex- 4639-2007, 2007.
amining the impact of lockdown (due to COVID-19) on Garaga, R., Gokhale, S., and Kota, S. H.: Source apportionment of
ambient aerosols (PM2.5 ): A study on Indo-Gangetic Plain size-segregated atmospheric particles and the influence of par-
(IGP) Cities, India, Stoch. Env. Res. Risk A., 16, 1–17, ticles deposition in the human respiratory tract in rural and ur-
https://doi.org/10.1007/s00477-020-01905-x, 2020. ban locations of north-east India, Chemosphere, 255, 126980,
David, L. M., Ravishankara, A. R., Kodros, J. K., Pierce, J. https://doi.org/10.1016/j.chemosphere.2020.126980, 2020.
R., Venkataraman, C., and Sadavarte, P.: Premature Mor- Gautam, S.: The Influence of COVID-19 on Air Quality in India:
tality Due to PM2.5 Over India: Effect of Atmospheric A Boon or Inutile, B. Environ. Contam. Tox., 104, 724–726,
Transport and Anthropogenic Emissions, Geohealth, 3, 2–10, https://doi.org/10.1007/s00128-020-02877-y, 2020.
https://doi.org/10.1029/2018GH000169, 2019. Gawhane, R. D., Rao, P. S. P., Budhavant, K. B., Waghmare,
Dominutti, P., Nogueira, T., Fornaro, A., and Borbon, A.: V., Meshram, D. C., and Safai, P. D.: Seasonal variation
One decade of VOCs measurements in São Paulo megac- of chemical composition and source apportionment of PM2.5
ity: Composition, variability, and emission evaluation in a in Pune, India, Environ. Sci. Pollut. Res., 24, 21065–21072,
biofuel usage context, Sci. Total Environ., 738, 139790, https://doi.org/10.1007/s11356-017-9761-3, 2017.
https://doi.org/10.1016/j.scitotenv.2020.139790, 2020. Guenther, A. B., Jiang, X., Heald, C. L., Sakulyanontvittaya,
Ehrlich, H., McKenney, M., and Elkbuli, A.: Protect- T., Duhl, T., Emmons, L. K., and Wang, X.: The Model of
ing our healthcare workers during the COVID-19 Emissions of Gases and Aerosols from Nature version 2.1
pandemic, Am. J. Emerg. Med., 38, 1527–1528, (MEGAN2.1): an extended and updated framework for mod-
https://doi.org/10.1016/j.ajem.2020.04.024, 2020. eling biogenic emissions, Geosci. Model Dev., 5, 1471–1492,
Emery, C., Tai, E., and Yarwood, G.: Enhanced Meteorolog- https://doi.org/10.5194/gmd-5-1471-2012, 2012.
ical Modeling and Performance Evaluation for Two texas Guo, H., Kota, S. H., Sahu, S. K., Hu, J., Ying, Q., Gao, A., and
Episodes, Report to the Texas Natural Resources Conser- Zhang, H.: Source apportionment of PM2.5 in North India using
vation Commission, Prepared by ENVIRON, International source-oriented air quality models, Environ. Pollut., 231, 426–
Corp., Novato, CA, available at: http://www.tceq.state.tx.us/ 436, https://doi.org/10.1016/j.envpol.2017.08.016, 2017.
assets/public/implementation/air/am/contracts/reports/mm/ Gurjar, B. R., Ravindra, K., and Nagpure, A. S.: Air pol-
EnhancedMetModelingAndPerformanceEvaluation.pdf (last lution trends over Indian megacities and their local-
access: 27 August 2020), 2001. to-global implications, Atmos. Environ., 142, 475–495,
EPA: Guidance on the Use of Models and Other Analyses in Attain- https://doi.org/10.1016/j.atmosenv.2016.06.030, 2016.
ment Demonstrations for the 8-hour Ozone, NAAQSRep, avail- Guttikunda, S. K., Nishadh, K. A., Gota, S., Singh, P.,
able at: https://nepis.epa.gov/Exe/ZyPDF.cgi/P1006FPU.PDF? Chanda, A., Jawahar, P., and Asundi, J.: Air quality, emis-
Dockey=P1006FPU.PDF, (last access: 27 August 2020), 2005. sions, and source contributions analysis for the Greater Ben-
EPA: Guidance on the use of models and other analyses for galuru region of India, Atmos. Pollut. Res., 10, 941–953,
demonstrating attainment of air quality goals for ozone, https://doi.org/10.1016/j.apr.2019.01.002, 2019.
PM2.5 , and regional haze, US Environmental Protection Hu, J., Wu, L., Zheng, B., Zhang, Q., He, K., Chang,
Agency, Office of Air Quality Planning and Standards, avail- Q., Li, X., Yang, F., Ying, Q., and Zhang, H.: Source
able at: https://nepis.epa.gov/Exe/ZyPDF.cgi/P1009OL1.PDF? contributions and regional transport of primary partic-
Dockey=P1009OL1.PDF (last access: 27 August 2020), 2007. ulate matter in China, Environ. Pollut., 207, 31–42,
Eskes, K.-U. E., Lambert, J.-C., Loyola, D., Veefkind, J. https://doi.org/10.1016/j.envpol.2015.08.037, 2015.
P., Dehn, A., and Zehner, C.: S5P Mission Performance Hu, J., Chen, J., Ying, Q., and Zhang, H.: One-year simulation
Centre Nitrogen Dioxide [L2_NO2_] Readme, avail- of ozone and particulate matter in China using WRF/CMAQ
https://doi.org/10.5194/acp-21-4025-2021 Atmos. Chem. Phys., 21, 4025–4037, 20214036 M. Zhang et al.: Impact of reduced anthropogenic emissions during COVID-19 on air quality in India modeling system, Atmos. Chem. Phys., 16, 10333–10350, Mahajan, A. S., De Smedt, I., Biswas, M. S., Ghude, S., Fad- https://doi.org/10.5194/acp-16-10333-2016, 2016. navis, S., Roy, C., and van Roozendael, M.: Inter-annual Isaifan, R. J.: The dramatic impact of Coronavirus outbreak variations in satellite observations of nitrogen dioxide and on air quality: Has it saved as much as it has killed formaldehyde over India, Atmos. Environ., 116, 194–201, so far?, Global J. Environ. Sci. Manage., 6, 275–288, https://doi.org/10.1016/j.atmosenv.2015.06.004, 2015. https://doi.org/10.22034/gjesm.2020.03.01, 2020. Mahato, S., Pal, S., and Ghosh, K. G.: Effect of lock- Jain, S., Sharma, S. K., Vijayan, N., and Mandal, T. K.: down amid COVID-19 pandemic on air quality of the Seasonal characteristics of aerosols (PM2.5 and PM10 ) megacity Delhi, India, Sci. Total Environ., 730, 139086, and their source apportionment using PMF: A four year https://doi.org/10.1016/j.scitotenv.2020.139086, 2020. study over Delhi, India, Environ. Pollut., 262, 114337, Mohan, M. and Gupta, M.: Sensitivity of PBL parameter- https://doi.org/10.1016/j.envpol.2020.114337, 2020. izations on PM10 and ozone simulation using chem- Kabiraj, S. and Gavli, N. V.: Impact of SARS-CoV-2 Pandemic ical transport model WRF-Chem over a sub-tropical Lockdown on Air Quality Using Satellite Imagery with Ground urban airshed in India, Atmos. Environ., 185, 53–63, Station Monitoring Data in Most Polluted City Kolkata, India, https://doi.org/10.1016/j.atmosenv.2018.04.054, 2018. Aerosol Sci. Eng., 4, 320–330, 10.1007/s41810-020-00077-z, Mor, S., Kumar, S., Singh, T., Dogra, S., Pandey, V., and Ravindra, 2020. K.: Impact of COVID-19 lockdown on air quality in Chandi- Karambelas, A., Holloway, T., Kiesewetter, G., and Heyes, C.: Con- garh, India: Understanding the emission sources during con- straining the uncertainty in emissions over India with a regional trolled anthropogenic activities, Chemosphere, 263, 127978, air quality model evaluation, Atmos. Environ., 174, 194–203, https://doi.org/10.1016/j.chemosphere.2020.127978, 2021. https://doi.org/10.1016/j.atmosenv.2017.11.052, 2018. Mukherjee, K.: COVID-19 and lockdown: Insights Kitayama, K., Morino, Y., Yamaji, K., and Chatani, S.: Uncertain- from Mumbai, Indian J. Pub. Health, 64, 168–171, ties in O3 concentrations simulated by CMAQ over Japan us- https://doi.org/10.4103/ijph.IJPH_508_20, 2020. ing four chemical mechanisms, Atmos. Environ., 198, 448–462, Nakada, L. Y. K. and Urban, R. C.: COVID-19 pandemic: https://doi.org/10.1016/j.atmosenv.2018.11.003, 2019. Impacts on the air quality during the partial lockdown in Kota, S. H., Guo, H., Myllyvirta, L., Hu, J., Sahu, S. K., Sao Paulo state, Brazil, Sci. Total Environ., 730, 139087, Garaga, R., Ying, Q., Gao, A., Dahiya, S., Wang, Y., and https://doi.org/10.1016/j.scitotenv.2020.139087, 2020. Zhang, H.: Year-long simulation of gaseous and particu- Oksanen, E., Pandey, V., Pandey, A. K., Keski-Saari, S., late air pollutants in India, Atmos. Environ., 180, 244–255, Kontunen-Soppela, S., and Sharma, C.: Impacts of increas- https://doi.org/10.1016/j.atmosenv.2018.03.003, 2018. ing ozone on Indian plants, Environ. Pollut., 177, 189–200, Kroll, J. H., Heald, C. L., Cappa, C. D., Farmer, D. K., Fry, J. L., https://doi.org/10.1016/j.envpol.2013.02.010, 2013. Murphy, J. G., and Steiner, A. L.: The complex chemical effects Otmani, A., Benchrif, A., Tahri, M., Bounakhla, M., Chakir, of COVID-19 shutdowns on air quality, Nat. Chem., 12, 777– E. M., El Bouch, M., and Krombi, M.: Impact of Covid- 779, https://doi.org/10.1038/s41557-020-0535-z, 2020. 19 lockdown on PM10 , SO2 and NO2 concentrations in Kumar, P., Hama, S., Omidvarborna, H., Sharma, A., Sahani, J., Sale City (Morocco), Sci. Total Environ., 735, 139541, Abhijith, K. V., Debele, S. E., Zavala-Reyes, J. C., Barwise, https://doi.org/10.1016/j.scitotenv.2020.139541, 2020. Y., and Tiwari, A.: Temporary reduction in fine particulate mat- Pai, C., Bhaskar, A., and Rawoot, V.: Investigating ter due to ‘anthropogenic emissions switch-off’ during COVID- the dynamics of COVID-19 pandemic in India un- 19 lockdown in Indian cities, Sustain. Cities Soc., 62, 102382, der lockdown, Chaos Soliton. Fract., 138, 109988, https://doi.org/10.1016/j.scs.2020.102382, 2020. https://doi.org/10.1016/j.chaos.2020.109988, 2020. Kumar, S.: Effect of meteorological parameters on Palmer, P. I., Jacob, D. J., Fiore, A. M., Martin, R. V., spread of COVID-19 in India and air quality dur- Chance, K., and Kurosu, T. P.: Mapping isoprene emis- ing lockdown, Sci. Total Environ., 745, 141021, sions over North America using formaldehyde column ob- https://doi.org/10.1016/j.scitotenv.2020.141021, 2020. servations from space, J. Geophys. Res.-Atmos., 108, 4180, Kumari, P., and Toshniwal, D.: Impact of lockdown https://doi.org/10.1029/2002JD002153, 2003. measures during COVID-19 on air quality – A Purohit, P., Amann, M., Kiesewetter, G., Rafaj, P., Chaturvedi, case study of India, Int. J. Environ. Health Res., V., Dholakia, H. H., Koti, P. N., Klimont, Z., Borken- https://doi.org/10.1080/09603123.2020.1778646, in press, Kleefeld, J., Gomez-Sanabria, A., Schopp, W., and Sander, 2020. R.: Mitigation pathways towards national ambient air Lal, S., Venkataramani, S., Naja, M., Kuniyal, J. C., Mandal, T. K., quality standards in India, Environ. Int., 133, 105147, Bhuyan, P. K., Kumari, K. M., Tripathi, S. N., Sarkar, U., Das, https://doi.org/10.1016/j.envint.2019.105147, 2019. T., Swamy, Y. V., Gopal, K. R., Gadhavi, H., and Kumar, M. K. Reuters, S. V.: UPDATE 1 – India’s March Electricity S.: Loss of crop yields in India due to surface ozone: an esti- Usage Falls 9.2 % as Lock-Down Bites, available at: mation based on a network of observations, Environ. Sci. Pol- https://uk.reuters.com/article/india-electricity-supply/update- lut. Res., 24, 20972–20981, https://doi.org/10.1007/s11356-017- 1-indias-march-electricity-usage-falls-9-2-as-lockdown, last 9729-3, 2017. access: 26 August 2020. Le, T., Wang, Y., Liu, L., Yang, J., Yung, Y. L., Li, G., and Seinfeld, Sahu, S. K., Sharma, S., Zhang, H., Chejarla, V., Guo, H., J. H.: Unexpected air pollution with marked emission reductions Hu, J., Ying, Q., Xing, J., and Kota, S. H.: Estimat- during the COVID-19 outbreak in China, Science, 369, 702–706, ing ground level PM2.5 concentrations and associated health https://doi.org/10.1126/science.abb7431, 2020. risk in India using satellite based AOD and WRF pre- Atmos. Chem. Phys., 21, 4025–4037, 2021 https://doi.org/10.5194/acp-21-4025-2021
You can also read