WILL INDIA GET TOO HOT TO WORK? - CLIMATE RISK AND RESPONSE: PHYSICAL HAZARDS AND SOCIOECONOMIC IMPACTS CASE STUDY NOVEMBER 2020 - MCKINSEY & ...
←
→
Page content transcription
If your browser does not render page correctly, please read the page content below

Climate risk and response: Physical hazards and socioeconomic impacts

Will India get
too hot to work?
Case study
November 2020
McKinsey Global Institute

Since its founding in 1990, the McKinsey     innovation, and urbanization. Recent        partners and industry and management
Global Institute (MGI) has sought to         reports have assessed the digital           experts. The MGI Council is made
develop a deeper understanding of the        economy, the impact of AI and automation    up of leaders from McKinsey offices
evolving global economy. As the business     on employment, income inequality,           around the world and the firm’s sector
and economics research arm of McKinsey       the productivity puzzle, the economic       practices and includes Michael Birshan,
& Company, MGI aims to provide leaders       benefits of tackling gender inequality,     Andrés Cadena, Sandrine Devillard,
in the commercial, public, and social        a new era of global competition,            André Dua, Kweilin Ellingrud,
sectors with the facts and insights          Chinese innovation, and digital and         Tarek Elmasry, Katy George, Rajat Gupta,
on which to base management and              financial globalization.                    Eric Hazan, Acha Leke, Gary Pinkus,
policy decisions.                                                                        Oliver Tonby, and Eckart Windhagen.
                                             MGI is led by three McKinsey & Company      The Council members help shape the
MGI research combines the disciplines of     senior partners: James Manyika,             research agenda, lead high-impact
economics and management, employing          Sven Smit, and Jonathan Woetzel.            research and share the findings with
the analytical tools of economics with       James and Sven also serve as co-chairs      decision makers around the world. In
the insights of business leaders. Our        of MGI. Michael Chui, Susan Lund,           addition, leading economists, including
“micro-to-macro” methodology examines        Anu Madgavkar, Jan Mischke,                 Nobel laureates, advise MGI research.
microeconomic industry trends to better      Sree Ramaswamy, Jaana Remes,
understand the broad macroeconomic           Jeongmin Seong, and Tilman Tacke are        The partners of McKinsey fund MGI’s
forces affecting business strategy and       MGI partners, and Mekala Krishnan is an     research; it is not commissioned by
public policy. MGI’s in-depth reports have   MGI senior fellow.                          any business, government, or other
covered more than 20 countries and                                                       institution. For further information about
30 industries. Current research focuses      Project teams are led by the MGI            MGI and to download reports for free,
on six themes: productivity and growth,      partners and a group of senior fellows      please visit
natural resources, labor markets, the        and include consultants from McKinsey       www.mckinsey.com/mgi.
evolution of global financial markets,       offices around the world. These teams
the economic impact of technology and        draw on McKinsey’s global network of

In collaboration with McKinsey & Company's Sustainability and Global Risk practicies
McKinsey & Company’s Sustainability          advances and enable lasting performance     landscape accelerated and amplified by
Practice helps businesses and                improvements for new players and            social media. We apply deep technical
governments reduce risk, manage              incumbents alike.                           expertise, extensive industry insights,
disruption, and capture opportunities        www.mckinsey.com/sustainability             and innovative analytical approaches to
in the transition to a low-carbon,                                                       help organizations build risk capabilities
sustainable-growth economy. Clients          McKinsey & Company’s Global Risk            and assets across a full range of risk
benefit from our integrated, system-         Practice partners with clients to go        areas. These include financial risk,
level perspective across industries from     beyond managing risk to enhancing           capital and balance sheet–related risk,
energy and transport to agriculture and      resilience and creating value.              nonfinancial risks (including cyber, data
consumer goods and across business           Organizations today face unprecedented      privacy, conduct risk, and financial crime),
functions from strategy and risk to          levels and types of risk produced by        compliance and controls, enterprise risk
operations and digital technology. Our       a diversity of new sources. These           management and risk culture, model risk
proprietary research and tech-enabled        include technological advances              management, and crisis response and
tools provide the rigorous fact base         bringing cybersecurity threats and          resiliency—with a center of excellence for
that business leaders and government         rapidly evolving model and data risk;       transforming risk management through
policy makers need to act boldly with        external shifts such as unpredictable       the use of advanced analytics.
confidence. The result: cutting-edge         geopolitical environments and climate       www.mckinsey.com/
solutions that drive business-model          change; and an evolving reputational risk   business-functions/risk
Will India get
                               too hot to work?
                               Case study
                               November 2020

Authors
Jonathan Woetzel, Shanghai

Dickon Pinner, San Francisco

Hamid Samandari, New York

Rajat Gupta, Mumbai

Hauke Engel, Frankfurt

Mekala Krishnan, Boston

Carter Powis, Toronto
4
Introduction to case studies

In January 2020, the McKinsey Global Institute published Climate risk and response:
Physical hazards and socioeconomic impacts. In that report, we measured the impact of
climate change by the extent to which it could affect human beings, human-made physical
assets, and the natural world. We explored risks today and over the next three decades
and examined specific cases to understand the mechanisms through which climate change
leads to increased socioeconomic risk. This is one of our case studies, focused on India. The
analysis was completed prior to the COVID-19 pandemic.

In order to link physical climate risk to socioeconomic impact, we investigated cases that
illustrated exposure to climate change extremes and proximity to physical thresholds.
These cover a range of sectors and geographies and provide the basis of a “micro-tomacro”
approach that is a characteristic of McKinsey Global Institute research. To inform our
selection of cases, we considered over 30 potential combinations of climate hazards,
sectors, and geographies based on a review of the literature and expert interviews on the
potential direct impacts of physical climate hazards. We found these hazards affect five
different key socioeconomic systems: livability and workability, food systems, physical
assets, infrastructure services, and natural capital.

We ultimately chose nine cases to reflect these systems and based on their exposure to the
extremes of climate change and their proximity today to key physiological, human-made, and
ecological thresholds (Exhibit 1). As such, these cases represent leading-edge examples of
climate change risk. Each case is specific to a geography and an exposed system, and thus
is not representative of an “average” environment or level of risk across the world. Our cases
show that the direct risk from climate hazards is determined by the severity of the hazard and
its likelihood, the exposure of various “stocks” of capital (people, physical capital, and natural
capital) to these hazards, and the resilience of these stocks to the hazards (for example, the
ability of physical assets to withstand flooding). We typically define the climate state today as
the average conditions between 1998 and 2017, in 2030 as the average between 2021 and
2040, and in 2050 between 2041 and 2060. Through our case studies, we also assess the
knock-on effects that could occur, for example to downstream sectors or consumers. We
primarily rely on past examples and empirical estimates for this assessment of knock-on
effects, which is likely not exhaustive given the complexities associated with socioeconomic
systems. Through this “micro” approach, we offer decision makers a methodology by which to
assess direct physical climate risk, its characteristics, and its potential knock-on impacts.

Climate science makes extensive use of scenarios ranging from lower (Representative
Concentration Pathway 2.6) to higher (RCP 8.5) CO2 concentrations. We have chosen to
focus on RCP 8.5, because the higher-emission scenario it portrays enables us to assess
physical risk in the absence of further decarbonization. Such an “inherent risk” assessment
allows us to understand the magnitude of the challenge and highlight the case for action.
(We also choose a sea level rise scenario for one of our cases that is consistent with the RCP
8.5 trajectory). Our case studies cover each of the five systems we assess to be directly

Climate risk and response | Case study: India                                                    5

affected by physical climate risk, across geographies and sectors. While climate change
    will have an economic impact across many sectors, our cases highlight the impact on
    construction, agriculture, finance, fishing, tourism, manufacturing, real estate, and a range of
    infrastructure-based sectors. The cases include the following:

    — For livability and workability, we look at the risk of exposure to extreme heat and humidity
      in India and what that could mean for that country’s urban population and outdoor-based
      sectors, as well as at the changing Mediterranean climate and how that could affect
      sectors such as wine and tourism.

    — For food systems, we focus on the likelihood of a multiple-breadbasket failure affecting
      wheat, corn, rice, and soy, as well as, specifically in Africa, the impact on wheat and coffee
      production in Ethiopia and cotton and corn production in Mozambique.

    — For physical assets, we look at the potential impact of storm surge and tidal flooding
      on Florida real estate and the extent to which global supply chains, including for
      semiconductors and rare earths, could be vulnerable to the changing climate.

    — For infrastructure services, we examine 17 types of infrastructure assets, including
      the potential impact on coastal cities such as Bristol in England and Ho Chi Minh City
      in Vietnam.

    — Finally, for natural capital, we examine the potential impacts of glacial melt and runoff
      in the Hindu Kush region of the Himalayas; what ocean warming and acidification could
      mean for global fishing and the people whose livelihoods depend on it; as well as potential
      disturbance to forests, which cover nearly one-third of the world’s land and are key to the
      way of life for 2.4 billion people.

6   McKinsey Global Institute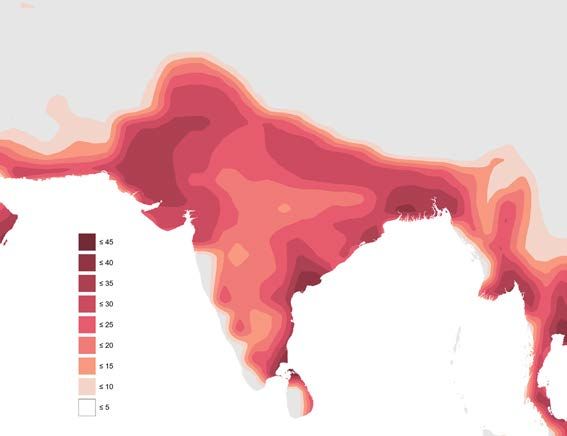
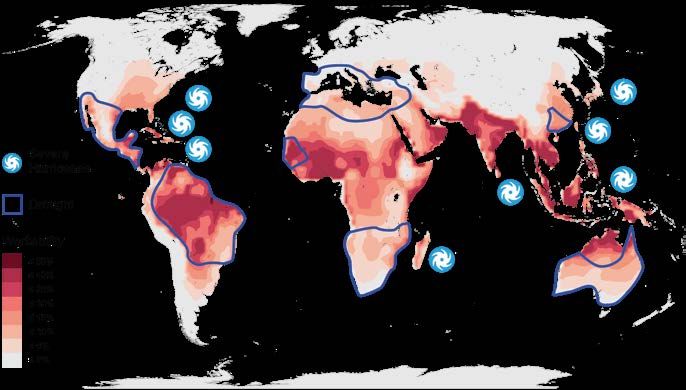
Exhibit 1
Exhibit 8

We have selected nine case studies of leading-edge climate change impacts across all
major geographies, sectors, and affected systems.

                                                                    7

                                                                                     2
                               5
                                                                                                           1          6
                                                                           4                                      7

                                                   Global case studies          3        8    9

Heat stress1 Low                       High           Highest drought risk in 20502                   Increase in hurricane/cyclone severity

                                               1       Will India get too hot to work?
     Livability and workability
                                               2       A Mediterranean basin without a Mediterranean climate?

                                               3       Will the world’s breadbaskets become less reliable?
     Food systems
                                               4       How will African farmers adjust to changing patterns of precipitation?

                                               5       Will mortgages and markets stay afloat in Florida?
     Physical assets
                                               6       Could climate become the weak link in your supply chain?

                                               7       Can coastal cities turn the tide on rising flood risk?
     Infrastructure services
                                               8       Will infrastructure bend or break under climate stress?

     Natural capital                           9       Reduced dividends on natural capital?

1. Heat stress measured in wet-bulb temperatures.
2. Drought risk defined based on time in drought according to Palmer Drought Severity index (PDSI).
Source: Woodwell Climate Research Center; McKinsey Global Institute analysis

                                     Climate risk and response | Case study: India                                                         7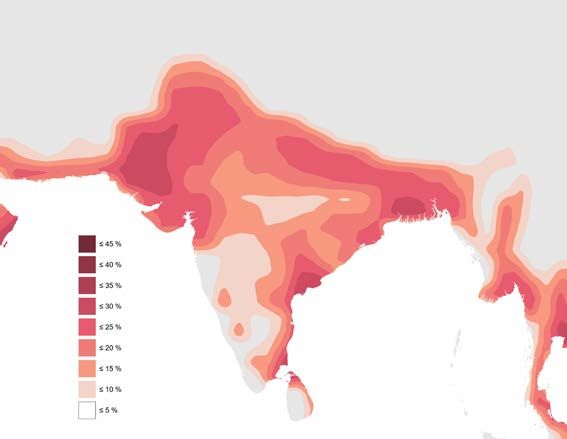
Pause while setting up a road sign. Agra, India.
© Amateur photographer, still learning.../Getty Images
India
Will India get too hot to work?
India has been on a remarkable development journey over the past two decades. The world’s
most populous democracy has averaged 7 percent year-over-year growth since its economic
liberalization in the late 1990s and has been among the fastest-growing nations in the
G‑20 since 2014. Its rapid economic growth has allowed India to dramatically increase the
quality of life of its citizens. In the decade between 2005 and 2015, more than 270 million
people, or a quarter of India’s population, were lifted out of multifactor poverty.1

While India is grappling with the COVID-19 pandemic, it cannot lose sight of climate risk,
which is rising. The coronavirus crisis holds profound lessons that can help us address climate
risk—if we make greater economic and environmental resiliency core to our planning for the
recovery ahead.2 Indeed economic stimulus in the wake of the pandemic can help restore
growth, while also addressing climate risk. 3 India’s strong economic performance is expected
to resume over the coming decades, creating the world’s third largest consumer market,
and slowly but surely delivering housing, sanitation, electricity, and other necessities to
the remaining 300 million citizens who still live in multifactor poverty. 4 This does not mean,
however, that future growth will be without challenges. For example, uncertainty still remains
around the duration and impact of the pandemic. Then there are other non-pandemic related
challenges. According to the World Economic Forum, more than half of Indian workers need
reskilling by 2022 in order to meet the talent demands of a rapidly modernizing economy.5 The
participation rate of women in the labor force lags well behind its peers, at only 25 percent,
and over the next 30 years the national electric power system will have to quadruple in
size to keep pace with rapid growth in electricity demand.6 In addition to these significant
developmental priorities, India faces another, increasingly visible threat that it must cope with:
a rapidly changing and degrading physical environment. The challenges of water scarcity and
air pollution are well known. Less well appreciated is the impact extreme heat and humidity
will likely have on the economy and the toll it could take on human life.

In this case study, we analyze the direct impact of climate-change-driven heat and humidity
extremes on India. We first analyze the “inherent risk” that is expected to manifest over the
next decade, absent adaptation and mitigation, and then examine the evolution of that risk
through to 2050 under an RCP 8.5 scenario.7 We find that India could become one of the first
places in the world to experience heat waves that cross the survivability limit for a healthy
human being sitting in the shade. Without targeted adaptation action, around 160-200 million

1
    Oxford Poverty and Human Development Index, Global Multidimensional Poverty Index (MPI), 2018. Multifactor poverty is
    an index that includes access not only to income, but also to electricity, proper nutrition, sanitation facilities, educational
    opportunity, and housing.
2
    Addressing climate change in a post-pandemic world, McKinsey & Company, April, 2020.
3
    How a post pandemic stimulus can both create jobs and help the climate, McKinsey & Company, May 2020.
4
    Long-term forecasts include, but not restricted to, World Economic Forum, 2019, Standard Chartered, 2019, Government
    of India, 2019, Bloomberg, 2019, Japan Center for Economic Research, 2017. Forecasts are generally built on the
    explicit assumption that many of the historical drivers of growth will persist into the future. These include: favorable
    demographics (about seven million new workers have joined the labor force each year for the past decade); a strong
    and rapidly growing services sector, producing 43 percent of GDP and growing at about 8 percent a year; continuing
    digitization of both the private and public sectors; a strong domestic consumption rate (roughly 60 percent of GDP)
    relative to peer countries; and a high savings rate (30.5 percent in 2018).
5
    The future of jobs report 2018, World Economic Forum, 2018.
6
    “Labor force participation rate, female, India,” The World Bank; Gautam Raina and Sunanda Sinha, “Outlook on the Indian
    scenario of solar energy strategies: Policies and challenges,” Energy Strategy Reviews, April 2019, Volume 24.
7
    The scientific community has developed a set of standardized scenarios that act as a common language across climate
    modeling research. These scenarios project changes in atmospheric greenhouse gas levels over time and are known
    as Representative Concentration Pathways (RCPs). We have relied on RCP 8.5 for the analysis in this report to represent
    the changes in atmospheric greenhouse gas concentrations that could occur absent a mitigation response over the next
    three decades. While RCP 8.5 has been criticized for projecting unrealistic levels of GHG emissions in the second half of
    the century, it has been adopted as a reasonable choice when investigating changes over the next two to three decades
    in isolation. Please see technical appendix of the full report for further details. The climate state today is defined as the
    average conditions between 1998 and 2017, in 2030 as the average between 2021 and 2040, and in 2050 between 2041
    and 2060.

Climate risk and response | Case study: India                                                                                    9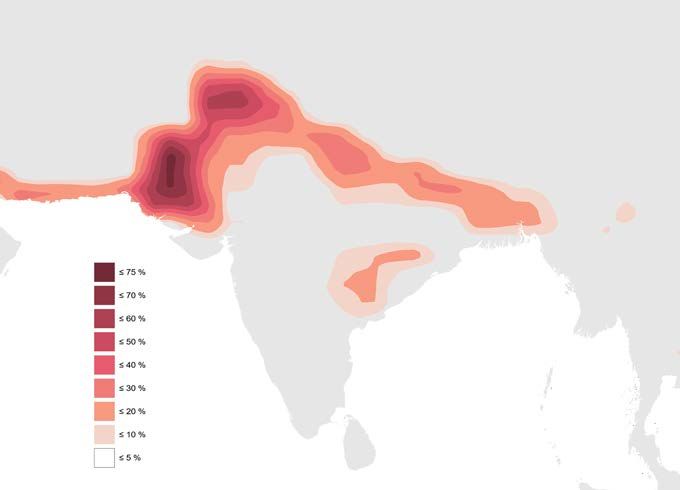
people in India could annually bear a 5 percent chance of being exposed to a lethal heat
     wave as early as 2030, a ~40 percent cumulative likelihood over the decade centered on
     2030. 8 We further estimate that the effective number of outdoor working hours lost will
     increase approximately 15 percent by 2030, resulting in approximately 2.5-4.5 percent, or
     $150-250 billion, risk to GDP.9 By 2050, both the intensity of and exposure to lethal heat
     waves, as well as the impact on outdoor work, could increase in a nonlinear way.

     Given the inherent risk projection, adaptation is likely to happen, for example, by shifting working
     hours for outdoor workers, undertaking albedo heat management efforts in cities, establishing
     early-warning systems and cooling shelters to protect people, and, at the extreme, movement
     of people and capital from high-risk areas. Investing in heat management will be critical, and
     stakeholders will also need to consider approaches to accelerate the transition out of outdoor
     work already underway. Adaptation in general will be challenging because heat is a pervasive
     risk and involves fundamental changes in how people conduct their daily lives (for example,
     shifting work hours may entail potential cultural and economic difficulties). Adaptation will be
     particularly challenging for the urban poor, who will likely require public support, for example
     in the form of emergency shelters. We calculate that addressing some of the risk of lethal heat
     waves by 2030, using air-conditioning, could come with capital costs of up to $110 billion.10
     Both public- and private-sector stakeholders have an important role to play in developing and
     delivering the necessary technological and regulatory solutions.

     The threat of extreme heat and humidity is less widely appreciated than
     that of water scarcity and air pollution
     Some 600 million people in India already face high to extreme water stress, and 70 percent
     of available water resources are contaminated, according to the National Institution for
     Transforming India (NITI Aayog).11 By the end of 2020, 21 cities, including New Delhi and
     Hyderabad, are projected to run out of groundwater, affecting 100 million people, and by
     2030 the national water supply is forecast to outstrip demand by 100 percent, leaving
     40 percent of the population, or half a billion people, without access to drinking water.12

     In addition, a 2018 Lancet report found that mean exposure to airborne particles in India
     was more than twice the level recommended by the Indian National Ambient Air Quality
     Standard, and nine times higher than the World Health Organization’s recommended safe
     exposure level.13 Currently, one in eight deaths in India every year is due to air-pollution-
     related disease.14

     There have been several steps taken to address these issues. In May 2019, the Ministry of Water
     Resources, River Development & Ganga Rejuvenation merged with the Ministry of Drinking
     Water and Sanitation to form the Ministry of Jal Shakti, which has a sweeping mandate to
     address water scarcity across India. In January 2019, the government launched the National
     Clean Air Programme, with the goal of cutting pollution in the 100 most affected cities by 20 to
     30 percent by 2024. A third environmental threat remains, however: the effect of climate-
     change-driven heat and humidity extremes on India’s people.

     The most fundamental impact of climate change is an increase in temperatures across
     the globe. As temperatures increase, the most vulnerable nations will be those in areas

     8
          Cumulative likelihood calculated by using annual probabilities for the climate state in the 2030 period. Annual
          probabilities are independent and can therefore be aggregated to arrive at a cumulative decadal probability. This
          calculation is a rough approximation as follows: It assumes that the annual probability of X percent applies to every year
          in the decade centered on 2030. We first calculate the cumulative probability of the event not occurring in that decade,
          which is 1 minus X raised to the power of 10. The cumulative probability of a the event occurring at some point in the
          decade is then 1 minus that number.
     9
          Dollar amounts calculated in real terms, using 2011–12 rupees and spot exchange rates.
     10
          This estimate takes into account BAU grow rates of air-conditioning penetration.
     11
          NITI Aayog, Composite Water Management Index, 2018.
     12
          Ibid.
     13
          India State-Level Disease Burden Initiative Air Pollution Collaborators, “The impact of air pollution in deaths, disease
          burden, and life expectancy across the states of India: The Global Burden of Disease Study 2017,” Lancet Planetary
          Health, January 2019, Volume 3, Number 1.
     14
          Ibid.

10   McKinsey Global Institute
that are already hot and humid. This is because there are limits to the levels of heat stress
under which human bodies (as well as physical and natural systems) can effectively
operate, and the nations closest to those thresholds today will be the first to experience the
consequences of crossing them.
While the hottest air temperatures ever recorded have been in places like Saudi Arabia,
the Sahara Desert, and Death Valley, California, in the United States, the north of India
has historically exhibited some of the world’s hottest wet-bulb temperatures.15 Wet-bulb
temperature is an indicator that combines air temperature and relative humidity. It provides
a more accurate measure of heat stress on the human body than air temperature alone (see
Box 1, “What extreme heat and humidity mean for the human body”).
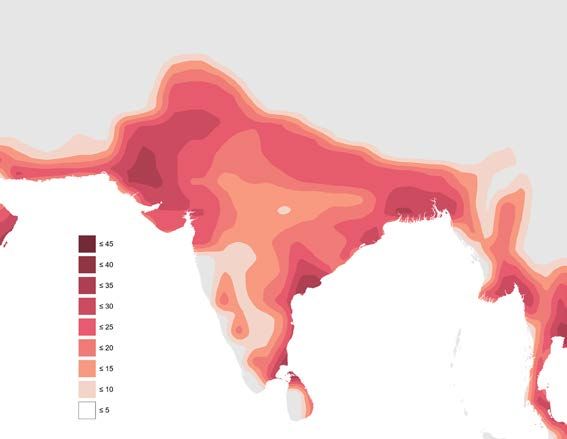
Over the past 30 years, maximum wet-bulb temperatures across India have steadily climbed,
driven by an increase in humidity, but maximum air temperatures have not increased.16 The
explanation for these two different trends is the concurrent rise in atmospheric aerosols, or
air pollution, which reflect a proportion of incoming sunlight and therefore artificially cool the
region, reducing air temperatures (India‑1).17 Additionally, widespread irrigation reduces air
temperature through evaporation, but increases humidity.18 In other words, the air pollution
crisis is reducing the amount of heat stress currently facing India’s economy and its people,
and, in many areas, heat stress is influenced by irrigation practices. However, as stakeholders
act to reduce air pollution levels, and as the Earth warms over the coming decades, the true
magnitude of the threat from extreme heat and humidity will manifest itself.19
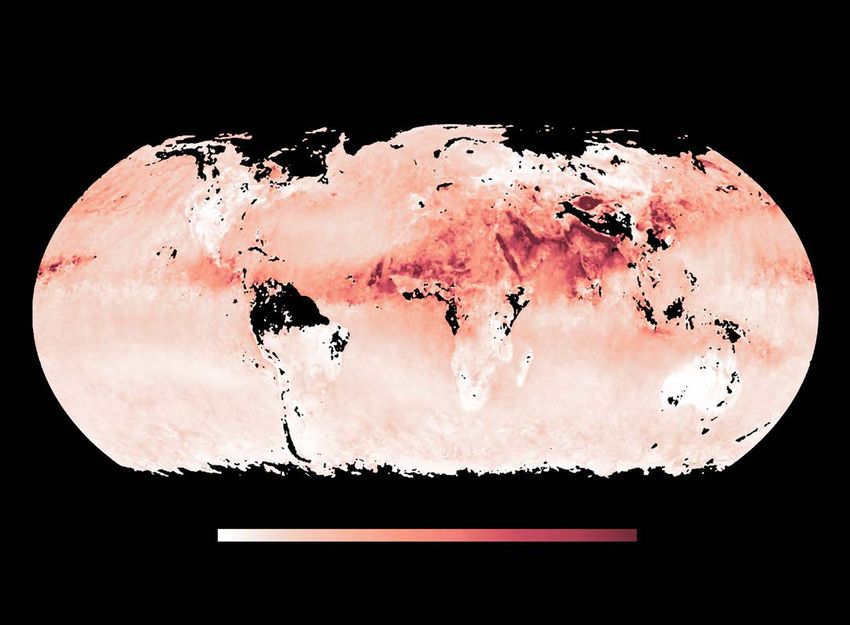
Case study India-1
Temperatures during India’s hottest months are mitigated by a high concentration of
atmospheric particles.
Atmospheric aerosol depth, May 20181 Clear skies Extreme haze2
1. Atmospheric aerosol depth is a measure of the extinction of the solar beam by dust and haze. It is a dimensionless number that is related to the
amount of aerosol in the vertical column of atmosphere over the observation location.
2. We define extreme haze as atmospheric aerosol depth of 1.0.
Source: NASA Earth Observatory
15
Steven C. Sherwood and Matthew Huber, “An adaptability limit to climate change due to heat stress,” Proceedings of
the National Academy of Sciences, May 25, 2010, Volume 107, Number 21; Eun-Soon Im, Jeremy S. Pal, and Elfatih A. B.
Eltahir, “Deadly heat waves projected in the densely populated agricultural regions of South Asia,” Science Advances,
August 2, 2017, Volume 3, Number 8.
16
Geert Jan van Oldenborgh et al., “Extreme heat in India and anthropogenic climate change,” Natural Hazards and Earth
System Sciences, 2018, Volume 18, Number 1.
17
Ibid.
18
Ibid.
19
US NASA Earth Observatory.
Climate risk and response | Case study: India 11Box 1.
What extreme heat and humidity mean for the human body
The human body must maintain a determines how much heat the body evaporation at a constant pressure.
relatively stable core temperature of can exhaust through the evaporation As wet-bulb temperatures increase,
approximately 37 degrees Celsius to of sweat. 4 the ability of human beings to exert
function properly. Pushing the core effort or perform work decreases
temperature out of equilibrium only a Human beings are able to acclimatize due to two factors: firstly, the need to
few degrees in either direction results to extreme temperatures by increasing take breaks to avoid the physiological
in rapid negative consequences.1 the volume of sweat that their bodies consequences of core temperature rise,
Physiological literature shows that process. The Bedouin, for example, and secondly, the body “self-limiting”
performance under heat stress have lived in the deserts of North or instinctively fatiguing, to prevent
declines very rapidly.2 The core Africa and the Arabian Peninsula overheating.6 At a wet-bulb temperature
temperature needs to rise only for hundreds of years. They survive of 35 degrees, healthy, well-hydrated
0.06 degree to compromise task extreme air temperatures without the human beings resting in the shade
performance requiring vigilance, use of air-conditioning because they would see core temperatures rise to
0.2 degree to compromise multitasking can dissipate enormous quantities of lethal levels after roughly four to five
ability, 0.9 degree to compromise heat into the dry desert air through hours of exposure.7 Any introduction of
neuromuscular coordination, perspiration. With the introduction of direct sunlight, activity, or dehydration
1.3 degrees to affect simple mental humidity, however, the ability of air to would shorten this period. According
performance, 3 degrees to induce hold additional water decreases, and to the scientific literature, 35 degrees
dangerous heat stroke, and 5 degrees the evaporation of sweat becomes wet-bulb temperature is commonly
to cause death. 3 more difficult, making heat stress regarded as the heat-stress limit
harder to bear. 5 for human survival. 8 In order to
In environments where air temperatures better conceptualize this threshold,
are higher than skin or core For this reason, high wet-bulb 35-degree wet-bulb temperature can
temperatures, the body loses its ability temperatures—a function of both air be roughly defined as a convex line on
to effectively dissipate heat through temperature and relative humidity—are a temperature/humidity axis, running
radiation and convection, and core more dangerous to human beings than between 35-degree air temperature
temperature is determined primarily extreme air temperatures. Wet-bulb with 100 percent relative humidity,
by a combination of activity level and temperature is technically defined and 50-degree air temperature with
wet-bulb temperature—a measure of air as the minimum temperature to 40 percent relative humidity.
temperature and relative humidity—that which a parcel of air can be cooled by
1
Gaither D. Bynum et al., “Induced hyperthermia in sedated humans and the concept of a critical thermal maximum,” American Journal of Physiology, November 1978,
Volume 235, Number 5.
2
P. A. Hancock and Ioannis Vasmatzidis, “Human occupational performance limits under stress: The thermal environment as a prototypical example,” Ergonomics,
1998, Volume 41, Number 8.
3
Ibid.
4
Ken Parsons, Human Thermal Environments: The Effects of Hot, Moderate, and Cold Environments on Human Health, Comfort and Performance, second edition,
New York, NY: Taylor & Francis Group, 2014.
5
Ibid.
6
Tord Kjellstrom et al., “Estimating population heat exposure and impacts on working people in conjunction with climate change,” International Journal of
Biometeorology, March 2018, Volume 62, Number 3.
7
Steven C. Sherwood and Matthew Huber, “An adaptability limit to climate change due to heat stress,” Proceedings of the National Academy of Sciences, May 25,
2010, Volume 107, Number 21; threshold confirmed, assuming light clothing cover, using the physiological Predicted Heat Strain (PHS) model; Jacques Malchaire et
al., “Development and validation of the predicted heat strain model,” Annals of Occupational Hygiene, March 2001, Volume 45, Number 2.
8
Steven C. Sherwood and Matthew Huber, “An adaptability limit to climate change due to heat stress,” Proceedings of the National Academy of Sciences, May 2010,
Volume 107, Number 21; Eun-Soon Im, Jeremy S. Pal, and Elfatih A. B. Eltahir, “Deadly heat waves projected in the densely populated agricultural regions of South
Asia,” Science Advances, August 2017, Volume 3, Number 8.
12 McKinsey Global InstituteRising wet-bulb temperatures could put millions of lives and billions of
dollars at-risk
Climate models project that some areas of India may become the first places on Earth to
be exposed to heat and humidity so extreme that, without adaptation measures such as
air-conditioning, healthy adults risk succumbing to heat waves in large numbers (India‑2).20
While wet-bulb temperatures during the worst heat waves in India today rarely, if ever,
exceed 32 degrees, the climatological analysis conducted for this case study indicates that
temperatures during the most severe heat waves in the hottest parts of India could begin to
breach 34 degrees by 2030. Such high temperatures have been recorded only a couple of
times on Earth, including a 34.6-degree wet-bulb measurement on the coast of the Persian
Gulf in July of 2015, and a later 35.4-degree wet-bulb measurement in the same region.
This indicates that temperature extremes of this magnitude have already become possible
in our current climate, though they remain very rare and small in spatial extent.21 Exposure
to 34-degree wet-bulb temperatures will increase mortality risk for the sick and elderly,
but more importantly, due to the amplifying urban heat-island effect, urban or peri-urban
centers exposed to these temperatures may cross the 35-degree survivability threshold for
healthy adults.22
Based on a district-by-district geospatial analysis of population urbanicity, we estimate that,
under our “inherent risk” scenario, 160-200 million people could be living in urban areas in
India with a non-zero annual probability of experiencing a lethal heatwave as soon as 2030.
Under business-as-usual air conditioning growth, only about half will have protection from
air conditioning. The average annual probability of a lethal heatwave in those regions is
projected to be ~5 percent, meaning the probability of at least one heatwave occurring during
the decade centered around 2030 will be ~40 percent. (India-2). By 2050, the number of
people living in at-risk regions will increase to 310-480, and the average annual probability
to 14 percent, meaning the probability of at least one heatwave occurring during the decade
centered around 2050 will be ~80 percent. It is likely that most people will own an air
conditioning unit by 2050.
Another consequence of chronic exposure to extreme heat is a rapid decrease in the capacity
for outdoor work. This phenomenon occurs not only due to the need to take breaks to avoid
dangerous core temperature rise, but also because the body will fatigue to reduce the amount
of work (and therefore heat) that it is able to produce, in a process known as “self-limiting,”
which is a function of the wet-bulb temperature.23 This is significant because India’s economy
is highly dependent on heat-exposed labor. As of 2017, heat-exposed work produces about
50 percent of GDP, drives about 30 percent of GDP growth, and employs about 75 percent of
the labor force, some 380 million people.24
20
Eun-Soon Im, Jeremy S. Pal, and Elfatih A. B. Eltahir, “Deadly heat waves projected in the densely populated agricultural
regions of South Asia,” Science Advances, August 2017, Volume 3, Number 8.
21
Christoph Schär, “The worst heat waves to come,” Nature Climate Change, October 2015, Volume 6; Tom Matthews,
“Humid heat and climate change,” Progress in Physical Geography, 2018, Volume 42, Number 3.
22
These numbers are subject to uncertainty related to the future behavior of atmospheric aerosols and urban heat island
or cooling island effects. A global analysis of 419 major cities showed that the average daytime temperature difference
between urban areas and their immediate surroundings is +1.5 ± 1.2°C, with some outliers up to 7°C warmer. Shushi
Peng et al., “Surface urban heat island across 419 global big cities,” Environmental Science & Technology, January 2012,
Volume 46, Number 2. Research has demonstrated that many cities in India exhibit a negative urban heat island intensity
in summer—that is, during the hot pre-monsoon season, they are cooler than their surroundings. This cooling effect is
due to both to atmospheric aerosols and the relatively high vegetation cover in cities compared with their surroundings,
which contain largely barren lands that are converted to croplands only post-monsoon. While these findings apply
to much of the Indian subcontinent, the authors found that many cities in the north of the country exhibit statistically
significant positive urban heat island intensities. Because this area of the country is also projected to be the first to
exhibit heat waves close to the 35-degree threshold and because a reduction in atmospheric aerosols could further
reduce the artificial cooling effect currently underway, these cities are at risk of having 34-degree heat waves amplified
to 35-degree heat waves. Hiteshri Shastri et al., “Flip flop of day-night and summer-winter surface urban heat island
intensity in India,” Nature Scientific Reports, January 9, 2017, Volume 7.
23
Peter Brode et global: et al., “Estimated work ability in warm outdoor environments depends on the chosen heat stress
assessment metric,” International Journal of Biometeorology, April 2017, Number 62.
24
Reserve Bank of India, Database on Indian Economy. Exposed sectors include exclusively outdoor sectors such
as agriculture, mining, and quarrying, as well as indoor sectors with poor air-conditioning penetration including
manufacturing, hospitality, and transport.
Climate risk and response | Case study: India 13Case study India-2
The annual probability of lethal heat waves in India and surrounding areas Based on RCP 8.5
is expected to increase between 2018 and 2050.
Annual probability of a lethal heat wave1
%
≤2 3–10 11–20 21–30 31–40 41–50 51–60 61–70 >70
Today
2030 2050
1. A lethal heat wave is defined as a three-day period with maximum daily wet-bulb temperatures exceeding 34°C wet-bulb, where wet-bulb
temperature is defined as the lowest temperature to which a parcel of air can be cooled by evaporation at constant pressure. This threshold was
chosen because the commonly defined heat threshold for human survivability is 35°C wet-bulb, and large cities with significant urban heat island
effects could push 34°C wet-bulb heat waves over the 35°C threshold. Under these conditions, a healthy, well-hydrated human being resting in
the shade would see core body temperatures rise to lethal levels after roughly 4–5 hours of exposure. These projections are subject to uncertainty
related to the future behavior of atmospheric aerosols and urban heat island or cooling island effects, and do not factor in air conditioner
penetration.
Note: See the Technical Appendix of the full report for why we chose RCP 8.5. All projections based on RCP 8.5, CMIP 5 multi model ensemble.
Heat data bias corrected. Following standard practice, we define current and future (2030, 2050) states as the average climatic behavior over
multidecade periods. Climate state today is defined as average conditions between 1998 and 2017, in 2030 as average between 2021 and 2040,
and in 2050 as average between 2041 and 2060.
Source: Woodwell Climate Research Center
14 McKinsey Global InstituteHistorically, India’s extreme summer wet-bulb temperatures have limited, or in some cases
even prevented, outdoor work from occurring during the hottest hours of the hottest and most
humid days of the year. Between 1951 and 1980, across India, an average of approximately
10 percent of daylight hours were effectively lost for outdoor work due to extreme heat and
humidity in a given year.25 Today, climate models indicate that this has increased to roughly
15 percent on average across India.26 In 2019, air temperatures exceeded 44 degrees Celsius
in Odisha, with relative humidity of about 37 percent, equating to a wet-bulb temperature of
31 degrees, stopping outdoor work between 11 a.m. and 4 p.m. across cities.27 In Churu, air
temperatures hit 49 degrees, with relative humidity of about 28 percent, equating to a wet-
bulb temperature of 32 degrees and stopping all outdoor activity during the same period.28
By 2030, in the climate scenario considered here, the average number of effectively lost
daylight hours for outdoor work could further increase by about 15 percent, equivalent to
an additional three and a half weeks a year of 11:00 a.m. to 4:00 p.m. lost working hours. It
is important to note that this is an average number, and the increase in extreme heat will not
be distributed evenly across the country. The areas in the northwest and on the east coast
(where hot continental air mixes with humid ocean currents) will experience larger increases
than the less-humid interior (India‑3).
Past MGI analysis has found that in 2030 a significant proportion of workers in India will still
be expected to work outside, and we estimate about 40 percent of GDP will still depend on
heat-exposed work. Based on a geospatial, district-by-district analysis of exposed GDP and
projected lost working hours, as well as considering effects on other sectors that exchange
inputs and outputs with sectors exposed to outdoor heat, we calculate that an increase in lost
labor hours due to rising heat and humidity could put approximately 2.5-4.5 percent of GDP
at risk by 2030, equivalent to roughly $150-250 billion.29 This is considering an average year,
and a “business-as-usual” pace of sectoral transitions.
25
Based on equivalent lost working hour projections derived from climate models. Hours unworkable due to heat is defined
as the percentage of a given 12-hour workday lost due to extreme heat. This number of lost working hours should not
be interpreted as an absolute 10 percent of hours during which no work occurs, rather, it is inclusive of losses in worker
productivity while working, as well as breaks.
26
Note these estimations are also subject to uncertainty based on atmospheric aerosol behavior. The 2019 International
Labour Organization (ILO) report Working on a warmer planet estimated the total lost working hours in India because of
extreme heat at 4.3 percent of hours lost in 1995, increasing to 5.8 percent by 2030. The difference between results can
be accounted for as follows: (1) the total ILO numbers are presented as a percentage of total labor force hours (weighted
for population and sector), and ours are presented as a percentage of total possible working hours, and weighted for
area, (2) our values are calculated assuming a spectrum of work intensity occurring in all sectors, using a continuous
function derived from ISO heat-exposure safety standards adjusted according to Josh Foster et al., “A New Paradigm
To Quantify The Reduction Of Physical Work Capacity In The Heat,”Medicine and Science in Sports and Exercise,
June 2019, Volume 51, Issue 6, whereas the ILO figures are calculated assuming that each sector has a only a single
work intensity value using three ISO curves adjusted according to Tord Kjellstrom et al., “Estimating population heat
exposure and impacts on working people in conjunction with climate change,” International Journal of Biometeorology,
March 2018, Volume 62, Issue 3; (3) the ILO figures are based on RCP 2.6, whereas ours are based on RCP 8.5; (4) our
projections are corrected for bias using ERA-Interim reanalysis data set, whereas ILO numbers are not.
27
Debjoy Sengupta, “Extreme heat takes toll on coal output; state governments ask Coal India to alter production
schedule,” Economic Times, May 27, 2015.
28
Joanna Slater, “‘It is horrid’: India roasts under heat wave with temperatures above 120 degrees,” Washington Post, June
5, 2019.
29
Our GDP-at-risk analysis was performed as follows: scientists at the Woodwell Climate Research Center created a
grid-cell by grid-cell projection of the profile of daily wet-bulb globe temperatures using a bias-corrected ensemble of
global climate models. This daily temperature profile was then translated into lost working hours following the approach
of John P. Dunne et al., “Reductions in labour capacity from heat stress under climate warming,” Nature Climate Change,
February 2013, Volume 3, using ISO heat exposure standards. These standards were then corrected using empirical
evidence from Josh Foster et al., “A New Paradigm To Quantify The Reduction Of Physical Work Capacity In The Heat,”
Medicine and Science in Sports and Exercise, June 2019, Volume 51, Issue 6, to account for the fact that ISO standards
are overly conservative. Finally, the number of lost working hours for each grid cell were summed to an annual number.
Given annual number of lost working hours per grid cell, we then multiplied the lost hours share by GDP generated
by sectors exposed to heat. The sectors considered here included agriculture, construction, mining and quarrying,
manufacturing (where we considered half of the GDP in the sector to be exposed to heat), and a selection of services
that are more “outdoor-based,” including hotels, restaurants, and transport services. Business, financial, and other
knowledge services were considered completely non-exposed, although this may be a conservative assumption.
Climate risk and response | Case study: India 15Case study India-3
The affected area and intensity of extreme heat and humidity is projected Based on RCP 8.5
to increase, leading to a higher expected share of lost working hours in
India and surrounding areas.
Share of lost Today
working hours1
%
≤5
6–10
11–15
16–20
21–25
26–30
31–35
36–40
>40
2030
2050
1. Lost working hours include loss in worker productivity as well as breaks, based on an average year that is an ensemble average of climate models.
Note: See the Technical Appendix of the full report for why we chose RCP 8.5. All projections based on RCP 8.5, CMIP 5 multi model ensemble.
Heat data bias corrected. Following standard practice, we define current and future (2030, 2050) states as the average climatic behavior over
multidecade periods. Climate state today is defined as average conditions between 1998 and 2017, in 2030 as average between 2021 and 2040,
and in 2050 as average between 2041 and 2060.
Source: Woodwell Climate Research Center
16 McKinsey Global InstituteAbsent mitigation, the risks from extreme heat will continue to evolve. Climate models
demonstrate that by 2050, some small parts of India will be under such intense heat and
humidity duress that the equivalent of 30 percent or more of annual daylight hours will
effectively be lost each year for outdoor work. More importantly, by 2050, portions of
northern India could begin to experience heat waves that could cross the 35-degree wet-
bulb survivability with a cumulative probability of occurrence approaching 100 percent in a
given decade.
Aggressive adaptation and sector transition could reduce the economic
risk from extreme heat in India
Given the inherent risk of rising wet-bulb temperatures, India must adapt through capacity
and knowledge building, material investment in adaptive technology and infrastructure, and
supporting the economy’s transition away from outdoor work.
Cooling plans
The government is already taking steps toward this. In response to the challenges laid out
above, the Indian Ministry of Environment, Forests, and Climate Change released the India
Cooling Action Plan in March 2019, making India the first major country in the world to
release a national policy document on cooling. 30 There is also action underway at the local
level. The Ahmedabad Municipal Corporation developed the first heat-action plan in India in
response to the record-breaking 2010 heat wave that killed 300 people in a single day. 31 As
of 2018, 17 other cities and 11 states have released or are in the process of developing heat-
action plans. 32
Capacity building
Capacity and knowledge building is a crucial first step for all stakeholders because it allows
decision makers to quantify the level of heat-related risk they face and establish a perspective
on how that risk could evolve based on both climatic and economic factors. At the local level,
Ahmedabad has implemented programs to build residents’ awareness of the dangers of
extreme heat by, for example, establishing a seven-day probabilistic heat-wave early warning
system. To date, heat waves are largely defined across India according to the behavior of
dry-bulb air temperature. 33 Future investment in capacity and knowledge building should
focus on incorporating the impact of humidity into heat-wave projections and policy, to aid in
identification of high-risk regions and communities.
30
Radhika Lalit and Ankit Kalanki, How India is solving its cooling challenge, Rocky Mountain Institute, 2019; India Cooling
Action Plan, Government of India, Department of Environment, Forests, and Climate Change, 2018.
31
Kim Knowlton et al., “Development and implementation of South Asia’s first heat-health action plan in Ahmedabad
(Gujarat, India),” International Journal of Environmental Research and Public Health, 2014, Volume 11, Number 4.
32
Chilling prospects: Providing sustainable cooling for all, Sustainable Energy for All, 2018.
33
Geert Jan van Oldenborgh et al., “Extreme heat in India and anthropogenic climate change,” Natural Hazards and Earth
System Sciences, 2018, Volume 18, Number 1.
Climate risk and response | Case study: India 17Transition work indoors
The pace of India’s transition away from outdoor work in the economy and the rate at which
it invests in adaptation could significantly impact the economic risk of lost hours, and also
the toll on life from heat waves. As outlined above, our inherent risk estimate of the impact of
decreasing labor productivity due to extreme heat is 2.5-4.5 percent of GDP by 2030, with
the range based on whether a hotter and more humid year manifests, or a colder and less
humid one. However, there are uncertainties associated with this analysis one associated
with climatic conditions, and the other associated with exposure of the economy to those
climatic conditions (see Box 2, “Understanding climatological uncertainties associated with
the impact of heat and humidity on India”). For the climate uncertainty, we assess the impact
of hotter and more humid years, and colder and less humid years, which could occur due to
natural variability. This is measured to be +0.6 percent / –1.4 percent of GDP, relative to our
base case estimate (India-4). If India’s economic transition to a service-based economy is
slowed, our mean estimate of 4 percent of GDP could increase by as much as 0.6 percentage
point. Assuming a very rapid transition and adaptation scenario in which only unavoidable
outdoor work is exposed and 100 percent of indoor GDP is protected by air-conditioning by
2030, the total GDP impact could decrease by 2.2 percentage points.
Case study India-4
We consider the impact of two forms of uncertainty on GDP at risk from Based on RCP 8.5
heat and humidity in India; reducing exposure could more than halve
GDP at risk.
Distribution of GDP at risk by 2030 due to an increase in heat and humidity, based on various climate and economic
exposure scenarios
% of total 2030 GDP
Climate uncertainty
Better than Average Worse than
average year year average year
25th percentile Multi model 75th percentile
climate model mean climate model
projection projection projection
Multisector exposure with no
sector shift
Multiple heat-exposed sectors 3.0 4.6 5.3
Assumes sectoral composition of economy
stays constant
Multisector exposure, assuming expected
economic evolution
Exposure
uncertainty
Multiple heat-exposed sectors 2.5 4.0 4.5
Assumes transition toward service economy
continues
Agriculture, mining, and construction only,
assuming expected economic evolution
Only unavoidably outdoor work exposed 1.2 1.8 2.1
Assumes transition toward service economy
continues
Note: See the Technical Appendix of the full report for why we chose RCP 8.5. All projections based on RCP 8.5, CMIP 5 multimodel ensemble.
Heat data bias corrected. Assumes multiplier of 2 for direct + indirect effects.
Source: Woodwell Climate Research Center; McKinsey Global Institute analysis
18 McKinsey Global InstituteBox 2. Understanding climatological uncertainties associated with the impact of heat and humidity on India While we have taken care to design our analysis in a robust manner, there are factors we did not consider in our analysis that could increase or decrease the results presented here. Our results could be increased or decreased by two types of factors: climatological and socioeconomic. The climatological factors that could change our results include the risk of an unusually hot or cold year or period due to natural variability, different evolutions of atmospheric aerosol concentrations over India, changes in irrigation volume and extent, and changes in the behavior of urban heat-island effects in at-risk regions. The socioeconomic factors include the pace of transition to a service economy, and any adaptation actions taken by the Indian government or people. Because lethal heat waves are acute (or “tail”) events, estimating the probability of occurrence required examining projections of wet-bulb-temperature extremes in warmer- and colder- than average years, as opposed to just interrogating an average year. The reason that this is necessary is that an extreme heat wave may not be possible during an average year, but may become possible during a hotter- than-average year, due to natural variability of the climate, for example during an El Nino cycle. To capture natural variability, we used the spread of outcomes across the entire ensemble of climate models. In other words, uncertainty resulting from natural variability, as captured by ensemble model spread, is already included in our estimate of probability. While it was not possible to do a full treatment of the other listed sources of climatological uncertainty listed here, the heat wave analysis was re-run using subsets of the 20 selected GCMs according to their ability to replicate various aerosol species over India. This analysis demonstrated that while aerosols play a role in determining heat wave probability, the future projections regarding an increase in the probability and spatial extent of lethal heat waves are likely robust. When estimating the GDP lost due to decreasing labor productivity, similar restrictions limited our ability to quantify the impact of aerosols, irrigation, and possible changes in urban heat-island effects. Our base case here was based on the average of the 20 climate models. We were therefore able to estimate the uncertainty introduced by natural variability by examining the multimodel ensemble spread. We estimate that, based on the 75th and 25th percentile ensemble results, in a hotter and more humid year, the GDP impact could be 4.5 percent. In a relatively cooler and less humid year, it could be 2.5 percent. Investment in cooling measures Investment in adaptive technology and infrastructure allows decision makers to reduce the direct impacts from heat-related risk. Available options can broadly be divided into active cooling measures, such as air-conditioning technology, and passive cooling measures including traditional building design, alternative coolers, and urban albedo management. The challenge of providing enough cooling is complicated by the fact that India faces increases in both air temperature and relative humidity, so stakeholders are somewhat constrained in their ability to address heat risk through passive cooling technology. Many traditional cooling methods (for example, evaporative coolers and stepwells) leverage the cooling ability of evaporation, the efficacy of which decreases rapidly in high-humidity conditions. Climate risk and response | Case study: India 19
Government policies
     Adaptation can also be accelerated through direct government actions, such as prescribing
     changes in labor hours or the establishment of heat-resilient urban design standards,
     and indirect or facilitative actions, such as mandating the development of heat-action
     plans or multiple-stakeholder coordination. India’s national plan highlights a portfolio
     of recommended priority actions, including using market and policy drivers to promote
     low-energy cooling technology, fast-tracking building energy codes and thermal comfort
     standards, and allocating government funding for targeted programs to enable cooling for
     economically weaker segments of the population through affordable housing design and
     construction, cool-roof programs, and development of localized heat-action plans. 34 For
     some work, shifting hours is easily possible, for example in construction, where floodlights
     can be used at night. In other sectors, such as agriculture, night work is more difficult. In
     addition, working early hours may cause cultural and economic difficulties. If people start
     working two or three hours after midnight, it has consequences for society in general.
     Commuting times have to be adapted, changes in lifestyle are necessary, and schools and
     shops have to open at different hours, leading to additional adaptation costs. 35

     Air conditioning
     We calculate the cost of providing the entire population exposed to lethal heat wave
     risk with air-conditioning in 2030 to be roughly $110 billion. 36 For the poorest urban
     segments, air-conditioned emergency shelters or similar solutions will likely have to be
     provided in addition, possibly complemented by targeted affordable (air-conditioned)
     housing programs. Additionally, the greenhouse-gas intensity of current air-conditioning
     technology will need to be addressed to avoid further exacerbating climate change. The
     private sector can play an important role in driving innovation here (see Box 3, “The need
     for innovation in air-conditioning”).

     34
          India Cooling Action Plan, Government of India, Ministry of Environment, Forest, and Climate Change, 2018.
     35
          Marguerite Holloway, “As Phoenix heats up, the night comes alive,” New York Times, August 13, 2019.
     36
          These numbers are derived as follows: under expected air-conditioner penetration rates according to the Indian National
          Cooling Plan, we calculate there will still be 100 million urban people exposed to heat wave risk by 2030. Because the
          average Indian household size is 5 people, and the plurality of households fall into the one-room category, we calculate
          it would take roughly 25 million additional air-conditioner units to protect the entire exposed population. The cost
          of producing these 25 million units would be approximately $10 billion, and they would require ~125 GW of new solar
          generation capacity to run which, at ~$800 per kilowatt to build, would cost an additional $100 billion. Johnny Wood,
          India is now producing the world’s cheapest solar power, World Economic Forum, June 28, 2019.

20   McKinsey Global Institute
Box 3.
The need for innovation in air-conditioning
The most effective tool for combating heat is the air conditioner, but widespread
expansion of installed air-conditioning runs the risk of dramatically increasing global
greenhouse gas emissions and exacerbating climate change. Investment in reducing
electricity grid carbon intensity, increasing air conditioner efficiency, and transitioning
away from coolants with high global warming potential is therefore necessary to
maximize the efficacy of the air conditioner as a risk mitigation tool.
Air conditioners cause both direct and indirect emissions of greenhouse gases. Direct
emissions are leaks of coolants from the units themselves. Prior to 1989, most air-
conditioning units used a class of coolants called hydrochlorofluorocarbons.1 After the
discovery that they deplete the ozone layer, the nations of the world came together to
sign the 1987 Montreal Protocol, which required manufacturers to switch to alternative,
non-ozone-degenerative coolants. Among the most popular classes of alternative
coolants are hydrofluorocarbons, or HFCs. Although they do not deplete the ozone layer,
they are extremely powerful greenhouse gases. For example, releasing one tonne of
HFC‑410a into the atmosphere is the equivalent of releasing 2,088 tonnes of CO2.2
Indirect emissions refer to the carbon emissions generated during the production of the
electricity consumed by an individual air-conditioning unit. Efficiency factors vary, but
as a rule, air conditioners are energy-intensive devices. In 2016, global air conditioner
stock consumed 2,000 terawatt hours (TWh) of energy, more than double the entire
electricity consumption of the African continent. 3 In Mumbai and New Delhi, room air
conditioners account for 40 to 60 percent of peak power demand in summer. 4
To meet electricity demand under a business-as-usual growth scenario for room
and commercial air conditioners and chillers (assuming no additional adaptation),
India will have to add enough generation capacity to the national grid to provide an
additional 200 TWh by 2030. 5 If this capacity is provided using the current generation
mix, meeting air conditioner demand will release an additional 1.4 billion tonnes of
CO2 equivalent (that is, including coolant leakage) into the atmosphere between
now and 2030.6 Renewables technology can help manage some of this risk, as can
investments in a new generation of air-conditioning technology. The private sector will
need to be a crucial part of enabling an effective cooling solution for India, and other
parts of the world facing increased temperatures.
1
Iain Campbell, Ankit Kalanki, and Sneha Sachar, Solving the global cooling challenge: How to counter the climate
threat from room air conditioners, Rocky Mountain Institute, 2018.
2
Mohit Sharma, Vaibhav Chaturvedi, and Pallav Purohit, “Long-term carbon dioxide and hydrofluorocarbon
emissions from commercial space cooling and refrigeration in India: A detailed analysis within an integrated
assessment modelling framework,” Climatic Change, August 2017, Volume 143, Number 3–4.
3
The future of cooling: Opportunities for energy-efficient air conditioning, International Energy Agency, 2018.
4
Radhika Lalit and Ankit Kalanki, How India is solving its cooling challenge, Rocky Mountain Institute, 2019.
5
India Cooling Action Plan, Government of India, Ministry of Environment, Forest, and Climate Change, 2018.
6
Assuming a 2016–17 carbon intensity value of 0.8 TCO2/MWh, according to the Ministry of Power Central
Electricity Authority, Government of India, 2018.
Climate risk and response | Case study: India 21You can also read