Extreme Rainfall and Hydro-Geo-Meteorological Disaster Risk in 1.5, 2.0, and 4.0 C Global Warming Scenarios: An Analysis for Brazil - Frontiers
←
→
Page content transcription
If your browser does not render page correctly, please read the page content below
ORIGINAL RESEARCH
                                                                                                                                             published: 03 March 2021
                                                                                                                                       doi: 10.3389/fclim.2021.610433

                                             Extreme Rainfall and
                                             Hydro-Geo-Meteorological Disaster
                                             Risk in 1.5, 2.0, and 4.0◦C Global
                                             Warming Scenarios: An Analysis for
                                             Brazil
                                             Jose A. Marengo 1*, Pedro I. Camarinha 1 , Lincoln M. Alves 2 , Fabio Diniz 1 and
                                             Richard A. Betts 3,4
                                             1
                                               Research and Development Coordination/National for Monitoring and Early Warning of Natural Disasters, Sao Jose dos
                                             Campos, Brazil, 2 Earth System Science Center/National Institute for Space Research, Sao Jose dos Campos, Brazil,
                                             3
                                               Climate Impacts Research/Met Office Hadley Centre, Exeter, United Kingdom, 4 Global Systems Institute, University of
                                             Exeter, Exeter, United Kingdom
                            Edited by:
      Cláudio Moisés Santos E. Silva,
   Federal University of Rio Grande do       With the inclusion of demographic characteristics of the population living in vulnerable
                           Norte, Brazil
                                             areas, a combination of empirical and climate models was used to project changes
                        Reviewed by:
         Claudine Pereira Dereczynski,
                                             to climate and in hydro-geo-meteorological disasters in Brazil. This study investigated
           Federal University of Rio de      the effect of extreme rainfall changes and the risk of floods and landslides under 1.5,
                                                           ◦
                        Janeiro, Brazil      2.0, and 4.0 C global warming levels (GWLs). Projections from a large ensemble of
                        Fabio Farinosi,
           Joint Research Centre, Italy      pre-CMIP6 models and different warming levels show a remarkable change in heavy
                 *Correspondence:            precipitation. As a result, with increasing warming this enhances the risk of landslides
                   Jose A. Marengo           and flash floods in the context of climate change. Comparisons of vulnerability and
       jose.marengo@cemaden.gov.br
                                             change in potential impacts of landslides and floods show that three regions, highly
                    Specialty section:
                                             densely populated areas, are the most exposed to landslides and floods. The Southern
          This article was submitted to      and Southeastern of Brazil stand out, including metropolitan regions with high economic
           Climate Risk Management,
                                             development and densely populated, which may be those where disasters can intensify
                a section of the journal
                     Frontiers in Climate    both in terms of frequency and magnitude. The eastern portion of the Northeast is also
      Received: 25 September 2020            signaled as one of the affected regions due to its high vulnerability and exposure since the
       Accepted: 10 February 2021            present period, although the projections of future climate do not allow conclusive results
         Published: 03 March 2021
                                             regarding the intensification of extreme rainfall events in scenarios below 4◦ C. The main
                               Citation:
Marengo JA, Camarinha PI, Alves LM,
                                             metropolitan regions and tourist resorts, and key infrastructure in Brazil are located in
 Diniz F and Betts RA (2021) Extreme         those regions. This study highlights the importance of environmental policies to protect
                            Rainfall and
                                             human lives and minimize financial losses in the coming decades and reinforces the need
  Hydro-Geo-Meteorological Disaster
    Risk in 1.5, 2.0, and 4.0◦ C Global      for decision-making, monitoring, and early warning systems to better manage disasters
  Warming Scenarios: An Analysis for         as part of disaster risk reduction risk management.
         Brazil. Front. Clim. 3:610433.
     doi: 10.3389/fclim.2021.610433          Keywords: climate extremes, climate-related disasters, climate change, disaster risk reduction, vulnerability

Frontiers in Climate | www.frontiersin.org                                         1                                            March 2021 | Volume 3 | Article 610433
Marengo et al.                                                                                                   Disaster Risk Reduction and Climate

INTRODUCTION                                                                increases in global-mean temperature. In addition, the
                                                                            magnitude of global warming at the level of 1.5, 2.0◦ C
Present and future climate extremes imply adverse impacts on                or higher can lead to more extreme and severe climatic
natural and human systems. These extreme events are anticipated             conditions (HELIX project-www.helixclimate.eu, IPCC, 2018,
to be among the potentially most harmful consequences of a                  2019).
changing climate. However, it is very difficult to translate changes            Limited research on the consequence of GWLs of 1.5 and 2◦ C
in the intensity, duration, and frequency of weather and climate            was conducted for risk of disasters due to increase in rainfall
extremes (i.e., hazards) into actual risks for specific sectors             extremes. For these systems, climate is one of many drivers
and/or locations, or, even further, to express these in quantitative        that result in adverse outcomes. The risk of natural disasters
terms, mainly because we lack sufficient knowledge of the                   depends also on non-climatic factors that are not included in the
socioeconomic and environmental implications, including data                climate projections. Among them they used land use, drainage
on vulnerabilities and exposure (IPCC, 2012). Disasters triggered           systems, relief, slope, road density, and hydrography, and socio-
by climate extremes pose severe societal challenges across a                economic information.
range of sectors (IPCC, 2012, 2013, 2014, 2019; Moreno et al.,                  In Brazil, a pioneer work developed by Debortoli et al.
2020; Sillmann and Sippel, 2020). Climate risks are distributed             (2017) use IPCC AR5 models to assess risk of landslides, floods,
unevenly between regions and generally higher in developing                 flashfloods, and drought for the present and future. The authors
countries with low income (De Coninck et al., 2018). For                    developed empirical models that use these climate projections
example, the state of São Paulo in southeastern Brazil experienced          together with official statistics and environmental information to
profound water shortages in 2014–2015 due to severe drought                 project risk of water-related natural disasters at the municipality
(Otto et al., 2015; Nobre et al., 2016). On the other hand, intense         level. They found a large increase in risk of landslides and
rainfall has increased in southern Brazil (Dunn et al., 2020), and          flash floods in Brazil in the context of climate change by 2050.
in the Metropolitan Region of São Paulo this increase in the                Regions already considered to be of high vulnerability will
last seven decades caused disruption to transport, flooding and             become even more vulnerable, such as the mountainous region of
landslides (Marengo et al., 2020a,b).                                       Rio de Janeiro, interior and southern Minas Gerais, and various
    The United Nations Office for Disaster Risk Reduction                   locations on the Brazilian coast in southeast Brazil. Southern
considers disaster as a severe disruption of a community’s                  Brazil is the region with the most impressive increments (50%) of
functioning or a society (UNISDR, 2015). This involves                      risk of landslides, changing from a “low” vulnerability to a “high”
widespread human, material, economic, or environmental losses               vulnerability class late in the century.
and impacts. About 90% of all climate related disasters are caused              These and other studies (Brasil, 2016; De Almeida et al., 2016;
by weather-climate-related hazards. Among them are floods,                  EM-DAT, 2019; Marengo et al., 2020a,b; Moreno et al., 2020;
flashfloods, landslides, and droughts (UNISDR, 2015; EM-DAT,                Travassos et al., 2020) consistently report that climate change
2019). Intense rainfall followed by a flash flood or landslides has         exacerbates climate hazards and amplifies the risk of water related
strong impacts on population.                                               disasters at the local and regional level. They identify Brazil’s
    The majority of climate-change impact assessments have been             hot spots of vulnerability to hydro-geo-meteorological disasters
framed in future time horizons, e.g., impacts by the middle or              using a combination of projected indices of climate extremes, and
end of the twenty-first century using the Special Report Emission           environmental data, including land use, drainage systems, relief,
Scenarios (SRES) or the Representative Concentration Pathways               slope, road density, hydrography, and socioeconomics. In Brazil,
(RCPs) emission scenarios (IPCC, 2007, 2014). According to the              the increase in the frequency and intensity of extreme rainfall
IPCC’s Special Report on Global Warming of 1.5◦ C—if we exceed              combined with population exposure has triggered disasters such
1.5–2◦ C, it is likely an increase in the risk of impacts consequence       as landslides, floods, and flashfloods in various regions of Brazil
of extreme rainfall events and rising sea levels (IPCC, 2019). It           (Ávila et al., 2016; Alvala et al., 2019; Marengo et al., 2020a,b).
was during the 2015 United Nations Climate Change Conference                    Adaptation to a world with 1.5◦ C global warming will
COP-21 held in Paris that the boundary of 1.5–2.0◦ C warming                require environmental policies that consider extreme weather
has been regarded as the most desirable, to avoid strong impacts            conditions and reduce risk of climate-related disasters (IPCC,
of climate change on natural and human systems (Hulme,                      2018, 2019). Key synergies between international agreements
2016). Prior to the Paris Agreement, the IPCC AR5 (IPCC,                    have been explored for sustainable development and disaster risk
2014) and World Bank (2014) presented synthesis diagrams                    reduction a stronger integration between agendas of sustainable
with impacts of 1.0–6.0◦ C warming levels above pre-industrial              development (e.g., Agenda 2030; United Nations, 2015, 2016),
conditions. However, these were based on expert judgment rather             disaster risk reduction (e.g., Sendai Framework, UNISDR, 2018)
than quantitative impact assessments. The Stern Review of the               and the 2015 Paris Agreement (UNFCCC, 2016a,b). Past and
Economics of Climate Change (Stern, 2016) included an early                 current experiences in dealing with climate variability and
assessment of possible impacts of various warming levels.                   extreme events, irrespective of attribution to climate change,
    Various studies have documented some impacts of                         hold valuable lessons to inform adaptation and mitigation policy.
                                                                                                           ◦
different global warming levels (GWLs), but few of them                     Global warming above 2.0 C is projected to further increase
deal with South America or specifically, with Brazil.                       the risk of climate extremes which will increase the difficulty
These show that there is regional differentiation in both                   meeting Sustainable Development Goal (SDG) 13 on Climate
future climate risks and vulnerabilities to incremental                     Action. This will also strongly self-reinforce interactions between

Frontiers in Climate | www.frontiersin.org                              2                                     March 2021 | Volume 3 | Article 610433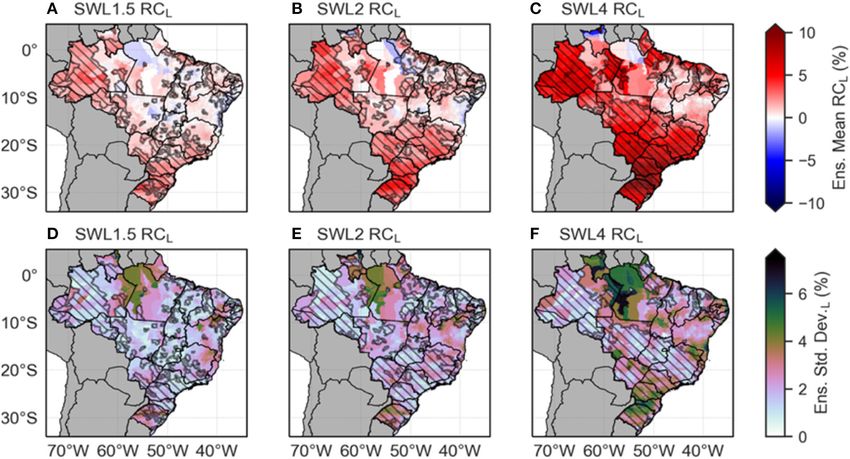
Marengo et al.                                                                                                               Disaster Risk Reduction and Climate

climate and water management problems, threatening SDG 6                         Projected future climate change were taken from six
(Access to Clean Water and Sanitation), reduce agricultural                  simulations with the HadGEM3A-GA3.0 Atmospheric General
production and food security and threatening (SDG 2, Zero                    Circulation Model at a resolution of N216 (∼60 km in mid-
Hunger), increasing health risks (threatening SDG 3, Good                    latitudes), performed as part of the research project HELIX
Health and Wellbeing), and damaging critical infrastructure                  (High-End cLimate Impacts and eXtremes). This is a predecessor
(SDG 9, Industry, Innovation, and Infrastructure).                           of the version of the HadGEM3 model used in the 6th
   To date, from a Brazilian perspective, there are no studies that          Coupled Model Intercomparison Project (CMIP6) and hence
assess disaster risk under potential impacts of regional climate             is considered a “pre-CMIP6” model. The HadGME3A-GA3.0
change under different GWLs. Therefore, the objective of this                simulations ran from 1971 to 2100, driven by greenhouse
study is to provide projections and assess uncertainties of disaster         gas and aerosols concentrations from the RCP8.5 scenario
risk for flash floods and landslides. This is done to identify hot           and prescribed sea surface temperatures (SSTs) and sea ice
spots of the vulnerability of such disasters in Brazil for different         concentrations (SICs) from six projections from the earlier 5th
GWLs: 1.5, 2, and 4◦ C above pre-industrial temperatures. For this           Coupled Model Intercomparison Project (CMIP5) (Betts et al.,
we use Vulnerability-Exposure indices, climatic hazards (based               2018). The different SST and SIC patterns drove different patterns
on extreme rainfalls), and the potential impact derived from an              of atmospheric circulation change, allowing different patterns of
ensemble of climate models.                                                  regional climate change to be examined. Land cover patterns
                                                                             were fixed at the present-day state, so biophysical impacts of
                                                                             land use change or vegetation responses to climate change were
CONCEPTS AND TERMS USED IN THIS                                              not considered.
STUDY                                                                            GWLs of 1.5, 2, and 4◦ C were defined on the basis of the
                                                                             global mean temperature anomaly in the driving CMIP5 models
For this study, we define a potential impact of climate and                  relative to those models’ simulations of global mean temperature
geophysical hazards. This potential impact is the combination of             in 1,870–1,899. The climate state in a particular simulation at
the exposure and sensitivity on physical assets, natural resources,          each GWL was defined as the first 20-year period with that global
and systems. The concept of potential impact is based on the                 mean temperature anomaly. This meant that the time of passing
definition proposed by the IPCC AR5 (IPCC, 2014), which refers               a particular GWL was different in the six projections (Table 1).
to the effects on the natural and human systems caused by                        As GWLs increase, greater changes can be expected in the
extreme meteorological and climatic events and also by climate               corresponding climate scenarios, which are likely to produce
change. That this definition incorporates any impact that may                even more pronounced impacts. A previous study with this six-
come from meteorological events, whether these are the results of            member HadGEM3A-GA3.0 ensemble (Betts et al., 2018) shows
natural climate variability or the interference of climate change.           relatively large changes in extreme precipitation across many
    IPCC AR5 presented a framework focused on the concept                    parts of Brazil compared to other world regions at GWL 1.5
of “climate risk,” which is given by the interaction of the                  and GWL 2.0, with both increases and decreases being seen
dimensions defined as “hazards,” “exposure,” and “vulnerability.”            in different parts of the country. There are also substantial
Climatic hazards represent the potential for the occurrence                  differences between the individual ensemble members at local
of meteorological events that cause significant impacts on                   scales, even in the sign of the change. Nevertheless, when
human systems and their activities. Vulnerability refers to the              averaging over the IPCC reference regions (Iturbide et al., 2020),
propensity or predisposition of an element to be adversely                   there is a strong consensus between several different climate
affected by some hazard, and includes only the variables that                model ensembles on an increase in extreme precipitation over
represent sensibility and susceptibility to the events of flash floods       all regions of Brazil at 1.5 and 2◦ C global warming (Uhe et al.,
and landslides. Exposure refers to people’s presence and their
activities that can be adversely impacted by the events of flash
floods and landslides. The focus of this work is the impacts                 TABLE 1 | Set of global simulations with the HadGEM3A model and the
                                                                             corresponding CMIP5 forcing models.
caused in urban areas and, therefore, this dimension represents
the exposure of people within this territory.                                Atmospheric        CMIP 5 forcing          GWL 1.5          GWL 2.0         GWL 4.0
                                                                             model              model

                                                                             HadGEM3A           IPSL-CM5A-LR           2006–2036       2020–2050        2056–2086
METHODS
                                                                             HadGEM3A           GFDL-ESM2M             2021–2051       2037–2067              *
Models                                                                       HadGEM3A           HadGEM2-ES             1998–2028       2018–2048        2056–2086
This study assesses changes in risk of natural disasters (landslides         HadGEM3A           IPSL-CM5A-MR           2005–2035       2020–2050        2055–2085
and flashfloods) as a consequence of changes in extremes of                  HadGEM3A           MIROC-ESM-             2000–2030       2017–2047        2053–2083
temperature and heavy precipitation under GWLs of 1.5, 2, and                                   CHEM
4◦ C in Brazil. GWLs represents the variation of the global average          HadGEM3A           ACCESS1-0              2012–2042       2024–2054        2066–2096
anomaly of the air temperature at the surface in relation to the             Also listed are the time periods when GWLs of 1.5, 2.0 and 4.0◦ C are reached, using the
pre-industrial period (approximately 1,870–1,899), that is, the              RCP8.5 scenario.
increase or reduction in temperature in relation to that period.             *This realization did not reach the GWL 4.0 by 2100.

Frontiers in Climate | www.frontiersin.org                               3                                                March 2021 | Volume 3 | Article 610433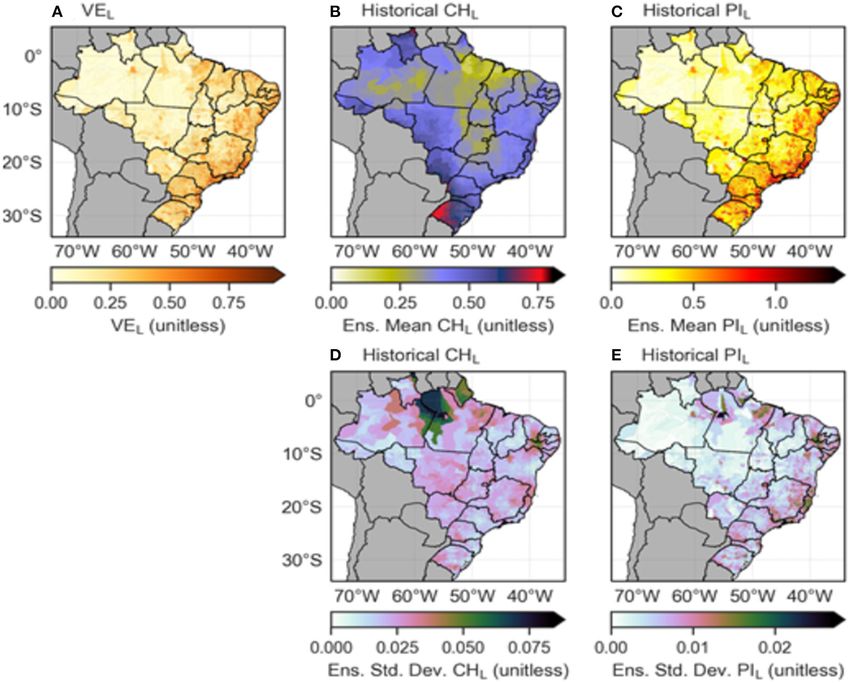
Marengo et al.                                                                                                          Disaster Risk Reduction and Climate

2021). That comparison of different climate model ensembles               TABLE 2 | Indices used to assess flash floods and landslides (adapted from
included the six HadGEM3A-GA3.0 projections as part of a larger           Debortoli et al., 2017).

ensemble of projections from HELIX.                                       Index                        Explanation
   Debortoli et al. (2017) used a different approach where climate
change impacts assessment models for flash floods and landslides          Potential Impact Index       A composite indicator that aims to provide a
were framed in long-term future time horizons (by the middle or           (PI)                         comparative assessment between Brazilian cities
end of the twenty-first century) by using downscaled scenarios                                         regarding the impacts that may be caused by
                                                                                                       geo-hydrological hazards (flash floods and
using the Eta 20 km regional model from two CMIP5 global                                               landslides) triggered by meteorological events. This
models. In this paper, the focus is Brazil at various GWL from                                         is the main index of this study and represents the
a high-resolution HadGEM3A global model. The impact models                                             potential for negative impacts associated with the
developed for landslides and flash floods in this work (different                                      triggering of flash floods or landslides, taking into
                                                                                                       account the climatic, physical, environmental, and
from those derived by Debortoli et al., 2017 using RCP4.5
                                                                                                       demographic characteristics of each Brazilian city.
and 8.5) are feed by the rainfall extremes projections from the                                        The higher the index, the greater the probability and
HadGEM3A-GC3.0 projections at the three GWLs shown in                                                  magnitude of impacts caused by geo-hydrological
Table 1.                                                                                               events
                                                                          Climatic Hazards             Represents the potential for flash floods or
Climate Extremes Indices                                                  Sub-Index (CH)               landslides to occur, in terms of probability and
                                                                                                       magnitude, taking into account the precipitation
To assess future risk of floods and landslides we used a subset of
                                                                                                       extreme indices and the equations developed by
extreme precipitation indices devised by Expert Team on Climate                                        Debortoli et al. (2017)
Change Detection and Indices (ETCCDI, Frich et al., 2002).                Vulnerability-Exposure       It represents the relationship between the
These indices are:                                                        Sub-Index (VE)               dimensions of vulnerability and exposure,
                                                                                                       incorporating the variables representative of
• Consecutive wet days (CWD): the annual maximum number                                                susceptibility (considering the particularities of flash
  of consecutive humid (rainy) days found within a year                                                floods and landslides events) and also of urban
  (in days),                                                                                           population density
• Maximum 1-day precipitation (Rx1D): the annual maximum
  recorded in 1 day precipitation total that could lead to flooding
  (in mm),
                                                                          empirical equation was reached that could be applied throughout
• Maximum 5-days precipitation (Rx5D): the annual maximum
                                                                          the national territory and, as a final result, obtained a map similar
  consecutive 5 days precipitation total that could lead to
                                                                          to the one presented in the Brazilian Atlas for Natural Disasters
  flooding (in mm),
                                                                          (CEPED-UFSC, 2013b). This step was carried out with the
• Extreme rainfall (R95P): the annual total precipitation, when
                                                                          climatic data of the present period (1971–2010), so that it could
  precipitation is >95th percentile of the 1961–1990 daily
                                                                          arrive at a close result and with the same pattern as the disaster
  precipitation distribution (in mm),
                                                                          maps of the Atlas, which refers to the period 1990–2010. The
For this study these indices were calculated annually and grouped         same empirical equation was used for future projections, where
for the historical period (1971–2010) and for the periods found           variables of the social and physical-environmental dimensions
for each GWL scenario. The result used for each index is the              were kept constant, so that only climatic data (as represented by
average of all annual values found for each period.                       the extreme climate indexes previously shown) are modified.
   The CWD index can be useful to identify areas subject to                   This basic premise for such extrapolation is based on the
gradual flooding. When this index is low (values around 7 days)           following arguments: (i) physical and environmental conditions
and coincides with high extreme indexes such as Rx5day, it                will remain the same in future periods or will undergo minor
can indicate that extreme precipitation phenomena occur in a              changes that can be considered irrelevant in the context; (ii) using
short period of time, facilitating the triggering of landslides and       the social data of the present in modeling future vulnerability
sudden floods.                                                            allows to identify regions where the climate will intensify it and,
                                                                          in this way, it is possible to provide information for the reflection
Indices for Floods and Landslides                                         and creation of public policies that improve the social aspects
These indices (Table 2) are based on three components:                    in these places and, thus, can reduce vulnerability as a whole,
(i) climatic simulations and projections, expressed by the                accelerate the adaptive process and/or mitigate possible impacts.
combination of extreme rainfall indices from section Flash                    In this study, the vulnerability assessment in the form of an
Floods derived from the HELIX models; (ii) socioeconomic,                 index does not incorporate metrics related to adaptive capacity
represented by the combination of socioeconomic indices                   due to the lack of representative data on the analysis scale
provided by IBGE (2011); (iii) physical-environmental, based              (municipalities). In other words, vulnerability contemplates only
on the crossing of different thematic maps, physical, and                 the variables that represent sensibility and susceptibility to the
environmental variables that reflect the susceptibility of each           events of flash floods and landslides. For exposure: this term
geographical area to trigger floods or landslides.                        refers to the presence of people and their activities that can be
   As in Debortoli et al. (2017), we tested different combinations        adversely impacted by the events of flash floods and landslides.
of significance weights for each of the variables used, until an          The focus of this work is the impacts caused in urban areas and,

Frontiers in Climate | www.frontiersin.org                            4                                             March 2021 | Volume 3 | Article 610433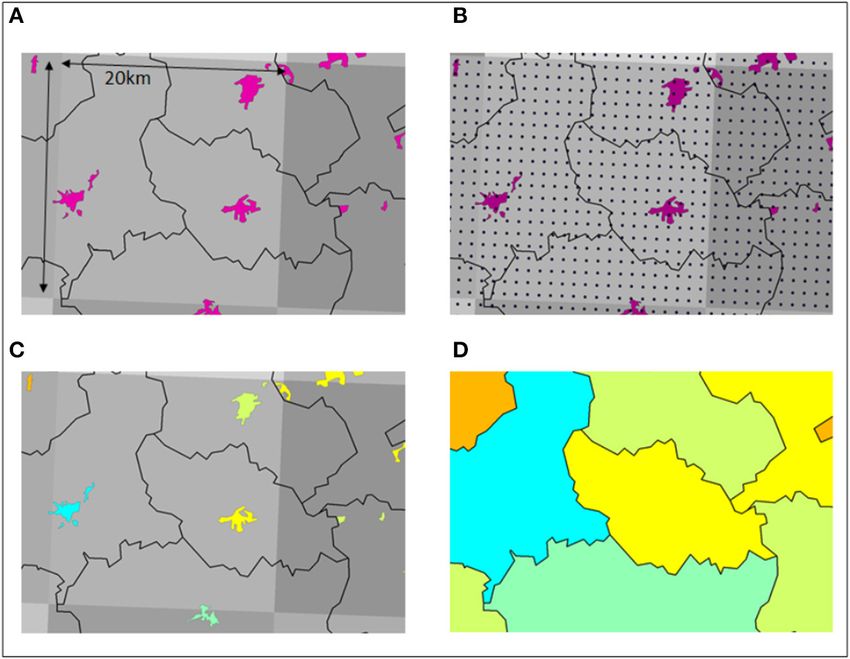
Marengo et al.                                                                                                       Disaster Risk Reduction and Climate

therefore, this dimension specifically represents the exposure of           are more accentuated in relation to the reference period and
people within this territory.                                               that only the map of the Potential Impact Index with absolute
   Potential impacts are evaluated separately for the historical            value does not allow to identify due to the subtle changes of
and future time-slices because the level of potential impact may            color scale between each period. Therefore, maps of relative
change as exposure changes over time. It is important to first              changes (PIrel. change ) were prepared that show the increments
evaluate historical trends and current baselines to understand              of the potential impact index for each future period (PI) in
the conditions and trends under which water systems are                     relation to the reference period (PIref ), according to the following
currently operating. To calculate the Potential Impact Index PI             Equation (3):
for historical (present 1971–2010) and future (until 2100), we use
the ensemble of the six climate simulations.                                                                     PI − PIref
                                                                                               PIrel. change =              ∗100                     (3)
                                                                                                                   |PIref |
Calculation of the Potential Impact Index
In this subsection we show details about the variables used in              To assess the uncertainties related to the results of the PI
each index / sub-index, for each type of hazard (flash floods and           ensemble, maps of the standard deviation were also generated for
landslides), as well as the equations to calculate such indices.            each period of analysis (PIstd. dev. ), According to Equation (4):
   For the Potential Impact, two different indices were calculated,
one for flash floods and the other for landslides. In each case,                                     r
                                                                                                          1 XN
specific variables that have a cause and effect relationship with                    PIstd. dev. =               (PIn − PImean )2                    (4)
                                                                                                         N−1 n=1
each type of hazard were used. However, the equation that defines
the two indexes has the same relational structure between its               Another way of presenting the results was through the evaluation
dimensions, according to Equation (1):                                      of agreement between the models in pointing out a positive
                                      ∗                                     or negative trend of the PI rel. change (rel. Change). In some
                         PI = VE             (1.0 + CH)          (1)
                                                                            situations, this type of information may be more important
The first term on the right side of Equation (1) (VE) aggregates            for sensitizing decision makers in formulating public policies
the concepts of Vulnerability and Exposure in a single sub-                 for adaptation and disaster risk reduction (DRR). Equation (5)
index, based on the characteristics of susceptibility to each of            represents the way in which this parameter was calculated for
the hazards and their interaction with the number of people                 each future scenario (GWL 1.5, 2.0, and 4.0):
coexisting in these conditions (more details next item). The
                                                                                               1 XN

second term on the right side of Equation (1) (CH) incorporates                                                   if PIn > 0 : SAn = 1
                                                                             PIsign agrmt. =          SAn ∗ 100                        (5)
the issue of the climate hazard, which represents the intensity and                            N  n=1            if PIn < 0 : SAn = −1
frequency of the rains potentially triggering such processes. It is
important to emphasize that the interaction of these dimensions             This indicator of convergence in the tendency (sign agreement)
through multiplication makes the rains only amplify the pre-                shows what percentage of models exhibit the same tendency.
existing condition given by the dimensions of Vulnerability and             +100%/-100% shows that all six models show increase/decrease
Exposure. This ensures that there are no false positive results             in tendency of change. This is independent on the magnitude of
with a high potential impact in places where rainfall is very               the change.
intense, but that there are not enough physical conditions for
the outbreak of the assessed hazards (e.g., lowland regions where           Climatic Hazards Sub-indexes
there is a lot of severe rainfall signaling high potential impact in        Some extreme indices, such as the annual maximum daily
case of landslides).                                                        precipitation amount or the maximum annual wind speed, have
   The PI index was calculated from the model ensemble for                  traditionally been modeled with different distributions of values
both the historical reference period (1971–2010) and future                 considered “extreme” in engineering applications. However, the
periods defined by the warming scenarios GWL 1.5, 2.0, and 4.0.             “extremes” used as indicators of climate change have a much
However, the only dimension that varies in future periods is the            broader context. While some of the indexes fall within the
climatic dimension (CH), keeping the others (VE) constant. The              traditional definition, most have no direct causal relationship
strategy used was to present the results of the ensemble of the             with the impacts to be analyzed. Therefore, it is important
models for each period of analysis (baseline, GWL 1.5, 2.0, and             to make this distinction when analyzing the rates of climatic
4.0). That is, first all CHs were calculated separately, and then the       extremes, since only a very small number of events can be
results were aggregated in the form of an ensemble, following the           assumed to be a really extreme value distribution (IPCC, 2012).
                                                                               As presented, each index in section Flash Floods reflects the
logic presented in the following Equation:                                  characteristics of a locality in receiving a certain type of extreme
                                                                            event, with its particularities and reference units. For this reason,
                                       1 XN                                 these indices needed to be reworked so that they can be related
                         PImean =             PIn                (2)
                                       N  n=1                               to each other, in order to explain the CH of the potential impact.
                                                                            Debortoli et al. (2017) suggest the linear normalization of these
One way of presenting the results of future climate projections is          indexes (between 0.00 and 1.00) and proposed the following
through maps of relative changes of the PI index. This strategy             Equations (6 and 7). These normalized indices are included in
was adopted to highlight the regions where the climate changes              the risk analysis of landslide disasters (CHL ) and flash floods

Frontiers in Climate | www.frontiersin.org                              5                                          March 2021 | Volume 3 | Article 610433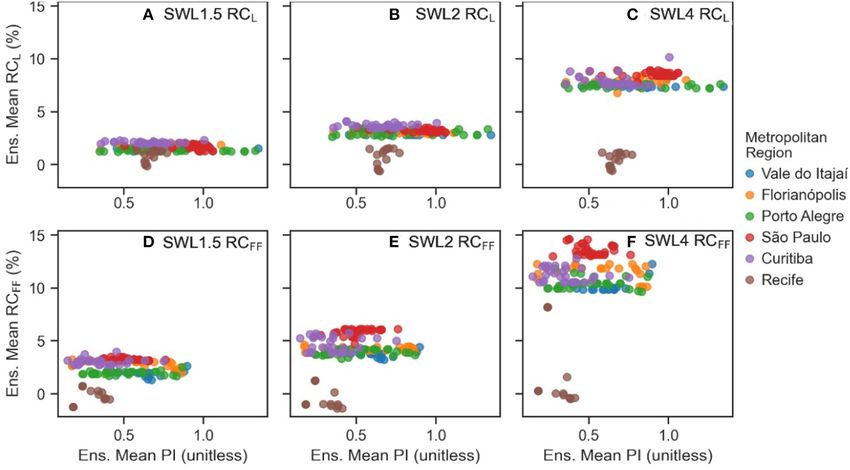
Marengo et al.                                                                                                   Disaster Risk Reduction and Climate

(CHFF ), respectively. In this study we use the same equations by             search for points that are within 500 m beyond this domain.
them defined:                                                                 For this step, the Spatial Join tool is used, with the Merge
                                                                              Rule configured for the Mean condition. This step takes place
      CHL                                                         (6)
                                                                              between Figures 1B,C.
        0.4∗ RX1day + 1.0∗ R95pTOT + 1.3∗ RX5day + 1.3∗ (1 − CWD)
      =                                                                     - The final result is a new shapefile for urban areas, exactly
                                    4
      CHFF                                                                    identical to the original, but now with a new attribute that
        1.75∗ RX1day + 0.5∗ R95pTOT + 0.5RX5day + 0.25∗ CWD                   refers to the average of the variable or index in question
      =                                                           (7)         (Figure 1C).
                                  3
                                                                            Given the size of the Brazilian territory, any maps that present
For landslides (Equation 6), the Rx5day indices and the inverse             their entire extension do not allow the proper visualization of
of CWD were those that had the greatest relevance for defining              urban areas. So, to overcome this limitation, an extrapolation was
the CH of vulnerability. This means that places that receive                made so to transfer the information obtained to urban areas to
rain events with large volumes that accumulate in up to 5 days,             the municipal polygon (Figure 1D).
and that do not usually have many consecutive days of rain
(that is, severe events in a short period) are those with the
                                                                            Vulnerability-Exposure Sub-index
greatest potential to trigger landslides. In the case of flash floods
                                                                            This sub-index represents the non-CHs associated with the
(Equation 7), the indexes with the most relevance were Rx1day
                                                                            impacts caused by flash floods and landslides. Different
and R95p, indicating that the intense rains that happen within a
                                                                            indices were elaborated for each type of hazard, considering
period of 24 h (or less) and the locations where the “very humid”
                                                                            representative variables for each case. As previously described,
days are characterized by high rainfall volumes are the main
                                                                            vulnerability in this study only contemplates the dimension
climatic factors that are associated with impacts of this nature.
                                                                            of “sensitivity,” given by the characteristics of susceptibility to
   A key feature of this work is that all the indices and sub-indices
                                                                            flash floods and landslides. The variables that make up the
presented were developed considering the limits of urban areas,
                                                                            sensitivity dimension are the same ones proposed in Figure 3 of
because in Brazil more than 90% of deaths caused by landslides
                                                                            Debortoli et al. (2017). In addition, the concept of “exposure”
and floods occur in urban areas (database from CEMADEN,
                                                                            was incorporated based on data from the urban population
between 2014 and 2020). That is, all variables used (climatic
                                                                            density of 2010 National Census (IBGE, 2011) for each Brazilian
or not) were considered only for the condition in which they
                                                                            municipality, which were weighted according to Table 3. This
are within the domain defined by the urban areas of each
                                                                            same database was used to calculate both VEL and VEFF . The
municipality. This is due to the fact that the two types of disasters
                                                                            way in which this dimension is related to the vulnerability data
assessed occur mainly in urban areas. The database of urban
                                                                            is detailed in the upcoming sections.
areas used in this work comes from the work by http://www.
wudapt.org www.wudapt.org. On the other hand, the visual
representation of the results only for the urban domain becomes
                                                                            Vulnerability-Exposure to Landslides Index (VEL )
unfeasible, since they are very small areas compared to the
                                                                            Landslides can be classified as geological and geotechnical
continental dimension of Brazil. For that, it was necessary a
                                                                            process related to soil downward movement, rocks, debris and/or
series of adjustments that would allow the presentation in a more
                                                                            organic material under the effect of gravity. Landslides are
adequate way.
                                                                            described as gravitational mass movements of soil that occur
   Most of the calculation steps to establish the indices were
                                                                            rapidly (De Vita et al., 1998). These mass movements can occur
made from spatial data in Raster format, specifically through
                                                                            in various formats such as rotational, translational, or shallow
the Map Algebra tool from the Spatial Analyst Tool of the ESRI
                                                                            landslides and debris flow. In Brazil, they often occur in slope
ArcGIS 10.1 software. In this way, the indices and variables used
                                                                            areas occupied by cutting slopes, embankments, or natural slopes
are presented spatially in grid points, where each point has a
                                                                            exacerbated by human activities. Landslide disasters have been
numerical value of its attribute. Consequently, within the same
                                                                            responsible for the highest death toll in the country (Carvalho
urban area polygon it is possible to have several values for a given
                                                                            et al., 2007; CEPED-UFSC, 2013a,b; Alvala et al., 2019). Since
variable, sub-index, or index. However, as one of the objectives
                                                                            they are typically induced by human activities, these disasters are
is to find the most critical cities and regions in Brazil, some
                                                                            therefore called mixed disasters.
procedures were adopted to calculate average values:
                                                                               The main factors in the aggravation of landslide risks are:
- Given a given variable (or index) that is in Raster format, a new         the release of waste water, the outflow from water supply
  TIFF file is created with dimensions of 1 × 1 km, regardless of           networks, the concentrated release of storm water, water
  its original resolution (Figure 1A);                                      infiltration, embankment cuts with excessive steepness and
- From this TIFF file, a point shapefile (Conversion Tools,                 height, inadequate landfill execution, improper disposal of waste,
  Raster to Points tool) is generated, where each generated point           and uncontrolled removal of forest cover (De Vita et al., 1998).
  represents the centroid of a grid box of points of dimension 1            Thus, to assess the vulnerability of the environmental dimension
  × 1 km (Figure 1B).                                                       considering landslides, we have established a spatial database
- The average of all points that are within the domain of the               that could represent the phenomenon at the national level, with
  polygons that define urban areas is calculated, allowing the              direct and indirect factors linked to its occurrence. The variables

Frontiers in Climate | www.frontiersin.org                              6                                     March 2021 | Volume 3 | Article 610433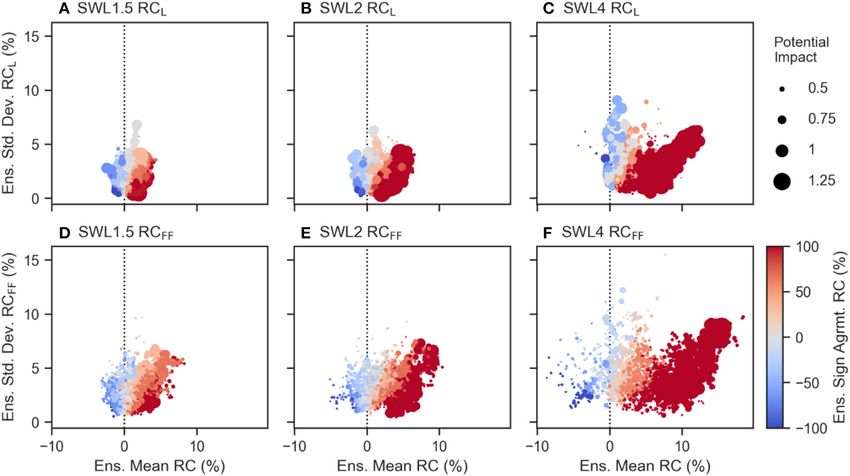
Marengo et al.                                                                                                                        Disaster Risk Reduction and Climate

 FIGURE 1 | Illustrative example of the aggregating spatial information process from the Raster format (gray squares in A–C) into polygons referring to the political
 division of Brazilian municipalities (D).

TABLE 3 | Weighting of the Urban Population variable, which defines the                   geographical spaces, which cannot be reflected on this map
Exposure dimension.                                                                       (and are precisely where landslides occur more frequently).
Urban population                                                      Exposure
                                                                                          Therefore, it was necessary to develop a slope categorization
                                                                                          taking into account such aspects, because slopes >30◦ and
>1,000.000                                                                1               45◦ are considered critical to landslide triggering but are not
500,000–1 min                                                            0.95             detected at this resolution. A continuous data adjustment was
250,000–500,000                                                          0.75             performed to later attribute weights to classify degrees of slope.
100,000–250,000                                                           0.5           • Landforms: This data set was developed by the Directorate of
Marengo et al. Disaster Risk Reduction and Climate
The phenomenon is described as an overflow above the indices used in this study were validated for the reference period
maximum capacity of the main river channel, usually caused (1971–2010). This was done by comparing with a history of
by heavy rains concentrated in steep regions. These conditions disasters provided by CEMADEN and Federal Civil Defense at
cause a sudden and violent rise in flow rates, and consequently, the municipality considered level. Similar intercomparison was
overflow (De Castro et al., 2003). In urban areas, flash floods done visually with the maps from the Atlas of Natural Disasters
usually result from a deficiency of water drainage systems, which (CEPED-UFSC, 2013b) by Debortoli et al. (2017). After the
may or may not be associated with river overflow. When causing validation, the potential impact model was fed with data from
minor impacts, flash floods are defined by the momentary the ensemble of future climate projections from the model for
accumulation of water in a given area, usually due to poor the three GWLs. The intention was not only to understand
drainage systems. To assess the vulnerability to flash floods where there may be an increase in impacts of flash floods and
dimension, we have established a spatial database that could landslides, but to identify if this tendency to increase in the future
represent the phenomenon at the national level, with direct and is detected in places where critical condition is already observed
indirect factors linked to its occurrence. This includes public in the present.
database maps related to runoff coefficients and the natural
dependence of the regions on their drainage network system. A Landslides
detailed description of the variables and processing can be found Figure 2 exhibits the results referring to the analysis for
in Debortoli et al. (2017): landslides, for the reference period. Figure 2A shows the
Vulnerability-Exposure sub-index for landslides (VEL ), The cities
• Roads (density): road maps provided by the IBGE with an
with high urban population density are shown (in darker
original scale of 1:250,000. The shapefile obtained from these
tones) and are inserted in mountainous and/or more rugged
data divides the road into two classes: paved and unpaved.
terrain regions. The most susceptible areas with the highest
• Natural Drainage System (density): hydrography maps
population density are on the east coast. This is mainly detected
provided by IBGE with the original scale of 1:250,000. It was
in the Southeast and Southern regions of the country. This is
calculated directly from its linear vector (streams) density
consistent with Debortoli et al. (2017), specifically the physical-
(km/km2 ). The final map is normalized on a scale of 0.00
environmental dimension presented by the authors.
to 1.00.
Figure 2B shows the ensemble for the Climatic Hazard sub-
• Flooding vulnerability Mapping (density): Flooding
index for landslides. The maps represent the spatial distribution
Vulnerability Atlas provided by the National Water Agency—
of climatic conditions that potentially trigger landslides. That is,
ANA (Agencia Nacional de Aguas—ANA, 2014) was prepared
the shades of dark red represent regions with more intense and
from the orthorectified hydrology cartographic base at a scale
severe rains that happen in a 5-day period (Rx5day). The dark
of 1:1,000,000.
blue shades the rain regimes do not characterize a sequence of
consecutive very long rainy days (CWD).
1.5∗ VFMap + 0.5 RdDens + 0.25 DDens The regions with the largest changes are the extreme south,
VEFF = ( )
2.25 southwest and northwest sections of the country. This map has
∗ 1 + Exposure (9) some patterns similar to those observed by Debortoli et al. (2017)
when they assessed the CH of vulnerability. However, at the time,
Where: VFMap is flooding vulnerability mapping, RdDens is the the authors used other models (Eta-MIROC and Eta-HadGEM2
road density and DDens is the drainage system density. ES), that also highlighted much of the country’s east coast. This is
As in the case of Equation (8) (VEL ), the first term on the a feature not observed in the present study. Figure 2D represents
right side of Equation (9) refers exactly to the model that was the standard deviation of the model ensemble (Figure 2B),
proposed by Debortoli et al. (2017), with the exception of the land highlighting in lighter tones (light blue and pink) the locations
use variable that was not included in the present study, which is where there is a consensus among climate models and. On the
focused on urban areas. The second term in Equation (5) refers to other hand, the darker tones (green and dark blue) indicate where
the urban population that, in this model, will be able to increase there is the greatest divergence. For much of Brazil the standard
the sensitivity by up to 100% for cases where the municipalities deviation is relatively low. However, the northern part of the
have more than one million inhabitants. country show signals of greater inter model fluctuations relative
to the average.
RESULTS AND DISCUSSIONS However, Figures 2A,B are not enough to represent where
the impacts caused by landslides are more frequent and severe.
In Brazil, about 85% of disasters are related to rainfall or a lack This is because the necessary condition to identify these
of it. Flash floods and landslides have resulted in more than impact scenarios must consider environmental, demographic
10,000 deaths in the last five decades. Southern Brazil is the most and climatological attributes. This joint assessment is represented
exposed and vulnerable to climate-related disasters triggered by by the spatialization of the potential impacts index for landslides
extreme rainfall (Ávila et al., 2016; De Almeida et al., 2016; (Figure 2C). This map identifies some “hotspots” in the eastern
Debortoli et al., 2017; Alvala et al., 2019). sections of the Southern, Southeastern and Northeast Brazil
Before presenting the results, some important aspects are regions. These are the regions historically impacted by disasters
highlighted to understand the maps with relative changes. The related to landslides, consisting with findings by Debortoli
Frontiers in Climate | www.frontiersin.org 8 March 2021 | Volume 3 | Article 610433Marengo et al. Disaster Risk Reduction and Climate FIGURE 2 | Geographical distribution of (A) the vulnerability-exposure index for landslides (VEL ), (B,D) the ensemble mean and standard deviation of the historical climatic hazards index for landslides (CHL ), respectively. Maps (C) and (E) shows the ensemble mean and standard deviation of the historical potential impact index for landslides (PIL ). et al. (2017) and the Natural Disaster Atlas (CEPED-UFSC, influence of CHL will be small in the value of PIL . This makes the 2013b). The most affected are the states of Santa Catarina, standard deviation of the potential impact index for landslides São Paulo, Rio de Janeiro, and Espírito Santo in southern and also small, as observed in great part of the north-central portion southeastern Brazil and in the states of Bahia and Pernambuco of the country. in northeast Brazil. Figure 3 shows the results of the ensemble of projections of The PIL map (Figure 2C) shows the model ensemble of relative changes of PIL for the various GWLs. The maps represent the VEL sub-index for the six different model runs. As this how much the future indexes increased or decreased relative interaction is not linear (see Equation 1), the distribution of the to the baseline. The individual model maps are not presented standard deviation associated within this ensemble (Figure 2E) because it would be difficult to visually identify changes in the was calculated. In general, this map indicates that the hotspots absolute values of the index. The upper part of Figure 3 shows identified by the PIL (Figure 2C) have low or medium standard the maps of relative changes for each heating scenario, being deviation, with the exception of a portion of the east of the (Figure 3A) for the GWL 1.5 (Figure 3B) 2.0 and (Figure 3C) Southeast region (state of Espírito Santo). The lowest values of 4.0. At the lower panel standard deviation maps (Figures 3D–F) the standard deviation refer to the regions with the lowest PIL. are shown. The hatched areas show regions where there is a This characteristic is in accordance with the conceptual structure consensus among models >66% (positive or negative signals) for of the potential impact index for landslides (Equation 1). This the projected change. shows that vulnerability and exposure (VEL ) are the limiting It is noted that in almost all of the Brazilian territory there is factors for the impact. The CH can only amplify this potential a signal of an increase in the PIL , with small exceptions in part condition. That is, although there is a great divergence between of the central and northern regions of the country. In general, the models (as in the extreme North, shown in Figure 2D, the this increase is more explicit in the most critical scenarios (GWL Frontiers in Climate | www.frontiersin.org 9 March 2021 | Volume 3 | Article 610433
Marengo et al. Disaster Risk Reduction and Climate
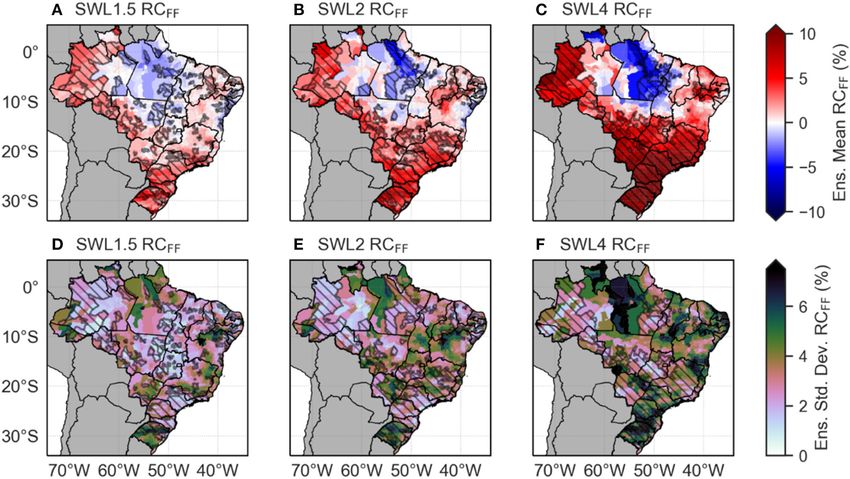
FIGURE 3 | Geographical distribution of the ensemble mean (A–C) and standard deviation (D–F) relative changes of the potential impact index for landslides (RCL )
with respect to the historical period for various scenarios: (A,D) GWL1.5; (B,E) 2.0; and (C,F) 4.0. The hatch pattern represents areas where the ensemble sign
agreement presents values above or below +66 or −66%, respectively.
2.0 and 4.0). This is detected in Southern and Southeastern that the absolute values of the PIL are also high. Large part
regions and in the Western Amazon. Moreover, the risk scenario of the country exhibits low values of standard deviation, in all
observed for the Southern and Southeastern regions is more scenarios, extending from Western Amazonia all the way to
critical. This is because these are densely populated regions West Central Brazil to the Southern and Southeastern regions.
very susceptible to landslides (Figure 2C). These regions require The coastal region of northern Brazil also shows significant
special attention and require disaster risk reduction policies and increases in the PIL as suggested by the consensus among
adaptation strategies. In addition to the clear signs of increased models. However, this is not a region with a history of disasters
potential impact, these regions show consensus (hatched regions) related to landslides. In general, the Northern Brazil region
among models. This characterizes less uncertainty of the results does not present conclusive or expressive results regarding the
and, therefore, provides subsidies for directing more assertive intensification of impacts caused by landslides. This may be
strategies to reduce future impacts. linked to the lack of skill of climate models in predicting the
The interpretation of an increase in the PIL value of 10%, for future changes in rainfall extremes.
example, does not mean that future losses and impacts may be The metropolitan regions in eastern portion of Northeast
10% greater than those observed in the past. The social structure Brazil are recurrently impacted by landslide events. Bandeira
of human systems within Brazil cannot be expressed in the scale and Coutinho (2015) showed that in the Metropolitan Region
of analysis adopted. This means that the real impacts can be much of Recife landslides caused a total of 214 deaths between 1984
greater than this 10%, because in practice the impacts do not and 2012. More recently, according to newspapers, the city of
follow a linear logic. Considering that this system is non-linear, Recife was affected by a landslide that killed 8 people on July
such disturbances could take proportions never before observed 24 2019 (https://riotimesonline.com/brazil-news/rio-politics/
due to certain thresholds being overcome. It is recommended that heavy-rainfall-kills-at-least-eight-and-causes-landslides-and-
these relative values be understood only as a spatial reference. flooding-in-recife/), 7 people in December 24 2019 (https://www.
These shows contrasts between different regions. These may be theguardian.com/world/2019/dec/24/seven-die-in-landslide-
more or less impacted in the future, and not as a way to predict in-brazilian-city-of-recife). It is suggested that more detailed
the future impact itself. studies on impacts of climate-related disasters should be done
The standard deviation in the previously mentioned regions for this region.
shows the lowest values where the largest changes in PIL are
observed. This means that there is not much fluctuation between Flash Floods
the resulting values for each member and suggests a good The maps in Figure 4 shows the results flash floods for the
reliability of the results. Only in the GWL 4.0 scenario, higher baseline. Figure 4A exhibits the Vulnerability-Exposure (VEFF )
values of the standard deviation are projected in the southern sub-index, where cities with high urban population density are
region (in green tones), but it can also be attributed to the fact highlighted (in darker tones) and in regions more susceptible to
Frontiers in Climate | www.frontiersin.org 10 March 2021 | Volume 3 | Article 610433Marengo et al. Disaster Risk Reduction and Climate
FIGURE 4 | Geographical distribution of (A) the vulnerability-exposure index for flash floods (VEFF ), (B,D) the ensemble mean and standard deviation of the historical
climatic hazards index for flash floods (CHFF ), respectively, as well as (C,E) the ensemble mean and standard deviation of the historical potential impact index for flash
floods (PIFF ).
flashfloods. The regions with highest vulnerability and exposure Furthermore, Figure 4B shows the spatial distribution of
are located in the South and Southeastern regions of Brazil and in heavy rainfall rains that potentially can trigger flashfloods, as
some sections of the eastern coast of Northeast Brazil. This result shown by the CHFF index. In this map, the extreme south of
is consistent with similar maps from Debortoli et al. (2017), when Brazil stands out, together with the state of Acre in Western
compared with the physical-environmental dimension used by Amazonia, and the state of Amapá in the extreme northern
the authors. This would be equivalent to VEFF . These regions Amazonia. The quality of these results is more linked to the
show positive trends in heavy rainfall, in terms of frequency and skill of the models used to represent the climatic behavior in the
magnitude during the 50 years or so (Sillmann et al., 2013; Magrin Brazilian territory.
et al., 2014). Figure 4B shows the spatial distribution of heavy rainfall
Figure 4C represents the potential impact index for flash rains that potentially can trigger flashfloods (CHFF ). In this map,
floods PIFF as a composite of Figures 4A,B. The spatial patterns southern Brazil, Western and extreme northern Amazonia show
observed are similar to those in Figure 4A, with the difference the highest CHFF . The quality of these results is more linked
that the highest values are in the Southern and Southeastern to the skill of the models used to represent present climate. In
regions. These show large population density, where urban the lower panels, Figures 4D,E show the standard deviation of
development coexists with a series of infrastructure problems. Figures 4B,C, respectively. The above-mentioned regions exhibit
This favors the occurrence of disasters caused by flashfloods. the greatest divergence among models. This may be linked to
These results are also similar to the spatial patterns observed by variability in the regional climate due to the different forcing
the vulnerability index proposed by Debortoli et al. (2017), with SSTs linked to representation of extreme rain events. This can be
a difference that they show also high PIFF in the Northeast Brazil. explained due to the scarce number of rainfall stations that makes
The results of Figure 4C the consistent with the Atlas of Natural the validation process of the models difficult.
Disaster occurrences (CEPED-UFSC, 2013b) used as a reference Figure 4E shows that the PIFF variability is relatively less
for validation in the work of Debortoli et al. (2017). than that of Figure 4D. This is because of the potential impact
Frontiers in Climate | www.frontiersin.org 11 March 2021 | Volume 3 | Article 610433Marengo et al. Disaster Risk Reduction and Climate FIGURE 5 | Geographical distribution of the ensemble mean (A–C) and standard deviation (D–F) for relative changes of the potential impact index for flash floods (RCFF ) with respect to the historical period under various scenarios: (A,D) GWL1.5; (B,E) 2.0; and (C,F) 4.0. The hatch pattern represents areas where the ensemble sign agreement presents values above or below +66 or −66%, respectively. index for flash floods is more linked to the characteristics of et al., 2020a,b). The regions with the highest values of RCFF vulnerability and exposure (VEFF ), and in less degree to the CH are precisely the large urban centers and metropolitan regions given by CHFF sub-index (see Equation 2). Some municipalities of cities of the Southern and Southeastern Brazil. These regions in the Southeast region show high standard deviation, with the already show a high PIFF in the present (Figure 5C) and exhibit high largest values in the state of Minas Gerais where the highest a history of recurring disasters related to flashfloods (Nobre PIFF index is found. et al., 2011; Xavier et al., 2014). Moreover, these cities have The maps in Figure 5 show the results of the relative changes more resources and adaptive capacity, which would facilitate the (RCFF ) of the PIFF index for the three warming scenarios. In the implementation of adaptation measures to reduce disaster risk. lower panels the respective standard deviation maps are shown. The results presented in this work may serve as a basis As expected, the patterns shown in the RCFF map are similar to to justify the need for future actions focused on disaster risk those for landslides shown in Figure 4. This makes sense, since reduction. It is necessary to mention that in these same regions the same rainfall extreme indices were used (Rx1day, Rx5day, there is a large number of smaller municipalities with less CWD, and R95p), even if the equations were different (Equations documented history of disasters. In any case, these the results 1 and 2). The southern region of Brazil exhibits the highest values suggest that they will also be more impacted by extreme rainfall for relative changes since the GWL 1.5 scenario. This pattern is events. It is difficult to predict whether such events will cause intensified in the warmer scenarios (GWL 2.0 and 4.0), covering disasters in the future, but the evidences are enough to mobilize a larger area that including Southeastern Brazil. This projected stakeholders in order to organize human systems and activities. pattern follows exactly the same trend identified by Debortoli With these measures it would be possible to increase their et al. (2017). Western Brazil also shows high values of RCFF , capacity to cope with possible severe flashfloods. In general, there suggesting that extreme short-term precipitation events may be is a potential risk for increasing impacts caused by flashfloods, intensified throughout this region in the future. In all these both in spatial scope and in absolute values. regions, there is consensus among models, suggesting an increase The standard deviation maps (Figures 5D–F) show high in extreme rainfall events (hatched areas). values projected in the in extreme southern Brazil. In this case, In the semiarid Northeast Brazil, there are high values of the while the models show convergence in the tendency of increasing RCFF , mainly from GWL 2.0. However, there are divergences impacts (hatched regions), there is a large intermodel variability among models in signaling this significant increase. This does relative to the mean. In other words, although the average of not allow for any conclusion for this region for flash floods in the RCFF is around 10% in these regions, some models have the future. This region shows a tendency for drought conditions much higher values (close to 20%), while others have lower and aridification in the future in warming scenarios (Marengo values. This represents some uncertainty regarding the absolute Frontiers in Climate | www.frontiersin.org 12 March 2021 | Volume 3 | Article 610433
Marengo et al.                                                                                                                        Disaster Risk Reduction and Climate

 FIGURE 6 | Scatter plot of ensemble mean (x-axis) and standard deviation (y-axis) for relative changes of potential impact with respect to the historical period for
 landslides (A–C) and flash floods (D–F) under various scenarios: (A,D) GWL1.5; (B,E) 2.0; and (C,F) 4.0. The color of the dot represents the ensemble sign
 agreement. The size of the circle is proportional to the potential impact reached during each scenario.

value of the RCFF . The maps suggest a future intensification of                         in the Eastern Coast of Northeast Brazil that are vulnerable and
extreme rainfall events in this region. Impacts would be more                            exposed to the impacts of landslides and floods in present.
significant if there are no adaptation measures to reduce the                                The population living in large cities in Southern and
risk of these disasters. In addition, as explained in the case of                        Southeastern Brazil, as well as on the coast of Northeast Brazil
landslides, the value of the RCFF must be observed only as a way                         are commonly stricken by natural hazards, especially floods and
of understanding the different potential impacts in Brazil.                              landslides. Fatalities occur due to the presence of housing in areas
                                                                                         susceptible to flooding and landslides, and in all these situations,
                                                                                         existing government structures have not been sufficient to
Integrated Analysis                                                                      prevent deaths, as in the Metropolitan Area of São Paulo (Nobre
Figure 6 shows an assessment of the statistical distribution of                          et al., 2011; Di Giulio et al., 2018; Young et al., 2019; Marengo
relative changes of PIL and PIFF in relation to the respective                           et al., 2020a; Travassos et al., 2020), in the Itajai Valley in the state
standard deviations for urban areas. It is noted a similar pattern                       of Santa Catarina (Marengo, 2009; Xavier et al., 2014), in the state
for both landslides and flashfloods. With higher warming levels                          of Rio de Janeiro (Marengo and Alves, 2012) and Recife (Bandeira
the number of cities that have high relative change in both                              and Coutinho, 2015). In Santa Catarina state in southern Brazil,
potential impact indices increase. In addition, the greater is the                       22–24 November 2008 saw heavy rainfall over, which caused
agreement among models (shades in red at the right side). It                             severe floods and deadly mudslides with 120 fatalities reported
is important to note that in the GWL 4.0 scenario there is a                             (Marengo, 2009). In the highlands of Rio de Janeiro, in January
significant increase in the higher relative change values, in some                       2011, heavy rainfall sparked flash flooding and mudslides claimed
cases beyond 10%.                                                                        the lives of 916 people while 345 are still missing, and 35,000
    The observed spread also allows us to identify that the cities                       people were left homeless (Marengo and Alves, 2012).
with high absolute values (larger circles) exhibit high relative                             In Figure 7, the horizontal axis represents the PIL and PiFF
change in the potential impact index. This can be considered                             for the baseline period. The further to the right, the greater the
critical as they are cities that at the present show high-risk of                        risk in that region considering the baseline. We emphasize the
hydro-geological disaster. This risk tends to increase in future                         values of horizontal axis are fixed for all GWL scenarios. The
warmer climate scenarios, mainly due to the intensification of                           vertical axis refers to the values of the relative changes (RC)
extreme rain events.                                                                     between the IP of the future scenarios and the baseline. The
    Based on the analysis of Figures 6, 7 shows changes in the                           purpose of this graph is evaluating that some regions already
PIL and PIF (RCL and RCFF , respectively, in the y axis) relative                        have a high risk at the present time and may be more impacted
to the PIL and PiFF for the present (x axis). This plot of some                          in the future, depending on the warming scenario. In the case
metropolitan regions of Southern and Southeastern Brazil and                             of landslides (Figures 7A–C), it is noted that practically all the

Frontiers in Climate | www.frontiersin.org                                          13                                             March 2021 | Volume 3 | Article 610433
You can also read