BARCELONA RESILIENCE ACTION PLAN 2020 - 2030 RESILIENCE TO CLIMATE CHANGE WITH FOCUS ON URBAN WATER CYCLE - RESCCUE
←
→
Page content transcription
If your browser does not render page correctly, please read the page content below

BARCELONA
RESILIENCE
ACTION PLAN

RESILIENCE TO CLIMATE CHANGE WITH
FOCUS ON URBAN WATER CYCLE

2020 – 2030
Barcelona City Council

 i
BARCELONA RESILIENCE ACTION PLAN

Barcelona City Council
Plaça de Sant Jaume, 1, 08002 Barcelona, Spain
https://ajuntament.barcelona.cat/en/

Authors and contributors

 AUTHORS                                       ROLE                                INSTITUTION

 City Council Coordinator: Andoni González Barcelona Research Site                 Barcelona City Council
                                           contributions and
 Team: Ares Gabàs                          development                             https://ajuntament.barcelona.cat/en/

 Coordinator: Maria Adriana Cardoso            Methodology and                     LNEC
 Team: Rita Brito, Cristina Pereira            development coordination            http://www.lnec.pt/en
                                               Barcelona Research Site             RESCCUE ES partners:
 Research Coordinator: Beniamino Russo
                                               contributions and                   AQUATEC, https://suez-advanced-solutions-
 Team: Montse Martínez, Marc Velasco           development                         spain.es/

 CONTRIBUTORS                                   INSTITUTION
 José Luis Domínguez                           RESCCUE ES partners: IREC, https://www.irec.es/en/
 Daniel Sánchez Muñoz
 Miguel Pardo                                                              ENDESA, https://www.endesa.com/en
 Robert Monjo                                                              FIC, https://www.ficlima.org/

 Eduardo Martinez, Maria Guerrero,                                         Cetaqua, https://www.cetaqua.com/en/home
 Edwar Forero
 Giovanni Pagani, Hélène Fourniere                                         UN-Habitat, https://unhabitat.org/
 Luca Locatelli                                                            AQUATEC, https://suez-advanced-solutions-spain.es/

 DATE                    VERSION
 16/08/2019              1.0 - Proposal of RAP 1st part
 22/11/2019              2.0 - Revision and update of RAP 1st part
 13/12/2019              3.0 - Clarifications to part 1 and addition of proposal of RAP 2nd part
 21/01/2020              4.0 - Revision and update of RAP 2nd part
 03/07/2020              5.0 - Revision and update of pre-final complete version
 30/07/2020              6.0 - Final revision and pre-final version
 06/08/2020              Final version

This plan is based on a template provided by RESCCUE Project (H2020 RESCCUE - RESilience to cope with Climate Change
in Urban arEas - a multisectorial approach focusing on water, Grant Agreement no.700174): www.resccue.eu

Cover photo by Vicente Zambrano González, 2014. Back cover photo by Maria do Céu Almeida.

To cite this document:

González, A., Gabàs, A., Cardoso, M.A., Brito, R.S., Pereira, C., Russo, B., Martínez, M., Velasco, M., Domínguez, J.L.,
Sánchez-Muñoz, D., Pardo, M., Monjo, R., Martinez, E., Guerrero, M., Forero, E., Pagani, G., Fourniere, H., Locatelli, L.
(2020). Barcelona Resilience Action Plan. In Resilience Action Plans of the RESCCUE cities. D6.2 RESCCUE project (Public).

                                                                      ii
TABLE OF CONTENTS
ACRONYMS AND ABBREVIATIONS ......................................................................... v
EXECUTIVE SUMMARY ......................................................................................... vii
1. INTRODUCTION.................................................................................................. 1
   BACKGROUND........................................................................................................ 1
   ABOUT THE PLAN ................................................................................................... 2
     Plan scope, focus and time horizon .................................................................... 2
     Addressed urban services .................................................................................. 3
     Planning process ................................................................................................ 4
     Document structure ........................................................................................... 5
2. CITY CHARACTERIZATION ................................................................................... 6
   CITY PROFILE .......................................................................................................... 6
   SERVICE PROFILE .................................................................................................... 9
3. CLIMATE CHANGE SCENARIOS AND RISK ASSESSMENT .................................... 13
   HAZARDS SOURCES AND PLANNING SCENARIOS ................................................. 13
   RISK ASSESSMENT ................................................................................................ 17
4. RESILIENCE ASSESSMENT AND SWOT ANALYSIS ............................................... 22
   RESILIENCE ASSESSMENT ..................................................................................... 22
   SWOT ANALYSIS ................................................................................................... 27
5. RESILIENCE STRATEGIES ................................................................................... 29
   IDENTIFICATION OF STRATEGIES .......................................................................... 29
   STRATEGIES TO IMPLEMENT ................................................................................ 30
   CO-BENEFITS AND IMPACT ON RESILIENCE OBJECTIVES ...................................... 43
   PRIORITIZATION ................................................................................................... 45
   PROPOSED IMPLEMENTATION PLAN ................................................................... 46
6. RAP MONITORING AND REVIEW PROCESS ....................................................... 47
   MONITORING ....................................................................................................... 47
   REVIEW ................................................................................................................ 47
7. FINAL REMARKS ............................................................................................... 49
   MAIN BENEFITS AND FUTURE CHALLENGES ......................................................... 49
   Acknowledgements.............................................................................................. 50
REFERENCES ........................................................................................................ 51

                                                             iii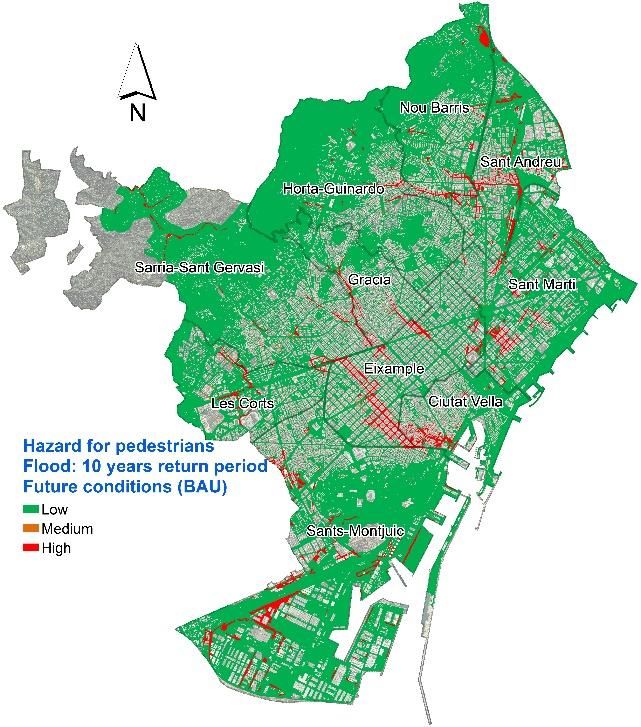
ACRONYMS AND ABBREVIATIONS
100 RC          100 Resilient Cities project pioneered by the Rockefeller Foundation
1D/2D USM       1 Dimension/2 Dimensions Urban Stormwater Model
AS              Adaptation scenario
BASEMENT        Basic Simulation Environment
BAU             Business as Usual
BCASA           Barcelona Cicle de l'Aigua, SA
C40             Network of the world megacities committed to addressing climate change,
                initially with 40 cities
CBA             Cost Benefit Analysis
CC              Climate change
CEA             Cost-effectiveness analysis
COP21           Conference of Parties - United Nations Framework on Climate Change
CRPP            City Resilience Profiling Programme
Csa             Hot-summer Mediterranean climate (Köppen climate classification)
CSO             Combined Sewer Overflow
DPLAN           Distribution Planning
EAD             Expected Annual Damage
EPANET          Application for Modelling Drinking Water Distribution Systems
GDP             Gross Domestic Product
GIS             Geographic Information System
ICLEI           Local Governments for Sustainability global network
Infoworks ICM   InfoWorks Integrated Catchment Modelling
Mx              Measure reference number x
MVA             Megavolt amperes
RAF App         Resilience Assessment Framework web-based tool
RAF             Resilience Assessment Framework
RAP             Resilience Action Plan
RCP             Representative Concentration Pathway
RESCCUE         RESilience to cope with Climate Change in Urban arEas
                                                 v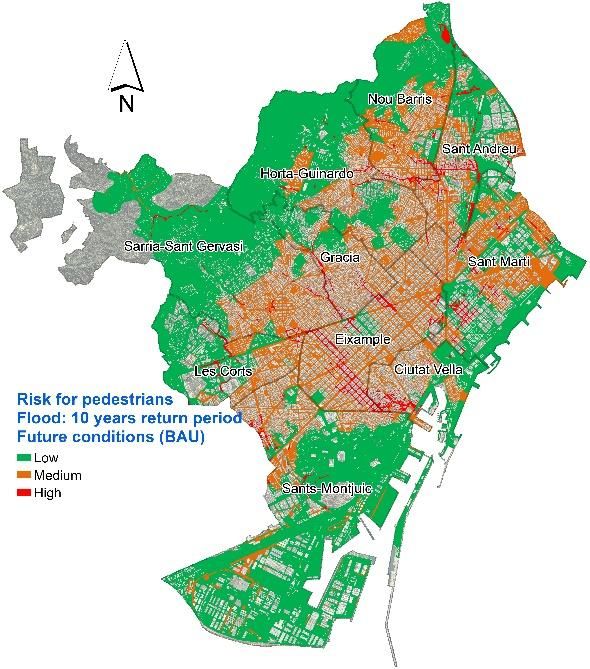
Sx       Strategy reference number x
SIMGES   Simulation Model of Water Resource Management
SO       Strategies that use the strengths to exploit opportunities
ST       Strategies that exploit strengths to overcome any potential threats
SUDS     Sustainable Drainage Systems
SUMO     Simulation of Urban Mobility
SWMM     Storm Water Management Model
SWOT     SWOT analysis (or SWOT matrix) to identify strengths (S), weaknesses (W),
         opportunities (O), and threats (T)
TOWS     TOWS analysis to link the different components of a SWOT together to come
         out with clear actions (SO, WO, ST, WT)
Tx       Return period of x years
UCLG     United Cities and Local Governments
UNISDR   Presently UNDRR, United Nations Office for Disaster Risk Reduction
WO       Strategies that mitigate weaknesses, by exploiting opportunities
WT       Strategies attempting to minimise weaknesses to avoid the impact of threats
WWTP     Wastewater Treatment Plant

                                        vi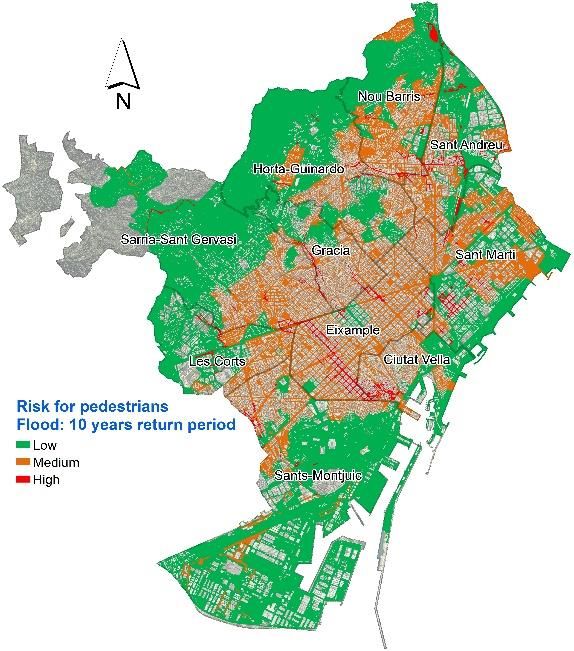
EXECUTIVE SUMMARY
Barcelona is firmly committed to fight against climate change and the negative effects it can cause to its
population. The city has been sensible to this problem for many years and has worked so much in the
adoption of international and local commitments as in the approval of different measures or plans focused
on mitigating the effects of or adapting to climate change. In 2018, Barcelona presented the Climate Plan,
fulfilling the commitment made when signing the Covenant of Mayors for Climate and Energy (2017) and the
COP21 Paris Agreements.
The Climate Plan’s timeframe runs to 2030, and it includes both short term (2018-2020) and medium-long
term (2021-2030) objectives and strategic measures. It has 4 strategic axes: mitigation,
adaptation/resilience, climate justice and the promotion of citizen action; 5 areas and 18 lines of action that
result in 242 different measures.
The Climate Plan becomes an opportunity to join forces making Barcelona a pioneer city, responsible for its
contribution to climate change and that is prepared to be less vulnerable to its effects and more equitable
and participatory. It has received several international distinctions as the certification of the network of cities
for climate leadership C40, recognizing the high quality of the Climate Plan and its compatibility with the
Agreement of Paris; and the award for the best initiative of major European cities by the Covenant of Mayors
for Climate and Energy, becoming a fully complying city.
The RESCCUE project arose as an opportunity to enhance several aspects of the Climate Plan mostly related
to the improved knowledge on climate projections, the development of sectorial and integrated models to
better understand the behaviour and response of the main urban services and infrastructures in extreme
weather events, with special regard for services interdependencies and cascade effects. The Resilience
Action Plan developed within the RESCCUE project aims to update and complement the Climate Plan
measures and strategies regarding the main results of the project.
This Resilience Action Plan (RAP) has been developed for its city boundaries (mainly urban and peri-urban
areas). The present planning has a medium/long-term horizon, of 10 years, from 2020 to 2030, in articulation
with the strategic planning horizons for Barcelona. In this sense, Barcelona RAP can be considered as a “living
document” with decadal periodic updating. Notwithstanding, it refers to other information sources with a
broader horizon, e.g. 2100, like the studies carried out within RESCCUE about climate projections, impact
analysis and Cost Benefit Analysis of adaptation measures.
The scope of this plan is to improve the Barcelona urban resilience to climate change with special focus on
the water sector and other main services potentially affected due to cascade effects.
According to the Climate Plan 2018-2030, the Barcelona vision is to be a proactive city that adopts a
comprehensive approach to tackling the challenge of climate change and assume its responsibility in that
regard; a city that can find opportunities in difficulties and adapt to new climate conditions intelligently,
generating co-benefits for people and socio-economic activity; setting the pillars of a more sustainable
Barcelona:
A socially fair Barcelona, that takes the social, economic, gender, territorial and cultural diversity of
its citizens into account when applying policies and measures.
A safe, habitable Barcelona that enables people to live in comfort and social cohesion, with quality
green areas, and generates safe, friendly spaces that are suitable for everyone.
vii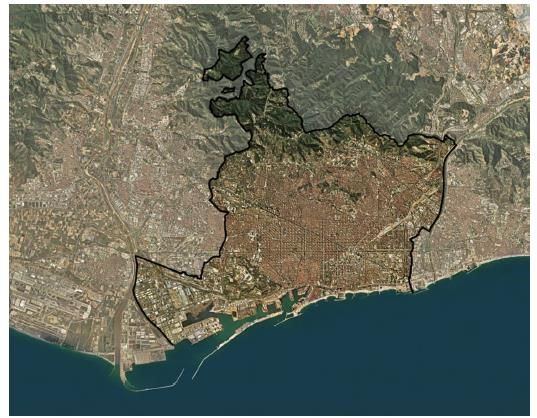
A healthy Barcelona that promotes active living, where you can breathe clean air and enjoy quality
public spaces, and people’s health and well-being is guaranteed.
An efficient, renewable Barcelona with sustainable mobility that makes good use of its resources
and closes cycles.
A low-carbon, distributive Barcelona that is not so dependent on fossil fuels for generating energy,
nor products and services, and where economic benefits are distributed among its inhabitants.
A Barcelona that learns, tries out solutions every day and never forgets, that moves forward and
improves every day but is aware it still has a lot to learn.
And some committed Barcelonians, men and women who know they can change the situation by
their actions and protect the future for the generations to come.
The Barcelona mission is to reduce vulnerabilities, increase health, improve the quality of life of their
inhabitants and become more responsible by:
reducing Barcelona’s contribution to climate change.
anticipating climate risks to ensure the city continues to function and improve its response
capacity.
reducing the vulnerability of people to climate change by guaranteeing their health and well-
being.
The objectives considered to assess and improve urban resilience to face with climate change, including the
urban services and their critical infrastructures, are to achieve: city collective engagement and awareness of
citizens and communities, leadership and management, preparedness for basic conditions, climate change,
disaster response and recovery and build back, for the organisational dimension of the city; spatial risk
management and provision of protective infrastructure and ecosystems, for the spatial dimension of the city;
services planning and risk management, autonomy and preparedness for climate change, disaster response
and recovery and build back for the functional dimension of the city; and safe, autonomous and flexible as
well as prepared infrastructures for the physical dimension of the city.
The plan considers the interactions and contributions to city’s resilience of the following strategic urban
services: water supply, wastewater drainage and treatment, stormwater drainage, waste collection and
treatment, electric energy supply and mobility.
The most critical climate-related hazards for Barcelona are coastal and pluvial flooding, drought, heat waves,
storm winds and combined sewer overflows. Therefore, future climate scenarios were studied for sea level
rise, cumulative rainfall, extreme precipitation and extreme temperature, among other weather variables.
The main concerns for the incoming years are, consequently, flooding, drought, sea level rise and heat waves
due to temperature and precipitation extremes that always represented a threat to Barcelona’s resilience
and are expected to be aggravated by climate change (Pagani et al., 2018; Monjo et al., 2018). Barcelona
intends to achieve the above-mentioned resilience objectives, particularly to reduce vulnerability to these
hazards, prepare the population and the services for their occurrence and promote a better articulation
between urban services coordination and response in critical cases of extreme weather-related events.
According to Barcelona Climate Plan (Ecología Urbana, 2018), 11 planned adaptation strategies are expected
to have greater impact on the city adaptation to face with climate change. Moreover, in this plan, 4 new
adaptation strategies (and the related specific adaptation measures) are defined, proposed and analysed in
viii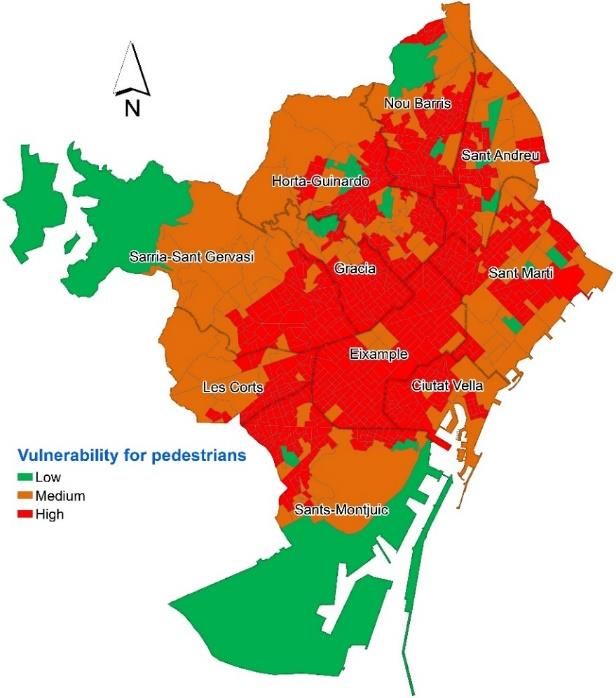
order to assess their efficiency to reduce climate-related hazards and impacts for future climate scenarios.
These new adaptation strategies, developed within the RESCCUE project are focused on the reduction of the
social, economic and environmental impacts related to flooding, Combined Sewer Overflows (CSOs), drought
and water resource availability.
With this set of strategies, Barcelona aims to achieve most of its long-term resilience objectives regarding
climate change, with focus on the urban water cycle.

                                                    ix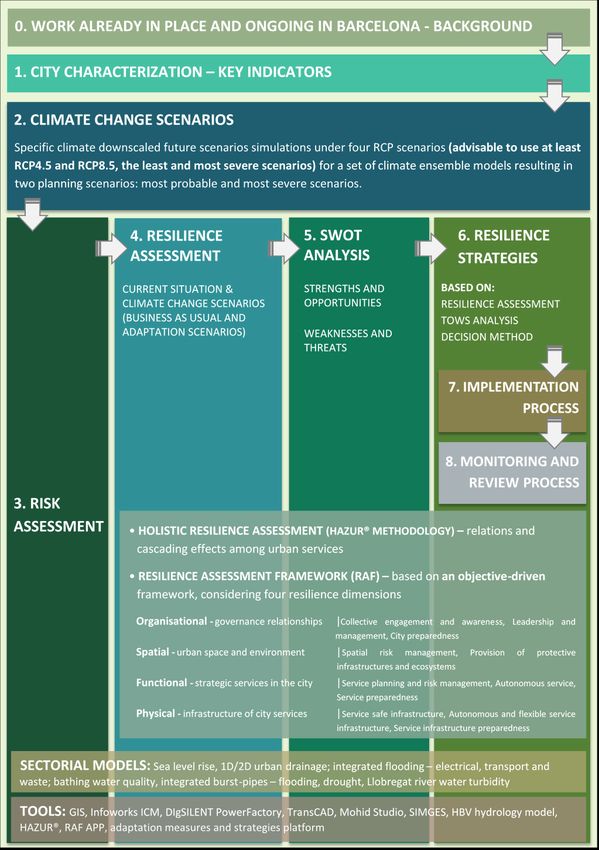
1. INTRODUCTION
BACKGROUND
Located on the northeast coast of the Iberian Peninsula facing the Mediterranean Sea, Barcelona is the
capital city of the autonomous community of Catalonia, Spain. The city is situated on a plain spanning and is
bordered by the mountain range of Collserola, the Llobregat river in the southwest and the Besòs river in the
north. Barcelona is the second most populous municipality within Spain. However, the population has
increased slowly but steadily until the 1970’s when the city reached its maximum population, thereafter it
stabilizes and even decreases at the beginning of the 21st century, reaching the average population of 1.6
million inhabitants.
Barcelona’s physical expansion has been limited by the mountains and the sea, resulting in a relatively high
population density, among the highest in Europe. Within this context, Barcelona’s major vulnerabilities are
mainly attributable to the natural and environmental threats faced by the wider Catalonia region, as well as
to a broader set of socio-economic strains brought by the 2008 financial crisis. Barcelona has a very dominant
service sector, a growing proportion of which depends on tourism (Pagani et al., 2018). The resilience of the
city to climate change can be highly related to its urban services’ resilience, their interdependencies and
cascade effects.
The Barcelona vision is to be a city responsible for its contribution to climate change and gearing itself up to
be less vulnerable to its effects by focusing on people, because it directly affects their health and quality of
life; by comprehensively transforming the city tackling the risks and turning them into opportunities; by
speeding up efficiency, renovation and the introduction of renewable energies to achieve better adaptation;
by approaching this through a process of co-production with city residents.
The Barcelona Municipality has already developed an intensive work towards resilience and it is proactively
committed to increase Barcelona’s resilience: from social exclusion to economic stresses, flooding, drought
and heat waves. Barcelona’s commitment to resilience started in 2008, proceeding with diverse initiatives,
with establishment of Urban Resilience Boards, participation with UNISDR – within the Making Cities
Resilient campaign’s framework, the agreement with UN-Habitat to develop the CRPP, with 100 Resilient
Cities, among others (Pagani et al., 2018).

                                                       1
Mayors Paris Declaration – Global Covenant of RESCCUE
Adapt cities for climate Mayors for Climate & project
Citizen Energy Develop a RAP
commitment Compact (focused on
to sustainability of Mayors climate)
Joining 100 RC
2008 2012 2013 2014 2015 2015 2017 2018 2019 2020
Making Agreement Barcelona’s Launching Climate
Cities with Commitment to the Pla Clima Emergency
Resilient UNHabitat Climate Declaration
UNISDR to develop
the CRPP
The urban water cycle is the scope for this plan, due to the importance of meteorological and hydrological
water-related risks in the functioning of the city. This resilience action plan (RAP) is a thematic plan that
contributes to the city’s climate planning and it is related with other building up resilience instruments in
Barcelona:
Climate Plan;
Drainage Master Plan (BCASA with the support of AQUATEC);
Special Drought Plan (Catalan Water Agency);
Emergency and contingency city plans;
Urban Resilience Boards;
City’s Services Operational Centre.
It is important to remark the active participation of the city in different resilience programmes and
international networks such as:
Resilient Cities Network (former 100 Resilient Cities Pioneered by the Rockefeller Foundation);
City Resilience Profiling Programme (UN-Habitat);
UNISDR Making Cities Resilient Campaign;
Networks and associations (ICLEI, C40, UCLG).
ABOUT THE PLAN
Plan scope, focus and time horizon
This resilience action plan (RAP) has been developed for the city of Barcelona within the RESCCUE project
framework, becoming a new instrument to tackle with the effects of climate change and complementing the
Climate Plan strategic measures and the climate action pathway. The present planning has a medium/long-
term horizon of 10 years, from 2020 to 2030, in articulation with the strategic planning horizons for
Barcelona. In this sense, Barcelona RAP can be considered as a “living document” with decadal periodic
updating. Notwithstanding, it refers to other information sources with a broader horizon, e.g. 2100, like the
studies carried out within RESCCUE on climate projections, impact analysis and Cost Benefit Analysis of
adaptation measures. The scope of this plan is the urban resilience to climate change (CC) with focus on the
urban water cycle.
2Geographical scope of the plan
Addressed urban services
The following urban services, their interactions and contributions to city’s resilience are considered in the
plan: water supply, water treatment, urban drainage (including wastewater and stormwater), waste
collection, electric energy supply and mobility. These services are within the scope of this plan as they relate
with the water cycle, either providing a water service, being affected by these services’ performance or
affecting their performance. Given its relevance, the effects of sea level rise in the beaches and the impacts
of CSO on urban beaches were also considered in the plan.
In the resilience assessment, the services usually consider the whole urban and peri-urban area included in
the administrative limits of the city.
3Planning process
4Document structure
This document provides a ten years’ roadmap for resilience, defining a path to enhance resilience of the city
and its services regarding climate change, with focus on the urban water cycle. It is based on the intense
work and background already existing in Barcelona, the establishment of climate change planning scenarios,
the characterisation of the city context and hazards, the risk and resilience assessment and on the
development of the strategies that need to be implemented to enhance the resilience of the city to climate
change with focus on water. It was supported on the RESCCUE's template, guidelines and results obtained
using tools and approaches developed in this project (www.resccue.eu).
The plan is structured in 7 sections. This first introductory section provides the city background, an overview
of the plan scope, focus, time horizon, planning process and structure.
In section 2, a brief characterization of the city and of the addressed urban services is provided, focusing on
the plan scope.
In section 3, the climate change scenarios considered for the city in this plan are briefly presented, as well as
the related hazards, risks and vulnerabilities.
The resilience assessment and a SWOT analysis are presented in section 4, followed by the description and
planning of the adaptation strategies selected, in section 5.
In section 6, steps for plan monitoring and review are acknowledged and scheduled.
Section 7 presents the final remarks of the plan, with a brief list of identified benefits and future challenges,
as well as any relevant acknowledgments.
Detailed or confidential information regarding the assessment or description of the strategies are included
as confidential annexes.
52. CITY CHARACTERIZATION
CITY PROFILE
Located on the Mediterranean coast, northeast coast of the Iberian Peninsula close to the French border and
south of the Pyrenees, Barcelona is on plain bordered by two rivers: the Llobregat in the south and the Besòs
in the north. Due to its close proximity to the sea, Barcelona exhibits a Mediterranean climate with mild,
relatively wet winters and hot, relatively dry summers. Barcelona is the second most populous municipality
within Spain, the 6th most populous in the European Union, continuing to expand the urban area beyond its
administrative boundaries.
Within this context, Barcelona’s major vulnerabilities are mainly attributable to the natural and
environmental threats faced by the wider Catalonia region, as well as to a broader set of socio-economic
strains brought by the 2008 financial crisis (Pagani et al., 2018). The city characterization focuses on the
scope of this plan.
BARCELONA
CLIMATE
GEOGRAPHICAL CHARACT ERISTICS
Climate type: Hot-summer Mediterranean
Country: Spain
climate (Csa - Köppen climate classification)
Average temperature:
Altitude: 45 m annual | hottest month | coldest month
16.5ᵒC | 27.1 ᵒC | 6.1 ᵒC
Average rainfall:
2
Metropolitan area: 636 km annual | wettest month | driest month
600 mm | 207.6 mm | 4.6 mm
Sea level – Max tidal amplitude: 0.30 m –
0.99 m
Urban area: 101 km2
Local mean (Barcelona port): 31/10/2013
- Coastal area
- Near to the sea One heat wave every 4 years
- Downstream a mountainous area
6POPULATION ECONOMY & GOVERNANCE
Urban population density: 16 142 GDP: 72 291 000€
inhabitants/km2
Urban permanent population: 1 619 337 GINI index: 29.1 (city), 32.5 (metropolitan
inhabitants area)
Urban population – floating: 9 065 650
Political cycle: 4 years
tourists
Population of the metropolitan area:
3 200 000 inhabitants
BUILT AND NATURAL EXISTING CLIMATE-RELATED
ENVIRONMENT & INFRAS TRUCTURE HAZARDS IN THE CITY
Services in the city: Water supply, urban Flooding – Rainfall, sea level, storm surge
drainage (including wastewater and Drought – Temperature and rainfall
stormwater), waste, energy, mobility (road, Heat wave – Temperature
train, water, air based) Combined sewer overflow (CSO) – Rainfall
Protected areas in the city: Ecological or River turbidity - Rainfall
sensitive, cultural or historical heritage
Ecosystem services: Besòs river fluvial park,
Collserola natural forest park, Montjuic
mountain, the urban parks and gardens grid,
beaches
HISTORICAL RELEVANT EVENTS AND TIME SCOPE OF ANALYSIS
Looking at historical relevant events:
Regarding drought impacts: the most severe and recent disruptive event hitting the urban area
occurred between 2004 and 2008. During that period, four years of scarce precipitation in the
Llobregat and Ter rivers’ headwaters, coupled with an increased evaporation rate due to high
temperatures, culminated in the Spring 2008 water crisis affecting over 5.5 million people in the
broader Catalonia (Pagani et al., 2018). In January 2018, the city declared the pre-alert level of the
Drought protocol after three consecutive years of low rainfall.
Regarding flooding events: the city is affected every year by an average of three intense rainfall
events and one extreme flooding event every five years, although these frequencies are increasing
in the last years. Due to the variability of rainfall it is difficult to establish a trend. As an example,
during 2018 the city suffered ten intense rainfall events and four extreme rainfall events, one of
7them categorised as a T300 (return period of 300 years) rainfall event, according to records of the
rain gauge network.
Regarding heat wave events: historically, Barcelona has to tackle with one heat wave every four
years, but this trend is increasing notably in the latest years. In 2003, a heatwave that lasted 13 days
increased in more than 40% the average mortality. Last heat wave event occurred in summer 2018
with 7 days long and causing up to 10 direct deaths.
Looking at historical data records used in the RAP analysis, they refer to the last 70 years.
EXTREMES COMPASS ROSE FOR BARCELONA
Maximum change in climate extreme
events along the century (return periods
between 2 and 100 years) have been
estimated within RESCCUE (Monjo et al.,
2018).
The edge corresponds to an increase of
100%. For heat wave days, the most
critical border of the uncertainty region
reaches an increase of 10 times the
number of heat wave days (+1000).
Median scenario
Uncertainty region (5-95%)
Note that this RAP focuses on flooding,
drought and heat waves hazards in Barcelona
and, consequently it considers only the
related weather variables affecting the city
and its services.
PLAYERS AND STAKEHOLDERS
Given this resilience plan’s thematic scope and focus (climate change and water cycle), all the players and
stakeholders involved in this resilience process are identified. Several players from very different areas - both
public and private - participate in the management of the services and infrastructures and several
stakeholders are involved in strengthening Barcelona’s resilience-building efforts (Canalias et al., 2017).
8Chief resilience officer Ares Gabàs
Actors Acronym and full name
RESCCUE partners
Barcelona City Council
AQUATEC, Proyectos para el Sector del Agua S.A. (SUEZ
Group)
CETAQUA – Water Technology Center
FIC – Fundación de Investigación del Clima
UNEXE – University of Exeter
LNEC – Laboratório Nacional de Engenharia Civil
BCASA – Barcelona cicle de l’aigua
IREC– Institut de Recerca en Energía de Catalunya
ENDESA
UN-Habitat
Other stakeholders
AB – Aigües de Barcelona (Water management, water treatment, water supply and
wastewater treatment)
ACA – Agència Catalana de l'Aigua (Regional water resource management)
AMB – Àrea Metropolitana de Barcelona (Management of main metropolitan urban services
like Urban water cycle, Waste, Mobility, Beaches)
ATM – Autoritat del Transport Metropolità (Public transport management)
TMB – Transports Metropolitans de Barcelona (Transport operator managing Bus and
Metro networks within Barcelona Metropolitan área)
SERVICE PROFILE
Urban services play a very relevant role in city’s resilience. The services considered in this plan interact and
face their specific challenges due to climate change. Their resilience contributes to Barcelona’s resilience.
9INTERDEPENDENCIES ANALYSIS FOR BARCELONA
ASSESSED SERVICES
SERVICES CONTEXT CHA RACTERIZATION
Water Urban Waste Energy Mobility Beaches
Drainage
Utilities No. 3 2 2 1 2* 3
Inhabitants About 2.8 1.6 million
covered million (collection -
people municipality) 3.5 million-
1.6 million - 1.6 million
4.8 million users
(treatment -
metropolitan area)
Area 101 (collection -
covered municipality)
101 101 - 101 4.3 km-long
(km2) 2 500 (treatment -
metropolitan area)
Relevant 162.5 l/ 1.3 kg/(inhab.day) 9.75 1 017 620 Recreational
info. (inhab.day) of (collection) MWh/(inhab. ton CO2 eq value of a
-
water year) beach day per
353 600 kgCO2/ton
consumption user: 16 €
Scope of Urban Urban Urban Urban Urban Urban
analysis area area area area area area
* Urban mobility management, traffic management, local road network, urban freight transport; metro and bus management.
10Given its relevance for Barcelona, the effects of sea level rise and CSOs in all the beaches of the cities have
been analysed through a GIS model and an integrated urban drainage – bathing water quality model
respectively.
SERVICE INFRASTRUCTURE
WATER
Total length of conduits (km) 4 107
Water abstractions (No.) 26
Pumping stations (No.) 65
Treatment plants (No.) 5
Storage tanks (No.) 72
URBAN DRAINAGE WASTE
Total length of sewers (km) 1 906 Waste containers (No.) 40 835
Pumping stations (No.) 29 Waste collection vehicles (No.) 1 350
Treatment plants (No.) 3 Recycling centres (No.) 24
Stormtanks (No.) 10 Transfer stations (No.) 4
Rainwater sewer overflows (No.) 31 Composting plants (No.) 3
Detention tanks (No.) 3 Incinerators (No.) 1
Combined sewer overflows (No.) 41 Sanitary landfills (No.) 1
ENERGY MOBILITY
Total length of aerial network Total length of road network
- 1 368
(km) (km)
Total length of subterranean Total length of cycling network
- 233
network (km) (km)
Power stations (No.) - Airports (No.) 1
Installed power (MVA) - Airport passengers (No.) 44 154 693
11ASSESSED HAZARDS IN THE SERVI CES
Urban
Water Waste Energy Mobility Beaches
Drainage
Combined sewer
Flooding - Flooding - Flooding - Flooding - Flooding -
overflows - Rainfall,
Rainfall Rainfall Rainfall Rainfall Rainfall
sea level and wind
Drought - Flooding - Sea Flooding - Sea
Rainfall level level
Combined
sewer
overflows -
Rainfall, sea
level and wind
123. CLIMATE CHANGE SCENARIOS AND RISK
ASSESSMENT
HAZARDS SOURCES AND PLANNING SCENARIOS
Several hazards may affect the city, its services and infrastructures. In Barcelona, this RAP focuses on the
flooding from intense precipitation, drought, sea level rise and heat waves from extreme temperatures for
the city. Water service considers flooding from intense precipitation and drought from the lack of
precipitation. The urban drainage sector (involving wastewater and stormwater), waste and mobility services
consider flooding from intense precipitation and from sea level rise. The energy service considers pluvial,
river and coastal flooding, although in the last two cases, hazard maps were not provided by RESCCUE project
and did not consider climate change updating. For the other hazards and related variables, climate change
scenarios for impacts assessment were agreed within RESCCUE project (Monjo et al., 2018).
A planning scenario corresponds to a hazard condition, described by the characterization of its trigger
variables by experts, for comprehensive assessment of the severity, probability of occurrence and its total
impact. As a minimum, cities would ideally define two planning scenarios. The Most Probable relates to a
hazardous event that causes disruption, assessed by experts to be the most likely to occur. The Most Severe
relates to a hazardous event that causes greater disruption, assessed by experts to be the worst case to plan
for (based on UNISDR, 2015).
CLIMATE CHANGE SCENARIOS FOR THE CITY AND SERVICES
AL L C I T Y , U R B A N D R AI NA G E , W A ST E A N D M O B I L I T Y
PLUVIAL FLOODING – MAXIMUM FLOODING – SEA LEVEL RISE
RAINFALL INTENSITY
MOST PROBABLE 1 year return period MOST PROBABLE Expected mean sea level
PLANNING Increase of 9-18% to SCENARIO rise: = +20 cm
SCENARIO account for ensemble Increase to account for
CC scenarios ensemble CC scenario
RCP4.5 and 8.5 and RCP4.5 and period
period 2071-2100 2071-2100
MOST SEVERE 500 years return period MOST SEVERE Expected mean sea level
PLANNING Increase of 7-26% to SCENARIO rise: = +30 cm
SCENARIO account for ensemble Increase to account for
CC scenarios ensemble CC scenario
RCP4.5 and 8.5 and RCP8.5 and period
period 2071-2100 2071-2100
13WATER CITY
DROUGHT – WATER RESOURCE HEAT WAVE – DAYS
AVAILABILITY
MOST PROBABLE Decrease of 0.38% to MOST PROBABLE Increase of 30 days to
PLANNING account for CC scenario PLANNING account for ensemble CC
SCENARIO RCP 4.5 and period SCENARIO scenario RCP8.5 and
2071-2100 period 2041-2070
MOST SEVERE Decrease of 11% to MOST SEVERE Increase of 42 days to
PLANNING account for CC scenario PLANNING account for ensemble CC
SCENARIO RCP 8.5 and period SCENARIO scenario RCP8.5 and
2071-2100 period 2071-2100
CITY, URBAN DRAINAGE C I T Y , W AT E R
COMBINED SEWER OVERFLOW (CSO) – TURBIDITY – AVERAGE CLOSURE EVENTS
ANNUAL NUMBER OF RAIN EVENTS AND
RAINFALL VOLUME
MOST Decrease of 2% in number MOST PROBABLE Decrease of 1% of
PROBABLE of events and decrease of PLANNING average events with
PLANNING 4% of total rainfall volume SCENARIO critical turbidity to
SCENARIO to account for ensemble account for ensemble CC
CC scenarios RCP4.5 and scenario RCP8.5 and
8.5 and period 2071-2100 period 2071-2100
MOST SEVERE Same number of events MOST SEVERE Increase of 2% of average
PLANNING and total rainfall volume PLANNING events with critical
SCENARIO Baseline Current scenario SCENARIO turbidity to account for
ensemble CC scenario
RCP4.5 and period 2071-
2100
14CITY
EXTREME TEMPERATURE
MOST PROBABLE Increase of +3.8°C to
PLANNING account for ensemble CC
SCENARIO scenario RCP8.5 and
period 2071-2100
MOST SEVERE Increase of +5.1°C to
PLANNING account for ensemble CC
SCENARIO scenario RCP8.5 and
period 2071-2100
It is important to remark that climate projections show a rise of temperature up to +5.1°C by the period
2071-2100, with uncertainty from +2.3°C to +8.9°C in the worst-case scenario. Heat wave days will suffer a
great increase of 750%, with little uncertainty below median but high above it, with the worst-case scenario
pointing to an increase of up to 1500%.
15BARCELONA CAN EXPECT CHANGES IN THE CLIMATE-RELATED
EVENTS IN THE FUTURE. IN THIS PLAN:
Flooding from intense precipitation could cause more damage to
people, building and other facilities as well as infrastructures, increase
the affectation on mobility and transport services disruption;
overwhelm stormwater drainage systems; may cause other damages
Flooding and collapses resulting in interruption of energy supply and waste
collection and affect all other services and infrastructures' components.
Flooding from sea level rise could cause loss of beaches and
flooding of some coastal infrastructures like breakwaters and
docks.
Flooding
Drought from reduced precipitation could affect surface
water levels as well as groundwater levels and affect water
volume availabilty and quality with impacts on people, services,
Drought green infrastructures, economy and health.
Heat waves from extreme temperatures could impact the
electricity generation capacity, cause heat stress on outdoor
workers and machinery, diseases on population and increase peak
Heat wave of energy consumption and water demand.
Combined Sewer Overflows (CSO) from moderate and heavy storm
events could impact on beaches, affecting people health and the
environment and on the related leisure and business activities.
CSO
Water turbidity produced by heavy rainfall and soil erosions could produce the
closure of the abstraction facility of Water Treatment Plants with decrease of the
Turbidity availability of water resources.
Drough
t
A summary of the multi-hazard assessment and comparative analysis of the Baseline vs. Business as Usual
(BAU) scenario for Barcelona research site is illustrated next.
Drought
Drough
t
Drought 16RISK ASSESSMENT
SECTORIAL MODELS IN THE CITY
Sectorial and integrated models used in Barcelona were calibrated and validated using historical data.
Simulations of current and future scenarios including projections provided a thorough characterization of
the urban services and their relations with climate variables, a detailed analysis of interdependencies and
the elaboration of multiple-hazards and risk maps.
Mathematical modelling was performed using a large set of software packages and tools (GIS, Infoworks
ICM, DIgSILENT PowerFactory, TransCAD, MOHID Studio, SIMGES, HBV hydrology model). The scope of the
modelling simulations was the whole Barcelona municipality area, including part of the surrounding
municipalities and regions. Mathematical modelling and multiple-risk assessment regards water resources,
urban drainage and the affected services of waste, electricity and mobility in case of flooding were
performed to achieve a comprehensive multiple-hazards and risk assessment (Evans et al., 2020b; Forero-
Ortiz et al., 2020; Martínez-Gomariz et al., 2020; Sánchez-Muñoz et al., 2020). An integrated urban drainage
– water quality model was also used to assess of socio-economic impacts of CSOs for current and future
scenarios. (Russo et al., 2019). Finally, a turbidity model was also developed to analyse the water quality of
Llobregat river in case of rainfall events. Interaction between heat waves and electrical systems or energy
consumptions have not been fully treated in RESCCUE.
Water resources analysis shows that future water availability scenarios for Barcelona central water sources
indicate a mean decrease close to 11% in comparison with the period 1971–2015, considering the
representative concentration pathway 8.5 (RCP8.5) climate change scenario in the year 2100.
For the period 2019–2050, the drought models average predicts 9% decrease in surface water volume
availability of the reservoir system. However, for 2019–2100, due to precipitation reduction and
temperature rise (warming‐enhanced evaporation Climate Change effects), the models average predicts an
11% decrease with a remarkably high consensus among analysed models for the RCP8.5 scenario.
The effects of floods in a potential context of climate change for the city have been assessed through a multi-
risk approach and the results of this assessment, in terms of tangible and intangible impacts, have been
presented in terms of hazard, vulnerability and qualitative and quantitative risk maps for several return
17periods and considering both current and future scenarios (including BAU and Adaptation Scenarios) (Evans
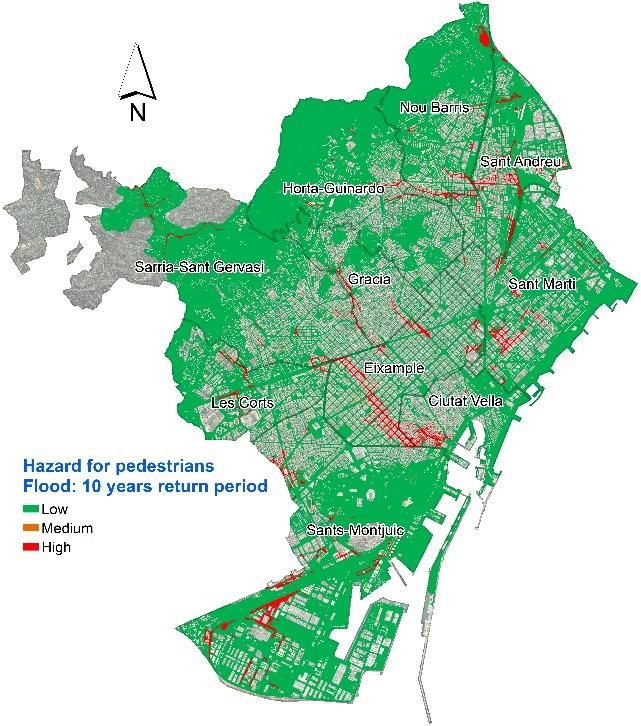
et al., 2019, Evans et al., 2020a). These maps can be visualized in https://csis.myclimateservice.eu/studies.
As a representative case of intangible impact, the flood maps for pedestrians and vehicles are presented
next.
The results of the flood simulations demonstrate that Barcelona could suffer a significant increase in these
impacts due to climate change in case of adaptation measures are not adopted. For example, it was
demonstrated that, increments of maximum rainfall intensity of 12-16%, may increment more than 25-30%
in terms of social impacts (f. e. intangible damages like the increase of areas classified with high hazard
conditions in case of pluvial flood events) and economical losses (tangible direct and indirect damages)
expressed in terms of monetary terms through the concept of EAD (Expected Annual Damage). More details
can be found in Russo et al. (2020).
Current vs future climate conditions**
Model Type of impact
Indicator Variation (%)
Pedestrians: +30 (T10), +34
EAD/2D USM Increase of high flood risk (T50), +32 (T100), +30 (T500)
Urban drainage Intangible area for pedestrian and
vehicles Vehicles: +38 (T10), +42 (T50),
model +34 (T100), +25 (T500)
Increase of EAD* (including
1D/2D USM +
Tangible properties, vehicles and 42
Damage model indirect damages)
Increase of km of closed
1D/2D USM + Tangible & +31 (T10), +60 (T50), +66
roads; EAD* due to travelling
Traffic model Intangible (T100), +116 (T500); + 0.18 M€
time rise
Increase of the number of
1D/2D USM + Tangible & +13 (T10), +12 (T50), +11
flooded electric
Electric model Intangible (T100), +10 (T500); +0.012M€
infrastructures; related EAD*
Empty: +27 (T10), +28 (T50)
1D/2D USM + Increase of the number of
Intangible 50% full: +28 (T10), +32 (T50)
Waste model unstable waste containers
100% full: +28 (T10), +36 (T50)
* EAD - Expected Annual Damage ** see scenarios and Russo et al. (2020)
Water quality in bathing and Llobregat rivers should not be exacerbated by climate change scenarios,
although their socio-economic impacts are and will be significant.
FLOOD RISK-RELATED MAPS FOR PEDESTRIANS AND VEHICLES (CURRENT AND FUTURE
SITUATIONS)
Besides the risk-related maps herein presented, additional maps may be visualised in
https://csis.myclimateservice.eu/studies.
18CURRENT CLIMATIC SITUATION
Vulnerability map for flooding – pedestrians
Hazard map for flooding (10 years return period) – pedestrians
19Risk map for flooding (10 years return period) – pedestrians
Vulnerability map for flooding – vehicles
20FUTURE CLIMATE SITUATION*
Hazard map for flooding (10 years return period) – pedestrians
Risk map for flooding (10 years return period) – pedestrians
* see scenarios and Russo et al. (2020)
214. RESILIENCE ASSESSMENT AND SWOT
ANALYSIS
RESILIENCE ASSESSMENT
Resilience assessment enables to highlight where Barcelona and the urban services stand today (reference
situation), regarding resilience to climate change, and to identify the most critical aspects to be improved,
taking into account both the reference situation and the expected impacts of climate change scenarios. The
integration of the resilience assessment results provided by all sources of analysis is presented in the SWOT
analysis. This supports the identification of resilience measures and strategies for this RAP to implement in
the city and services.
HOLISTIC APPROACH ASSESSMENT IN THE CITY
The holistic approach for resilience assessment was implemented using the HAZUR® methodology and tool.
It analyses the cascading effects that have collateral impacts on other strategic urban services and the city.
The identification of players, the description of the water related services and infrastructure, the
dependencies, the hazards and impacts on recovery time were considered (Canalias et al., 2017). This was a
result of collaborative workshops and a collection of historical data and data from the sectorial models.
BARCELONA OVERALL ASSESSMENT– RESILIENCE ASSESSMENT FRAMEWORK
An overall resilience to climate change was assessed based on an objective-driven framework, considering
four resilience dimensions for climate change, with focus on the urban water cycle: organisational, spatial,
functional and physical. The resilience assessment framework (RAF) applied to Barcelona, including the
services, was the RESCCUE RAF (Cardoso et al., 2018; Cardoso et al., 2020a) supported by RAF App tool
(Cardoso et al., 2020b). These provide the percentage of assessment metrics assigned to a resilience
development level – incipient, progressing or developed (represented respectively from a lighter to a darker
colour) – as well as those without information, that were not answered, and the ones not applicable to the
city. The following results illustrate the overall assessment for flooding. Similar results were obtained for
heatwave and drought.
In Barcelona, overall resilience development in the city is advanced in nearly half of the aspects assessed.
Organisational resilience is overall the most advanced resilience dimension, followed by the spatial
dimension. The physical dimension presents the highest percentage of metrics that were not answered,
followed by the functional dimension what, may be due to data that is not easily applicable to the metrics
provided in the RAF, in some cases, and to lack of information in other cases.
22OVERALL RESILIENCE DEVELOPMENT LEVEL IN RESILIENCE DEVELOPMENT IN EACH
THE CITY DIMENSION
RAF ASSESSMENT FOR THE ORGANISATIONAL AND SPATIAL RESILIENCE DIMENSIONS
Organisational dimension focuses on city level, analysing governance structures, the stakeholder’s
involvement and the city’s resilience engagement and preparedness for climate change.
Spatial dimension also focuses on city level, analysing herein the urban space, protective infrastructures and
ecosystems.
DETAILED DEVELOPMENT LEVEL FOR THE CITY
ORGANISATIONAL SPATIAL
In the Organisational dimension, the overall resilience development level of both the Leadership and
Management and City Preparedness objectives is significantly advanced. The Collective Engagement and
Awareness objective is the one presenting a lower advanced level, while the progressing development level
is the most expressive. Overall, this dimension still presents some opportunities for improvement.
23In the Spatial dimension, both objectives Risk Management and Protective Infrastructures and Ecosystems
are advanced in around half of the aspects assessed, while also presenting significant opportunities for
improvement, particularly the former mentioned.
RAF ASSESSMENT FOR THE FUNCTIONAL AND PHYSICAL RESILIENCE DIMENSIONS
Functional dimension emphasizes each urban service management, autonomy and preparedness for CC.
Also, for each urban service, the Physical dimension attends infrastructure resilience regarding its safety,
autonomy and preparedness for CC. These dimensions also inform about the contribution of each service to
Barcelona's resilience.
DETAILED DEVELOPMENT LEVEL FOR EACH SERVICE – Services contribution to city resilience
FUNCTIONAL
PHYSICAL
Functional resilience of all services, except wastewater and mobility, is advanced in about half of the aspects
assessed. The wastewater, stormwater and mobility services, in general, translate significant percentage of
metrics that were not answered, may be due to data that is not easily applicable to the metrics provided in
the RAF, in some cases, and to lack of information in other cases.
Physical resilience is significantly advanced for the water service, in about two thirds of the aspects assessed;
it is advanced in about half of the aspects assessed for the stormwater and waste services, while wastewater,
24energy and mobility present about one third of advanced metrics, the lowest percentage. The progressing
development level in the mobility service is evident. This is the dimension presenting higher percentage of
metrics that were not answered, namely regarding the wastewater, stormwater, energy and mobility
services, for the same reasons described above.
The main data gaps identified by the application of the RAF in the city of Barcelona are related to the
definition of the metrics to be applied and the differences in the way how these metrics are calculated. Most
of the time, the indicators did not fit the ones the city already determines and it would entail a noteworthy
effort to address the requested specifications. The limitations to answer to a given set of indicators within a
specific criteria or objective may not allow an accurate assessment of the points of view related to such
criteria or objective. Without assuming harm, this gap identification also means an opportunity to improve
a new approach to measuring the different aspects of resilience in the city.
A more detailed assessment for these two dimensions for each service is presented.
WATER
FUNCTIONAL
PHYSICAL
WASTEWATER
FUNCTIONAL
PHYSICAL
25FUNCTIONAL FUNCTIONAL FUNCTIONAL
WASTE
ENERGY
STORMWATER
26
PHYSICAL PHYSICAL PHYSICALMOBILITY
FUNCTIONAL
PHYSICAL
More complete graphical analysis for each objective, namely by assessment criteria for each urban service,
is presented in a confidential annex.
A more detailed analysis of all dimensions and also for each service is described in the SWOT analysis, linking
the most advanced objectives to the city’s main strengths, and the most incipient to the main weaknesses.
Other information was also integrated in the SWOT, coming from the different assessments carried out, as
well as from the analysis of context.
SWOT ANALYSIS
The diagnosis includes the integration of the resilience assessment results provided by all sources of analysis
(Russo et al., 2018, Russo et al., 2019, Evans et al., 2018, Evans et al., 2019, Canalias et al., 2017, Pagani et
al., 2018, Cardoso et al., 2020a,b). Aligned with objectives, a SWOT analysis (Strengths, Weakness,
Opportunities and Threats) summarizes this information by identifying the city’s and the service’s internal
strengths and weaknesses, as well as the external opportunities and main threats (McClinton, 2015),
following the planning process presented before, as proposed in Cardoso et al. (2020a). As mentioned, in
this analysis the most advanced objectives assessed in RAF are related to the city’s main strengths, and the
most incipient to the main weaknesses. From a resilience to climate change perspective, a SWOT analysis for
Barcelona is presented. This SWOT analysis, whenever referring to detailed hazards assessment, applies
overall to flooding, heatwaves and drought. Whenever any of these hazards analysis results into a different
assessment, such hazard is specifically mentioned. A more detailed SWOT analysis is presented in the
confidential annex.
SWOT ANALYSIS FOR BARCELONA FROM A RESILIENCE TO CLIMATE CHANGE PERSPECTIVE
This SWOT table identifies the aspects related to the city’s main strengths and main weaknesses, in the
respective columns. To illustrate the interpretation, existing significant background in resilience and
historical records of meteorological events constitutes main strengths in the city, related to the
organizational dimension; for the functional dimension, the main weaknesses are related to the mobility
service preparedness for climate change and with energy service autonomy in drought situation. Those that
are underlined are included in the TOWS analysis that follows.
27MAIN STRENGHTS MAIN WEAKNESSES
- Significant background in resilience and historical records
of meteorological events
- Leadership and management - Collective engagement and awareness
- City preparedness
- Spatial risk management, regarding general hazard and
exposure mapping - Spatial risk management
- Provision of protective infrastructures and ecosystems
- Mobility service preparedness for climate change
- Energy service autonomy for drought
- Water, wastewater, stormwater, waste and mobility
planning and risk management - Data gaps for RAF assessment, regarding services: water,
- Water, stormwater, waste and energy services wastewater, stormwater, energy and mobility services
preparedness planning and risk management; wastewater and stormwater
- Mobility service autonomy for drought service preparedness; wastewater and stormwater service
autonomy
- Stormwater infrastructure autonomy and flexibility
- Safe water, wastewater, stormwater and waste
infrastructures - Data gaps for RAF assessment, regarding infrastructure:
- Autonomous and flexible water infrastructure wastewater, energy and mobility infrastructures safety,
- Water, wastewater, waste, energy (for flooding) and wastewater, waste and energy infrastructures autonomy and
mobility infrastructures preparedness flexibility; stormwater and energy infrastructure preparedness
OPPORTUNITIES THREATS
- Coastal area may provide conditions for economic
development such as tourism and industry development
- Coastal area, highly exposed to sea level rise and storm surge,
(e.g. food, water, shipping and ports, recreational consequences of climate change
activities such as bathing, water sports, raw materials,
including salt and sand).
- High percentage of daily commuters provides positive - High percentage of daily commuters provides increasing of
impact in economic activities and employment (e.g. health risks related to air pollution, of resources needed to
work, food, entertainment, transport). prepare for a disruptive event and damages and losses.
- Financial opportunities given the national and
international recognition and awareness of resilience to - Socio-economics crises
CC emergency , such as the development of European
financing programmes
- National and international recognition and awareness of - Heat waves related to climate change
resilience to CC emergency
- Changes in rainfall patterns (decrease in summer
- Low range of altitude precipitations but increase in rain intensity) related to climate
change
- Sea level rise related to climate change
- Water scarcity related to climate change
- Drought related to climate change
- Temperature increase by 2050 related to climate change
285. RESILIENCE STRATEGIES
IDENTIFICATION OF STRATEGIES
The identification of the strategies that reduce Barcelona’s threats (T), overcome weaknesses (W) and exploit
strengths (S) and opportunities (O) was supported by a TOWS analysis (Weihrich, 1982), following the
planning process presented before, as proposed in Cardoso et al. (2020a). The topics addressed are
underlined in the SWOT table, previously presented, to facilitate identification. In order to address these
aspects, the city aims to exploit its strengths to both take advantage of its opportunities and face its threats,
by planning the SO and ST strategies to be implemented. It is also aiming to minimise its weaknesses in order
to avoid the impact of threats, by planning WT strategies. These strategies are targeted to the different
hazards considered in this plan (see Chapters 2 and 3).
TOWS ANALYSIS FOR THE CITY FROM A RESILIENCE TO CLIMATE CHANGE PERSPECTIVE
SO ST
STRENGHTS/OPPORTUNITIES STRENGHTS/THREATS
a) Exploit the existing significant background in c) Exploit the existing protective
resilience, the city’s preparedness for disaster infrastructures and ecosystems, the strong
response as well as the safe wastewater stormwater planning and risk management
infrastructure, to take advantage of Barcelona as well as the prepared stormwater service,
being a coastal area with significant touristic to overcome threats related to changes in
uses. rainfall patterns, water scarcity and
temperature increase.
b) Exploit the strong leadership and management,
the city’s preparedness for CC and the d) Exploit the developed water service risk
developed urban services planning, taking management and preparedness for CC as
advantage of the national and international well as the flexible and prepared water
recognition and awareness of resilience. infrastructure, to overcome threats related
to changes in rainfall patterns, water
scarcity and temperature increase, droughts
and heat waves.
WO WT
WEAKNESSES/OPPORTUNITIES WEAKNESSES/THREATHS
Not identified for this RAP e) Minimize the weaknesses regarding collective
engagement and awareness, spatial risk
management, as well as those related to the
energy service autonomy, mobility service
preparedness, and stormwater infrastructure
autonomy and flexibility, to avoid the impact of
threats related to climate change and high
percentage of daily commuters.
29You can also read