THE GREENPOINT RATED CLIMATE CALCULATOR - MARCH 2009 UPDATE
←
→
Page content transcription
If your browser does not render page correctly, please read the page content below

The GreenPoint Rated Climate Calculator

March 2009 Update
The GreenPoint Rated Climate Calculator 2

Contents

Executive Summary......................................................................................................................... 3
Introducing the GreenPoint Rated Climate Calculator................................................................... 4
Background & methodology ........................................................................................................... 5
Notable findings.............................................................................................................................. 6
What these findings mean for….................................................................................................... 11
   Policymakers & climate action planners ...........................................................................................11
   Builders, developers & building designers........................................................................................11
Next steps ..................................................................................................................................... 12
Project background....................................................................................................................... 14
Appendices.................................................................................................................................... 15
   A.      Methodology..................................................................................................................... 17
   B.      Measures Included in the Calculator ................................................................................ 20
   C.      Emissions Factors & Coefficients ...................................................................................... 25
   D.      Measures Not Yet Included in the Calculator ................................................................... 27
   E.      Measures Not Applicable to the Calculator...................................................................... 31
   F.      Other Emissions Calculators ............................................................................................. 33
The GreenPoint Rated Climate Calculator 3

Executive Summary
A number of lifestyle-based carbon calculators have been developed to estimate an individual’s or
household’s carbon footprint, but until now, no tool existed to measure the total avoided greenhouse
gas emissions from building green homes.1

The new GreenPoint Rated Climate Calculator, developed by a team led by Green Building in Alameda
County, provides this information in a way that’s systematic, credible and backed by third-party
verification.

The Climate Calculator is likely to be an influential tool for helping California’s residential building
industry reduce its carbon footprint. The Calculator is an adjunct to the GreenPoint Rated program,
which provides a consumer label for green homes.

When a house or multifamily building undergoes the GreenPoint Rating process, the Climate Calculator
will generate data on greenhouse gas (GHG) emissions avoided, measured in carbon dioxide equivalents,
or CO2e. Other savings are also calculated, including non-CO2 savings like gallons of water, tons of waste,
kilowatt-hours of electricity, and therms of natural gas.

Notable findings
 Buildings in denser, transit-oriented communities provide the greatest emissions reductions.

 In the building’s design, the most important CO2e reduction strategies are building energy
  efficiency, reduced home size, photovoltaic systems, energy-efficient appliances (including non-
  HCFC refrigerants), construction waste recycling, and water savings from efficient landscapes and
  plumbing fixtures.

 Construction and demolition waste recycling produces immediate and significant one-time CO2e
  savings for the building and community.

 Green retrofits or remodeling reduces net CO2e emissions, while constructing new housing
  (whether green or conventional) increases net CO2e emissions. Given that 70% of homes in the
  state were built before 1980,2 the opportunity for true emissions reduction is greatest in the
  existing home sector.

1
    See Appendix F for an abbreviated list of carbon calculators.
2
 California Energy Commission household forecast for California Energy Demand 2008–2018, November 2007,
report number CEC-200-2007-015-SF2.
The GreenPoint Rated Climate Calculator 4
Introducing the GreenPoint Rated Climate Calculator
Green buildings incorporate a suite of environmentally preferable practices during siting, design and
construction. Consequently, most green buildings are thought to have lower carbon footprints than
traditionally built or remodeled buildings; but how much lower? Which green building strategies are
most effective for reducing greenhouse gas (GHG) emissions? While the operational energy-related
emissions savings from the building industry are well understood, how do the indirect- and non-energy
benefits of green buildings compare? How will the growing inventory of green homes contribute to the
state’s ambitious GHG reduction goals?
The GreenPoint Rated Climate Calculator helps answer these questions. When a remodeled or newly
built residence undergoes the GreenPoint Rating process, a third-party Rater will use the Calculator to
generate data on GHG emissions avoided and other savings. 3 The Climate Calculator produces four sets
of data:
CO2e data derived from the building’s green design features, including:
o building energy efficiency,
o reduced home size,
o photovoltaic systems,
o energy-efficient appliances,
o advanced refrigerants,
o water-efficient plumbing fixtures, and
o water-efficient landscapes;
CO2e data related to the recycling of construction and demolition waste;
CO2e data related to the project’s location, which quantifies the potential reduction in miles driven
by residents who live in more compact, transit-oriented, mixed-use developments; and
Non-CO2 savings, including gallons of water, tons of waste, kilowatt-hours of electricity, and therms
of natural gas.
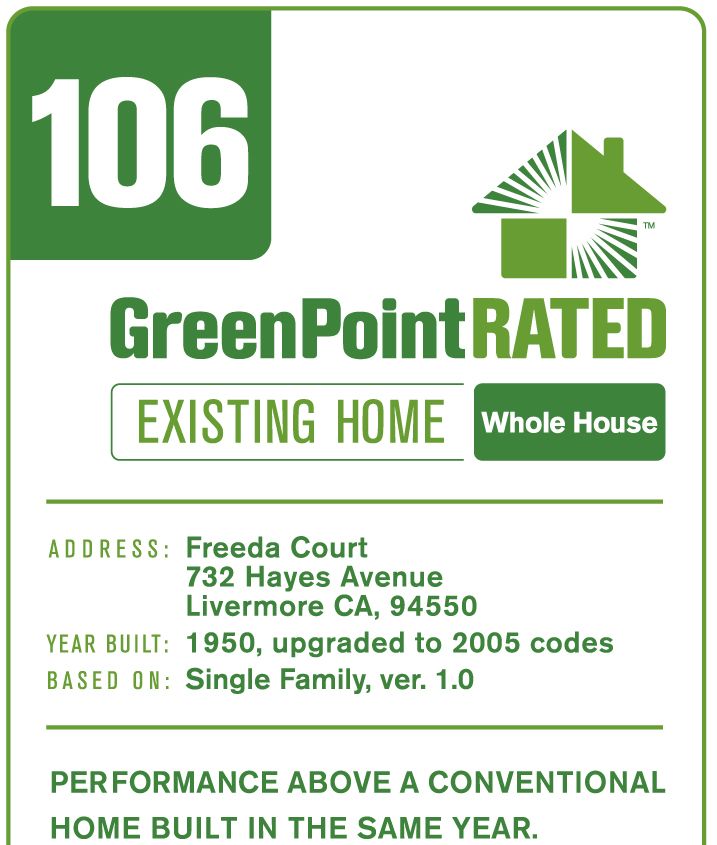
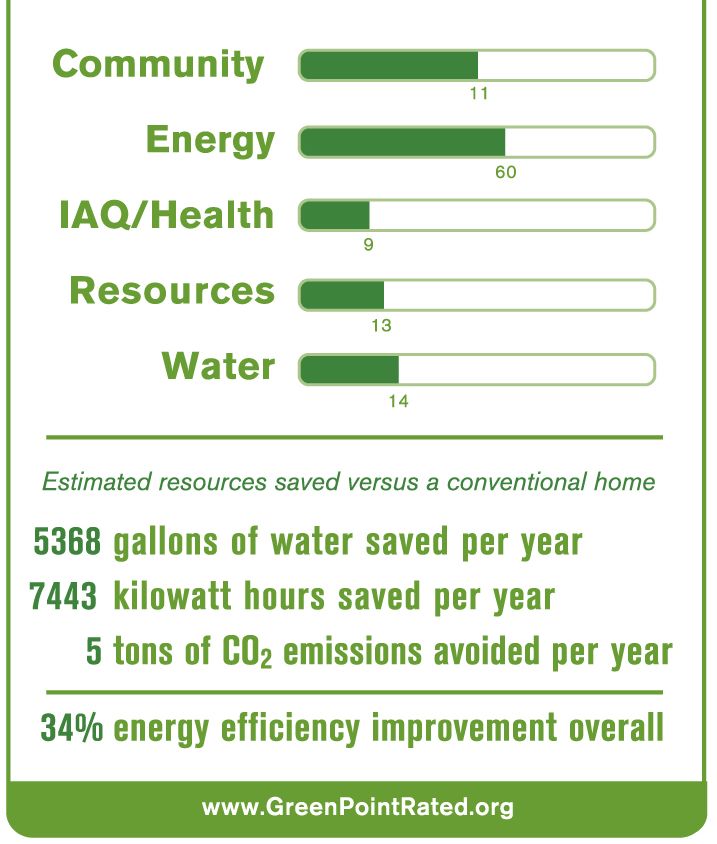
All these results are incorporated into a GreenPoint Rated consumer label for each home (see page 13
for a preview illustration).
3
See the Build It Green website at www.builditgreen.org for more information on the GreenPoint Rated program
and the Green Building Guidelines for New Homes, Multifamily buildings, and Existing Homes.
The GreenPoint Rated Climate Calculator 5

Background & Methodology
The green building measures included in the Calculator are drawn from the Green Building Guidelines
and GreenPoint Rated checklists published by Build It Green for single-family new construction,
multifamily new construction and single-family existing homes.

The underlying standards and methodologies built into the Climate Calculator were developed with help
from:
       o climate change experts,
       o State of California agency staff, and
       o energy and green building leaders.4

The project team encountered some challenges as they sought to develop a Calculator based on
accurate, verifiable data and assumptions. Foremost was the need to make the Calculator truly
representative of the numerous co-benefits that green buildings provide, some of which have impacts
on GHGs while others do not. Also, to be credible the Calculator had to reference valid standards,
research reports, and assumptions.

Lastly, and perhaps most challenging, the Calculator must work for the GreenPoint Raters in the field. A
calculator that is too onerous to fill out would drive up the cost of GreenPoint Ratings, while an overly
simplified calculator would lack credibility. The GreenPoint Rated Calculator currently meets these
objectives, and will continue to be refined as more and better data becomes available and as GreenPoint
Raters provide feedback based on their experience with using the Climate Calculator in the field.

For a more detailed discussion of the Calculator’s                Carbon Footprint and Emissions Avoided
methodology, see Appendix A. Appendix B lists all the             The Calculator is a carbon footprint analysis
measures included in the Calculator at this time. Many            tool. A footprint seeks to chronicle the total
Green Building Guidelines measures were excluded from the         emissions for a particular building (or
                                                                  household, individual or organization). The
Calculator or deferred to a future version because of the
                                                                  Climate Calculator quantifies the emissions
measure’s low correlation with climate change or resource         avoided when building a green home or using
benefits (such as light pollution reduction), insufficient data   green remodeling practices by comparing the
(for example, no third-party study on the energy savings of a     footprint of a conventional home to that of
                                                                  the GreenPoint Rated home. The difference is
gearless elevator compared to a hydraulic elevator), or
                                                                  the savings. The Calculator results
difficulty devising a way of measuring its impact (for            demonstrate that green homes built or
example, environmentally preferable materials). See               remodeled to reduce waste, energy and water
Appendix D for a list of measures not yet included in the         have lower emissions than the same home
Calculator and Appendix E for a list of measures excluded         built without green building strategies.
                                                                  For more information on footprints in the
from the Calculator.
                                                                  Calculator, see Appendix A: Methodology.

4
    The project team and stakeholders are listed on page 19.
The GreenPoint Rated Climate Calculator 6

Notable Findings
The findings described here are derived from the project team’s extensive research and analysis into the
correlations between specific green building strategies and their impacts on GHG emissions and
consumption of energy, water and other resources. Findings are based on actual projects that were run-
through the Calculator.

 Buildings in denser, transit-oriented communities provide the greatest emissions reductions. The
  research and analysis underpinning the development of the Climate Calculator confirmed what
  many land use experts have long claimed: that a project’s location and layout plays a larger role in
  its climate change impacts than does the building’s design. On average, people living in less
  sprawling, more transit-oriented communities and cities travel by car much less than people living in
  lower density communities without good access to public transit or local jobs.

    To assign GHG impacts related to a building’s location, the Climate Calculator uses average vehicle
    miles traveled (VMT) data based not just on a project’s density, but also on its proximity to public
    transit, shopping and other services, and on the neighborhood’s accessibility for pedestrians and
    bicyclists.

 In the building’s design, the most important CO2e
                                                                 Energy Efficiency Strategies for
  reduction strategies are building energy efficiency,
                                                                 Exceeding Title 24
  reduced home size, photovoltaic systems, energy-               Exceeding California’s Building Energy
  efficient appliances (including non-HCFC refrigerants),        Efficiency Standards (Title 24) results in
  construction waste recycling, and water savings from           reduced greenhouse gas emissions, lower
  efficient landscapes and plumbing fixtures.                    utility costs and increased comfort. Although
                                                                 appropriate strategies will differ depending on
  o Building energy efficiency. The GreenPoint Rated
                                                                 the local climate, in general the top strategies
       Climate Calculator’s baseline assumptions include all     include:
       the building design strategies required to meet Title     o Passive solar design with high thermal
       24 Energy Efficiency Standards. The Climate                    mass
                                                                 o Increased building insulation
       Calculator uses the project’s Title 24 energy
                                                                 o High performance windows
       modeling results to assign a CO2e reduction value         o 14+ SEER air conditioners
       based on avoided emissions from energy savings            o 92%+ AFUE furnaces
       achieved by exceeding Title 24. This means that the       o Pipe insulation on all hot water lines
       Climate Calculator provides an aggregated CO2e            o Home Energy Rating System (HERS)
                                                                      inspections on quality of insulation
       total for most of the building energy efficiency
                                                                      installation, infiltration leakage and duct
       strategies rather than presenting CO2e results for             efficiency
       individual strategies. Energy measures that are           For information on these and other energy
       required in the California Building Energy Code (Title    efficiency strategies, refer to the Green
                                                                 Building Guidelines for Multifamily, New
       24) are not included in the energy savings analysis
                                                                 Homes and Home Remodeling at
       since they do not exceed minimum code                     www.builditgreen.org.
The GreenPoint Rated Climate Calculator 7

    requirements. For those energy-related measures           Water Conservation
    above code minimums but not accounted for in Title        Water conservation directly impacts energy
    24 analysis, the Climate Calculator has separately        use at the state level, since energy is needed
                                                              to source, purify, convey and heat water in
    quantified the energy and GHG savings. GreenPoint
                                                              homes. Once used, even more energy is spent
    Rated requires time-dependent energy us to be 15%         to move and then treat wastewater.
    better than energy code, however, the Climate             Altogether, the management of water in
    Calculator bases savings on kilowatt-hour per year        California accounts for 19% of the state’s
                                                              electricity and 30% of its natural gas usage.*
    reductions and are thus independent on the time of
                                                              And water efficiency has benefits beyond just
    day energy is consumed or conserved. Analysis for         energy, including helping conserve the state’s
    existing homes was calculated based on the                diminishing supplies of potable water.
    improved performance over a typical home of the
                                                              Measures that slow the flow of stormwater
    same vintage (see Appendix B for more information
                                                              runoff, such as permeable paving, swales and
    on measures included in the calculations for existing     green roofs, aren’t included in the GreenPoint
    homes).                                                   Rated Climate Calculator because their CO2
o   Home size efficiency. The size of a house or              benefits are at present difficult to quantify for
    multifamily housing unit has a large impact on the        individual projects. However, these measures
                                                              may in fact have significant climate change
    amount of materials used to construct the home
                                                              benefits. A report by the California Energy
    and its energy use once occupied. Larger homes            Commission notes that increased runoff in the
    tend to use more heating and cooling energy and           Chino Basin results in more than 40,000 acre-
    produce more construction waste. The Climate              feet per year of stormwater going into
    Calculator factors in a home’s size to show the net       stormwater treatment facilities instead of
                                                              recharging groundwater. The lost
    energy benefits and reduced waste of building
                                                              stormwater’s energy value was 2,250 kWh per
    compact spaces.                                           acre-foot on average, according to the
o   Photovoltaic systems. If a project has a solar electric   report.**
    system, the Climate Calculator uses the system’s
                                                              *“California’s Water-Energy Relationship,”
    estimated kilowatt-hour per year output to assign a       California Energy Commission, Nov. 2005, document
    CO2e reduction benefit. The emissions resulting           #CEC-700-2005-011-SF.

    from the project’s net electricity use are calculated     **“The Role of Land Use in Meeting California’s
    using the unique power generation mix of the utility      Energy and Climate Change Goals,” California Energy
                                                              Commission, Aug. 2007, document #CEC-600-2007-
    that serves that particular location. Solar hot water     008-SF.
    systems are accounted for in Title 24, so the Climate
    Calculator uses the Title 24 outputs for calculating the benefits of solar hot water.
o   Appliances. Energy- and water-efficient appliances are not accounted for in Title 24 but can
    represent a significant portion of a project’s CO2e footprint.
o   Central laundry. For multifamily projects, the largest appliance-related savings on larger projects
    come from having central laundry facilities. When residents use common laundry facilities they
    tend to wash and dry larger loads less frequently than when laundry appliances are located
    inside each individual home.
The GreenPoint Rated Climate Calculator 8
o Advanced refrigerants. Using HCFC (R-22) and a Resource Conservation
leakage rate of 2% per year as the baseline The GreenPoint Rated Climate Calculator
condition, the Calculator estimates the avoided calculates CO2e savings from construction and
demolition (C&D) waste reduction, which can
global warming potential (GWP) of using advanced
be significant. However, green building
refrigerants, including HFC-134A and HFC-407A, in provides many other resource conservation
air conditioners. benefits that aren’t reflected in the Climate
o Water-efficient plumbing fixtures. The Calculator Calculator, such as:
includes CO2e reductions for the efficient use of o Durable products that require less
frequent maintenance and replacement
water indoors. Low-flow showerheads, faucets and
o Advanced framing techniques, engineered
toilets provide significant water savings in homes. lumber, and Forest Stewardship Council
Depending on where the project is located and (FSC)-certified framing lumber
where the water supply is coming from, the water o Recycled-content building products, such
as decking, ceramic tiles and carpets
impacts on GHGs may be quite small compared to
o Flooring made from rapidly renewable
the Calculator’s other savings areas. However, water resources such as cork, linoleum and
efficiency has other benefits, including helping bamboo
conserve the state’s diminishing supplies of potable For information on these and other green
water. building strategies, refer to the Green Building
Guidelines for Multifamily, New Homes and
o Water-efficient landscapes. The Calculator includes
Home Remodeling at www.builditgreen.org.
water savings from well designed and maintained
landscapes that utilize a range of water-efficient elements. The Calculator uses a water budget
for outdoor landscapes that is based on the California Department of Water Resource’s Model
Water Efficiency Landscape Ordinance. Additionally, principles taken from the Bay-Friendly
Landscaping Guidelines are included in GreenPoint Rated as a basis for holistic water
conservation techniques outdoors.5 Landscape water conservation starts with creating drought-
resistant soils with compost and mulch, selecting low-water using plants, planning for
hydrozoned irrigation areas, and installing high efficiency irrigation technologies. These
strategies combined together can save large amounts of water.
Construction and demolition waste recycling produces immediate and significant one-time CO2e
savings for the building and community. Construction and demolition (C&D) waste generation on
an individual project occurs only at the time of construction and is not ongoing like energy use.
However, recycling high levels of C&D waste can avoid significant CO2e emissions for the first year
on some projects as well as provide ongoing community benefits by reducing emissions from
landfills over time.
5
Information about the Bay-Friendly Landscaping program can be found at www.bayfriendly.org. For more details
on the landscaping guidelines used in the Calculator, see Appendix B.The GreenPoint Rated Climate Calculator 9
Waste diversion is a critical consideration given the state’s approaching 2020 deadline for reducing
GHG emissions.6 Compared to measures such as energy efficiency that accrue emissions reductions
over time, C&D waste recycling provides immediate savings. Further, cities and local governments
should consider waste an ongoing source of GHG reductions because construction—and the waste it
produces—is an ongoing activity. An estimated 2.6 million new homes will be added to the
California housing stock by 2020,7 and thus the impacts from avoided construction waste are
immense. At 5.6 tons of CO2e saved per home,8 recycling half the construction waste on new homes
has the potential to reduce CO2e emissions by more than 14.5 million tons by 2020!
Green retrofits or remodeling reduces net CO2e emissions, while constructing new homes
(whether green or conventional) increases net CO2e emissions. Given that 70% of homes in the
state were built before 1980, the opportunity for true emissions reduction is greatest in the
existing home sector. When comparing Climate Calculator results for various projects, it’s important
to do an apples-to-apples comparison of similar types of projects. Savings are not directly
comparable for new and existing buildings. For new homes, the Calculator is intended to show the
avoided emissions of building a green home instead of a traditional home. But building a new home
creates emissions that wouldn’t have existed otherwise. On the other hand, when an existing home
is remodeled using green building practices, the Climate Calculator can be expected to show a net
reduction in CO2e, assuming the home’s demand on energy, water and other resources wasn’t
increased from its previous footprint due to factors such as greatly expanding the home’s size.
For each project, the Climate Calculator shows emissions compared to a baseline, conventional
building. The Climate Calculator will typically show larger savings for a new home than for a
remodeled home because more green building strategies are available to the new home builder.
These strategies include orienting the building to take advantage of passive solar design, daylighting
and natural ventilation and using super-efficient building techniques such as structural insulated
panels (SIPs). But even though more savings per home are available to the new home sector, total
emissions actually increase with each new home. When a new home is built that doesn’t replace an
existing building, there is inevitably a net increase in GHG emissions because the construction has
added another building to the state’s building stock.
6
Assembly Bill 32, the California Global Warming Solutions Act of 2006, establishes regulatory and market
mechanisms for reducing greenhouse gas emissions in California to 1990 levels by 2020.
7
California Energy Commission household forecast for California Energy Demand 2008–2018.
8
StopWaste.Org study on emissions reductions from an average size new GreenPoint home.The GreenPoint Rated Climate Calculator 10
While about 200,000 new homes are built each year, the
Indoor Environmental Quality
existing housing stock makes up over 13 million homes Although the Climate Calculator doesn’t
and has the greatest potential for net emissions specifically address healthy home issues,
reductions. The GreenPoint Rated Existing Home rating better indoor environmental quality is one of
system has been designed to provide an entry point for the most important benefits of building green.
Having a healthier home is also one of the
rating small green remodels and additions, as well as
main motivations for people to buy green
tackling larger renovation projects.9 homes, green products and green remodeling
services. Best practices for better indoor
More data is needed on GHG impacts from many green environmental quality include:
o Noise and vibration control, especially in
building strategies. Many of the green building
multifamily and mixed-use buildings
measures in the Green Building Guidelines were o Kitchen and bathroom fans that exhaust
excluded from the Climate Calculator either because to the outside
they are not applicable (see Appendix E) or because o Track-off systems at entryways to keep
there is currently little or no information about their dirt and other contaminants from entering
the building
GHG reduction potential (Appendix D). A consensus-
o Low- or no-VOC paints, coatings and
based life-cycle assessment (LCA) tool, for example, is adhesives
currently not available to estimate the total carbon o Pressed-wood products with reduced
footprint and embodied energy of specific green formaldehyde and flooring with low VOC
emissions
building materials. 10 However, those impacts combined
For information on these and other green
with other excluded green building measures could be building practices, see the Green Building
significant. Climate change and building science Guidelines for Multifamily, New Homes and
researchers are encouraged to help expand knowledge Home Remodeling at www.builditgreen.org.
and data in this area.
9
More on the GreenPoint Rated Existing Home program can be found online at www.greenpointrated.org.
10
At this time, the only measures included in the Calculator that account for embodied energy are the C&D waste
recycling measures. The Climate Calculator relies on the EPA WAste Reduction Model (WARM), which includes the
upstream benefits (manufacturing, extraction, transportation) and downstream energy savings (transportation,
methane capture, cogeneration) from recycling.The GreenPoint Rated Climate Calculator 11
What these findings mean for…
Policymakers & climate action planners
Green building is a cross-cutting strategy that can augment a city’s or local government’s Climate Action
Plan by reducing emissions in all major policy areas, including transportation, energy and waste. The
Climate Calculator is intended to support public-sector policy initiatives in California, such as Assembly
Bill 32 and other state and local initiatives for reducing greenhouse gas emissions.
Policymakers have enormous influence over the GHG reduction potential of residential buildings. As
noted earlier, compact, transit-friendly communities reduce average vehicle miles traveled. The
resulting GHG savings dwarfs the savings arising from a building’s design. Planning policies that
discourage sprawl and support mixed-use neighborhoods that are walkable, bikable and transit-friendly
have the potential to play a major role in reducing a community's carbon footprint.
Policymakers and climate action planners can use results from the Climate Calculator to estimate the
GHG emissions reduction potential of homes and multifamily projects in their jurisdiction. The Calculator
is also useful for highlighting cross-cutting best practices in a Climate Action Plan or for City planning
purposes, such as in adopting green building ordinances or construction and demolition waste recycling
policies. A further benefit of the Calculator is that emissions are reported by how direct they are to the
project; i.e. “Scopes” as defined by the World Resources Institute. By including the scopes of emissions,
it is possible to analyze results from the Climate Calculator for whatever need is desired, whether that
be for Climate Action Plans, carbon trading markets, or other uses. 11
Builders, developers & building designers
The GreenPoint Rated Climate Calculator is not intended as a design tool to help architects or engineers
compare the impacts of various design options. Instead, it’s intended to allow the builder to
demonstrate to the owner or future owners the verified climate benefits of that building. In the future, a
stand alone, design version of the tool may be made available for use by project teams.
By providing data for the GreenPoint Rated consumer label, the Climate Calculator will help stimulate
market demand for green single-family and multifamily homes as well as green remodeling activities. It
also will reward green building professionals by providing them with another tool with which to
distinguish their products from competitors who build conventional homes with higher waste, utility
bills and GHG emissions.
11
See Appendix A: Methodology for more on emissions Scopes.The GreenPoint Rated Climate Calculator 12 How it works The GreenPoint Rated Climate Calculator is part of the GreenPoint Rating process for single family new homes. The inputs for the Climate Calculator are collected and verified by the GreenPoint Rater through the normal GreenPoint Rating process. The Rater then uploads their verification data and checklist to the forthcoming online Build It Green tracking system. The Build It Green tracking system includes the fully-functioning Climate Calculator along with a revised interface for managing GreenPoint Rated project documentation and verification. Currently the Calculator is housed online within the Tracking System and is not available as a stand-alone tool. Raters upload their GreenPoint Rater verification forms to the Tracking System website and Calculator results are quantified and output in reports available to the Rater and other users of the tracking system. Next steps The GreenPoint Rated Climate Calculator is now incorporated into the GreenPoint Rating process for single family new homes. Over the next few months, the Climate Calculator will be built-in to the Rating process for Existing Homes and Multifamily new homes as well. By the end of 2009 all new GreenPoint Rated projects will receive a new version of the consumer label (see preview next page) that includes both the GreenPoint Rated score and the Climate Calculator results. The Climate Calculator will continue to be refined and updated as more and better data becomes available and as GreenPoint Raters provide feedback based on their experiences with using the Climate Calculator in the field.
The GreenPoint Rated Climate Calculator 13

Sample GreenPoint Rated Consumer Label
 with Climate Calculator Savings Results
The GreenPoint Rated Climate Calculator 14

Project Background
The GreenPoint Rated Climate Calculator was developed with input from many stakeholders, including
climate change experts, State of California staff, and energy and green building leaders.

Project team
Project management and funding:        Green Building in Alameda County
GreenPoint Rated coordination:         Build It Green
Technical lead:                        KEMA Green Building Services
Technical support:                     ICLEI–Local Governments for Sustainability
Stakeholder group:                     Representatives from the following agencies: California Energy
                                       Commission, California Air Resources Board, California
                                       Integrated Waste Management Board, California Department of
                                       Public Health, California Urban Water Conservation Council,
                                       Center for Clean Products, City of Berkeley, City of Emeryville,
                                       City of Rohnert Park, City of San Jose, City of Sacramento,
                                       Collaborative for High Performance Schools, CTG Energetics,
                                       Environmental Defense, Healthy Buildings Network, Natural
                                       Resources Defense Council, San Francisco Department of the
                                       Environment, Scientific Certification Systems, SolData,
                                       Sustainable Capital, What’s Working, US EPA Region 9.

About Green Building in Alameda County
The Green Building in Alameda County program works with building professionals and local
governments in Alameda County to increase the supply and capacity for green building, and engages in
consumer outreach and policy development to increase the demand for green building. Green Building
in Alameda County is a program of StopWaste.Org, which is the Alameda County Waste Management
Authority and Source Reduction and Recycling Board operating as one public agency.
For more information:                 Green Building in Alameda County
                                      1537 Webster Street, Oakland, CA 94612
                                      510.891.6500      www.buildgreennow.org
                                      Contact: Wes Sullens, Karen Kho
About Build It Green
Build It Green is a non-profit membership organization whose mission is to promote healthy, energy-
and resource-efficient building practices in California.
For more information:                    Build It Green
                                         1434 University Avenue, Berkeley, CA 94702
                                         510.845.0472 www.builditgreen.org
                                         Contact: Tenaya Asan
The GreenPoint Rated Climate Calculator 15
Appendices
A. Methodology
B. Measures Included in the Calculator
C. Emissions Factors & Coefficients
D. Measures Not Yet Included in the Calculator
E. Measures Not Applicable to the Calculator
F. Other Emissions CalculatorsGreenPoint Rated Climate Calculator 16
Appendix A: Methodology
The Climate Calculator quantifies the climate change benefits of building a specific GreenPoint
Rated home. The data inputs for the Climate Calculator are incorporated into the Rater
verification process for GreenPoint Rated so that all participating homes will be assigned
greenhouse gas and resource reduction benefits. GreenPoint Raters have provided input on the
feasibility of obtaining various data in the field. California Climate change experts, State of
California agency staff, and energy & green building leaders also consulted on the assumptions
behind the calculator.1
The green building measures in the Climate Calculator are drawn from the GreenPoint Rated
program, which includes single-family new construction, multifamily new construction and
single-family existing homes. The measures are broadly grouped into the following seven impact
categories for the Climate Calculator with corresponding metrics and methodologies:
1) Energy efficiency and energy reduction measures included in Title 24
performance modeling
2) Energy issues not accounted for in Title 24 performance modeling (prescriptive energy
requirements, appliances, renewable energy, refrigerants etc.)
3) Outdoor water use
4) Indoor water use
5) Land use and siting effects on occupant vehicle use
6) Materials and recycling
7) Advanced refrigerants and refrigerant leakage.
The sources of greenhouse gas emissions addressed by the calculator include:
o Electricity generated by power plants: For example, 0.49 lbs of CO2e are created for
every kilowatt hour (kWh) used in PG&E service territory.2 Each investor owned utility in
California has a corresponding emissions factor of CO2e depending on their mix of
power sources.
o Electricity demand from water use: On average, the consumption of one million gallons
of water in California requires 3950 kWh of electricity for conveyance and treatment.3
Thus, water savings can be equated to GHG emissions. For the Calculator, the actual
location of the project (zip code) will be used to determine the amount of energy
embedded in water. See Appendix C: Emissions Factors for list of California utility
coefficients used in the Calculator.
o Heating with natural gas: In California, 11.6 lbs CO2e are generated per Therm of
natural gas used.4
o Transportation as a function of density: Emissions from mobile sources are calculated
using vehicle miles traveled (VMT), engine data (e.g. engine type and fuel efficiency),
1
See the project team and stakeholders on page 19
2
California Climate Action Registry, http://www.climateregistry.org/CARROT/public/reports.aspx, Clean
Air and Climate Protection (CACP), ICLEI and National Association of Clean Air Agencies (NACAA),
www.cacpsoftware.org. See Appendix C: Emissions Factors for full citation.
3
CEC Staff Report: California’s Water-Energy Balance (Report CEC-700-2005-11-SF).
4
California Climate Action Registry General Reporting Protocol, Version 2.2, March 2007.GreenPoint Rated Climate Calculator 17
and GHG emissions per mile traveled. Research has shown that the average number of
housing units per residential acre (which excludes other land uses) correlates well with
the average vehicle miles traveled (VMT); the higher the density the lower the VMT.5 As
such, it is possible to predict VMT reduction based on change in density at the project
level. But density must be done correctly; the Calculator only shows savings if
alternative transportation options and pedestrian-friendly design are included as well.
o Waste materials going to the landfill: Construction waste typically includes wood,
wallboard, corrugated (cardboard), concrete, metal, green waste and other debris. Each
has a corresponding GHG emissions factor that is a function of embodied energy in
production, transportation, and landfilling.6 Material waste streams analyzed in the
Calculator include wood, cardboard, concrete, green waste, metal, and mixed materials
sent to recycling centers (if the average facility recycling rate is known).
o Leakage of refrigerants: Gases used in refrigeration escape at a rate of 2% a year, or 1 lb
per year for a typical home application.7 Each refrigerant has an associated global
warming potential (GWP) related to this amount and interval that can be compared to
the same mass of CO2 (with a GWP of 1).
Many measures were excluded from the calculator because of either a low correlation with
climate change or resource benefits (e.g. light pollution reduction), insufficient data available
(e.g. no third party study on the energy savings of a gearless elevator over a hydraulic elevator),
or difficulty devising a solid metric by which to measure its impact (e.g. environmentally
preferable materials). See Appendix D for a list of measures not yet included in the calculator
and Appendix E for a list of measures excluded from the Calculator.
For new homes, energy measures that are required in the 2005 California Building Energy Code
(Title 24 part 6) are not included in energy savings estimates since they do not exceed minimum
code requirements. The building measures taken to achieve energy performance beyond code
are detailed as part of the whole building energy modeling, and thus are not quantified
individually. Energy savings from good design and high performance building technologies are
included as part of the modeled home’s performance.
For existing homes, there are two types of GreenPoint Rated categories: whole house and
partial house (called “Elements”).
o Whole House: The project must meet the minimum requirements of the Green Point
Rated checklist, which includes Title 24 performance modeling.
o Elements: For partial retrofits (or any other project not requiring Title 24 performance
modeling), the checklist identifies specific measures a project may claim prescriptively.
Savings for energy-related measures are calculated based on the improved performance
over a typical home of the same size and vintage. The Elements program uses four
vintage categories: a) pre-1980 (i.e. pre-Title 24); b) 1980-2001; c) 2002-2005; and d)
2006-present. The four vintages correspond with significant changes in building energy
efficiency practices coinciding with major Title 24 updates. Historic information, like
SEER of air conditioning or insulation levels in the walls, can be estimated based on
5
Holtzclaw, John, Smart Growth As Seen From the Air, Convenient Neighborhood, Skip the Car, June 2000,
www.sierraclub.org/sprawl/transportation/holtzclaw-awma.pdf
6
Waste Reduction Model (WARM) calculator, US EPA, 2008 update, www.epa.gov
7
LEED NC Reference Guide Version 2.2, US Green Building Council, October 2005GreenPoint Rated Climate Calculator 18
vintage and energy savings over the assumed basecase. These measures are listed in
Appendix B.
A note on CO2 emissions types
While the data on emissions generated by the Climate Calculator are informative, not all
emissions are equally attributable to the building’s design or construction. In particular, some of
the emissions data quantified in the Calculator are based on factors outside the control of the
building owner or contractor, such as the carbon footprint in each kilo-watt of energy delivered
to the site. Because of the different nature of emissions in terms of who owns or creates them, a
set of emissions “scopes” are used to classify each type of emission as direct or indirect. See
Table A for an overview of the World Resources Institute’s definition of emission scopes and
how they relate to measures in the GreenPoint Rated Climate Calculator. 8 Each of the measures
included in the Climate Calculator are assigned scope 1, 2, or 3.
TABLE A: Emissions Scopes Used in Footprinting
SCOPE 1 SCOPE 2 SCOPE 3
Definition of Scope Direct emissions: Indirect emissions from the All other indirect emissions:
consumption of purchased
electricity:
Emissions occur on-site and Emissions occur off-site but Emissions that occur off-site
are owned or controlled by are directly attributable to the and are a consequence of
the homeowner/builder. owner/builder. Scope 2 the activities of the
emissions physically occur at owner/builder, but occur
the facility where electricity is from sources not owned or
generated. controlled by the
homeowner/builder.
Measures in the Natural gas or propane Electric energy savings due Measures with upstream
GreenPoint Rated savings due to energy to energy efficiency and/or and downstream impacts:
Climate Calculator efficiency, solar water electricity generated on-site waste diversion, recycling,
heating, high efficiency via PVs/wind. Compared water conservation,
appliances. against the emissions factor embodied energy in
for the utility that serves the materials production,
site. lifecycle analysis.
Footprints
The Climate Calculator defines emissions and resource savings as the difference between a
basecase conventional home’s profile and the green home. To do this, the Calculator develops
two footprints: one based on a conventional home, and the second is the GreenPoint Rated
home.
8
Definitions for Scopes come from the World Resources Institute’s Greenhouse Gas Protocol: A
Corporate Accounting and Reporting Standard (rev. ed.), 2004 (www.ghgprotocol.org).GreenPoint Rated Climate Calculator 19 The basecase conventional home serves as a starting point for comparing the two footprints. The basecase is hypothetically the home that would have been built had it been designed and built to conventional code-compliant standards and practices. The conventional home is developed in the Calculator by estimating average home size, occupancy, energy use, appliance selection, refrigerant type, construction waste profile, development density, and more. Each of the conventional home assumptions have been vetted with leaders in the respective industries and are documented in Appendix B. The GreenPoint Rated home then becomes the “green” case whereby the green home’s profile is compared against the basecase, conventional home. The difference between the two footprints is the assumed savings. For existing buildings, the methodology is slightly different because the basecase home is based on the vintage of construction, instead of current standard practice, but otherwise the methodology is the same as for new homes.
GreenPoint Rated Climate Calculator 20

            Appendix B: Measures Included in the Calculator

            The information included in this table was used in the design and creation of the calculator.
            Measures are organized by categories outlined in Build It Green’s Single Family and Multifamily
            Green Building guidelines. Regional emissions factors used in calculations are summarized in
            Appendix C.

                         Description                   Data
  Measure                impact                        input       Savings            Baseline                       Calculation
Community Planning and Design
                                                                                      Typical density of single      VMT emissions data are
                                                                                      family dwellings in sprawl.    correlated with avg housing
   Conserve Resources by    Increased density is                                      Adapted from John Holtzclaw    units per residential acre and
                                                       Average     Calculator
   Increasing Density (10   shown to correlate to                                     study “Smart Growth As Seen    proximity to services/transit.
                                                       home        developed by
   Units per Acre or        higher use of transit,                                    From the Air”. This            Must include this measure
                                                       density     ICLEI
                            and less driving.                                         calculation includes EMFAC     (density) along with the next
   Greater)
                                                                                      On Road Emission Factors       3 measures in this table to
                                                                                      from ARB/BAAQMD.               take credit for VMT savings.

                            Pedestrian and bicycle-
                                                                                                                     Included in ICLEI
   Design for Walking &     friendly design            Same as
                                                                   Same as above      Same as above                  density/VMT calculation
   Bicycling                correlates with less       above
                                                                                                                     above
                            driving

                            Mixed-use
   Pedestrian Access to     developments with                                                                        Included in ICLEI
                                                       Same as
   Community Services       pedestrian access
                                                       above
                                                                   Same as above      Same as above                  density/VMT calculation
   within ½ Mile            correlate with less                                                                      above
                            driving

                            Increased public transit                                                                 Included in ICLEI
                                                       Same as
   Transit Options          options correlate with
                                                       above
                                                                   Same as above      Same as above                  density/VMT calculation
                            less driving                                                                             above

                                                                                      Assume baseline home size
                                                                                      per BIG single family Rater
                                                                                                                     Energy: Multiply kWh/sf x
                                                                                      Manual (version 3.4, January
                                                                                                                     difference in sf from basecase
   Home Size Efficiency     Smaller homes reduce                                      2008, page 65), based on
                                                                                                                     sf x adjustment factor.
                            heating and cooling                    kWh and tons of    ANSI Z765-2003.
   (for new single family   loads and result in less
                                                       house sf
                                                                   waste              Energy: kWh/sf from Title 24
                                                                                                                     Waste: multiply
   homes only)                                                                                                       lbs/generated per sf by
                            waste to construct.                                       model.
                                                                                                                     difference in sq ft from
                                                                                      Waste: from StopWaste.Org
                                                                                                                     basecase sf.
                                                                                      study on average waste
                                                                                      generation for new homes.
Site
                            Recycling construction
                            waste results in
                            upstream benefits
   Recycle Job Site                                                Crushed
                            (manufacturing,
                                                     lbs waste     concrete, mixed                                   Savings based on EPA WAste
   Construction Waste       extraction,
                                                     diverted by   metals, green    No recycling of materials.       Reduction Model (WARM)
   (Including Green         transportation) and
                                                     material      waste, cardboard                                  2008 update.
                            downstream energy
   Waste)                                                          & wood tons
                            savings (transportation,
                            methane capture,
                            cogeneration) .
GreenPoint Rated Climate Calculator 21
Description Data
Measure impact input Savings Baseline Calculation
Landscaping
Electricity used to Must include Hydrozoning,
source, convey and treat High-Efficiency Irrigation
Assume 50% of
water in the state has Reference Systems, and must use
kWh/gallon of H2O landscaping consists of
Minimize Turf Areas in associated GHG ET, square compost and mulch to get
coefficient adapted regularly watered plants
emissions. Following feet of savings. Water budget based
Landscape Installed by Bay-Friendly landscape,
from CEC study on (turf), remaining 50%
on Bay Friendly Landscaping
Builder Water-Energy consists of occasional
Landscaping techniques and GPR prerequisites and utilizing
relationship watering plants. No
can significantly reduce checklist data from Public Policy
weather-based controllers.
water demands from Institute of California, and CA
landscapes.9 WELO.
Implement
Same as
Hydrozoning: Group Same as above
above
Same as above Same as above Same as above
Plants by Water Needs
Install High-Efficiency Same as
Same as above Same as above Same as above Same as above
Irrigation Systems above
Apply 2 inches Compost
Same as
into the Top 6-12 inches Same as above above
Same as above Same as above Same as above
of Soil
Mulch All Planting Beds
Same as
to greater of 2” or Local Same as above above
Same as above Same as above Same as above
Water Ordinance
75% of Plants Are If this measure checked off on
Same as checklist, then design case is
California Natives or Same as above
above
Same as above Same as above
assumed to have no areas of
Mediterranean Species high water use.
A/C electricity use estimated
based on climate zone using
A 25 foot tree
RASS study. A/C savings
Trees sequester carbon reduces annual
Shade trees estimates (8-12%) come from
when growing and also cooling costs of a
or not? Energy-Efficient Landscapes
cool surrounding air, typical residence
Plant Shade trees resulting in reduced air
Include
by about 8-12
No 25’ shade trees. McPherson, Rowntree and
climate Wagar (1995) page 150, and,
conditioner use in hot percent. Assumed
zone Urban Forest Landscapes,
climates. 8% cooling savings
Integrating Multidisciplinary
per home.
Perspectives (Edited by
Gordon A. Bradley)
Meets California- Water
Reduced water use in kWh/gallon of H2O
Friendly Landscape landscapes.
budget
conserved
Conventional landscaping kWh/gallon of H2O conserved
requirements calculation
Plumbing
Install Only High gallons per fixture CA Building Standards
Water is saved by
over baseline; Assume average flush rate Commission Green Building
Efficiency Toilets (Dual- installing toilets that use # fixtures apply kWh/gallon of 1.6 gpf, Code modified with input from
Flush or ≤1.3 gpf) less water per flush.
of water savings CUWCC
Rain water collection Amount of water collected
Rain Water Collection gallons kWh/gallon of H2O
reduces the need for No rain water collection annually = gallons of water
System collected conserved
utility water saved
9
Prerequisite requirements for the Bay-Friendly Landscaping principles are included in the GreenPoint
Rated Guidelines. See www.bayfriendly.org for more information on the program.GreenPoint Rated Climate Calculator 22
Description Data
Measure impact input Savings Baseline Calculation
CA Building Standards
Composting or Waterless toilets reduce kWh/gallon of H2O conventional toilet of 1.6 Commission Green Building
# fixtures
waterless toilet the need for water. conserved gpf Code modified with input from
CUWCC
Greywater system Use of greywater
reduces the need for
operational (includes gallons kWh/gallon of H2O Quantity of greywater =
utility water supply and No greywater system
washing machine at collected conserved gallons of water saved
for wastewater
minimum) treatment
Plumbing fixtures with Conventional plumbing CA Building Standards
Reduces water use,
fixtures based on Federal Commission Green Building
below standard flow which saves electricity savings (gal) per
# fixtures maximum flow rates Code modified with input from
rates (faucetsGreenPoint Rated Climate Calculator 23
Description Data
Measure impact input Savings Baseline Calculation
Heating, Ventilation, and Air Condition (HVAC)
Calculation based on study
Don't Install Fireplaces Efficient gas fireplaces from the Natural Resources
consume less gas and 9 therms/yr per Canada Office of Energy
or Install Sealed Gas reduce winter heating
# fixtures
fixture
Assume no fireplace
Efficiency
Fireplaces costs. www.oee.nrcan.gc.ca/equipm
ent
Building Performance
% above code
Design and Build High Title 24 (Minimum Title 24 performance model
High performance report requirement: 15% Baseline house that is Title output. Non- TDV kWh and
Performance Homes - homes use less energy kWh & above code TDV 24 compliant therm usage below baseline
15% above Title 24 - therms energy budget on code.
CF-1R)
2-20% savings Assume no commissioning
Commissioning ensures Are
typical. Assume 3% done - current average 3% energy savings relative to
Building Diagnostics that the building diagnostics
conservative energy consumption, or performance model for Title
(Multifamily only) operates according to included or
estimate (LBNL T24 performance model 24 home (design case).
design intent. not?
study) results
Renewable Energy
PV installations displace Estimated (Annual kWh solar output x
Install Photovoltaic
the need for fossil-fuel annual kWh offset Assume no PV panels. tons CO2/utility kWh) = tons
(PV) Panels based grid electricity output of CO2 displaced
Estimated
Energy Upgrades for kWh
Retrofitting existing No actions – modeled
savings of % above code or Calculate using performance
Existing Homes (whole homes increases energy
whole basecase
average current energy
software.
house) perfomance consumption
houseGreenPoint Rated Climate Calculator 24
Description Data
Measure impact input Savings Baseline Calculation
Existing Home GPR prescriptive energy measures (Elements - when no T24 modeling required) 10
Energy Upgrades, Tier 1
Climate
Attic, crawl space, and A well insulated zone, Better than Based on typical house within Annual kWh and Btu savings
building has better
wall insulation insulation basecase vintage category over baseline
energy performance.
thickness
Climate
Higher efficiency
High Efficiency zone, equip Better than Based on typical house within
furnaces consume less Rater verification of AFUE
Furnace (+90% AFUE) energy specificatio basecase vintage category
ns
Minimal Duct Leakage Less leakage = higher From test Better than Based on typical house within Annual kWh and Btu savings
< 15% lost efficiency protocol basecase vintage category over baseline
High Efficiency Air Climate
Higher efficiency AC
zone, equip Better than Based on typical house within Annual kWh and Btu savings
Conditioning Unit units use less energy to
specificatio basecase vintage category over baseline
(zones 2,4,8-16) cool the home
ns
Blower Door Test sealing air leaks can
From test Better than Based on typical house within Rater verification in the field
0.5 ACH or 50% reduce heating and
protocol basecase vintage category (Based on KEMA study)
improvement cooling loads
Energy Upgrades, Tier 2
Climate
High Efficiency Water Higher efficiency water zone, equip Better than Based on typical house within Annual kWh and Btu savings
heaters consume less
Heater specifica- basecase vintage category over baseline
energy
tions
Reduces penetration of Installed or Better than Based on typical house within Rater verification in the field
Radiant Barrier roof heat into attic not basecase vintage category (Based on KEMA study)
Climate
Improves the loss/gain
zone, equip Better than Based on typical house within Annual kWh savings over
Window Upgrades of heat through
specifica- basecase vintage category baseline
windows
tions
Climate
zone, Better than Based on typical house within Annual kWh savings over
Duct Insulation Minimize losses in ducts
insulation basecase vintage category baseline
R-value
Allows for more control
Programmable Climate Better than Based on typical house within Rater verification in the field
of HVAC use, helpful in
Thermostat zone basecase vintage category (Based on KEMA study)
reducing energy
High Efficiency Air Climate
Higher efficiency AC
zone, equip Better than Based on typical house within Annual kWh and Btu savings
Conditioning Unit units use less energy to
specificat- basecase vintage category over baseline
(zones 1,3,5,6,7) cool the home
ions
# machines
Water and Energy Water-efficient and Use ENERGY
Based on typical house within Project use = Gallons/cycle x
Efficient Dishwasher dishwashers reduce ENERGY STAR calculator
vintage category 0.1 cycles/day x 365 days
Installed water and energy use STAR for kWh savings.
ratings
# machines
ENERGY STAR kWh savings
ENERGY STAR & ENERGY Based on typical house within Based on ENERGY STAR
refrigerators can reduce from ENERGY
Refrigerator Installed STAR vintage category calculator
electricity bills. STAR calculator
ratings
Energy Efficient
Energy efficient lighting Lighting Better than code Based on typical house within
Lighting (at least 10% saves energy survey basecase vintage category
kWh savings
of total)
10
Savings are based on the CEC Database for Energy Efficiency Resources (DEER) study,
www.energy.ca.gov/deer except where noted as savings estimates from the KEMA Measure
Quantification Study of Savings for NCPA/SCPPA, 2006 (referenced herein as “KEMA Study”).GreenPoint Rated Climate Calculator 25
Appendix C: Emissions Factors & Coefficients
DATA
EMISSIONS SOURCE EMISSIONS FACTOR YEAR SOURCES
Electricity
California grid-wide average 878.7 lbs CO2/MWh 2005 [1]
Austin Energy 1078.0 lbs CO2/MWh 2005 [2]
City of Anaheim Public Utilities 1416.7 lbs CO2/MWh 2005 [2]
City of Palo Alto Public Utilities 39.0 lbs CO2/MWh 2005 [2]
Los Angeles Department of Water
and Power 1238.5 lbs CO2/MWh 2005 [2]
PacificCorp 1747.3 lbs CO2/MWh 2005 [2]
PG&E 455.8 lbs CO2/MWh 2005 [2]
Platte River Power Authority 1955.7 lbs CO2/MWh 2005 [2]
Riverside Public Utilities 1346.2 lbs CO2/MWh 2005 [2]
Roseville Electric 565.5 lbs CO2/MWh 2005 [2]
Southern California Edison 641.3 lbs CO2/MWh 2005 [2]
San Diego Gas & Electric 780.8 lbs CO2/MWh 2005 [2]
Sacramento Municipal Utility
District 555.3 lbs CO2/MWh 2005 [2]
Turlock Irrigation District 628.5 lbs CO2/MWh 2005 [2]
Natural Gas
Natural Gas 11.616 lbs CO2e/therm 2007 [2]
Propane 0.00567 MTCO2/gallon propane
Water
Northern California:
Indoor water 3,950
Outdoor water 1,450
Rainwater system - used indoors 1,450
Rainwater system - used outdoors 1,450
Greywater system - used indoors 3,950
Greywater system - used outdoors 3,950 kWh/million gal. 2005 [3]
Southern California
Indoor water 12,700
Outdoor water 10,200
Rainwater system - used indoors 10,200
Rainwater system - used outdoors 10,200
Greywater system - used indoors 12,700
Greywater system - used outdoors 12,700 kWh/million gal. 205 [3]
Waste
Concrete -0.01 MTCO2E per ton recycled 2008 [4]
MTCO2E per ton
Wood -0.79 combusted 2008 [4]
Cardboard -3.11 MTCO2E per ton recycled 2008 [4]
Mixed metals -5.26 MTCO2E per ton recycled 2008 [4]
MTCO2E per ton
Green waste -0.20 composted 2008 [4]GreenPoint Rated Climate Calculator 26
DATA
EMISSIONS SOURCE EMISSIONS FACTOR YEAR SOURCES
Refrigerants
Baseline: R-22 refrigerant 1780 lbs CO2/lb of refrigerant 2005 [5]
Ammonia 0 lbs CO2/lb of refrigerant 2007 [6]
HFC-134A refrigerant 1320 lbs CO2/lb of refrigerant 2005 [5]
HFC-407C refrigerant 1700 lbs CO2/lb of refrigerant 2005 [5]
HFC-410A refrigerant 1780 lbs CO2/lb of refrigerant 2005 [5]
Vehicle Miles Traveled
VMT reduction based on density Varies VMTs reduced 2005 [7]
[1] California grid-wide average is from EPA e-RID2006V2_1_year04_aggregation file (Sheet
"EGRDSRL04")
[2] Certified CO2 emission factor for delivered electricity:
www.climateregistry.org/tools/members-only/reporting-tips.html
[3] CEC Staff report: California's Water-Energy Balance (Report CEC-700-2005-11-SF)
[4] Savings factors based on EPA WAste Reduction Model (WARM) calculator, www.epa.gov,
2008 update with modifications on assumptions for sequestration by StopWaste.Org and ICLEI.
[5] Based on LEED-NC Reference Guide Version 2.2 (October 2005)
[6] EPA listed refrigerant. http://www.sznorinco.com/chemicals/dy/proe23.html.
[7] EMFAC 2007 data in conjunction with formulas and assumptions for this calculation is
adapted from John Holtzclaw's work: “Smart Growth As Seen From the Air, Convenient
Neighborhood, Skip the Car.” http://www.sierraclub.org/sprawl/transportation/holtzclaw-
awma.pdfYou can also read