NATIONAL RENEWABLE ENERGY SOURCE INDUSTRY ROADMAP BELGIUM
←
→
Page content transcription
If your browser does not render page correctly, please read the page content below
NATIONAL RENEWABLE ENERGY SOURCE INDUSTRY ROADMAP
                     BELGIUM

       WITH THE COLLABORATION OF ODE‐VLAANDEREN

                    AND THE SUPPORT FROM

                    Disclaimer: The sole responsibility for the content of this publication lies
                    with the authors. It does not necessarily reflect the opinion of the European
                    Communities. The European Commission is not responsible for any use that
                    may be made of the information contained therein

                                                                                               1
CONTENT

1.     INTRODUCTION ............................................................................................................................... 3

     1.1.     Objectives of the “RES industry roadmap” ........................................................................ 3

     1.2.     Being part of the Repap2020 European project ................................................................ 3

2.     TARGETS AND TRAJECTORY............................................................................................................ 5

     2.1.     Methodology........................................................................................................................... 5

     2.2.     Overall renewable energy targets and trajectories ............................................................... 6

     2.3.     Sectoral targets and trajectories ............................................................................................ 7

3.     MEASURES FOR ACHIEVING THE TARGETS .................................................................................. 12

     3.1.     Measures on administrative procedures, regulations and codes ....................................... 12

     3.2.     Measures on Information ..................................................................................................... 15

     3.3.     Measures on certification of installers ................................................................................ 16

     3.4.     Measures on electricity infrastructure development.......................................................... 16

     3.5.     Priority/Guaranteed Access to the grid ............................................................................... 18

     3.6.     Biogas integration into the natural gas network ................................................................. 19

     3.7.     District heating and cooling infrastructure development ................................................... 19

     3.8.     Compliance of biofuels and other bioliquids with sustainability criteria ........................... 20

     3.9.     Support schemes for renewable electricity ......................................................................... 20

     3.10.       Support schemes for renewable heating and cooling ..................................................... 21

     3.11.       Support schemes for renewable resources in transport ................................................. 22

     3.12.       Biomass availability .......................................................................................................... 23

4.     FLEXIBILITY / JOINT PROJECTS / EUROPEAN PERSPECTIVES ....................................................... 26

5.     ESTIMATED COSTS AND BENEFITS OF RES POLICY SUPPORT MEASURES .................................. 26

ANNEX I           2020 targets calculated by the Green‐X and Primes models ........................................... 28

ANNEX II        Method of approach / key assumptions ............................................................................ 40

Annex III          Short characterization of the Green‐X model .................................................................. 47

 EDORA – National Renewable Source Industry Roadmap – Rev. : February 2010                                                                        2
1. INTRODUCTION

            1.1.        Objectives of the “RES industry roadmap”
The current document aims to show the vision of the renewable sector on the renewable energy
share that could be consumed in Belgium by the year 2020. Trajectories and realizable targets for the
main sectors (electricity, heating and cooling and transport) and renewable energy sources are also
provided. In addition, this so‐called “RES industry roadmap“ gives key measures that should be
implemented in order to reach the proposed targets, according to the renewable energy sector. The
“RES industry roadmap” is mostly based on the template for National Renewable Energy Action
Plans provided by a Commission Decision on the 30th of June 2009 [C(2009) 5174‐1] and should
therefore facilitate the elaboration of the Belgian action plan on renewable energy required for the
30th of June 2010 under the Directive 2009/28/EC. The current document has been presented for
final validation to the overall Belgian renewable sector on the 25th of January. From now on, the
sector will present the proposed targets and measures to the decision makers and will provide them
support to further develop the proposed measures. The sector would like to be instrumental in the
development of an ambitious Belgian renewable action plan. After the official publication of the
Belgian action plan planned at the end of June 2010, the sector will closely follow the Belgian
decision makers in order to make sure that they efficiently implement the required measures.

Further advanced versions of this “RES industry roadmap” could be published in the future in order
to adapt the proposed 2020 targets (taking new elements, data, decisions or publications into
account) and to add, develop or adapt some necessary measures.

            1.2.        Being part of the Repap2020 European project
The current document is part of a broader European project, namely Repap2020 (see here under for
a brief description of the project). EDORA (“Fédération de l’Energie D’Origine Renouvelable et
Alternative) is in charge of the Belgian coordination of the Repap2020 project. EDORA has been
working in close cooperation with ODE‐Vlaanderen in order to facilitate the collection of inputs from
a wide number of actors of the Belgian renewable sector. The targets for 2020 proposed are based
on a calculation performed by the Fraunhofer Institute Systems and Innovation Research and by
Energy Economics Group (Wien University) realized according to PRIMES and GreenX models. The
results of these calculations have been reviewed by the sector in order to present the feasible targets
exposed in this document together with the necessary measures to reach these targets. Therefore
specific working groups have been organized by sector leading to the consultation of more than 50
actors from industries, federation or independent institutes. The current document has been
validated by the overall Belgian renewable sector on the 25th of January 2010.

 EDORA – National Renewable Source Industry Roadmap – Rev. : February 2010                          3
Brief description of the Repap2020 project

Repap2020 is a European project coordinated by the European Renewable Energy Council (EREC) and
gathering 13 European participants. The specific objective of REPAP2020 is to facilitate the process of
implementation of the RES Directive on a national level. The main target groups of REPAP2020 are
Parliamentarians and Civil Servants in national administrations as well as national industry
associations. REPAP2020 aims to support their political work in the field of Renewable Energy –
mainly related to the Renewable Energy National Action Plans.

REPAP2020 will – in a first phase before the notification of the renewable action plans (NREAPs) to
the European Commission – accompany the development of the NREAPs by offering good advice to
the relevant authorities on the design of the NREAPs. Furthermore, REPAP2020 will empower national
industry associations to come up with their individual national RES roadmaps which will serve as
important tool to influence the drafting phase of the NREAPs.

In a second phase, the project will evaluate the NREAPs in order to facilitate a constant feedback and
learning process. REPAP2020 will show good policy practice and highlight missing pieces in the
individual NREAPs.

REPAP2020 also aims at creating a network of key players in the field and at offering a platform for
the RES industry as well as for Parliamentarians (both EU and national Parliaments) and National
Administrations in charge of energy issues. These key actors will be involved both as input providers
and disseminating partners. REPAP2020 shall enable them to express their views on the political
process and help to improve the upcoming political decisions on RES within Europe and especially on
the Member States’ level.

 EDORA – National Renewable Source Industry Roadmap – Rev. : February 2010                          4
2. TARGETS AND TRAJECTORY

              2.1.     Methodology
The proposed targets were provided by calculations performed for the EU27 by EEG (Energy
Economics Group) based on the PRIMES and GreenX models1. The Green‐X model provides a detailed
quantitative assessment of the future deployment of renewable energies on country‐, sectoral‐ as
well as technology level. The core strength of this tool lies on the detailed RES resource and
technology representation accompanied by a thorough energy policy description, which allows
assessing various policy options with respect to resulting costs and benefits. The Green‐X database
on RES potential and cost was used.
The Green‐X database and the corresponding model use a quite detailed level of specifying costs and
potentials. The analysis is not based on average costs per technology. For each technology a detailed
cost‐curve is specified for each year, based on so‐called cost‐bands. These cost‐bands summarize a
range of production sites, which can be described by similar cost factors. For each technology a
minimum of 6 to 10 cost bands is specified by country. For biomass at least 50 cost bands are
specified for each year in each country.
The PRIMES model has been used for sectoral energy demand scenarios, primary energy prices,
conventional supply portfolio by energy sector by country and corresponding conversion efficiencies
and CO2 intensities. More information on models, the database and the scenario parameters is given
in Annexes II and III.
Once the calculations performed, the results were reviewed by the renewable industry sector in the
different member states. In Belgium, EDORA based its feedback on a broad sectoral consultation
during several working groups (about 50 different actors from different Belgian regions) and on
existing independent studies2. As the model allows assessing various policy options, new calculations
were performed based on the renewable sector’s comments from the different EU countries in order
to define realizable targets in line with the updated sector trends. The targets, trajectories and cost
& benefit analysis as calculated by the model are presented in Annex I. As the final calculations from
the models didn’t completely fit to the sector expectations and vision, some last changes have been
performed in the proposed targets (tables 1‐5). A special mention (footnote) indicates where the
targets and trajectories proposed in tables 3‐5 differ from those calculated with the models.

1
  The model Green‐X has been initially developed by the Energy Economics Group (EEG) at Vienna University of Technology
in the research project “Green‐X – Deriving optimal promotion strategies for increasing the share of RES‐E in a dynamic
European electricity market”, a joint European research project funded within the 5th framework program of the European
Commission, DG Research Contract No. ENG2‐CT‐2002‐00607. For details on model, see Annexes II and III or www.green‐
x.at.
2
   A.O.: “Impact of the EU Energy and Climate Package on the Belgian energy system and economy”, November 2008,
Federal Planning Bureau; “Projet d’actualisation du Plan pour la Maîtrise Durable de l’Energie (PMDE) en Wallonie à
l’horizon 2020”, March 2009, ICEDD, Econotec, Ibam; “Prognoses voor hernieuwbare energie en warmtekrachtkoppeling tot
2020”, October 2009, VITO.

    EDORA – National Renewable Source Industry Roadmap – Rev. : February 2010                                      5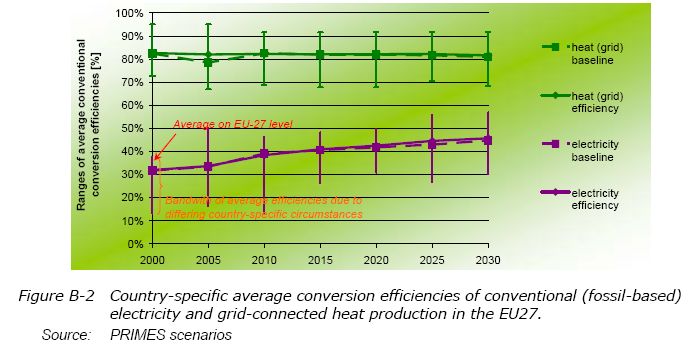
2.2.     Overall renewable energy targets and trajectories

  Overall share of renewable energy in final energy consumption in 2005, indicative trajectory &
  binding 2020 target (in % of final energy consumption)

  Table 1:

Overall      Renewable             2005     Average        Average         Average        Average      2020 Targets
Energy Targets and                         2011‐2012      2013 ‐2014      2015‐2016      2017‐2018
Trajectories
ktoe                             887,69        2230,9         3041,08         3866,87        4803,25       5984,66
Expected Gross Final              39150         38333           38097           37913         37807
energy consumption
moderate scenario
(ktoe)4                                                                                                       37695
Expected Gross Final              39150         38098           36692           35517         34683
energy consumption low
demand scenario (ktoe)                                                                                        33700
% of the gross final
energy consumption
(moderate energy                  2,27%         5,82%           7,98%          10,20%        12,70%         15,88%
demand scenario)
% of the gross final
energy consumption
(low energy demand                2,27%         5,86%           8,29%          10,89%        13,85%         17,76%
scenario)

  4
      The moderate and low energy demand scenarios have been developed according to Primes

      EDORA – National Renewable Source Industry Roadmap – Rev. : February 2010                               6
2.3.      Sectoral targets and trajectories
        Targets for 2020 and indicative trajectory for the share of energy from renewable sources in the
        electricity, heating and cooling and transport sectors
        A special mention (footnote) indicates where the targets and trajectories proposed hereafter differ
        than those calculated with the models.

        Table 2:

           Ktoe/%               energy   2005       Average    Average Average    Average            2020
                                demand               2011‐      2013 ‐ 2015‐2016 2017‐2018          Targets
                                scenario             2012        2014
Expected gross final            moderate 7.912       8.327      8.501    8.693     8.927             9.230
 electricity consumption
(ktoe)                          low        7.912     8.686      8.682       8.713        8.855       9.036
Gross final consumption of                  199       855       1196        1520         1900        2539
electricity from RES (ktoe)
                                           2,52%     10,27%     14,07%       17,49%       21,28%      27,51%

Share of RES electricity in     moderate
                                           2,52%      9,85%     13,78%       17,45%       21,45%      28,10%
 gross final electricity
consumption (%)                 low
Expected gross final            moderate 21.312       19.666     19.243      18.863       18.534      18.135
consumption in heating and
cooling (ktoe)                  low        21.312     19.039     17.793      16.805       16.236      15.558
Gross final energy
consumption from RES in                     688,6     1207,0     1592,0      1967,4       2356,0      2602,7
heating and cooling (ktoe)
Share of RES heating and        moderate      3%      6,14%      8,27%       10,43%      12,71%      14,35%
 cooling in final heating and
cooling consumption (%)         low        3,23%       6,34%      8,95%      11,71%      14,51%      16,73%
Expected gross final            moderate   9.926      10.341     10.352      10.358      10.346      10.331
consumption in transport
(ktoe)                          low         9.926     10.372     10.217        9.998       9.592       9.107
Gross final energy
consumption from RES in                         0        169        253          379         548         843
transport (ktoe)
Share of RES in transport       moderate 0,00%        1,63%      2,44%        3,66%        5,29%       8,16%
                                                      1,63%      2,47%        3,79%        5,71%       9,25%
(%)                             low        0,00%

         EDORA – National Renewable Source Industry Roadmap – Rev. : February 2010                        7

Table 3 : CONTRIBUTION OF RENEWABLES TO ELECTRICITY CONSUMPTION
  Type of energy          2005                  Average 2011‐2012            Average     2013‐2014         Average 2015‐2016             Average 2017 ‐2018               2020
                          MW        GWh          MW            GWh            MW             GWh            MW            GWh             MW              GWh           MW          GWh
                          56,0       304,0        142,9          803,8         215,0          1.214,5        295,7         1.686,3         405,3           2.295,3       590,1      3.189,5
                Biogas
                          293,0      960,0        670,0         3.198,5         774,8         3.770,9        837,1          4.088,0        866,3           4.229,9       999,7      4.906,7
       Solid biomass
                           52,8      326,0         84,4              592,2       90,3              630,6       96,5              670,8     103,5               716,2     112,8        776,6
         Biowaste
     5
Hydro 10MW                55,0      163,8         55,0              163,8       55,0              163,8       55,0              163,8       55,0              163,8       55,0       163,8

Geothermal6                  0,0          0,0         3,5             29,1       10,5               87,2       24,5              203,4       38,5              319,6       59,5       493,9

Photovoltaic7              2,0       1,7        632,0         537,2          1.060,0        901,0          1.631,0       1.386,4         2.352,0       1.999,2         3.439,9     2.923,9

Tide & Wave8                0         0           0              0              0              0              0              0              0              0             0,1         0,4

Wind onshore9             167,0      367,4      1.895,3         4.169,7       2.819,6         6.203,1      3.335,2          7.337,4      3.464,1           7.621,0     3.500,0      7.700,0

Wind offshore                0,0          0,0      72,8              236,3      216,7              700,1     579,9           1877,6       1380,8           4455,2       2824,6       9060,6

           Gross final             2.315,6                      9.947,8                      13.913,0                      17.680,5                       22.091,5                29.531,6
     consumption of
 electricity from RES

  5
    The Hydro potential has been adapted from the model calculation as the sector plans 480GWh hydro production by 2020
  6
    The geothermal potential has been adapted from the model calculation, considering the projections from AGEOP (Association pour la géothermie profonde). These projections are based on
  potential geological zones and production sites together with a realizable growth rate.
  7
    The load factor has been adapted from the model calculation: 850 full load hours per year have been taken into account. In addition the trajectory has been adapted from the model
  calculation. Yearly growth factors of 20%, 15% and 10% have been considered for the periods 2011‐2013, 2014‐2016 and 2017‐2019, respectively.
  8
    The tide & wave potential has been adapted from the calculation, taking into account a first demonstration plant before full development between 2020 and 2030.
  9
    The onshore wind potential has been adapted from the model calculation as the sector plans an installed capacity of 3500MW in 2020. Full Load hours / year: 2200.
                                    EDORA – National Renewable Source Industry Roadmap – Rev. : February 2010                                         9
Table 4 : CONTRIBUTION OF RENEWABLES TO HEATING &COOLING
Type of Energy 2005 Average 2011‐ Average 2013‐ Average 2015‐ Average 2017‐ 2020 Targets
2012 2014 2016 2018
MWth Ktoe MWth Ktoe MWth Ktoe MWth Ktoe MWth Ktoe MWth Ktoe
110,9 25,0 206,6 35,5 286,6 40,9 332,9 43,5 337,2 43,8 369,0 45,5
Biogas (grid)
Solid biomass 118,7 34,0 316,6 87,8 484,2 133,0 591,8 166,3 651,6 186,5 866,3 247,6
(grid)
0,0 0,0 357,1 65,5 381,8 70,6 407,5 75,9 436,1 81,8 471,4 90,2
Biowaste (grid)
Solid biomass 4975,1 616,0 7528,1 932,1 9578,7 1186,0 11528,1 1427,4 13405,1 1659,8 12960,4 1604,7
(non‐grid)
Geothermal 4,7 2,6 19,8 7,2 37,1 10,7 68,0 15,6 100,1 21,9 147,2 31,7
Solar Thermal 79,5 3,0 812,0 30,6 1810,0 68,3 2833,9 107,0 4138,9 156,2 6383,7 241,0
64,5 8,0 389,1 48,2 665,5 82,4 1063,3 131,7 1662,4 205,8 2763,2 342,1
Heat pumps
Gross final energy
consumption from
RES in heating and 688,6 1207,0 1592,0 1967,4 2356,0 2602,7
cooling
EDORA – National Renewable Source Industry Roadmap – Rev. : February 2010 10Table 5 : CONTRIBUTION OF RENEWABLES TO TRANSPORT FUEL CONSUMPTION
Consumption in 2005 Average Average Average Average 2020 Targets
Ktoe10 2011 2013 2015 2017
2012 2014 2016 2018
Bioethanol 28,8 43,2 64,8 93,7 144,1
Of which imported11 0 4,8 7,3 10,9 15,7 24,2
Biodiesel 0 122,9 184,3 276,4 399,3 614,3
Of which imported 0 20,6 31,0 46,4 67,1 103,2
Biofuels from wastes, 0 16,9 25,3 37,9 54,8 84,3
residues, non‐food cellulosic
material, and ligno‐cellulosic
material
Of which imported n.a. 8,5 12,7 19,0 27,4 42,2
Final energy from renewable 0
sources consumed in 168,6 252,8 379,1 547,8 842,7
transport 12
10
While the 2020 overall target remains the same than the one calculated by the models, the contribution of the different technologies have been adapted. As the mandatory share of
bioethanol and biodiesel is on volume basis, the 2020 bioethanol and biodiesel targets are planned to follow the 2008 picture of fossile mix (19% gasoline and 81% gazole). A linear projection
has been followed. Moreover, the following hypothesis has been followed: by 2020, 10% of all biofuels will come from second generation ones.
11
Imported fuel
12
As defined in Article 5(1)c
EDORA – National Renewable Source Industry Roadmap – Rev. : February 2010 113. MEASURES FOR ACHIEVING THE TARGETS
Preliminary remark: the list of measures proposed hereafter are presented as answers to questions
mentioned in the template for National Renewable Energy Action Plans provided by a Commission
Decision on the 30th of June 2009 [C(2009) 5174‐1]. This presentation should facilitate the work of
the decision makers during their redaction of the Belgian action plan for renewable energy that must
be sent to the European Commission by the 30th of June 2010. The presented measures are
sometimes general and sometimes specific to a region or a technology.
As this list of measures is non exhaustive, further versions of this “RES‐industry roadmap” will very
likely be published in order to integrate new measures or to further develop the measures presented
hereafter. In any case, the measures presented in such an action plan further need specific
development for their implementation. The renewable sector will provide support to the decision
makers before and after the publication of the Belgian action plan in order to bring its technical
feedback on the political decisions needed to reach the Belgian targets.
POLICY MEASURES
3.1. Measures on administrative procedures, regulations and
codes13
• Who are the administrative bodies responsible for authorization, certification and licensing
procedures on national/or regional and local level? How should the competences be best
defined and coordinated?
Most of authorizations for renewable energy plants are given at the regional level, except for
offshore which directly depends on the federal authority. However, part of the authorizations
is of local authorities competence (e.g. public roads). This can lead to a project blockade.
Some biomass projects could also suffer of delay due to shared competences as waste
legislation directly depends on the federal authority. On biofuels, excise duties also depend on
federal authority.
In order to support an ambitious renewable development policy, it is of crucial importance to
improve and better coordinate the authorization and licensing procedures, together with the
policy frameworks in the different decision making levels, in order to avoid bottlenecks.
• Are there unnecessary obstacles or non‐proportionate requirements detected related to
authorization, certification and licensing procedures applied to plants and associated
transmission and distribution network infrastructure for the production of electricity, heating
or cooling from renewable sources, and to the process of transformation of biomass into
biofuels or other energy products? If so, what are they?
‐ In order to develop the renewable sector as prescribed in the respective targets exposed in
this document, numerous obstacles urgently need to be removed.
‐ Initially planned to be a distribution grid, the current electricity grid must progressively be
seen as decentralized production grid. Therefore grid reinforcement in some specific regions is
needed to allow the necessary deployment of renewable productions plants without delaying
their installation. Current long lasting authorization procedures for electricity grid
development, limited financial means and lack of renewable deployment strategy in terms of
spatial planning could lead to several bottlenecks within the electricity grid in the near future.
13
The below listed questions are taken from the template of the European Commission which Member States will have to
answer in their NREAP. They are listed here to give an exemplary indication which points you should touch upon in this
section. This applies to all points mentioned under this point.
EDORA – National Renewable Source Industry Roadmap – Rev. : February 2010 12‐ Lack of current clarity on strong granted priority access to the grid and dispatching for
renewable energy could lead to project delays and renewable energy curtailments in the
future when the renewable sector will reach a critical share compared to the traditional
energy sources one. Current legislations and technical regulations are not sufficient to
guarantee the dispatching of renewable electricity whatever the production and demand
profiles are at any time (current legislation could always argue grid security reason to de‐
prioritize renewable production).
‐ Recently a tariff on the injection of electricity in the grid is applied on all decentralized
installations. It is a new obstacle which increases the cost of renewable energy compared to
the cost of centralized installations (mostly non‐renewable). This tariff must be repealed.
‐ Being obliged to finance themselves the access to the grid, the renewable energy producers
are de facto discriminated compared to non‐delocalized electricity producers. These costs
must be paid by the TSOs and directly socialized.
‐ The renewable project authorization procedures are still too long. A global framework is
needed in order to consider the overall advice on the project in the likely cases where
opposite advices arise from different consulted bodies or authorities (especially the case in
Flanders). In most of the cases, a single negative advice among numerous other positive ones
for a wind project currently leads to either project refusal or nearly automatic appeal
procedures, further delaying the realization of the project.
‐ Numerous aeronautic constraints still affect renewable development as wind turbines
installations. Considerable share of the Belgian territory (onshore and offshore) is still under
military control zones (exclusion, high risk or training zones). In addition civilian aeronautic
constraints (airport, radar…) further impact the wind energy development. Solutions could
however be found to reduce and/or reshape these zones and radar locations (or to put more
radars), to water down some constraints in order to take into account the windfarm
development as prominent criteria.
‐ In addition a clear, scientific and integrated framework on the nature protection criteria is
sometimes lacking leading to consulted bodies imposing their own unilateral criteria. This is
particularly the case for the advisory bodies consulted during the wind turbine authorization
procedure.
‐ The increasing presence of lobby groups that disseminates erroneous rumors on renewable
energies (e.g. impacts of wind turbines) negatively impacts social acceptance and local
decisions during the authorization process. In other cases, public information on renewable
energy sources (e.g. on pellets) and their advantages are scarce. In both cases, public
information campaigns are necessary.
‐ There isn’t any infrastructure allowing district heating
‐ There is a lack of legal framework for the exploration and exploitation of energy from the
underground (deep geothermy).
‐ The current of biofuels policy (too low quotas) doesn’t allow further ambitious development.
The current gap between production costs of biofuels compared to fossil fuels would need
higher mandatory level.
• Is comprehensive information on the processing of authorization, certification and licensing
applications for RES installations available?
Not a major problem for most technologies. However, for hydro, the administrative procedures
remain particularly intricate and seem to be specific to each sites and the « historical » character of
some legislations or private agreements. No comprehensive information currently exists to complete
such a procedure.
Further development of heat production technologies including district heating will need clarification
of existing authorization procedures or even elaboration of new ones.
New procedures or legislative modifications for the biogas sector (e.g. on injection possibilities on the
grid or transport use) must be implemented.
EDORA – National Renewable Source Industry Roadmap – Rev. : February 2010 13• Should authorization procedure take into account the specificities of different renewable
energy technologies? If yes, how?
Yes, it is already the case.
• Should the renewable energy potential be taken into account in spatial planning?
Yes. A top‐down approach with clear objectives per technology is firstly needed. Then, regional
spatial planning with identification of possible favorable zones for renewable development must be
anticipated in order to ensure, in early stage, the necessary grid re‐enforcements. The government
must give clear guidelines to the TSOs in order to ensure this grid re‐enforcement, on schedule. The
government also closely follows it up. The publication of these zones must be closely evaluated for
each technology by the governments in order to avoid investment speculations and wrong or
confusing messages among the population and local authorities. This renewable spatial planning
must be linked to a careful analysis of current constraints and decisions on their review (and removal)
in order to be able to comply with the identified renewable targets. These decisions must be taken by
ministers in charge of the energy, the environment and spatial planning and the Defense, acting in
close cooperation.
Aeronautic constraints must then be watered down by restricting military exclusion zones for wind
development. For radar constraints, mitigation measures, operational modification and surveillance
engineering modifications shall be put in priority, whereas wind project redesign shall be the last
option.
Spatial wind farm planning related to nature protection criteria should be based to the last scientific
evidence and should be balanced with the positive externatilities generated by wind energy
production compared to traditional power plants (in terms of CO2 emission, toxic waste…). In any
case, a clear, scientific and integrated framework on the nature protection criteria should be
developed.
For offshore wind development, the spatial planning must lead to enlarging the existing devoted
zone and designate a new zone for offshore energies in order to reach the 2020 target and strive to
3800MW installed in 2030. In addition, specific areas must be devoted to other renewable offshore
technologies (tide and wave) for both demonstration and development sites. The development of
these technologies requires increased R&D funding, a specific financial support system and
consequent grid (onshore and offshore) reinforcements.
Spatial planning must be adapted for district heating development and development of heat plants
in zones with high density in energy demand. These developments must allow an optimal mix of
renewable energy technologies and sources, and maximize heat recovery. Some flexibility must also
be foreseen for biomethenisation plants, in order to allow its development in agriculture zones.
A special emphasis must be set on designing specific zones for ‘Ecozoning’ development, with the
adequate infrastructure to allow the development of economic activities in an energetically optimized
concept (synergies to be found between energy and raw material supply and demand and
optimization of heat recovery).
Obligation to connect to conventional gas systems should be abolished.
• Should timetables for processing applications be communicated in advance?
Yes, with mandatory deadlines.
EDORA – National Renewable Source Industry Roadmap – Rev. : February 2010 14• How many steps should be needed to obtain the final authorization? Should there be a one‐
stop shop for coordinating all the steps? Should a timetable for processing applications be
communicated in advance?
A one‐stop shop procedure is already in place for the wind energy authorization process in Wallonia
(so‐called “permit unique” delivering environment and planning permits). This could also be
envisaged for other technologies and in Flanders. The connection permit should however not be part
of this “permit unique” as in this case the grid connection studies would have to be financed by the
developers even without the authorization to build.
For offshore wind process, a one‐stop shop is not desirable. Distinct processes between concession
and authorization procedures prevent the wind energy developers to finance expensive studies
without any guarantee to even have a concession.
• For which small scale projects, should there be simplified and less burdensome authorization
procedures?
Simplified procedures should be considered together with the compensation mechanism for small
scale installations depending on concerned technology and area of application. For instance,
underground heat pumps or small scale installations in agricultural sector could benefit from
simplified procedures for installed capacities higher than 10kW.
3.2. Measures on Information
• How should specific information be targeted at different groups, as end consumers, builders,
property managers, property agents, installers, architects, farmers, suppliers of equipment
using renewable energy sources, public administration?
Positive communication campaigns based on real time renewable production and shares must be
performed by the governments on regional and federal levels. Therefore, an observatory of
renewable energy must be put in place in order to have up to date indicators on renewable energy
production.
Public authorities have a major role to play in raising awareness of the population (exemplary
buildings).
The current “resistance to Wind” mainly based on rumors and disinformation constitutes a major
constraint to wind energy projects development. The regions must finance information campaigns in
order to counter the dissemination of erroneous rumor on the impact of wind energy. These
campaigns should be based on in situ enquiries amongst the population. Municipalities must actively
participate in these campaigns. Education programs should also be supported by the Regions which
could take advantage of events such as Wind days. The region must ensure that updated information
on the status of the wind energy projects is forwarded to the consulted bodies in order for them to
have the most accurate view of the impact of the new wind farm project they have to comment.
Recent and reliable information about job creation and economic added value on a local scale
should be disseminated amongst the population, with a special focus on youth, in order to attract
new vocations in the technical field.
Offshore wind farms can have a role as touristic attraction. On cruises correct information on wind
energy is important. The public must have access to information that shows clearly the importance of
offshore wind and the contribution of offshore wind to a more sustainable energy supply. A lot of
educated professionals will be needed in future offshore activities. A special training program can
lead to sustainable jobs in the next years.
Public information campaigns are also necessary to show the advantages of specific renewable
energy sources (e.g. pellets, biofuels, solar thermal, heat pumps).
EDORA – National Renewable Source Industry Roadmap – Rev. : February 2010 15• How will you ensure that certification schemes or equivalent qualification schemes
become or are available by 2012 for installers of small‐scale biomass boilers
and stoves, solar photovoltaic and solar thermal systems, shallow geothermal systems and
heat pumps ?
Quality certification initiatives do exist but on a voluntary basis, and with different frameworks
between regions. Certification schemes for installers should be harmonized between regions in order
to insure high homogenous quality of installations and equipment throughout the country and avoid
concurrency distortion between regions.
• How should guidance for planners and architects be provided to help them consider the
optimal combination of renewable energy sources, high efficiency technologies and district
heating and cooling when planning, designing, building and renovating industrial or
residential areas?
These topics should be a part of the compulsory formation of new planners and architects.
Already graduated planners and architects should go through compulsory in service training on these
topics.
• What should be the role of regional and local actors in the design and management of
programs for information, awareness raising and training programs for citizens on the
benefits and practicalities of renewable energy sources?
Each local community should have an energy counselor at its disposal for continuous information of
inhabitants and public building administrator.
3.3. Measures on certification of installers
Qualification requirements for installers should be established and harmonized through a broad
consultation of the existing organizations comprising industry, government and stakeholders.
Quality labeling for industries must be ambitious but progressive at affordable costs for SMEs and
micro‐enterprises. An audit system with on site verification must be put in place, at term.
3.4. Measures on electricity infrastructure development
• How should transmission and distribution grids be developed to integrate renewable
electricity while maintaining the secure operation of the electricity system? How is this
requirement included in the transmission and distribution operators’periodical network
planning?
In order to integrate a higher share of renewable electricity with a granted priority access to the grid
and dispatching, significant changes in the grid structure and management are necessary. Several
grid reinforcements in some specific regions are needed to allow the necessary deployment of
renewable productions plants without delay.
EDORA – National Renewable Source Industry Roadmap – Rev. : February 2010 16Based on clear and ambitious regional targets, TSOs must analyze the possibilities of reaching these
targets with the current grid. The TSO must then identify the needed reinforcements in order to reach
or even overshoot the targets. It is essential to switch to a grid management strategy based on an
increased share of decentralized production units. Experience in other countries could help. These
reinforcement and management strategy must be developed together with the regional and federal
authorities, which must identify the possible locations where the renewable deployment would take
place.
This planning must be linked to decisions on the removal of some current constraints to renewable
development (onshore and offshore) and reinforcements of the interconnection capacities with
neighboring countries. The authorities should closely follow up the TSOs grid adaption in order to
assess the fulfillment of their adopted targets.
In order to allow the full development of renewable offshore production sites, clear middle‐term and
long term targets should be adopted as soon as possible in order to anticipate both offshore and
onshore grid reinforcements. In this view, the 2030 targets for offshore wind energy together with
other renewable offshore energy sources (tide and wave) must be considered.
New financing means are needed in order to accelerate the modernization of the grid.
• How will the development of intelligent networks and storage facilities be ensured?
Decisions on the share of variable renewable energy production should be taken together with
decisions on the share of controllable renewable energy capacities, on storage capacities,
interconnection reinforcements and smart grid developments. This is essential to guarantee a
systematic and secure priority in the dispatching of renewable electricity.
• How should the interconnection capacity with neighboring countries be reinforced?
Increased interconnection capacities must be part of a national energy strategy (related to the
increased shared of variable renewable energy production) and international strategy. An increased
interconnection should be decided among the pentalateral forum and should also be part of a
broader EU strategy (e.g. among the North Sea countries linked to the TEN‐E initiatives). An
increased onshore interconnection with neighboring countries must be closely analyzed. In addition, a
Blueprint on an offshore interconnection should be developed on international level, together with
increased cooperation between TSOs and regulators.
In this context, Belgian authorities must further lead the EU negotiations with other North Sea
countries to speed up the development of a European offshore supergrid allowing the integration of
an increased and controllable renewable electricity share on the Belgian grid (based on guaranteed
electricity production from wind, ocean, hydro and other dispatchable renewable sources).
Concretely, a hub (substation) must be implanted in the Belgian North Sea (or onshore) with offshore
interconnections to UK, France and Dutch grids. Consequent Belgian onshore grid reinforcements
must be anticipated (even further than the current STEVIN project) to take full advantage of these
interconnections.
• How should the grid infrastructure authorization procedures be accelerated?
The TSO currently assesses the authorization procedures for grid reinforcement as long‐lasting and
complex. The procedure should urgently be simplified and strictly time‐limited (1‐3 years depending
on the scale of the project).
• Should there be priority connection rights or reserved connection capacities provided for
new installations producing electricity from renewable energy sources?
EDORA – National Renewable Source Industry Roadmap – Rev. : February 2010 17Any authorized renewable project should be guaranteed to have access to the grid when the power
plant is ready to produce. This requires accelerated and financially guaranteed grid connection
process (no more financed by the developer or the producer).
• How should the costs of connection and technical adaptation be shared between producers
and transmission and distribution system operators? How should it be ensured that
transmission and distribution system operators are able to recover these investment costs?
Should any modification of these cost bearing rules be planned in the future?
The connection costs of renewable energy production (onshore and offshore) should be adapted, as
the RES producer must not be proportionally penalized. The needed offshore substation together with
its connection to the onshore grid and the consequent onshore grid reinforcements must be financed
by the TSO. Revenues from a possible windfall profits or stranded benefits recuperation of
depreciated power plants could be used to finance these grid reinforcements.
3.5. Priority/Guaranteed Access to the grid
• Should priority or guaranteed access be ensured? Explain.
Priority access to the grid for renewable installation required by the directive 2009/28/EC is currently
inscribed in federal and regional legislations and technical regulations. However, this priority is
associated to several conditions (“as far as it is possible”, “taking into account the security of supply”,
depending of the grid security…). Amending these federal and regional legislations and technical
regulations is now necessary to guarantee unconditional priority access to any renewable production
installation without causing any delay to the injection.
The current reservation system for the grid connection should be abandoned and the grid connection
and reinforcement procedures must be fully in charge of and coordinated by the TSO and dramatically
speed up. Any authorized renewable project must have automatic granted connection to the grid.
• How should it be ensured that transmission system operators, when dispatching electricity
generating installations give priority to those using renewable energy sources?
Priority dispatch to renewable electricity is envisaged under conditions by the current federal
technical regulations but apparently not guaranteed at the regional level legislations. Problems linked
to the lack of guaranteed dispatching for renewable power have not been experienced yet due to the
current renewable share. However, with increasing renewable production share, lack of clear priority
dispatch for renewable energy could lead to renewable power plants being forced to sometimes
switch off in the future.
It is therefore important to adapt the current legislation and technical regulations in order to
guarantee unconditional priority dispatching for electricity from renewable energy sources. The grid
security should intrinsically be based on a systematic priority dispatching for renewable electricity,
consequent interconnections and storage capacities must be activated to implement this rule. In the
very unlikely cases where renewable productions must be shortly switched off (e.g. higher renewable
production than the overall demand associated to congestions in the interconnections), consequent
financial compensations should be given to these renewable energy producers.
• What grid and market related operational measures should be taken to minimize curtailment
of electricity from renewable energy sources?
EDORA – National Renewable Source Industry Roadmap – Rev. : February 2010 18Curtailment could be reduced with a strong unconditional priority dispatch for renewable electricity in
the legislation. Curtailment could further be prevented by the development of a strategy in order to
balance an increased share of variable renewable energy production by increased interconnection
and backup power plants. Any curtailment of renewable energy must lead to financial compensations
to the related producers.
3.6. Biogas integration into the natural gas network
• How should one ensure that charging of transmission and distribution tariffs is not
discriminating against gas from renewable energy sources?
‐ A support mechanism should be developed for biogas production and coupled with an
obligation for gas distribution companies to support the injection of biomethane.
‐ A compulsory share of renewable gas injection should be considered.
‐ Socialization of biogas enrichment and compression costs should be considered.
• Should any assessment be carried out at national or regional level on the need to extend gas
network infrastructure to facilitate the integration of gas from renewable sources?
‐ A master plan bringing heat supply and demand together should lead to heat load maps on a
regional level.
‐ Policies must be developed to allow power developers to connect to existing or planned
network.
‐ Clarity must be set on ownership and investment needs of gas network in order to allow
funding of potential needed reinforcements.
3.7. District heating and cooling infrastructure development
• What are the needs for new district heating and cooling infrastructure using renewable
energy sources and contributing to the 2020 target? How should these plans be promoted?
Regional and local authorities’ awareness must be raised on the potentials and advantages of
district heating and cooling development and the opportunities of public – private
partnerships.
Feasibility evaluation of district heating infrastructure development should be compulsory for
any new construction of housing estates and communities of sufficient densities and
collective habitat.
District heating infrastructure should be developed in priority in zones with high energetic
density and a potential of combination of different ER technologies and energy recuperation.
Clear political will must be showed to favor the use of public money for the development of
district heating instead of traditional gas network. Existing gas distribution managing utilities
must be progressively transformed into heat distribution utilities.
EDORA – National Renewable Source Industry Roadmap – Rev. : February 2010 193.8. Compliance of biofuels and other bioliquids with
sustainability criteria
The Belgian law of 22nd of July 2009 contains an obligation of 4% volume biofuels incorporation for
biodiesel and bioethanol. Under the Art2‐8°, the notion of “sustainable fuels” is defined, which
already includes sustainability criteria.
The future Fuel Quality Directive, once transposed in the Belgian law, will implement the
sustainability criteria for biofuels.
FINANCIAL SUPPORT
3.9. Support schemes for renewable electricity
What further improvements could be implemented to ensure reaching the target in the electricity
sector?
Investment aid:
What investment aid should be granted by the scheme? (subsidies, capital grants, low interest loan,
tax exemption or reduction, tax refund). Who could benefit from this scheme?
Investment support schemes should be widened to allow the broad participation of historically
excluded sectors and the emergence of new partnerships like the public private partnerships or co‐
investment of medium/large companies from the energy sector.
Low rate loans must also be considered as well as tax reduction mechanisms or public financial
warranty system. These mechanisms should take into account the possibility of flexible pay back
levels taking into account the periodical variability of the RE production.
A specific public warranty mechanism should be put in place to cover geological exploration risks for
geothermal exploitation (EGS, but also geothermal heat).
Tax reduction mechanisms for individuals should not be limited to a few technologies (like PV, Solar
thermal and geothermal) but also allow small scale wind technologies, hydroelectricity, aero‐ and
hydrothermal heat pumps and bio‐CHP.
Should applications be continuously received and granted or are there periodical calls? If it is
periodical, what should be the frequency, conditions?
Continuous.
Operational aid:
If your country has a tradable certificates system:
Should there be an obliged share of total supply?
Who would have the obligation?
Should there be technology specific bands?
Which technologies should be covered by the scheme?
Should an international trade of certificates be allowed? What would be the conditions?
Should there be a floor / bottom price?
Should there be a penalty for non‐fulfilment?
How long should a plant be able to participate in the scheme?
What start and end dates (duration) are foreseen for the whole scheme?
Should the scheme be periodically revised?
EDORA – National Renewable Source Industry Roadmap – Rev. : February 2010 20Who should be managing the scheme?
Green certificate system could be optimized by reviewing the support level in relation to the real
additional cost of each technology. This will allow to take into account the learning curves of each
technology and the evolution of raw material costs.
Increased support to emerging or small scale technologies must be considered in addition to the PV
increased support. However, existing mechanism (GC) must be maintained but finely optimized. The
support level could be periodically reviewed at the only condition that the system remains predictable
on the long term in order to create a favorable climate for investors (e.g. 15 years).
Equilibrium of the system must be closely monitored in order to avoid unexpected GC market crash if
stocks become excessive.
Market player participation to the green certificate exchange market should be encouraged in order
to increase liquidity of the system.
Congruency in support mechanism schemes must be improved between regions in order to favor
exchangeability of GC (penalty and minimum price levels). Clear and fair rules must be found to allow
injection of offshore GC on the regional markets without market distortion due to higher offshore
support.
Support should be adapted to allow the development of large scale photovoltaic installations in
Wallonia.
The 20MW installed power limit for biomass needed to benefit from production support in Wallonia
could be re‐considered taking into account logistics (CO2) and emission reduction optimization in
large scale installations. Reduced support could be an option to counter market distortion.
The support mechanism for biomethanisation should take into account the avoided CO2 emission of
the whole process (e.g pellets drying, concentration of digestat…)
3.10. Support schemes for renewable heating and cooling
What measures could be best to ensure development of heating and cooling renewable energy
sources?
An obligatory share of renewable heat should be laid for all new constructions (private and public
buildings) for 2012.
Financial support for investing in individual heating systems should be added up in case of installation
of collective heating system.
Production support mechanism for heat could be similar to that of electricity support but with
adapted levels (based on CO2 avoided emissions and not on MWh production in order to avoid over‐
subsidization of heat technologies compared to electricity).
Small scale renewable heating systems must be supported in remote areas where the development of
collective plants is not possible in the short term.
Heat pumps support mechanism must take into account the advantages of cooling.
These support mechanisms will need the implementation of simple and reliable metering
mechanisms.
What support schemes could best encourage the use of district heating and cooling using renewable
energy sources?
‐An obligation to connect to district heating when available should be planned and supported
with a financial mechanism (prime) if needed and emphasized with a prohibitive penalty in
case of non connection.
‐ A support mechanism for the construction of district heating should take into account the raw
material cost and energetic density of the network in order to promote highly efficient
systems (high density of habitations and/or high energy consumption facilities or industries).
‐ Public support should be compatible with public‐private partnerships and third party
financing.
EDORA – National Renewable Source Industry Roadmap – Rev. : February 2010 213.11. Support schemes for renewable resources in transport What should be the concrete obligations / targets per year (per fuel or technology)? Since July 09 there is an obligation to incorporate 4% v/v of bioethanol in gasoline and 4% v/v biodiesel in the gazole. For 2020, we should set also intermediate binding targets for biofuels. The difficulties experienced until now in implementing long term targets at national level not only suggest the need for mandatory targets, but also the necessity that those targets are detailed over shorter periods of time, certainly not over a decade. A sustained and progressive growth in the use of biofuels could be best achieved by establishing intermediate targets for biodiesel and bioethenol in line with the trajectory exposed before in the table (contribution of renewable to transport fuel consumption).Consequent measures should be enforced. Should there be a differentiation of the support according to fuel types (biodiesel, bioethanol) and technologies (second generation biofuels, renewable electricity)? As there is a technology gap between the first and the second generation biofuels, the support should be focused on R&D to further develop the second generation fuels, by financing the development of the technology using raw material like wastes, residues, non‐food cellulosic material, and ligno‐ cellulosic material whose contribution shall be considered to be twice. This must decrease the production cost and increase the competitivity of those new fuels. EDORA – National Renewable Source Industry Roadmap – Rev. : February 2010 22
3.12. Biomass availability
        Table 6 : Biomass availability in 2006

                                                                                 Imported         Exported                     Primary           Final
                                                              Amount of                                            Net          energy          energy
  Sector of
                                    ktoe                       domestic                                          amount       production          use
   origin                                                                               Non‐
                                                               resource         EU               EU/non‐EU        (ktoe)       (value in       (value in
                                                                                         EU
                                                                                                                                 ktoe)           ktoe)

A)    Biomass
from
        14       1. direct supply of wood biomass from                 206,3   213,4                                  419,7
forestry :
                 forests and other wooded land for
                 energy generation

                 2. indirect supply of wood biomass for        283                                              283
                 energy generation

B)    Biomass    Of which:
from
agriculture           1. agricultural crops and fishery        54,8            54,8                             109,5
and fisheries:        products directly provided for
                      energy generation

                      2. Agricultural by‐products /                     100                                             100
                      processed residues and fishery
                      by‐products     for     energy
                      generation

C)   Biomass
from waste:
                 1. Biodegradable fraction of municipal        79 ,8                                             79,8
                 solid waste

                 2. Biodegradable fraction of industrial                 21                                             21
                 waste (including paper, cardboard,
                 pallets)

                 3. Sewage sludge

Total                                                         744,8            268,2                            1013

        Sources: PMDE 2007, Projet d’actualisation du Plan pour la Maîtrise Durable de l’Energie (PMDE) en Wallonie à l’horizon 2020, ICEDD,
        ECONOTEC, Ibam, 2009 and IEA BIOENERGY – TASK40, “Sustainable International Bioenergy Trade Securing Supply and Demand Country
        report Belgium” VITO/CRA‐W, Guisson and Marchal, 2009.

        14
          Biomass from forestry should also include biomass from the forest‐based industries. Under the category of biomass form
        forestry processed solid fuels, like chips, pellets and briquettes should be included in the corresponding subcategories of
        origin.

         EDORA – National Renewable Source Industry Roadmap – Rev. : February 2010                                                     23
Table 7 : Biomass availability in 2020
Imported Exported Primary Final
Amount of Net energy energy
Sector of
ktoe domestic amount production use
origin Non‐
resource EU EU/non‐EU (ktoe) (value in (value in
EU
ktoe) ktoe)
A) Biomass
from
15 1. direct supply of wood biomass from 558 558
forestry :
forests and other wooded land for
energy generation
2. indirect supply of wood biomass for 610 1451 2061
energy generation
B) Biomass Of which:
from
agriculture 1. agricultural crops and fishery 382 620 1002
and fisheries: products directly provided for
energy generation
2. Agricultural by‐products / 929 929
processed residues and fishery
by‐products for energy
generation
C) Biomass 610 610
from waste:
1. Biodegradable fraction of municipal
solid waste
2. Biodegradable fraction of industrial
waste (including paper, cardboard,
pallets)
3. Sewage sludge
Total 3089 2071 5160
What measures could best encourage the use for energy purposes of unused arable land, degraded
land, etc. planned?
15
Biomass from forestry should also include biomass from the forest‐based industries. Under the category of biomass form
forestry processed solid fuels, like chips, pellets and briquettes should be included in the corresponding subcategories of
origin.
EDORA – National Renewable Source Industry Roadmap – Rev. : February 2010 24You can also read