PROSPECTS OF RENEWABLE ENERGY FOR THE NEW CITY OF EL ALAMEIN, EGYPT - DIVA
←
→
Page content transcription
If your browser does not render page correctly, please read the page content below
DEGREE PROJECT IN TECHNOLOGY,
 FIRST CYCLE, 15 CREDITS
 STOCKHOLM, SWEDEN 2019

 Prospects of Renewable
 Energy for the New City of
 El Alamein, Egypt
 An Energy System Model using OSeMOSYS
 to obtain the most cost-efficient electricity
 production mix

 A Minor Field Study
 MARKO MILETIC
 SIMON FÄREGÅRD
 ERIK VON SCHULTZ

KTH ROYAL INSTITUTE OF TECHNOLOGY
SCHOOL OF ARCHITECTURE AND THE BUILT ENVIRONMENT
Abstract
With the motivation to mitigate the effects caused by one of humankind’s biggest challenges,
climate change, the purpose of this minor field study was to examine the prospects of renewable
energy technologies as part of a larger ambition to offer clean and affordable energy for all, in
line with United Nations Sustainable Development Goals. The study was conducted for El
Alamein in Egypt, a city under construction that will house four million residents. By combining
a field study and an interview with literature search, the information needed for an energy system
model was gathered. The modelling system OSeMOSYS was thereafter used to calculate the
most cost-efficient electricity mix for the model period of 2020 to 2040, based on different
scenarios and technologies. The total discounted cost and amount of emissions were thereafter
compared between the scenarios, and the most cost-efficient scenario at reducing emissions was
identified.

Of the scenarios that were compared to the reference case, the one where 50 % of the electricity
was produced from renewables in 2040 proved to be the most cost-efficient option. In addition,
this scenario was also the most cost efficient at reducing emissions by a large margin. Regarding
the renewable technologies, solar photovoltaics, which represented a majority of the renewable
electricity production, was evidently the most cost-efficient technology as well as the one with
the highest potential for future implementation, followed by onshore wind power. Moreover,
concentrating solar power and waste to energy were proven to have a lower potential. The
conclusions drawn were that the city of El Alamein could get a substantial part of its electricity
from renewables and that solar PV was the best technology for that purpose. The final conclusion
was that there might exist great potential for renewable energy in Egypt.

Key words: Renewable energy, energy system modelling, OSeMOSYS, El Alamein, Egypt
Sammanfattning
Med ambitionen att försöka lindra konsekvenserna av vad som idag är en av människans största
utmaningar, klimatförändringen, är syftet med denna minor field study att utvärdera
förutsättningarna för förnyelsebara energitekniker i Egypten. Detta ligger i linje med en större
ambition att erbjuda ren och prisvärd energi i enlighet med de globala hållbarhetsmålen.
Fältstudien utfördes i Egypten och omfattade en ny stad under konstruktion, El Alamein, som
förväntas hushålla fyra miljoner invånare. En fältstudie och tillhörande intervju kombinerades
med en litteraturundersökning för att erhålla nödvändig information som sedan användes i
modelleringen av energisystemet. Modelleringsverktyget OSeMOSYS användes för att erhålla
den mest kostnadseffektiva energimixen för åren 2020 till 2040, baserat på ett flertal olika
scenarier och tekniker. Den totala diskonterade kostnaden samt mängden utsläpp jämfördes
mellan de olika scenarierna, och det mest kostnadseffektiva scenariot för att minska utsläpp
identifierades.

Av de scenarier som jämfördes med referensfallet, så var scenariot där förnyelsebara
energitekniker stod för 50 % av elproduktionen år 2040 den mest kostnadseffektiva energimixen
för att tillfredsställa behovet samt för att minska mängden utsläpp. Av de förnyelsebara
energiteknikerna så visade sig solceller, som stod för en majoritet av den förnyelsebara
produktionen, vara den mest kostnadseffektiva tekniken då den i samtliga förnyelsebara
scenarier prioriterades av modellen. Därmed visade sig den vara den tekniken med högst
potential för framtida implementationer, följt av landbaserad vindkraft. Koncentrerad solkraft i
form av soltorn visade sig inte vara kostnadseffektiv då den inte bidrog till produktionen i något
scenario. Avfallsförbränningen, som bidrog minimalt till energimixen, saknade tillgång till den
mängd bränsle som hade krävts för att den skulle kunnat stå för en större andel av produktionen.
Därmed konstaterades det att båda dessa teknologier hade en låg potential för framtida
implementationer.

De slutsatser som drogs var att staden El Alamein kunde få en betydande del av sin elektricitet
från förnyelsebara energikällor samt att solceller var mest lämpad för det syftet då den var mest
kostnadseffektiv. Utöver dessa så drogs slutsatsen att det kan finnas stor potential för
förnyelsebar energi i Egypten.

Nyckelord: Förnyelsebar energi, energisystemmodellering, OSeMOSYS, El Alamein,
Egypten
Acknowledgement
This project would not have been possible without the expertise and guidance from our
supervisor Prof. Andrew Martin and our external supervisor Dr. Norhan Ibrahim Ghoneim from
Pharos University. Prof. Martin laid the foundation for this bachelor thesis by helping us define
the scope of the study and has assisted us throughout the course of this project. Dr. Ghoneim
helped us during our whole stay in Alexandria, providing us with the necessary information by
organizing field visits, interviews and other practical activities. Dr. Ghoneim has also acted as a
link between us and the rest of Pharos University. They have our deepest gratitude for enabling
this bachelor thesis and collaboration between KTH and Pharos University.

Special thanks to our Egyptian colleagues Mohammed Khairy, Abdelghfar Hassan, Ahmed S.
Elhdad and Ahmed M. Rezk for participating in the collaboration. More specifically, we would
like to express our gratitude for their part in the common effort of identifying the technologies
and in the gathering of information. Additionally, we would like to thank them for acting as our
interpreters during interviews, as well as contributing to making our visit more than just a
professional cooperation by showing us the local cultures of Alexandria.

We would also like to show our appreciation for the immense work and support provided by
Pharos University. From the day of arrival to the day of departure, constant help was provided,
making our stay wonderful. Special recognition to the Dean of the faculty of Engineering, Prof.
Mohamed G. Abou-Ali for the warm welcome and for showing great enthusiasm for our project.
International coordinator Dr. Menna Gowayed and Amr Mamdouh deserves our special thanks
for taking care of day-to-day matters in a splendid fashion.

Least but not last, we would like to thank the course examiner Monika Olsson, for an excellent
structured course and Prof. Albania Nissan for helping us with the preparations for the trip.
Finally, we would like to express great gratitude towards Sida for the opportunity to establish
international collaborations and for making this minor field study possible.
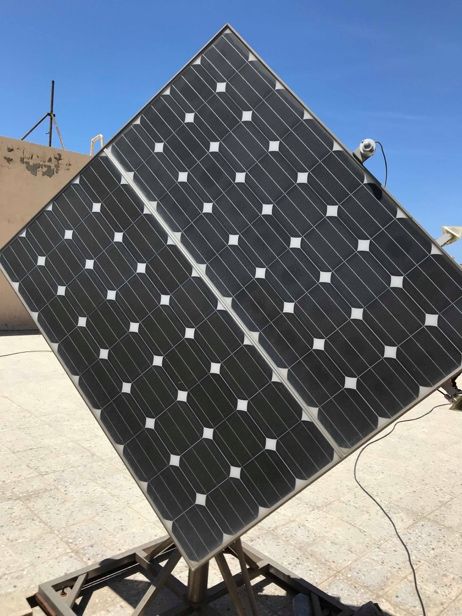
Table of contents
1. Introduction .......................................................................................................................1
 1.1 Purpose.............................................................................................................................2
 1.2 Objective ...........................................................................................................................2
2. Methodology and source discussion ..........................................................................3
 2.1 Collecting information .......................................................................................................3
 2.2 Modelling with OSeMOSYS ..............................................................................................3
 2.3 Analysis.............................................................................................................................4
 2.4 Limitations.........................................................................................................................4
 2.5 Source discussion.............................................................................................................5
3. Background study............................................................................................................6
 3.1 National energy situation ..................................................................................................6
 3.2 Demand distribution ..........................................................................................................8
 3.3 National strategies and goals............................................................................................9
4. Field study in El Alamein..............................................................................................10
5. Local prerequisites ........................................................................................................11
 5.1 Population and electricity demand ..................................................................................11
 5.2 Agriculture and waste management ...............................................................................11
 5.3 Wind and solar data in El Alamein ..................................................................................11
6. Technologies...................................................................................................................13
 6.1 Onshore Wind Power......................................................................................................14
 6.2 Solar PV..........................................................................................................................16
 6.3 Waste to Energy plant.....................................................................................................18
 6.4 Concentrated Solar Power – Solar Tower.......................................................................19
 6.5 Nuclear Power plant........................................................................................................21
 6.6 Natural Gas CCGT (BAU)...............................................................................................23
7. Preparations for OSeMOSYS.......................................................................................25
 7.1 Specified annual demand profile.....................................................................................25
 7.2 Population and electricity demand ..................................................................................25
 7.3 Available rooftop area for Solar PV.................................................................................27
 7.4 Maximum Solar PV utilization .........................................................................................27
 7.5 Waste generation for Waste to Energy plant ..................................................................28
 7.6 Other input parameters ...................................................................................................28
8. Scenarios .........................................................................................................................29
8.1 Reference case - Natural Gas (Business as usual) ........................................................29
 8.2 Scenario 1 - Nuclear and Natural Gas (Egypt’s solution) ...............................................29
 8.3 Scenario 2 – 50 % Renewables ......................................................................................29
 8.4 Scenario 3 – 100 % Renewables ....................................................................................30
9. Results..............................................................................................................................31
 9.1 Reference case – Natural Gas (Business as usual) .......................................................31
 9.2 Scenario 1 - Nuclear Power and Natural Gas.................................................................32
 9.3 Scenario 2 – 50 % Renewables by 2040 ........................................................................34
 9.4 Scenario 3 – 100 % Renewables by 2040 ......................................................................36
 9.5 Cost reduction of emissions............................................................................................38
10. Discussion.......................................................................................................................39
11. Conclusion and future work ........................................................................................42
References ......................................................................................................................................43
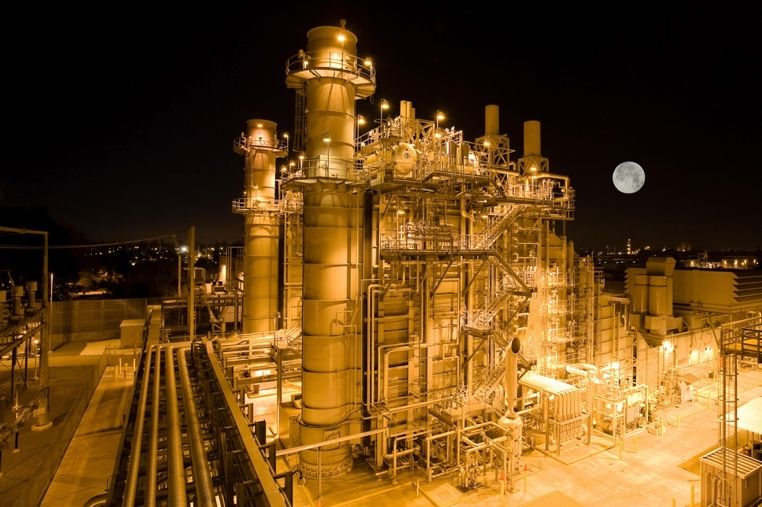
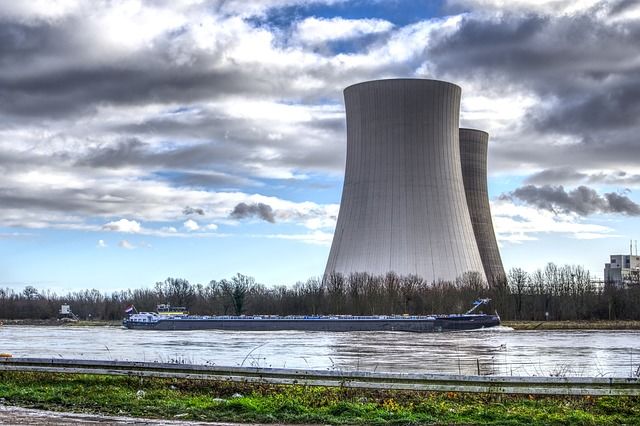
Index of figures
Figure 1. The share between different primary energy sources used in Egypt 2014/2015. [Data collected from
IRENA, 2018a, p. 9]. ...................................................................................................................................................6

Figure 2. Share of electricity generation from different technologies in Egypt 2015. [Data collected from IRENA,
2018a, p. 14]. ..............................................................................................................................................................7

Figure 3. Upper graph: Maximum peak load during 24h in Egypt 2016/2017. Lower graph: Electricity consumption
each month in Egypt 2016. [Data collected from CEIC and EEHC]. ...........................................................................8

Figure 4. Share of different primary energy sources targeted for electricity production in Egypt by 2030. [Data
collected from SDSEgypt2030, 2016, p. 97]. ..............................................................................................................9

Figure 5. Photos from the field visit to El Alamein, showing the ongoing development in the area as well as a photo
from one of the interviews being conducted. Photos taken by: Amr Mamdouh, Marko Miletic, Simon Färegård &
Erik von Schultz.........................................................................................................................................................10

Figure 6. Upper graph: Daily wind speed activity in [m/s] each day of the year. Lower graph: Monthly wind speed
activity [m/s] each month of the year. [Data collected from https://www.renewables.ninja/]. ....................................12

Figure 7. Upper graph: Daily solar activity in [kW/m2] each day of the year. Lower graph: Monthly solar activity
[kW/m2] each month of the year. [Data collected from https://www.renewables.ninja/]. ...........................................12

Figure 8. Reference Energy System of technologies and primary energy sources identified for El Alamein...........13

Figure 9. Wind turbines of model Nordex N43 600 aligned in Zaafarana. Photo: Marko Miletic. .............................14

Figure 10. Pharos university’s solar PV on the faculty of engineering’s rooftop. Photo: Simon Färegård. ..............16

Figure 11. Capacity factor for solar PV each month of the year in El Alamein 2014. [Data collected from
https://www.renewables.ninja/]..................................................................................................................................16

Figure 12. Photo of a Waste to Energy plant. [Source: ÅF]......................................................................................18

Figure 13. Pharos University’s prototype of a CSP – solar tower built on the faculty of engineering’s rooftop.
Photo: Erik von Schultz .............................................................................................................................................19

Figure 14. Photo of a nuclear power plant. [Source: Pixabay]. ................................................................................21

Figure 15. Price history of uranium U308 from 1988 until 2019. [Source: UcX, LLC https://www.uxc.com/]. ..........22

Figure 16. Photo of a natural gas plant. [Source: Unsplash]. ...................................................................................23

Figure 17. Population in El Alamein each year from 2020 to 2040. .........................................................................26

Figure 18. Strategic renewable share targets to achieve certain years of the time period in scenario 2. ................29

Figure 19. Strategic renewable share targets to achieve certain years of the time period in scenario 3. ................30

Figure 20. Production of electricity each year [PJ] by CCGT using natural gas.......................................................31

Figure 21. Production of electricity each year [PJ] by available technologies in scenario 1.....................................32

Figure 22. Total installed capacity each year for all available technologies in scenario 1........................................33

Figure 23. Production of electricity each year [PJ] by available technologies in scenario 2.....................................34

Figure 24. Total installed capacity each year for all available technologies in scenario 2........................................35
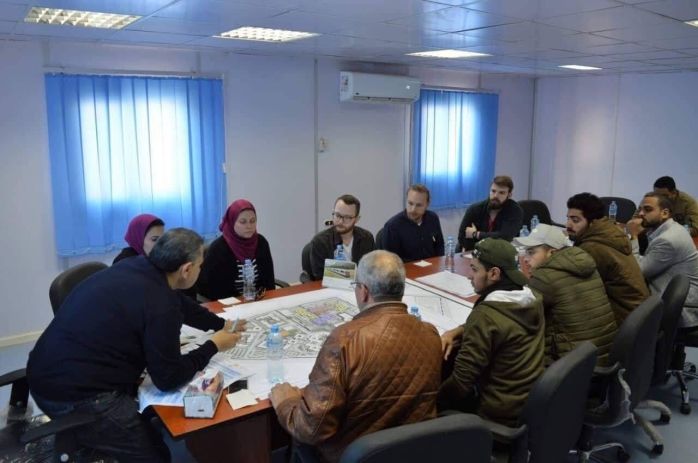
Figure 25. Production of electricity each year [PJ] by available technologies in scenario 3.....................................36

Figure 26. Total installed capacity each year for all available technologies in scenario 3........................................37

 Index of tables
Table 1. Input parameters for onshore wind turbine in the initial year of 2020 in OSeMOSYS ..............15

Table 2. Input parameters for solar PV in the initial year of 2020 in OSeMOSYS..................................17

Table 3. Input parameters for waste to energy plant in the initial year of 2020 in OSeMOSYS .............18

Table 4. Input parameters for CSP – solar tower in the initial year of 2020 in OSeMOSYS...................20

Table 5. Input parameters for nuclear power plant in the initial year of 2020 in OSeMOSYS ................22

Table 6. Input parameters for CCGT plant in the initial year of 2020 in OSeMOSYS ............................24

Table 7. Total discounted cost and total amount of emissions in the reference case ............................31

Table 8. Total discounted cost and total amount of emissions in scenario 1..........................................33

Table 9. Total discounted cost and total amount of emissions in scenario 2..........................................35

Table 10. Total discounted cost and total amount of emissions in scenario 3........................................37

Table 11. Difference in variables between scenarios and the reference case .......................................38
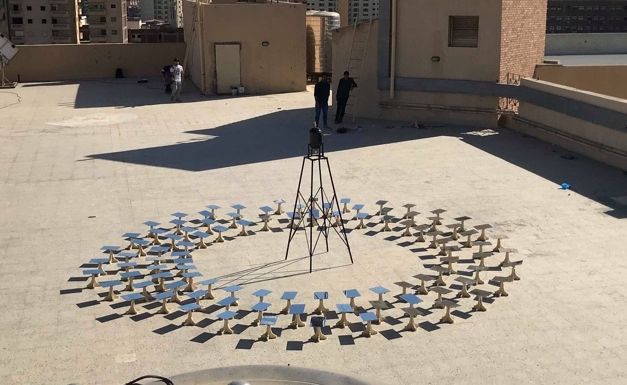
Table of appendices
1. Transcript from interview in El Alamein ............................................................I

2. Onshore Wind Power ......................................................................................II
 2.1 Capital cost..........................................................................................................................II

 2.2 Variable O&M cost ..............................................................................................................II

 2.3 Capacity factors...................................................................................................................II

3. Solar PV.........................................................................................................IV
 3.1 Capital cost ........................................................................................................................IV

 3.2 Capacity factors .................................................................................................................IV

4. CSP – Solar Tower .........................................................................................V
 4.1 Capital cost .........................................................................................................................V

 4.2 Variable O&M cost ..............................................................................................................V

 4.3 Capacity factors ..................................................................................................................V

5. Nuclear Power plant (BAU)...........................................................................VII
 5.1 Variable O&M cost ............................................................................................................VII

6. Natural Gas CCGT (BAU) .............................................................................VII
 6.1 Variable O&M cost ............................................................................................................VII

7. Preparations for OSeMOSYS ......................................................................VIII
 7.1 Specified annual demand ................................................................................................VIII

 7.2 Electricity demand in El Alamein......................................................................................VIII

 7.3 Available rooftop area for Solar PV..................................................................................VIII

 7.4 Maximum Solar PV capacity ..............................................................................................IX

 7.5 Total Organic Waste generated .........................................................................................IX

 7.6 Electricity production from Organic Waste.........................................................................IX
Nomenclature
BAU Business as usual
CCGT Combined Cycle Gas Turbine
CSP Concentrated Solar Power
EIA Energy Information Administration
IEA International Energy Agency
IRENA International Renewable Energy Agency
OECD Organisation for Economic Co-operation and Development
OSeMOSYS Open Source Energy Modelling System
O&M Operation and Maintenance
PV Photovoltaic
SDG Sustainable Development Goal
WtE Waste to Energy
1.Introduction
Climate change and global warming, arguably humankind’s biggest challenges throughout
history, originates from excessive use of fossil fuels which emits greenhouse gasses into the
atmosphere. To reduce these emissions while meeting the energy demand of today as well as in
the future, a transition towards renewable energy sources will be needed (World Commission
on Environment and Development, 1987).

Since the vantage point of 1987, with the presentation of the Brundtland report, the United
Nations has continually worked towards the goal of a more sustainable world. Following the
Brundtland report was Agenda 21, ratified in Rio de Janeiro in 1992 in order to establish a
framework for sustainable development (Andrews, 2016, pp. 1-4). One of the most recent
developments in this area is the introduction of the SDGs which embodies the core of the
Agenda 2030. These goals concretize the needs to be met in order to achieve a world not only
characterized by sustainability but defined by it. The new agenda also highlights the need to
support vulnerable countries, the majority of which are located in Africa (UN, 2015, pp. 5-7).

Africa is composed of dozens of countries with significant variations regarding economic and
social development. One of the main obstacles many share is the need to provide electricity to
their population. In sub-Saharan Africa, 62,5 % of the population lacked access to electricity in
2017, thus making lighting and powering up Africa one of the United Nations highest priorities.
Egypt on the other hand has an electrification rate of 99,8 %, allowing them to pursue other
goals such as SDG 7, providing affordable and clean energy and SDG 13, reducing global
climate impact (The Sustainable Development Goals Center for Africa, 2018, p. 2, 71; World
Economic Forum, ca. 2017).

According to Egypt’s sustainable development strategy, Egypt vision 2030 for energy, the
country aims to diversify their energy mix to reach international standards. Furthermore, Egypt
regularly works on meeting the growing energy demand from all sectors, while reducing the
total amount of emissions emitted from the energy sector (SDSEgypt2030, 2016, pp. 94-96).
The country’s ambition, according to Egypt’s Integrated Sustainable Energy Strategy to 2035,
is to reach 20 % renewable energy in their electricity mix by 2022 and 42 % by 2035. As of
2015, the renewable share of the electricity was 8,5 %, where hydroelectric power accounted
for 7,5 % (IRENA, 2018a, p. 14, 29).

In line with previously stated ambitions, the government of Egypt is currently building the new
city El-Alamein that is called “the start of a different generation of new cities in Egypt that
depends on sustainability”, as stated in the publication from the state information service with
the name “Al - Alamein, from war and destruction to development and construction”
(2018, p. 43).

 1
The publication further describes El Alamein as one of three new cities that the government,
together with the private sector, will build as a step to manage the overpopulation that exists in
the most densely populated cities like Alexandria and Cairo. The cities will hold residents,
industry, universities and agriculture while at the same time focusing on tourism. El Alamein
has been named a fourth-generation city because of its focus on sustainability and resource
cycles (State Information Service, 2018, pp. 41-48).

In agreement with the approach defined by sustainability and the fact that the city's
infrastructure is under construction, the opportunity for investments into utilization of
renewable energy sources such as solar, wind, biomass and hydropower are optimal. However,
by being the first of its kind in Egypt, there is no information available regarding possible cost-
efficient renewable energy solutions that could be applied to El Alamein. The lack of
information may influence the decision-makers to create suboptimal solutions for the city’s
energy system, in terms of minimizing climate impact and creating clean and affordable
electricity. More specifically, the lack of available information may lead to wrongful
investments that are not cost efficient and sustainable. The information provided by this project
could therefore be of great importance in future policy and decision making. Simultaneously
this study contributes to cover the gap regarding the overall available information about
renewable energy systems in cities within Egypt. These two benefits may together pave the way
for the development of future sustainable cities in Egypt, with the city of El Alamein as the
focal point.

1.1 Purpose
In line with the United Nations Sustainable Development Goals, the purpose of this field study
is to examine the prospects of renewable energy technologies with regards to economic factors
in the city of El Alamein.

1.2 Objective

One objective of this project is to identify the electricity demand in the city of El Alamein. In
addition, an objective is to identify renewable energy technologies capable of meeting the
demand for electricity in the city of El Alamein. Thereafter, an objective is to create an energy
system model with the identified technologies that determines the most cost-efficient electricity
mix while meeting the demand. In addition, the objective also aims to identify which renewable
electricity mix that reduces emissions in the most cost-efficient manner, with reference to a
fossil-fuel based equivalent. To conduct a discussion regarding the future use of renewable
energy in El Alamein in particular, and Egypt in general, based on the results obtained from this
project, will be the last main objective. Furthermore, the project aims to improve the relationship
between KTH and Pharos University through collaboration and promote Sustainable
Development Goals. There are also goals of a more general character. These include, but are not
limited to, the possibility for the project to contribute to the establishment of future policies
regarding the energy transition towards renewable energy.

 2
2. Methodology and source discussion
This thesis has mainly been conducted during an eight week stay in Alexandria, Egypt. The work
has partly been done in collaboration with Pharos University. A field visit took place during the
stay to gather data necessary for the report and to establish an overall understanding of the
environment in which our energy system would be implemented.

2.1 Collecting information

To gather information, a combination of two methodologies – literature search and field study –
were implemented to provide all necessary information. The literature study was mainly
conducted through internet searches to gather information about the technologies, Egypt’s
electricity production as well as the weather conditions of the examined site. This approach was
also used to find information needed for the required assumptions. The main sources of
information used, when available, was renowned agencies and organisations such as IRENA,
IEA and EIA. When these were insufficient, scientific reports as well as government websites
and their documents were largely used.

To complete the gathering of information, a field study involving an interview with construction
officials and site examinations were performed. The performed interview was semi-structured,
using prepared questions while allowing the interviewees to go into greater detail where they
felt appropriate. The interview was conducted through interpreters, and the prepared questions
were related to the construction of El Alamein, with focus on the planned capacity, estimated
construction completion date and the electricity supply. For the transcript of the interview, see
Appendix 1. Moreover, the field visit had the purpose of obtaining a good and realistic picture
regarding the circumstances in which the modelled energy system would be implemented. Also,
to a further extent, to see if the information that was previously obtained about the site was in
line with what was observed when visiting.

2.2 Modelling with OSeMOSYS
The tool used for the modelling of the energy system in El Alamein was OSeMOSYS. This
platform was developed through a collaboration between several institutes and organisations
such as KTH Royal Institute of Technology and the International Atomic Energy Agency
(IAEA). It was first published in 2008 and the application of the modelling tool is stated as
“OSeMOSYS is an open source modelling system for long-rung integrated assessment and
energy planning” (KTH dESA, 2019, pp. 5-8). OSeMOSYS uses linear optimisation to calculate
the most cost-efficient energy supply mix, i.e. minimizing the total discounted cost, that meets
the defined demand of the examined subject, in this case a city. This is done for every year of
the model period and within the operational space defined by the different constraints
implemented such as emissions limits or defined renewable share of the energy mix. The
modelling system was firstly written in GNU MathProg which is a mathematical language of a
high level and uses an approach defined by algebraic expressions and equations (KTH dESA,
2019, p. 8).

 3
OSeMOSYS operates on input data for every parameter, every year of the model period. With
this information it optimizes the energy system, as described above, and presents an output
consisting of different variables of information regarding the energy system. These so-called
variables account for a wide range of factors, such as many different types of costs for different
technologies to the rate of production from different technologies each year. This thesis used
OSeMOSYS as a tool to produce four scenarios. The scenarios had different constraints such as
percentages of renewables for electricity production, or a predetermined production mix. Two
scenarios consisted of different percentages of renewables in the energy mix, one represented
Egypt’s solution for the city’s energy system and the last scenario was a reference case that
represented business as usual. The scenarios were produced in OSeMOSYS with the purpose of
obtaining the variables mentioned earlier and, to a further extent, enable them to be presented
with graphs, showing different cost-efficient electricity mixes in the city of El Alamein.

2.3 Analysis
After the completion of the different scenarios, each scenario’s electricity mix production and
total installed capacity were examined. The behaviour of the different technologies in each mix
were thereafter analysed with regards to their constraints, to determine the reason for their
contribution. Additionally, the total discounted cost and total amount of emissions were
identified for each scenario. These two variables were thereafter compared to the business as
usual case for each scenario, and the cost of reducing emissions was identified. This cost was
then compared between the scenarios, to determine which electricity mix reduced emissions in
the most cost-efficient manner. Lastly, a general discussion was conducted on the different
renewable technologies and their potential for future implementation in Egypt.

2.4 Limitations

First and foremost, the project only considered the production of energy in the form of electricity.
This implies that energy forms such as heat (and cooling) were not considered directly, but rather
seen as being produced by electricity. This means that a certain demand for heat was considered
as the equivalent demand for electricity needed for producing that heat. The electricity that was
not produced within the city of El Alamein, was considered as if it was produced from a single
source and represented the reference case that will be described later in this report. Thirdly, El
Alamein was seen as an isolated unit that was not interacting with its surroundings in any matter
apart from the incoming flow of electricity.

Furthermore, the project only evaluated and accounted for the development of the energy system
in El Alamein from 2020 until 2040, events thereafter were not taken into consideration. It is
important to state that the project was performed with an oversimplified approach since the
combination of time, resources and the magnitude of the project would not allow a more detailed
approach. This influenced the information gathered, especially the information regarding the
different technologies.

 4
2.5 Source discussion
As previously mentioned, many of the sources used were recognized agencies and organisations,
and the information gathered from these sources was therefore considered to be reliable and of
high quality. The information gathered from the other sources, such as research articles, may
have inherent deficiencies but despite this possibility, they were also considered reliable since
they were, many times, conducted under the supervision of reliable institutes like universities.
However, because of the possibility of low-quality information provided from one source, the
solution throughout the whole report was to strengthen the information gathered by referring to
other sources as well as to ensure the reliability of the information used. The information may
sometimes also suffer from being what could be considered outdated but was still used because
of the lack of more current information.

The information gathered from the field visit and specifically the interview, has the possibility
of suffering from subjectiveness since the person interviewed answered the questions from their
own experience and knowledge. Furthermore, the information obtained from the interview went
through the process of interpretation, which in itself could consist of problems regarding, for
example, subjectiveness and the lack of ability to express the information in English, since the
interview was conducted in Arabic. This problem was met by using several interpreters to enable
translations from different people and therefore minimizing the risk of misinterpretations. Also,
clear and simple questions were used to avoid confusion and vague answers.

 5
3. Background study
This section aims to introduce historical and current information to provide a general
understanding of the energy situation in Egypt.

3.1 National energy situation
In 2014/2015 the country’s primary energy supply was mainly divided between oil and gas,
whom together accounted for 94 %. The remaining percentages were shared among coal, solar,
wind, hydropower as well as biofuels and waste, see Figure 1 (IRENA, 2018a, p. 9).

 Figure 1. The share between different primary energy sources used in Egypt 2014/2015.
 [Data collected from IRENA, 2018a, p. 9].

In the same year of 2015, Egypt’s electricity was primarily produced by natural gas, 66 %, and
dual-fuel plants that accounted for 19 % of the total production. Dual-fuel plants utilizes two
types of fuels when producing electricity, the fuels can vary but usually consists of diesel and
natural gas (Hall & Kassa, 2018, p. 7). The rest of the electricity production was divided by
hydro and other renewables such as wind and solar as seen in Figure 2.

 6
Figure 2. Share of electricity generation from different technologies in Egypt 2015.
 [Data collected from IRENA, 2018a, p. 14].

The total installed capacity for Egypt increased to 38 857 MW under 2015/2016. This capacity
was distributed between five different types of sources/plants. These are, presented in
descending order of installed capacity, thermal steam plants, CCGT plants, OCGT (open-cycle
gas turbine) plants, hydroelectric plants and non-hydro renewable plants (IRENA, 2018a, p. 12).

 7
3.2 Demand distribution
The maximum peak load distribution during 24 hours of the day in 2016/2017 was gathered from
the Ministry of Electricity & Renewable Energy in Egypt and is presented in the upper graph in
Figure 3. Moreover, the lower graph in Figure 3 is the electricity consumption in Egypt by
month in 2016 and was gathered from CEIC: Global Economic Data, Indicators, Charts &
Forecasts. The monthly consumption is a representation of the demand distributed each month
of the year, where the summer and intermediate months have a larger demand than during the
winter for that year.

 Figure 3. Upper graph: Maximum peak load during 24h in Egypt 2016/2017.
 Lower graph: Electricity consumption each month in Egypt 2016.
 [Data collected from CEIC and EEHC].

 8
3.3 National strategies and goals
The closest and most extensive goal set out by the Egyptian government is the plan of doubling
the installed capacity from 50 GW in 2018, to about 100 GW in 2020. Renewable energy will
contribute with diversification of this newly planned capacity. The government has committed
themselves to implementing another 10 GW of solar and wind by 2022, where renewables would
account for 20 % of the electricity mix (IRENA, 2018a, p. 4,7).

ISES to 2035, Egypt’s Integrated Sustainable Energy Strategy, contains several aims for the
country's future energy development. Among them are aims of meeting the growing demand of
energy while decreasing the amount of emissions and pollutants from the sector and diversifying
the energy mix. A goal of increasing the production amount from renewable energy from 8,5 %
in 2015 to 42 % by 2035, serve as a strategy to fulfil the aims mentioned above. The strategy
towards more renewables according to Egypt’s Vision 2030 has a target where renewables will
account for 35 % of the electricity production by 2030, where wind and solar will account for
most of the renewables, see Figure 4 (IRENA; 2018, p. 6; SDSEgypt2030, 2016, pp. 94-97).

 Figure 4. Share of different primary energy sources targeted for electricity production in Egypt by 2030.
 [Data collected from SDSEgypt2030, 2016, p. 97].

 9
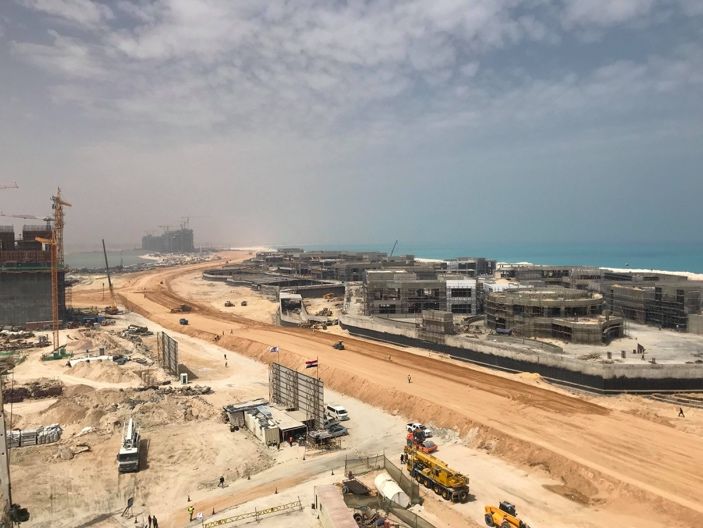
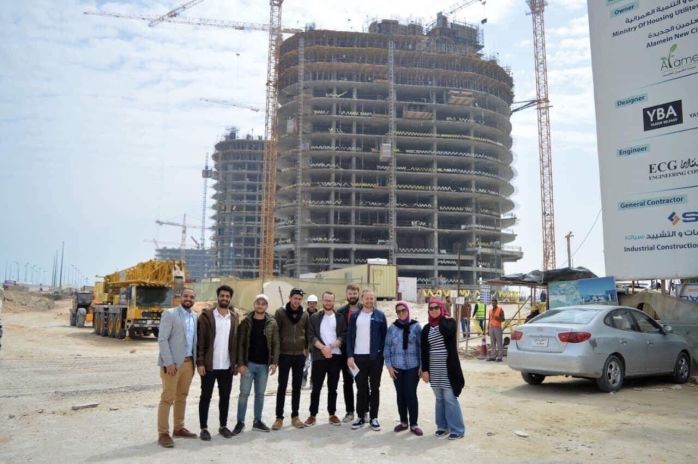
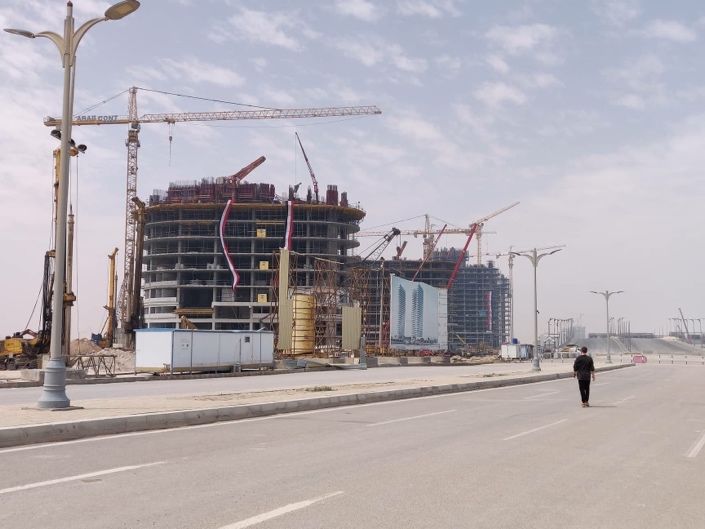
4. Field study in El Alamein
On the 23rd of March 2019, a field visit to the construction site for the city of El Alamein was
made. During the visit one interviews was performed and several locations throughout the site
were visited and photographed. The interview served the purpose of providing information for
the project and to contribute to an overall understanding regarding the general thoughts and plans
about the construction of the city, as well as of the ambitions for the city. The transportation
around the construction site and the locations visited, confirmed some of the information
gathered from the interview and served as basis for the construction of our limitations and
assumptions throughout the project.

During the field visit several observations were made. Firstly, many of the buildings that were
close to be finished appeared to be of same height which would therefore implicate that shadows
from one building would not necessarily cover the roofs of other buildings. The beaches were
not constructed upon and the water close by was not used for any other purpose than for
recreation. Thirdly, no indications of renewable energy technologies such as wind turbines could
be seen. Lastly the overall construction site seemed to progress at a rapid speed.

Figure 5. Photos from the field visit to El Alamein, showing the ongoing development in the area as well as a photo from one of the
 interviews being conducted. Photos taken by: Amr Mamdouh, Marko Miletic, Simon Färegård & Erik von Schultz.

 10
5. Local prerequisites
This section contains information specific for the location and future development of
El Alamein.

5.1 Population and electricity demand
During an interview conducted on 23rd of March 2019 in El Alamein, the electrical manager
Eng. Ahmed Hassan and Eng. Abd El Hamid working on the project El Alamein, stated that the
construction of the city is divided into four different phases. The initial phase began in March
2018 and was estimated to be finished in June 2020. When the other three phases will be finished
was not known at the time. Each phase was expected to house one million residents, resulting in
a total of four million citizens when the city is completed. The available information they had
regarding the electricity demand for the different phases were for the first and second phase,
which was predicted to be 750 and 1325 MW respectively. As for the total area of the city, it
was said to be 70 000 feddan, which equals 294 square kilometres. Moreover, it was stated in
the interview that no power stations such as offshore wind power or wave energy will be utilized
close to the beaches, since these will be preserved for tourism, see Appendix 1.

5.2 Agriculture and waste management
As stated by Eng. Ahmed Hassan in the interview, there are currently no plans for any type of
agriculture in the surrounding area of the city, resulting in no available waste or crop residue
generated from agriculture in El Alamein. Furthermore, a recycling plant will be in place once
the city is complete, but Eng. Ahmed Hassan did not know the specified capacity or which
material the plant would recycle, see Appendix 1. No information regarding the waste
management in El Alamein was obtained. However, a waste management study in Egypt
mentioned that waste generation in the nearby city of Alexandria was 0,8 kg/capita per day in
1999 (Egyptian Environmental Affairs Agency, 1999, p. 3).

5.3 Wind and solar data in El Alamein
The wind speed data presented in Figure 6 was gathered from El Alamein in 2017. The wind
speed data gathered from http://www.renewables.ninja/, which was obtained from NASA,
suggested that the monthly average wind speed does not drop below 6,6 m/s. This could be seen
as an indicator to why wind energy should be prospected in El Alamein. Furthermore, as seen in
Figure 6, the most optimal wind harvesting hours occurred during the winter months and until
early spring, where wind speeds reached up to 14 m/s. The solar radiation data, also gathered
from Renewables Ninja presented in Figure 7 was gathered from El Alamein in 2017. As seen
in the upper graph in Figure 7, the solar radiation was more consistent midway through the year
and reached peak values of up to 0,3346 kW/m2. This could be seen as an indicator to why solar
energy should be prospected in El Alamein. Furthermore, as seen in the lower graph in Figure
7, the most optimal period to harvest solar energy was throughout summer and in the beginning
of autumn. Most of the peak values occurred within this time period. On the contrary, winter
period carried fewer sun hours i.e. lower peak values and had more fluctuations that year.

 11
Figure 6. Upper graph: Daily wind speed activity in [m/s] each day of the year.
 Lower graph: Monthly wind speed activity [m/s] each month of the year.
 [Data collected from https://www.renewables.ninja/].

Figure 7. Upper graph: Daily solar activity in [kW/m2] each day of the year.
 Lower graph: Monthly solar activity [kW/m2] each month of the year.
 [Data collected from https://www.renewables.ninja/].

 12
6. Technologies
This section contains information and calculations for the different technologies. The cost of
each technology was divided into three separate costs and applied to 2020 as a starting point.
The first was the overnight capital cost per installed MW, which consists of a single payment
required to launch a project, covering the cost of construction for example. Two additional are
the fixed and variable O&M costs. The fixed O&M costs in $/MW, are the expenses needed for
staffing and administrative expenses among others. The variable O&M costs are the expense
needed for the production processes, including fuel (EIA, 2016, pp 37-41). The fixed costs for
all technologies, despite CSP, were obtained from the same source, as to not let factors like
different salaries from different countries affect the outcome when possible. When available,
global trends in cost variation over a period of time was used to estimate the future price
development except for the fixed cost, which was assumed to be constant.

The information regarding the technologies also contained operational life and capacity factor.
The capacity factor is the ratio between the actual production and the productions maximum
potential, which was either identified or calculated (University of Massachusetts, 2008). The
capacity factors that fluctuated with time were divided into different time periods called time
slices, which represented their rate of production during that period. The whole year consists of
24 different time slices, where each time slice represents day or night for a whole month, defining
day as the time between 08:00-20:00 and night as the remaining hours. Information regarding
emissions will only be provided for the non-renewable technologies, since the emissions from
the renewables was estimated to be zero. The technologies listed below will be electricity
producing technologies in OSeMOSYS and the reference energy system seen in Figure 8 was
the basis from which the scenarios were applied on.

 Figure 8. Reference Energy System of technologies and primary energy sources
 identified for El Alamein.
 13
6.1 Onshore Wind Power
 There are different types of wind turbines
 available, the most common one people think of is
 the horizontal-axis turbine, see Figure 9. The
 mechanism that follows is that the wind forces the
 blades to rotate, transferring mechanical power on
 to a rotating shaft, then to the gearbox and lastly to
 the generator which generates electricity (Heinzen
 & Reinemann, 2014, p. 1).

 Wind power’s capital cost was selected to $1,2
 million/MW. This value lies between the
 estimated global average cost of $1,5 million/MW
 and costs in emerging economies, namely India
 and China are about $1,0 million/MW. Therefore,
 a value in between was considered reasonable. The
 fixed O&M cost was set to $39 700/MW-year, in
 line with the information from the US Energy
Figure 9. Wind turbines of model Nordex N43 600 Information Administration, for an onshore wind
aligned in Zaafarana. Photo: Marko Miletic. technology (2016, p. 41). The variable O&M cost
 for onshore wind power production was set to
$20/MWh, chosen from the lower spectrum of an average from OECD countries. Moreover, the
lower value of the spectrum was chosen since the average in other regions, including both India
and China, were below the values of the chosen spectrum (IRENA, 2018b, pp. 93-94, 108). The
operational life time for the wind power plants was set to 20 years, equal to the life time of
Nordex N43 600, a wind turbine model used in Egypt (Rehman et al., 2003, p. 578;
TheWindPower, 2018).

Both capital and variable cost will change in line with the estimated 70 % average decline in
installed cost of wind farms from IRENA’s report on renewable power generation costs in 2017,
measured between 1983 to 2017 (2018b, p.94). Assuming a constant yearly decline, the
percentage was calculated to 3,48 % by using the following equation

 1

 % ℎ = (
 )
 ― 1 ∗ 100, (1)

the different capital costs and variable O&M costs throughout all years are presented in
Appendix 2.1 and Appendix 2.2. Onshore wind turbine’s capacity factor was estimated using
the model from Renewables Ninja. The inputs that were used to generate these capacity factors
were the location of El Alamein, the year 2017 which was assumed to reflect all years, the hub
height of 80 meters (that is the height where the blades are centred) and the turbine model Nordex
N43 600. The model used the NASA dataset of MERRA-2 (Renewables Ninja, 2018?).
Moreover, the capacity factor for the day and night was assumed to be equal each month. Lastly,
the capacity factor obtained from the year 2017 was adjusted for each time slice to account for
historical values, according to
 14
 ,
 = ∗ ,
 , (2)

where the was calculated as the mean value of the yearly average capacity factor
from 2000 to 2016, resulting in = 0,2867. The mean value of , in 2017,
obtained from Renewables Ninja was , = 0,267. With the calculated and
the , identified from Renewable Ninja as the capacity factor each month, using
equation (2) the values of the adjusted capacity factors for each time slice were obtained, see
Appendix 2.3. Furthermore, an area of 656 km2 along the Suez Canal has been devoted to
implementing a wind farm with a capacity of 3000 MW, which equals an area usage of 0,2186
km2/MW (Wind Energy the Facts, cs. 2007). All initial parameters for 2020 that are presented
in the paragraphs above are gathered in Table 1.

 Table 1. Input parameters for onshore wind turbine in the initial year of 2020 in OSeMOSYS

 Input parameters for 2020 Onshore Wind Turbine

 Capital Cost ($/MW) 1 200 000

 Fixed O&M Cost ($/MW-year) 39 700

 Variable O&M Cost ($/MWh) 20

 Operational Life (years) 20

 Average Capacity Factor (%) 26,7

 15
6.2 Solar PV
Photovoltaics (PV) generate electricity by utilizing a
combination of photoelectric materials and light. The light
causes the material to absorb photons, leading to a release
of electrons which is used as electricity. Solar PV can be
installed in both large and small scales, resulting in it being
applicable on large PV farms and small mini-grids (IRENA,
2018c; Knier, 2008).

The capital cost for solar PV was set to $1,5 million/MW,
which is in the lower spectrum of the cost range according
to IRENA’s report Renewable Power generation Cost in
2017 (2018b, p. 66), where the total installed cost in 2017
for different countries range between $1 million/MW to
$4,5 million/MW. The chosen fixed O&M cost was $23
 Figure 10. Pharos university’s solar
400/MW-year, taken from a fixed PV model, and the PV on the faculty of engineering’s
variable O&M cost was set to $0/MWh in accordance with rooftop. Photo: Simon Färegård.
the same model (EIA, 2016, p. 11). The technology’s
operation lifetime was set to 30 years (IRENA, 2018c). The cost trend for the solar PV capital
cost was assumed to continue in line with the 32 % decrease between 2013 and 2017 in South
Africa, resulting in an annual decrease of 9,19 %, see equation (1) (IRENA, 2018b, p. 72).
To see the capital cost for each year between 2020-2040, see Appendix 3.1.

 Figure 11. Capacity factor for solar PV each month of the year in El Alamein 2014.
 [Data collected from https://www.renewables.ninja/].

 16
The average capacity factor was set to 17,6 %, i.e. the global average for utility scale PV systems
in 2017 (IRENA, 2018b, p. 66). By taking the change in electricity production between days and
nights, as well as the change in capacity factor between seasons into account, the capacity factor
for each time slice was identified. The monthly change in capacity factor was obtained from
Renewables Ninja with the default inputs for solar PV in El Alamein 2014, by calculating the
difference in percentage between the yearly mean value and the value each month. This
percentage increase or decrease from the average value was then applied to the previously
mentioned average capacity factor, 17,6 %, resulting in a more realistic average capacity factor
for each month, see Figure 11.

To distribute the monthly capacity factor between day and night, the production for each time
slice during 2014 from El Alamein was summarized using Solar PV data from Renewables
Ninja. To get the fraction of production during night or day, the production during these periods
were summarized and divided by the months total production. This value was then multiplied
by two, to account for the time difference between the two production periods. Finally, the value
was multiplied by the monthly average capacity factor as presented in the following equation

 = / ℎ ∗ ℎ , ∗ 2. (3)

The capacity factors for each time slice is presented in Appendix 3.2. Finally, the area utilized
by solar PV was based on Fraunhofer’s predication for Germany. The prediction stated that 200
GW of solar PV’s will require an area of 1000 km2, with an efficiency of 19 % assumed for the
panels. This results in the installed capacity per area being 0,2 kW/m2 (Wirth, 2019, p. 39). All
initial parameters for 2020 that are presented in the paragraphs above are gathered in Table 2.

 Table 2. Input parameters for solar PV in the initial year of 2020 in OSeMOSYS

 Input parameters for 2020 Solar PV

 Capital Cost ($/MW) 1 500 000

 Fixed O&M Cost ($/MW-year) 23 400

 Variable O&M Cost ($/MWh) 0

 Operational Life (years) 30

 Average Capacity Factor (%) 17,6

 17
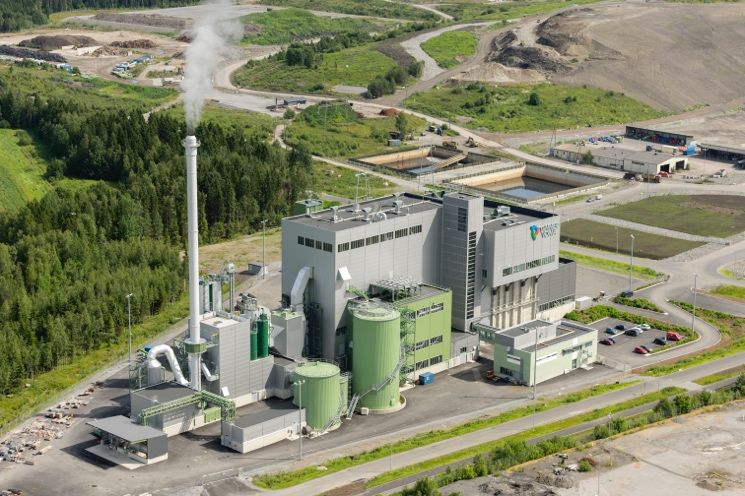
6.3 Waste to Energy plant
 There are different methods used when
 harnessing energy from biowaste, this
 project focused on the method of burning
 waste to generate electricity. The
 biowaste is burned to produce heat which
 evaporates water in a boiler to produce
 steam. The steam then travels through a
 steam turbine which transfers
 mechanical energy to a generator who
 then generates electricity (EIA, 2018).
 The emissions from burning biowaste
Figure 12. Photo of a Waste to Energy plant. [Source: ÅF].
 mainly consist of carbon dioxide but the
biowaste is seen as a renewable energy source when burned, with net zero emissions since the
CO2 emitted is the same amount captured by the bio-waste, i.e. no new emissions are introduced
to the atmosphere. The other emissions for the combustion such as SOx are assumed to be
removed by scrubbers, a flue gas cleaning method (Udomstri, 2011, p.12). Since there were no
plans for agriculture in El Alamein, the biowaste needed for the process only derived from
municipal solid waste.

A majority of the parameters needed for the OSeMOSYS model for the waste to energy plant
were taken from an assessment regarding the prospects of using biomass to produce electricity
published by the United States Department of Agriculture. The capital cost was $3,860
million/MW and the variable O&M cost, assuming that the waste provided to the plant was
supplied for free, was $5/MWh. The fixed O&M cost was $110 000/MW-year and the
operational lifetime was set to 20 years (Nderitu, et al., 2014). No major trend regarding a change
in price for electricity produced by biomass was identified between 2010 and 2017 by IRENA
(2018b, pp. 34-35). Therefore, the capital cost and variable O&M cost was selected to remain
the same from 2020 to 2040. Using the same capacity factor for the biomass plant as for a coal
power plant resulted in it being 85 % (EIA, 2016, p. 41; Nderitu, et al., 2014). The efficiency of
electricity production from the incineration process was set to 25 %, since only the electricity
production was taken into account (Batool, et al., 2016). All initial parameters for 2020 that are
presented in the paragraphs above are gathered in Table 3.

 Table 3. Input parameters for waste to energy plant in the initial year of 2020 in OSeMOSYS

 Input parameters for 2020 Waste to Energy plant

 Capital Cost ($/MW) 3 860 000

 Fixed O&M Cost ($/MW-year) 110 000

 Variable O&M Cost ($/MWh) 5

 Operational Life (years) 20

 Average Capacity Factor (%) 85

 18
You can also read