Renewable and Sustainable Energy Reviews
←
→
Page content transcription
If your browser does not render page correctly, please read the page content below
Renewable and Sustainable Energy Reviews 145 (2021) 111083
Contents lists available at ScienceDirect
Renewable and Sustainable Energy Reviews
journal homepage: http://www.elsevier.com/locate/rser
Feasibility assessment of renewable energy resources for tea plantation and
industry in India - A review
K. Ravi Kumar a, *, Kavya Dashora b, Naveen Krishnan a, S. Sanyal d, Hukum Chandra e,
S. Dharmaraja c, Vandita Kumari e
a
Centre for Energy Studies, Indian Institute of Technology Delhi, New Delhi, 110 016, India
b
Centre for Rural Development and Technology, Indian Institute of Technology Delhi, New Delhi, 110 016, India
c
Department of Mathematics, Indian Institute of Technology Delhi, New Delhi, 110 016, India
d
Tocklai Tea Research Institute, Tea Research Association, Jorhat, Assam, 785 005, India
e
Indian Agricultural Statistics Research Institute, New Delhi, 110012, India
A R T I C L E I N F O A B S T R A C T
Keywords: In tea production, India ranks second largest in the world, after China. Indian tea industry is one of the largest in
Tea industry the world and with over 13,000 gardens and produces 1350 million kg of tea leaves. Tea production and pro
Renewable energy technologies cessing require electrical and thermal energy in various processes such as irrigation, withering, rolling,
Biomass
fermentation, drying, sorting/grading, and packaging. To produce one kg of tea requires thermal and electrical
Solar PV
Wind turbine
energy in the range of 4.45–6.84 kWh and 0.4–0.7 kWh respectively. In tea gardens, diesel generators are
Micro-hydro commonly used for irrigational needs in off-grid areas. In tea industry, fossil fuels such as coal, low sulphur diesel
are mostly used to encounter the thermal energy needs and these energy sources heavily pollute the environ
ment. This is a serious cause of concern for all including national and international agencies. These conventional
fuels may be replaced by suitable renewable energy resources to meet the energy demand of tea plantations and
industries. The identification of suitable renewable energy technologies to satisfy the energy requirement of both
tea plantation and industry for north-eastern states and the southern part of India are reviewed extensively and
the technological barriers are delineated.
Electricity is required for the plantation as well as tea production. In
plantations, electricity is required for several agricultural practices
1. Introduction
mainly for irrigation and in the case of tea production, it is required to
operate the machinery. Thermal energy (heat) is required only in tea
India enjoys an ace position in the production of black tea. The
growth and production of tea have been reported higher than other industries for moisture removal from the tea leaves during withering and
drying. Tables 1 and 3 represent the comparative energy requirements
plantation crops in the country (Table 1). After water, the most sought
and consumed drink is tea [1]. Over the past decades, production and among the key plantation crops and it reveals that tea plantation crops
require the highest energy as compared to rubber and coffee. The tea
consumption of tea have increased steadily and its production became
one of the economic pillars of the countries like China, India, Sri Lanka, cultivation and industry require 0.679 kWh of electrical energy and
28.39 MJ of thermal energy for producing one kg of tea [5]. In tea
and Kenya [2]. An ever increasing energy demand and depletion of
non-renewable energy sources will shortly result in the reduction of plantations and industries, conventional fuels such as coal, diesel are
energy resources by 2030s–40s [3]. The major challenges that are used to meet their energy requirements and these energy sources pollute
related to the usage of conventional energy sources are the extent of the environment. These conventional fuels may be replaced by suitable
pollution, greenhouse gas emission in the environment, etc. The renewable energy resources to encounter the energy demand in tea
sector-wise emissions of greenhouse gas in the world during the years plantations and industries. The main objectives of this manuscript are to
1990–2015 are represented in Table 2. The major contribution of CO2 explore the feasibility of renewable energy sources to satisfy the energy
emissions is electricity and heat production areas as compared to requirement of tea plantations and industries, and challenges involved
manufacturing and other sectors [4]. in the implementation of the same.
* Corresponding author.
E-mail address: krk@ces.iitd.ac.in (K.R. Kumar).
https://doi.org/10.1016/j.rser.2021.111083
Received 12 July 2020; Received in revised form 30 March 2021; Accepted 5 April 2021
1364-0321/© 2021 Elsevier Ltd. All rights reserved.
K.R. Kumar et al. Renewable and Sustainable Energy Reviews 145 (2021) 111083
Nomenclature PV Photovoltaic
REPP Renewable Energy Power Plants
Abbreviations RPG Renewable Power Generator
AC Alternating Current SHP Small Hydro Power
C Cost
CFA Central Finance Assistance Superscripts
CTC Crush, Tear, Curl lt Life Time
DC Direct Current n No. of years
DPR Detailed Project Report Subscripts
DSI Detailed Survey & Investigation aux Auxiliary
FPO Farmer Producer Organisations Cap Capital
GDP Gross Domestic Product e Equivalent Discount Rate
HTF Heat Transfer Fluid eff Effective
ha Hectare FCap Fixed Capital
LCoE Levelised Cost of Electricity FOM Fixed Operational Maintenance
LF Levelising Factor LOM Levelised Operational and Maintenance
MPPT Maximum Power Point Tracking OM Operational and Maintenance
MT Metric Tonnes VOM Variable Operational Maintenance
NPV Net Present Value
PG Power Generation
Table 1 Table 3
Production of Rubber, Coffee and Tea in India (in million kg). Energy required for the production of plantation crops.
Year/Plantation crops 2015–2016 2016–2017 2017–2018 2018–2019 Types of crops Energy requirement for production
Rubber [6] 558.9 584.6 612 640 Electrical Energy (kWh/kg) Heat Energy (MJ/kg)
Coffee [7] 348 312 316 319.5
Rubber [9] 0.596 2.019
Tea [8] 1208.66 1267.36 1321.76 1338.63
Coffee [10] 0.264 27.78
Tea [5] 0.679 28.39
2. History of tea
gets affected if the average atmospheric temperature goes greater than
Tea (Camellia Sinensis) is native to China. Since pre-historic times, tea 26.6 ◦ C. The drought intensity does not affect productivity but the in
has been cultivated in that country. A legend from China named as Shen- crease in average temperature and global warming leads to a decrease in
Nung discovered the tea in 2732 BC, when the leaves from fierce tea the yield [12].
bush accidently dropped into boiling water in a vessel. Later, an indig
enous species of tea plant was discovered throughout the North-eastern
region of India and primarily in Assam. These species were propagated 2.1. Tea cultivation and production in India
throughout South East Asia. Tea was introduced in Java and India
around 1835 and cultivation in Sri Lanka began in the 1870s. Further, it India ranks second among the tea production countries across the
has spread from South East Asia to many tropical and sub-tropical re
gions in the world. Since 1891, Tea is a cash crop in Malawi, South Table 4
Africa. In 1920s, tea emerged as a profit-oriented plantation in East World tea production (in million kg) [14].
African countries namely Zimbabwe, Uganda, Kenya and Tanzania.
Country 2014 2015 2016 2017 2018
Also, tea is planted in the hilly areas of Mozambique, Zaire, Ethiopia,
and Cameroon and on the islands of Mauritius, and St. Helena. It is also China 2095.72 2249.00 2404.95 2496.41 2616.00
India 1207.31 1208.66 1267.36 1321.76 1338.63
planted in Papua, Fuji, South America, Pacific region of Australia, Iran, Kenya 445.11 399.21 473.01 439.86 493.00
Georgia, and Turkey in western Asia. Numerous livelihoods depend on Sri Lanka 338.03 328.96 292.57 307.72 304.01
tea cultivation and the production of tea plays a key economic role in Vietnam 175.00 170.00 180.00 175.00 163.00
countries like China, India, Sri Lanka, Kenya, and Bangladesh which Indonesia 144.37 132.62 137.02 134.00 131.00
Others 803.43 796.43 818.73 823.24 851.01
accounts for around 80% of world tea production [11]. In India, tea is an
Total 5208.97 5284.88 5573.64 5697.99 5896.65
important cash crop in north-eastern states. The productivity of the tea
Table 2
Sector-wise carbon dioxide emissions (CO2 equivalent) in the world over the years (MT) [4].
Year/ Electricity and heat Other energy Industry Transport Residential Commercial and Agriculture Fishing Final consumption not
Sector producers industries public services elsewhere specified
1990 7625 977 3959 4595 1832 774 398 18 342
1995 8169 1071 3943 5018 1848 727 402 18 192
2000 9364 1186 3882 5757 1827 705 340 19 158
2005 10979 1395 4945 6473 1898 783 397 24 181
2010 12527 1634 6102 6992 1886 815 394 22 199
2015 13405 1653 6361 7702 1850 832 413 20 195
2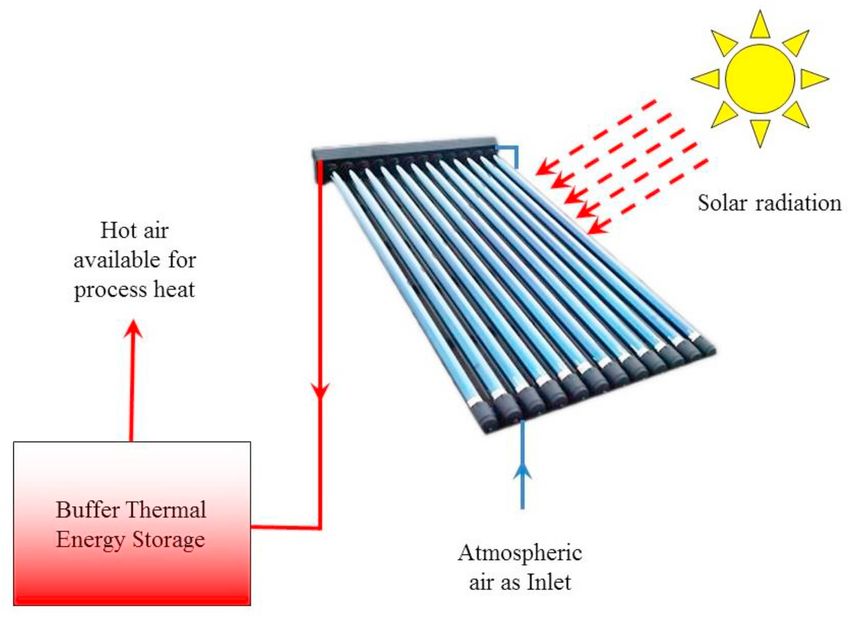
K.R. Kumar et al. Renewable and Sustainable Energy Reviews 145 (2021) 111083
World as illustrated in Table 4. Tea is a cash crop and is usually grown in with saw toothed blades that crush, tear, and curl the tea into small,
moderately hot and humid climate. Tea contributes about 1% of GDP even-shaped mass. The operating temperature and moisture content of
and its growth in different parts of the country is depicted in Fig. 1 [13]. each process maintained in CTC tea manufacturing process are listed in
Dark green regions in Fig. 1 show high production area and light green Table 6. The processing steps consume both thermal (heat) and electrical
regions show low production area. Assam is the single largest energy. Withering and drying processes consume heat and in almost all
tea-growing state in the world producing 57% of India’s tea production stages of processing, electrical energy is required.
and providing one of the finest black tea in the World. Tea industries
provide sectoral employment in remote and rural areas. The tea culti 3. Tea industries in India: current trends and future perspectives
vation covers 636,557 ha, that consists of both big and small growers
across India, as represented in Table 5. Globally tea is growing in over 35 countries and India holds second
The tea production involves the preparation of seed nursery for position in the tea production [16]. It is apparent from Tables 7 and 8,
growing new tea bushes, cultivation and agricultural practices, pruning the export of tea from India progressively increasing every year. In India,
and plucking, etc. These processes are energy consuming in the form of 85% of households are consuming tea and 27% of tea consumed across
manpower. The irrigation for tea bushes is one of the major causes for the world is produced by Indian tea industries. In India, people consume
the utilization of fossil fuels in the tea plantation. Diesel pump set is used 75% of the tea produced in India. Recent facts on the tea industry show
for irrigation in off-grid areas. The post-harvest processing for black tea that export was increased by 5.7% in 2017 [17]. Assam ranked first
involves withering, rolling, fermentation, drying, sorting/grading, and which contributes more than 50% of tea production in India. The tea
packing. In India, most of the factories are manufacturing tea by Crush, industry employs more than 6.85 lakh people in Assam and it contrib
Tear and Curl (CTC) method. CTC is a method of preparing black tea in utes as the major economic status to the state [18]. The growth rate of
which tea leaves are moved through a sequence of cylindrical rollers industries in Assam decreases due to rising in the production cost and a
Fig. 1. Tea Growing States in India. (* Dark green regions show high production area and light green regions show low production area).
3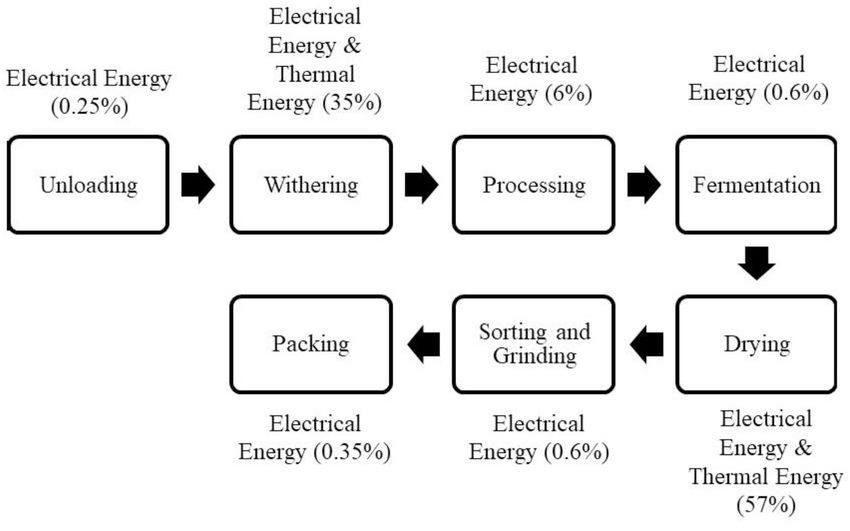
K.R. Kumar et al. Renewable and Sustainable Energy Reviews 145 (2021) 111083
Table 5
State-wise tea growers in India [9].
State Big Growers Small Growers Total
No. of Growers Area No. of Growers Area No. of Growers Area
(in ha) (in ha) (in ha)
Assam 765 232399.35 101085 105291 101850 337690.35
West Bengal 451 114410.47 37365 33711.27 37816 148121.74
Others North India 111 11785.09 17513 38031.86 17624 49816.95
North India 1327 358594.91 155963 177034.13 157290 535629.04
Tamil Nadu 133 29600.56 45765 33284.57 45898 62885.13
Kerala 93 30303.42 8497 5567.74 8590 35871.16
Karnataka 16 2171.74 0 0 16 2171.74
South India 242 62075.72 54262 38852.31 54504 100928.03
Across India 1569 420670.63 210225 215886.44 211794 636557.07
Table 6 Table 7
Process parameters maintained in the CTC tea making process [15]. Trend of the tea industry in India [20].
Process Pre-Process Process Post process Year Area Production Export Employment
Order (in ha) (in million kg) (in Crore) (Avg. No. of
Labours)
1. • Green Leaf Withering: • Withered leaf
• Moisture • Moisture 1950–51 315656 278.212 80.42 948598
content • Time taken: 12–18 h content: 1960–61 330738 321.077 119.98 845166 (− 10.90)
>70% • Spreading over the trough 58%–62% (4.77) (15.40) (49.19)
30 kg/m2 1970–71 354133 418.517 149.80 759646 (− 10.11)
2. • Withered leaf CTC: • Wet dhool (7.07) (30.34) (24.84)
• Moisture • Moisture 1980–81 381086 569.172 432.54 846659 (11.45)
content: • Time taken: 15 min–20 min content: 60% (7.61) (35.99) (188.74)
58%–62% • Leaves are cut into pieces 1990–91 416269 720.338 1113.35 986781 (16.54)
and polyphenols/enzymes (9.23) (26.55) (157.39)
are coated over the leaf 2000–01 504366 846.922 1898.61 1210055 (22.62)
3. • Wet dhool Fermentation: • Wet dhool (21.16) (17.57) (70.53)
• Moisture • Moisture 2010–11 579353 966.400 3058.30 1259950 (4.12)
content: 60% • Time taken: 60–90 min content: (14.86) (14.10) (61.08)
• Oxidative reaction 56%–58% 2017–18 566660 1321.760 4987.59 1310348 (4.12)
facilitated by bacterial (− 2.19) (36.77) (63.08)
action and enzymes
4. • Wet dhool Drying: • Dry dhool *Values inside the bracket indicates that % of increase or decrease in comparison
• Moisture • Moisture with previous year.
content: • Time taken: 10–15 min content: 2%–
56%–58% • Bacteria are killed and 3%
fermentation is stopped Table 8
5. • Dry dhool Sorting/Grading: • Dry dhool Tea export in India [14].
• Moisture • Moisture
content: 2%– • Time taken: 12–15 min content: 2%– Year Quantity
3% • Separation of fibres and flake 3% (in million kg)
tea 2014 207.44
6. • Dry dhool Packing: • Dry dhool 2015 228.66
• Moisture • Moisture 2016 222.45
content: 2%– • Time taken: 30–60 s content: 2%– 2017 251.91
3% • Done to prevent moisture 3% 2018 256.06
absorption, contamination
and for easy transportation
resources and to minimize the cost of production.
fall in selling price [19]. The increase in energy demand due to mech
anization of several processes results in a persistent rise in the cost of the 4. Energy requirement in tea plantation and industry
tea production [20]. The compound growth rate of tea industry may be
given as: An energy audit was conducted in one of the tea industry in Kerala to
identify the types of energy and its requirement for the tea production
[ ]1
End Value n process. Energy is a key input to the tea manufacturing industries.
Compound Growth Rate = − 1 (1)
Initial Value Thermal energy is required to remove the moisture content from green
leaf especially in withering and drying processes and electrical energy is
The compound growth rate for tea production (million kgs) and
required in almost all the stages of operation. Withering and drying are
export of tea (crore) in India was found to increase by 2.5% and 4.3%
the energy intensive processes in tea production and consume most of
respectively for every year from Table 5. This clearly shows that there is
the energy in the form of heat. Since tea manufacturing is an energy
a continual increase in tea production in India.
intensive process, the required thermal and electrical energy is in the
In India, conventional fuel sources such as coal and diesel are used
ratio 85:15 [21]. The percentage of energy consumption in different
conventionally to generate heat for the tea industry processes. The in
processes of withering, processing, fermentation, drying, sifting and
crease in the cost of fossil fuels and the emission of greenhouse gases are
packing are shown in Fig. 2. More than 80% of thermal energy is
the major drawbacks. This also leads to an increase in the cost of tea
required for withering and drying [22]. Firewood and other biomass are
production. The future view of the tea industry in India is may be
also used for producing thermal energy in Southern India. Most of the
deploying renewable energy systems to mitigate the usage of fossil fuel
factories use state grid supply to full-fill the need for electricity and
4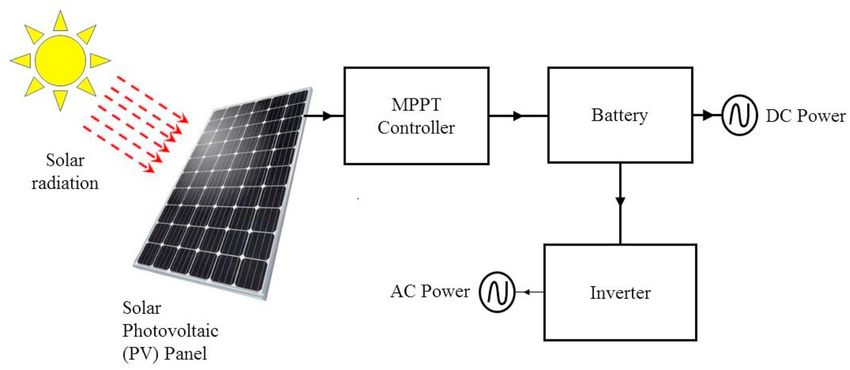
K.R. Kumar et al. Renewable and Sustainable Energy Reviews 145 (2021) 111083
Fig. 2. Process of energy flow in the tea industry.
diesel generator is used during blackout and power cut. For every kg of tea industry is from March to November, since from December to
tea production 3.5–6 kWh of thermal energy and 0.21–0.5 kWh of February is an off-season. In Southern India, the energy is required
electrical energy are required. The total energy required for the pro throughout the year, since it is a perennial crop. In Sri Lanka, the
duction of tea in different processes such as withering, rolling, fermen outcome of the assessment appears that wind energy has great potential
tation, drying, sorting/grading and packing is 0.46 kWh, 0.20 kWh, to meet the electrical energy demand in tea industries and also in
0.07 kWh, 0.09 kWh and 0.12 kWh respectively [21]. Another energy tegrates the additional electricity generated to the grid. The tea in
audit was performed in tea industry in North Bengal. The amount of dustries in Sri Lanka is one of the potentially energy consuming sectors
electrical and thermal energy consumption for 2014 and 2015 is shown from their national electricity grid. Therefore, it is a congested and
in Table 9. It shows that an extensive amount of coal is used for deficient to commercial sectors. The feasibility study was performed to
generating process heat in the tea industry. Coal is used in the tea in find out the optimal renewable energy technology to satisfy the energy
dustry to produce thermal energy for the processes of withering and demand in tea sector and even has the opportunity for selling the excess
drying [5]. electricity to the grid. Solar and biomass are one of the prominent
renewable energy sources in Sri Lanka as compared to hydro power.
5. Utilization of renewable energy sources for tea plantation and Since its investment cost is very high and not reliant throughout the year
tea industry for providing persistent energy [23]. In Indonesia, the heat pipe based
heat exchanger concepts were developed and tested for withering and
The usage of conventional fuels results in emission of the greenhouse drying process. The heat pipe heat exchanger comprises 42 pipes with
gases in the environment that leads to global warming. The cost of 181 fins attached to it. The length and outer diameter of the heat pipe
conventional fuels is also increasing day by day. To mitigate the usage of are 700 mm and 10 mm. The pipe is made up of copper and fin is made
conventional fuels, industrial sectors are forced to look for renewable up of aluminium with a thickness of 0.105 mm and the area of 26220 m2.
energy resources. Renewable energy resources such as solar, wind, Water was considered as HTF to utilize the heat from geothermal source.
hydro, and biomass may be utilized to meet the energy demand of tea The temperatures can be varied from 40 to 80 ◦ C with a mass flow rate of
plantations and industries. Suitable renewable technologies may be 18L/min. Mostly this type of heat is used for withering of tea leaves in
identified based on the availability of the resources, ability to fulfill the tea industry. The effectiveness of the system ranging from 66% to
necessity and economics. The energy requirements in tea plantations 79.59% and the thermal energy produced for 1 kg of tea leaves ranges
and industries vary throughout the year in both North-Eastern region from 0.15 to 0.45 kW. The withering of green tea leaves from 80%
and Southern India. The energy requirement for irrigation depends on moisture to 54% moisture takes around l2 hours [24]. Mcleod Russel is
the rainfall and weather conditions of the given location. In North- one of the leading tea producing companies in the world and its tea
Eastern region and Southern India, the monsoon period starts from estates spreads across the world is 25211 ha. In 2019, the company
June to October and the winter season starts from November to produces 6150 million kg of tea with 3% increment in production as
February. Hence, the irrigational requirements for both the locations are compared with previous years. They used to spend huge amount of their
from March to June. In North-Eastern region, the energy requirement for income on energy. Obviously, they are looking for an alternative which
reduces the production cost. In India, 870 g of CO2 gets emitted into
atmosphere per unit generation of electricity. Mcleod Russel invested in
Table 9
solar energy especially in Solar PV to generate electricity for domestic
Electricity and coal consumption in tea industry [5].
needs. A 100 kW solar PV plant was erected at Attareekhat tea estate in
Parameters 2014 2015 Average India. It consists of 400 solar PV panels with each capacity of 250
Value
W/module, Neo Watt Sunbird 3000 inverter system and 240 lead acid
Total tea production (in kg) 2682726 2532494 – batteries with a output of 480 V. With this small initiative, the company
Total Electricity consumption (kWh/kg of 0.679 0.636 0.657 is looking for huge investment in the future to meet the electrical energy
made tea)
Total coal consumption (kg of coal/kg of 0.872 0.830 0.851
demand [25]. Recently, the solar power plant of 3 MW capacity was
made tea) built at Madurai District, Tamil Nadu to supply the generated electricity
5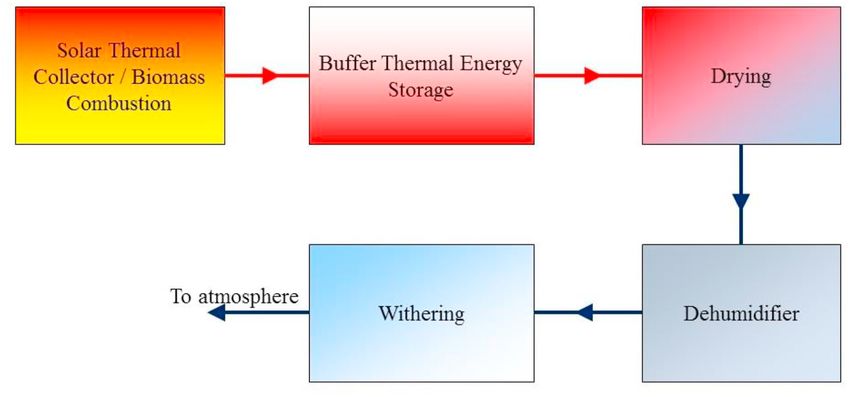
K.R. Kumar et al. Renewable and Sustainable Energy Reviews 145 (2021) 111083
to The Peria Karamalai Tea & Produce Company Limited. The surplus tea waste data collected for six years from 2008 to 2013 in various lo
electricity available from the power plant is connected to the grid. The cations at Assam are shown in Fig. 4. Based on the details given in
power plant is spread across 26 acres consisting of 9332 solar PV Tables 10–12, the biomass potential in tea plantation and industry is
modules. The annual power production from this power plant is 4.5 calculated as ~3.504 × 10¹⁰ kWh. By considering the least conversion
million units. This company also erected the wind farms in early 2000. efficiency of biomass to thermal energy is 52%, the availability of
The capacity of the wind farm is 2.3 MW (400 kW–1; 250 kW–3; 225 thermal energy is estimated as 1.822 × 10¹⁰ kWh [32]. Hence, it ac
kW–5) and occupied a land area of 32 acres. The power generation in the counts for 59% of the thermal energy requirement of the tea industries
last 20 years is estimated as 95 GWhr [26]. The Xishuangbanna tea [33].
garden, China installed the solar PV plant of 51 MW capacity. The Solar The energy potential of tea waste from industry and garden is esti
PV panels are mounted above the tea shrubs and it does not affect the mated to be 4.47 × 10⁷ kWh and 1.86 × 10¹⁰ kWh respectively in 2013.
growth of tea and make effective use of land. This plant consists of 197, The comprehensive energy utilization in the tea industry was estimated
800 dual glass solar PV modules and the annual production is estimated as 2.24 × 10⁹ kWh [34]. The least energy conversion efficiency of
as 80,000 MWh. Also, it mitigates the emission of 80,000 tonnes of CO2 biomass to electrical energy was taken as 25% [29]. Based on the energy
into the atmosphere [27]. In 2011, the installed capacity of the small demand and available bio-energy potential, it is estimated that 83% of
hydro power plants in Kenya is 31 MW. The Kenya Tea Development energy could be supplemented by biomass waste from the tea industry
Authority and private tea estates such as James Finlay and Brooke Bond [34].
own 11% of the small hydro power plants to complement the electrical A survey and analysis of prospects of bioenergy potentials and their
energy requirements in tea industries. After their successful imple usage for tea industries were conducted in the Northeast region in India.
mentation in 2011, the Kenya Tea Development Authority planned to Based on the study, it was found that using bamboo as feed material for
install more small hydro power plants of 21 MW capacity [28]. These are the gasification process, a supplement to process heat and electricity
all some of the initiatives taken by the tea plantations and industries to could save $1771.18 per year. Assessment was performed on the paddy
utilize the renewable energy resources in their vicinity. In this section, fields nearby tea industries. If tea industries could use paddy straw by
details of various renewable energy technologies and their importance direct firing system would save $14431.90 and also it could save the
to meet the demand for electrical and thermal energy in tea plantations usage of diesel by 20% could save $196.78 [35]. The energy consumed
and industries are discussed. at different stages of tea production processes in industries at Assam was
calculated for 100 kg are shown in Fig. 5. It is vivid that drying
5.1. Utilization of biomass for heat requirement in tea plantation and consumed the maximum thermal energy and the production cost of
industry thermal energy is about $0.10. The thermal energy of 49.75 kWh and
497.53 kWh respectively are required for withering and drying process
In tea plantations and industries, there are three different types of and electrical energy of 5.54, 8.63, 6.23 and 3.95 kWh are required for
biomass wastes, namely shade tree waste, garden waste, and tea waste withering, maceration, drying and grading process respectively [36]. In
from industry. Biomass can be converted into heat and electricity by Sonitpur district (Assam, India) a lab scale experiment was conducted
using various conversion techniques. There are four ways to convert with hybrid renewable energy system which constitutes the solar air
biomass into useful energy and as shown in Fig. 3. Biomass can be heater and biomass gasifier. The results showed that it assisted the
converted into gaseous fuels such as methane, hydrogen, and carbon conventional drying system in the tea industry by reducing the usage of
monoxide and liquid fuels such as ethanol and methanol. Biomass fossil fuels and emission of the CO2 into the atmosphere. The solar air
cogeneration is the modern technology to produce heat as well as heater contributes to the heating system during day time from 9:00 a.m.
electricity by employing a gas turbine that drives the generator which to 2:00 p.m. for a sunny day and producer gas is yielded from various
produces electricity. The waste heat from the turbine is utilized by biomass such as Indian timbers, branches of shade trees and waste from
placing a heat exchanger to produce the hot air to supplement the en tea plants. The payback time for the hybrid renewable energy system
ergy demand of withering and drying. Cogenerators may tend to was around one and half years [37]. The Kenyan tea development
improve the energy usage by 80% and achieves 33–38% efficiency for agency constitutes 5 lakh small growers and 66 tea factories. The chal
electricity generation only. The cogenerators utilize 15–35% of less fuel lenges in Kenyan tea industries are high production costs, variations in
to produce the same amount of electricity and heat as compared with the market prices, persistent change in weather and spending more cost on
conventional method [29]. energy. The continual increase in oil prices forces tea industries to use
Biomass energy conversion techniques have certain demerits firewood for thermal production demand. Energy consumption impacts
because of variations in the raw material (size, mass, and energy den negatively in Kenyan tea industries. Since most of the money from the
sity), moisture content, and intermittent supply. To overcome this revenue was spent on electricity and firewood. Kenyan tea industries
drawback, hybrid biomass/fossil fuels may be used in which fossil fuels normally use 50 lakh kg of firewood to produce 432.4 million kgs of tea
may be used to provide the required heat during intermittent supply
[30]. The most conventional method of obtaining heat from biomass is
combustion. The chemical energy of biomass is converted into heat by a
Annual Industrial Tea Waste
series of chemical reactions when the biomass is burnt. The efficiency of
the combustion process depends on the biomass and amount of oxygen
in the air supplied for the combustion [31].
(million kg)
The total bioenergy potential is the sum of biomass waste from the
field, shade tree, and processed waste from the industry. The industrial
Year
Fig. 3. Primary thermochemical conversion process of biomass [29]. Fig. 4. Trend of industrial tea waste from 2008 to 2013 [34].
6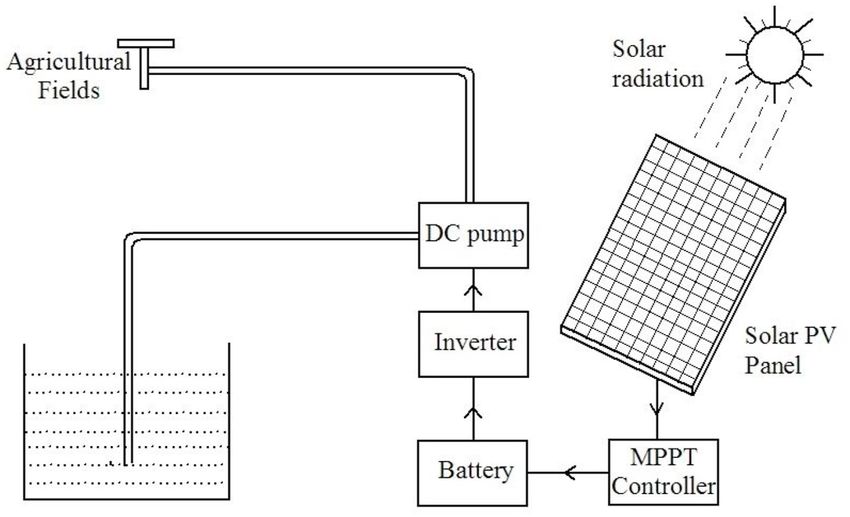
K.R. Kumar et al. Renewable and Sustainable Energy Reviews 145 (2021) 111083
Table 10 5.2. Utilization of solar energy for heat and electricity requirement in tea
Energy availability of garden tea bush waste. plantation and industry
Parameters Value
As discussed earlier, electricity is required for irrigation in tea
Area of Tea plantation in India, 2014–2015 (in ha) 563980
Spacing between rows (in m) 1.05 plantations and to operate the machinery in most of the operations in tea
Spacing between bushes (in m) 0.70 industries. Thermal energy (heat) is required for withering and drying
Area of the bush (m2) 1.05 × 0.70 = 0.735 processes in the tea industry. The electricity may be produced using
Bush/area (ha) 13605 solar photovoltaic (PV) systems and heat may be produced using solar
No. of bushes 7.7 × 10⁹
Field waste/bush/year (wet matter basis) (kg) 2.5
thermal collectors.
Field waste/bush/per year (dry matter basis) (kg) 1.05
Total field waste (dry matter basis) (kg) 8.085 × 10⁹ 5.2.1. Solar thermal collectors: heat demand
Calorific value/kg of garden tea waste (kWh/kg) 4.302 In solar thermal collectors, the solar irradiation incident on the
Total energy production from garden tea waste (kWh) 3.478 × 10¹⁰
absorber surface is converted into heat and it is transferred to the
working fluid (heat transfer fluid). The heat carried by the heat transfer
fluid (HTF) can be used to meet the energy demand in the withering and
Table 11 drying processes. The different types of solar thermal collectors and
Energy availability of industrial tea waste. their indicative temperatures are represented in Table 13. The thermal
Parameters Value energy requirement in the withering and drying processes could be meet
Annual tea production in India, 2014–2015 (in million kg) 1197
out by the solar thermal collector. The specific thermal energy con
Industrial processed waste (in million kg) 23.94 sumption for withering is 5.6 MJ/kg at 35 ◦ C and drying is 11 MJ/kg in
Calorific value (kWh/kg) 5.012 the range of 90 ◦ C - 160 ◦ C. To supplement the thermal energy
Energy potential (kWh) 11.999 × 10⁷ requirement, a study was conducted by using flat plate solar collectors.
The results revealed that 25–34% of fuel could be saved in the drying
to supply the essential thermal energy for withering and drying process. process and it could be used for re-firing of graded tea without an
Later, the briquetting techniques were developed to enhance the com auxiliary source [39]. An experimental study on the drying of green tea
bustion efficiency. The moisture content of less than 15% is used as raw leaves was conducted with the help of a solar-assisted drying system.
materials for making briquettes. In case the boilers in tea industry run on The moisture content of freshly plucked tea leaves was 87% and it has to
50:50 ratio of briquetted wood and firewood, it resulted in 25% saving be reduced to 54%. The flow rate of air was fixed at 15.1 m3/min and
in cost of firewood procurement. The firewood in tea industry is auxiliary heater was used as additional support to ensure that the inlet
completely replaced by briquetted wood, it would result in 50% savings temperature does not allow it to fall below 50 ◦ C. Under clear sky
in production cost. The cost of one kg of firewood is $0.1 and briquetted conditions with the mean solar radiation value of 567.4 W/m2 and an
wood is $0.05 [38]. ambient temperature of 27–34 ◦ C could able to maintain the tempera
ture of air in drying chamber in the range of 55–60 ◦ C and the drying
system was operated for 12 h a day. This contributes 56.3% of the
Table 12 thermal energy requirement in the tea industry [40].
Energy availability of shade tree waste. Based on the design of the solar thermal collector, it produces excess
Parameters Value heat during noontime due to higher solar insolation as compared to the
Total tea plantation area in India (ha) 563980 demand of the withering and drying processes. The excess heat collected
Shade/cover tree/area (m2) 13.7 × 13.7 = 187.69 (medium from the solar thermal collector may be stored in the buffer thermal
covering, square) energy storage unit and it can be used during cloudy and non-sunshine
Cover tree/area (ha) 54 hours. The different types of thermal energy storage are depicted in
Cover tree waste/tree/year (dry matter 5
Fig. 6. A roof-integrated solar collector and storage unit was developed
basis) (kg)
Total Cover tree waste (dry matter basis) 3.0455 × 10⁷ and examined. During day time, a solar thermal collector is used to
(kg) deliver the hot air and excess heat is stored in the storage unit. During
Calorific value/kg of cover tree waste 4.555 cloudy or at night time, the heat stored in the storage unit was used to
(kWh/kg)
meet the process heat demand [41]. The schematic diagram of the in
Total energy production from cover tree 1.387 × 10⁸
waste (kWh)
tegrated solar heating system with the storage unit is shown in Fig. 7.
Low temperature sensible heat storage or latent heat storage system may
Table 13
Types of solar thermal collectors.
Configuration Collector Absorber Concentration Indicative
Power Conumed (kWh)
Type Type Ratio Temperature
Range (◦ C)
Stationary Flat plate Flat 1 30–90
collector
Evacuated Tubular 1 50–160
tube collector
Compound Tubular 1–5 60–240
parabolic
concentrator
Single Axis Parabolic Tubular 60–90 60–390
trough
Linear Fresnel Tubular 50–170 150–450
Two-axis Parabolic dish Point 100–1000 100–900
Process
tracking Central Point 100–1000 300–900
receiver
Fig. 5. Power consumption versus Process [36].
7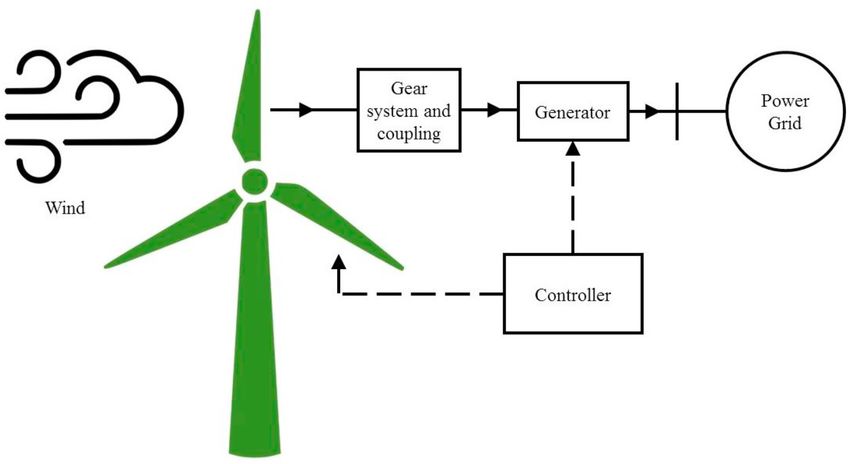
K.R. Kumar et al. Renewable and Sustainable Energy Reviews 145 (2021) 111083
pebble bed, hot water storage, compressed hot air storage, and other
sensible heat storage techniques.
5.2.2. Solar photovoltaic system: electricity demand
In the solar photovoltaic (PV) system, the PV panel converts the
incident solar irradiation directly into DC electricity [41]. The charger
controller is used to draw out the power produced from the PV panel and
send it to the battery followed by an inverter. The inverter is used to
convert the DC electricity from battery to AC electricity for end use
applications in tea gardens and industries [39]. The electricity produc
Fig. 6. Classifications of thermal energy storage [43].
tion from the Solar PV system is illustrated in Fig. 8. In off-grid areas, the
irrigational requirement could be met out by deploying a suitable solar
PV water pumping system. This could save the requirement of fossil fuels
be preferred as a storage unit due to its low cost and high storage density
for diesel pump set in tea estates.
[42].
Solar water pumping works with the aid of PV panels that converts
The thermal energy required for withering and drying could be
turns light energy into electrical energy to pump the water. The elec
accomplished by the evacuated tube solar thermal collector and it could
tricity produced from PV panels is supplied to a DC or AC motor that lifts
deliver the outlet temperature in the range of 90 ◦ C to 160 ◦ C. Consid
the water from the well for irrigation. The three parameters namely
ering the mean sunshine radiation is 7–8 h per day and the thermal
power, flow, and pressure are used to set the size of the solar pump. The
energy could able to supply during off time by thermal energy storage
elevation difference between the water source and the tea field de
techniques. The most preferred methods for storing thermal energy are
termines the work to be done by the pump [44]. The schematic diagram
Fig. 7. Solar heating system with thermal energy storage [39].
Fig. 8. Schematic solar PV system for electricity production [43].
8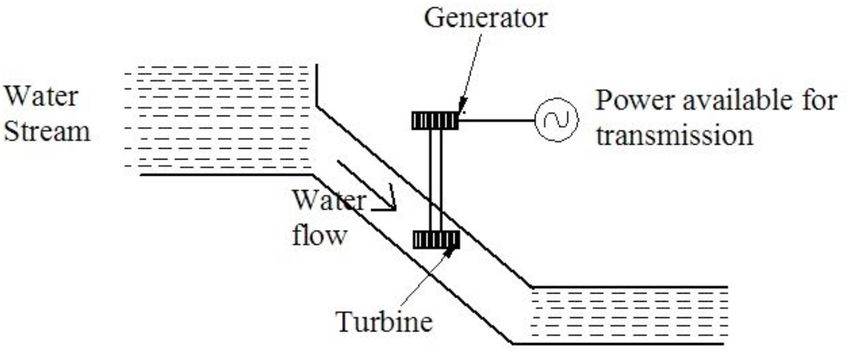
K.R. Kumar et al. Renewable and Sustainable Energy Reviews 145 (2021) 111083
of solar water pumping with maximum power point tracker (MPPT) is transmission of produced power to the end use applications/electricity
shown in Fig. 9. grid [51].
Micro-hydro technology is a potential technique to harness the hydro
5.3. Employment of wind energy system for electricity requirement in tea energy available in smaller capacity i.e. Small rivers, streams, etc. It does
garden and industry not require a large reservoir to rotate the turbine. The output power of
the turbine depends upon the head and water flow rate. The choice of
The uneven heating of atmosphere causes the temperature gradient turbine mainly depends on the pressure head and water flow rate. The
at the earth’s surface which results in the flow of air or formation of impulse turbine is suitable for high head and low flow rate. Reaction
wind. The kinetic energy of the wind gets converted into mechanical turbine is suitable for medium and low head and high flow rate [53,54].
energy using blades, thus rotates the rotor. The rotor is connected to the The classification of turbines used in the hydropower plant is depicted in
gearbox through a shaft and gearbox is connected to a generator to Fig. 13. The reaction turbines are the most commonly used in micro
produce electricity. The block diagram of the wind turbine energy hydropower plants [55]. If there is a resource of hydro energy near the
generation system is shown in Fig. 10. tea garden, then micro-hydro power generation may be explored to meet
A comparative study is conducted on different sizes of windmills 150, the energy demand of tea garden and industry.
250 and 600 kW in different hub heights of 20, 30, 40, 50 and 60 m. The
cost of electricity was found to be 0.044 $/kWh, 0.042 $/kWh and 0.039 5.5. Economic analysis of conventional and renewable energy systems for
$/kWh respectively for 150, 250, and 600 kW wind turbines at 50 m hub tea production
height. The capacity factor of the wind turbine was varying between 28
and 45% and it is high for smaller wind machines as compared with The investigation of economics of the conventional and renewable
larger wind machines [46]. Wind energy is a promising source if exact energy systems such as solar PV, wind turbine, and micro hydropower
site selection would be made. Even in places with low potential of wind, plant for generating electricity with a fixed output of 150 kW is given
once the exact location could have been identified to install the wind below Table 14. The economic investigation of biomass and solar ther
turbine, and then wind energy would be harvested in a profitable mal are not discussed in this chapter, because both of them are used to
manner [47]. The feasibility study of the installation of a wind turbine at provide only thermal energy requirements for the tea industry.
different altitudes of wind speed was conducted. The levelised cost of The levelised cost of electricity (LCoE) is given as [56]:
electricity (LCoE) and net present value (NPV) were found to be 0.0618 LCoE = CFCap + CLOM (2)
$/kWh and 0.0786 $/kWh respectively. The study concludes that a wind
farm composed of 10 units of each 5 MW wind machine could save The fixed capital cost (CFCap) is given as:
emissions of 31876 tonnes of CO2 per year [48]. It is clear from Fig. 11, CCap
the tea industries in Southern India at an altitude of 50 m, have the CFCap = (3)
PGeff
possibility of harnessing wind energy. The exploration and employment
of wind energy nearby tea gardens could be a supplement or fulfill the Effective power generation (PGeff) is given as:
electricity need in the tea garden and industry. PGeff = PGgross − PCaux (4)
The levelised operational and maintenance (O & M) cost (CLOM) is
5.4. Exertion of hydro power plant for electricity requirement in tea
given as:
plantation and industry
CLOM = LF(CFOM + CVOM ) (5)
In hydropower plants, the potential energy of the water is converted
The levelising factor (LF) is given by:
into electrical energy. The schematic diagram of this hydropower plant
[ ] [ ]
is shown in Fig. 12. Micro hydropower plants are suitable for producing (1 + ie )lt − 1 i(1 + i)lt
power up to 200 kW in the remote areas where the electric grid is not LF = (6)
ie (1 + ie )lt (1 + i)lt − 1
available. There are a lot of potential areas in the hill station, canals are
flowing with minimal height. The micro hydropower plant is suitable for where d is the discount rate and de is the equivalent discount rate with
small scale industries located in remote areas [50]. The main advantage escalation.
of having a micro hydropower plant is providing better efficiency as
compared with other renewable energy technologies of the same size. de =
(d − e)
(7)
The variation of hydro energy sources is easily predictable. The main (1 + e)
limitation of installing a micro hydropower plant is the site selection and The fixed O & M (CFOM) is given as:
COM
CFOM = (8)
PGgross
The variable O & M (CVOM) includes the additional O & M cost other
than the fixed O & M and it is given as:
CVOM = 0.1CFOM (9)
The LCoE for Solar PV, Wind Turbine and Hydro Turbine are
calculated as per norms given by Central Electricity Regulatory Com
mission of India. It is vivid from Table 14, the existing energy sources
such as grid electricity, natural gas and diesel generator demands more
cost for electricity generation per unit (kWh) as compared to renewable
energy resources. Hence the deployment of renewable energy may
decrease the cost of electricity generation considerably.
Fig. 9. Solar water pumping with MPPT system.
9
K.R. Kumar et al.                                                               Renewable and Sustainable Energy Reviews 145 (2021) 111083

                        Fig. 10. Block diagram of the wind turbine system [45].

                    Fig. 11. Wind power potential in tea growing states in India [49].

                                                    10
K.R. Kumar et al. Renewable and Sustainable Energy Reviews 145 (2021) 111083
[60]. The harvested biomass should be stored under shed to protect it
from rain, storms, and termites. Otherwise, it is subjected to biological
decomposition and the content of biomass gets affected adversely. The
moisture content of the stored biomass should be less than 30% for
making pellets. The pre-processing of biomass before getting into the
combustion chamber is also an energy intensive process. Raw feeding of
biomass into the combustion chamber causes slag and formation of ash
which stick on the heat transfer tube surface and results in higher
thermal resistance. To avoid this, briquetting has been reported as an
effective method in the pre-processing of biomass. It consumes thermal
energy for drying. The moisture content in briquetted biomass leads to
Fig. 12. Schematic of hydropower plant [52]. proficiency hindrance in combustion and more ash formation [61].
6.2. Challenges in solar energy systems for heat and electricity generation
The solar irradiance for the Golaghat and Munnar is shown in
Figs. 14 and 15. In North-eastern region, factory off-season starts from
December to February. Once the main growing period is over in
November, the bushes have been given some time to build starch
themselves. The Golaghat receives solar irradiance above 600 W/m2
during solar noon, except in January and December. Hence, the
deployment of Solar PV in Golaghat does not provide the energy inter
ruption in working season. From Fig. 15, it is clear that Munnar has a
good potential of solar irradiance (above 600 W/m2) during the solar
noon in all months. So, the deployment of Solar PV in Munnar could be a
good alternative energy source for grid electricity in tea manufacturing
industry.
6.2.1. Challenges in solar thermal collectors for heat generation
The process of heat generation for industrial requirements could be
accomplished by deploying suitable solar thermal collectors. Among the
solar thermal collectors, to meet the energy demand of the withering and
drying processes, the evacuated tube solar collector is more suitable in
Fig. 13. Classifications of turbines for hydropower plants [55]. terms of temperature requirement and economics. Since solar energy is
diffused in nature (low energy intensity as compared to fossil fuels), it
6. Practical barriers in utilization of renewable energy sources requires a large space to deploy and become feasible [62]. The diurnal
and stochastic nature of solar energy is a major drawback. To mitigate
There are many practical barriers to utilizing renewable energy these issues, thermal energy storage is needed to satisfy the thermal
sources in the tea industry. For a modern tea industry, environmental needs during cloudy and night time. The thermal energy storage system
protection is a major problem. From the literature review, arbitrary helps to capture excess energy during noontime and leads to an
locations in the northeast and southern India are considered as Gola improvement in overall system efficiency. However, the thermal energy
ghat, Assam (Latitude: 26.55◦ N, Longitude: 93.95◦ E) and Munnar in storage system needs additional capital cost to implement the same [63].
Kerala (Latitude: 24.25◦ N, Longitude: 76.85◦ E) for the analysis of
renewable potential throughout the year. The detailed discussion on 6.2.2. Challenges in solar PV power generation
practical difficulties in the utilization of renewable energy sources in tea The power output from the solar PV system is not uniform due to the
plantations and industries are presented in this section. fluctuation in solar irradiation. It strongly depends upon the metrolog
ical conditions. The main drawback of using the solar PV integrated with
battery and inverter is their efficiency as compared with the conven
6.1. Challenges in direct fired biomass combustion for heat generation tional power plants. The efficiency ranges from 3 to 7% and usage of
charge controller prevents the battery from overheating [64]. Another
Biomass is abundantly available in tea gardens and industries. Poor difficulty of Solar PV is that it is not able to give an immediate response
collection, lack of automobiles for transportation, and improper segre to load demand [65]. The Solar PV is not able to generate power until
gation of tea leaves cause the interruption in the chain supply. This the faulty component gets replaced/repaired [66]. High initial invest
creates a barrier in utilizing the energy from biomass [59]. The har ment and lack of knowledge about the policies and schemes provided by
vesting and transportation of biomass is an energy intensive process the government among people is also a hindrance in Solar PV
Table 14
Cost comparison of grid electricity, natural gas, diesel power plants and renewable energy sources such as solar PV, wind, micro-hydro power plants.
Energy Source Capital Cost ($/kW) Operational and Maintenance Cost ($/kW/ Life Time (Years) Discount rate (%) Levelised Cost of Electricity ($/kWh)
Year)
Grid Electricity [57] – – – – 0.337
Natural Gas Generator 36486 1805.79 5 7 0.198
Diesel Generator 33375 2271.21 5 6 0.396
Solar PV [58] 104646 8 20 4 0.039
Wind Mill [58] 158250 40 20 6 0.074
Micro Hydro [58] 197446 47.38 35 8 0.041
11K.R. Kumar et al. Renewable and Sustainable Energy Reviews 145 (2021) 111083
January February March April
May June July August
September October November December
Fig. 14. Solar irradiance in Golaghat, Assam, India [x-axis represents the time in hrs; y-axis represents the solar irradiance data in W/m2] [74].
January February March April
May June July August
September October November December
Fig. 15. Solar irradiance in Munnar, Kerala, India [x-axis represents the time in hrs; y-axis represents the solar irradiance data in W/m2] [74].
deployment. The PV panel and batteries come under e-waste after their 6.3. Challenges in wind power generation
lifetime. The disposal and processing of e-waste is a tough task and it
adds impacts to the environment [67]. The challenges in wind power generation are appropriate site se
lection, fluctuation in wind speed, and economics of wind turbines for
smaller capacity. The life period of the wind turbine is less as compared
12K.R. Kumar et al. Renewable and Sustainable Energy Reviews 145 (2021) 111083
to the solar PV plant. The lifetime of the wind turbine may be improved 7. Research outcomes and future prospects
by proper maintenance and strategies of the wind turbine [68]. The
technical challenges with wind turbines are turbulence, controls, and India is pursuing steady growth in the renewable energy sector. The
turbine dynamics [69]. Economics of the wind turbine is mainly affected objective of deploying renewable energy technologies in tea producing
by the transportation of the wind turbine to the site [70]. Wind turbine sectors is to diminish the usage of fossil fuels and the reduction of CO2
also faces many difficulties during erection. It also creates a disturbance emission into environment as well as the production cost. The renewable
to the wildlife by direct and indirect methods. The mortality rate of birds energy technologies also provides employment opportunities to local
is high in nearby wind turbine areas due to collision with blades. It also community and reduce the import of fossil fuels. The lowering of fossil
gives noise pollution by aerodynamically and mechanically. Visual ef fuel imports also improves the economy of the country. The total tea
fects are persuaded by shape, size, and colour of the blades. The wind production for the financial year 2018–2019 in India was reported as
turbine requires initial expenditure as 80% of the total cost as compared 1338 million kgs. If high speed diesel (HSD) was used for overall pro
to solar PV power plant [71]. The Fig. 11 shows the wind power density duction of tea in the financial year 2018–2019 and thereby replacing it
at an altitude of 50 m and huge efforts may be required for installing a with renewable energy technologies, it could save a mammoth of 517.80
wind turbine in northeastern tea growing states. The wind density in the million kg of carbon emission into the atmosphere. In the tea industry,
range of 200–300 W/m2 is obtained in the Western Ghats of southern individual renewable energy technologies such as biomass, solar, wind,
states such as Tamil Nadu, Kerala and Karnataka. This could be enough and hydro could not able to meet the entire energy demand. Hybrid
for implementing commercial wind turbines. The same locations are systems such as a combination of biomass and solar thermal could able
considered for the analysis of solar irradiance are taken for wind re to bear the thermal energy requirement. Biomass and solar energy re
sources analysis as well. Figs. 16 and 17 shows wind potential for sources are almost available in all tea growing regions. The block dia
throughout the year at Golaghat and Munnar. It is clear from the Figs. 16 gram of the proposed thermal energy utilization in the tea industry is
and 17 it shows that there is not enough wind speed for installing a wind shown in Fig. 18. The buffer thermal energy storage tank in this pro
turbine. posed diagram is to provides constant thermal energy output. Even
though the bio-waste potential is available throughout the year, their
6.4. Challenges in hydro power generation conversion efficiency of electrical energy is low due to high moisture
and low energy density. The future scope is to focus on the integration of
The seasonal climatic change gives an impact on water availability. renewable energy sources to completely mitigate the usage of conven
Longer construction period and lack of ability to construct nearby roads tional fuels and greenhouse gas emissions from the tea industries.
are major drawbacks of using micro-hydropower plants [72]. During the Electrical energy generation by renewable energy system and its utili
summer season, the water flow rate could be drastically reduced in the zation in the tea industry is proposed in Fig. 19. The integration of
canals and streams. It could not able to meet up the energy requirement electrical energy storage and control systems with the renewable energy
in the summer season [73]. Micro hydropower plants of gravity wheeler system is to provide constant electrical output to the tea industry pro
are having low rotational speed. It requires a high ratio gearbox to cesses. Mostly, electrical energy requirement in tea industries may be
produce the electricity and results in higher capital investment. met by using solar PV systems. In very few locations especially in North-
Eastern part of India, the solar radiation may be inadequate from few
days to months during winter for generating the desired electricity. In
such a case, an alternative renewable energy sources such as biomass,
January February March April
May June July August
September October November December
Fig. 16. Wind speed in Golaghat, Assam, India [x-axis represents the time in hrs; y-axis represents the wind speed in m/s] [74].
13K.R. Kumar et al. Renewable and Sustainable Energy Reviews 145 (2021) 111083
January February March April
May June July August
September October November December
Fig. 17. Wind speed in Munnar, Kerala, India [x-axis represents the time in hrs; y-axis represents the wind speed in m/s] [74].
Fig. 18. Block diagram of proposed thermal energy utilization in the tea industry.
Fig. 19. Block diagram of proposed electrical energy utilization in the tea industry.
14K.R. Kumar et al. Renewable and Sustainable Energy Reviews 145 (2021) 111083
micro-hydro may be opted to meet the electrical energy demand. [9] Utomo TP, Hasanudin U, Suroso E. Comparative study of low and high-grade
crumb rubber processing energy. 2010.
[10] Julio V, Arce C, Raudales R, Trubey R, King DI, Chandler RB, et al. Measuring and
8. Summary managing the environmental cost of coffee production in Latin America, vol. 7;
2010. p. 141–4. https://doi.org/10.4103/0972-4923.58645.
[11] Alam M, Akter S. Tea production and trade advances in Bangladesh: a comparative
In this article, the opportunities for renewable energy technologies to analysis in global market. J Bus Manag 2015;17:10–20. https://doi.org/10.9790/
encounter the energy demand of tea plantations and industry are dis 487X-17631020.
cussed. The freshly plucked tea leaves arrived at the tea factory has to [12] Duncan JMA, Saikia SD, Gupta N, Biggs EM. Observing climate impacts on tea yield
in Assam , India. Appl Geogr 2016;77:64–71. https://doi.org/10.1016/j.
undergo several processes to get the final product of tea. The specific apgeog.2016.10.004.
thermal and electrical energy consumption is in the range of 4.45–6.84 [13] Kuma T, Dereje M, Hirvonen K, Minten B. Cash crops and food security: evidence
kWh/kg and 0.4–0.7 kWh/kg of tea respectively. From the estimation of from Ethiopian smallholder coffee producers. J Dev Stud 2018;3:1–18. https://doi.
org/10.1080/00220388.2018.1425396.
bioenergy waste from industry and garden, it could able to supplement
[14] Tea export in India. 2020. http://www.teaboard.gov.in/. [Accessed 20 April
up to 83% of the thermal energy requirement in the tea industry. 2020].
Evacuated tube solar collectors could able to supply hot air in the [15] Consolidation of energy audit reports in southern India. 2012.
temperature range of 90 ◦ C to 160 ◦ C to meet the energy demand of [16] Das P, Zirmire J. Tea Industry in India: Current trends and future prospective.
J Pharmacogn Phytochem 2018;7:407–9.
drying and withering processes. The solar-biomass hybrid system could [17] Rajeswari MSK, Saranya MSR, Ambika MSV. Tea industry in India – challenges
be used to supply the hot air for drying and withering process ahead. Iconic Res Eng J 2017;1:39–41.
throughout the day. The hot air from the evacuated tube collector can be [18] Narzary S. A study on the status of growth and development of tea industry in
Assam. Int J Humanit Soc Sci 2016;3:1–7.
stored in thermal energy storage systems to meet the energy require [19] Laskar N, Thappa S. A study on the present scenario of tea industry in Assam-
ment during cloudy and non-sunshine hours and minimize the fluctua Challenges ahead. Indian J Appl Res 2018;5:1–6.
tions. The electricity consumption in the tea garden and industry could [20] Das M, Sankaran A. An economic study of tea industry in India: a stock taking for
six and half decades. Int J Dev Res 2018;8:23681–4.
able to meet by three different sustainable renewable energy technolo [21] Baruah BP, Khare P, Rao PG. The energy utilisation pattern in tea industry of NE
gies such as solar PV, wind turbine, and micro-hydro power systems India and environmental issues. Two a Bud 2012;2:9–13.
based on the availability of resources. Based on the analysis, it is found [22] Nagaraj DH. Preliminary energy study conducted at Arrapetta tea factory. 2015.
Kerala.
that solar energy may be the potential energy resource in Golaghat [23] Gunarathne ADN, Peiris HMP. Assessing the impact of eco-innovations through
(Assam), and Munnar (Kerala) to satisfy the electricity requirement need sustainability indicators: the case of the commercial tea plantation industry in Sri
as compared to other renewable energy resources. The present review Lanka. Asian J Sustain Soc Responsib 2017. https://doi.org/10.1186/s41180-017-
0015-6.
prudently revealed the opportunities and challenges involved in the
[24] Gunawan Y, Putra N, Hakim II, Agustina D, Meurah T, Mahlia I. Withering of tea
implementation of renewable energy technologies in the tea gardens and leaves using heat pipe heat exchanger by utilizing low-temperature geothermal
industries. Thus, the global tea sector has to replace the possible prac energy. Int J Low Carbon Technol 2020:1–10. https://doi.org/10.1093/ijlct/
ctaa041.
tices for sustainable tea production with renewable energy sources that
[25] Maiti Bidinger. The Mcleod Russel House Journal. 2015. p. 42–4.
may enhance the productivity, market value, environmental and social [26] The Peria Karamalai Tea and Produce Company Limited - Renewable Energy
aspects to stay competitive. This could able to reduce the production Installations n.d. https://www.periatea.com/green-energy/.
cost of tea and strategies should be embraced to meet up the challenges [27] Solar PV Installation in Xishuangbanna Tea Garden, China n.d. https://www.tr
inasolar.com/us/resources/success-stories/xishuangbanna-tea-garden.
in global demand for tea in the forthcoming years. [28] Kiplagat JK, Wang RZ, Li TX. Renewable energy in Kenya: resource potential and
status of exploitation. Renew Sustain Energy Rev 2011;15:2960–73. https://doi.
org/10.1016/j.rser.2011.03.023.
Declaration of competing interest [29] Demirbas A. Modernization of biomass energy conversion facilities. Energy Sources
B Energy Econ Plann 2007:37–41. https://doi.org/10.1080/15567240500402784.
[30] Sharma S, Meena R, Sharma A, Goyal P. Biomass conversion technologies for
The authors declare that they have no known competing financial renewable energy and fuels: a review note. IOSR J Mech Civ Eng 2014;11:1–10.
interests or personal relationships that could have appeared to influence https://doi.org/10.9790/1684-11232835.
the work reported in this paper. [31] Tekale Anil, Bedre Balaji, Madake Ganesh, God Swapna, Pankaj Vaghela SL. Energy
production from biomass: review. Int J Innov Sci Res Technol 2017;2:8–12.
[32] Rajika JKAT, Narayana M. Modelling and simulation of wood chip combustion in a
Acknowledgments hot air generator system. SpringerPlus 2016;5:2–19. https://doi.org/10.1186/
s40064-016-2817-x.
[33] Kumar S. Assessment of bio-energy potential in tea industries of India. Asian J
The financial support for the work is provided by the Industrial Agric Rural Dev 2016;6:83–9. https://doi.org/10.18488/journal.1005/2016.6.5/
Research & Development (IRD) Unit, Indian Institute of Technology 1005.5.83.89.
[34] Kumar S, Nilling JJ, Imchen L, Bhutia PL, Pranav PK. Estimation of its waste and
Delhi, New Delhi, through the Multi Institutional Faculty Interdisci
energy potential in Tea estate of Assam. Asp Mech Eng Technol Ind 2014;4.
plinary Research (MFIRP) Scheme 2019 of IRD with Indian Council of [35] Saikia M, Bhowmik R, Baruah D, Dutta BJ, Baruah DC. Prospect of bioenergy
Agricultural Research (ICAR) collaboration (Project Number: IITD/IRD/ substitution in tea industries of North East India. Int J Mod Eng Res 2013;3:
MI02029/169762) is duly acknowledged. 1273–8.
[36] Sharma A, Dutta AK, Bora MK, Dutta PP. Study of energy management in a tea
processing industry in Assam , India. AIP Conf. Proc. 2019;2:1–8.
References [37] Technical Report, tea board India 63rd annual Report 2016-17. Kolkatta. 2017.
[38] Njenga M, Iiyama M, District M. Sustainable energy supply for a tea factory: how
briquettes are saving Makomboki tea factory millions in energy costs. A Newsl East
[1] Awasom I. Commodity of the quarter. J Agric Food Inf 2011;12:12–22. https://doi.
South Africa Reegion 2015.
org/10.1080/10496505.2011.540552.
[39] Koneswaramoorthy S. G.Galahitiyawwa MTZM. Developing and evaluating solar
[2] Tularam GA. The tea industry and a review of its price modelling in major tea
energy techniques for tea drying. J Natl Sci Found Sri Lanka 2004;32:49–60.
producing countries. J Manag Strat 2016;7:21–36. https://doi.org/10.5430/jms.
[40] Yahya M, Ruslan MH, Othman MY, Yatim B, Sulaiman MY, Mat S. Evaluation of
v7n1p21.
energy requirement for drying of green tea using a solar assited drying system ( V-
[3] Ulyanin YA, Kharitonov VV, Yurshina DY. Forecasting the dynamics of the
Groove solar collector ). In: Int. Conf. Energy Environ; 2005. p. 298–303.
depletion of conventional energy resources. Stud Russ Econ Dev 2018;29:153–60.
[41] Tian Y, Zhao CY. A review of solar collectors and thermal energy storage in solar
https://doi.org/10.1134/S1075700718020156.
thermal applications. Appl Energy 2013;104:538–53. https://doi.org/10.1016/j.
[4] Fathima H, P K, SB T, Devabalaji KR. Problems in conventional energy sources and
apenergy.2012.11.051.
subsequent shift to green energy. In: Int. Conf. Eng. Technol. Sci, vol. 3; 2016.
[42] Alkilani MM, Sopian K, Alghoul MA, Sohif M, Ruslan MH. Review of solar air
p. 1–8.
collectors with thermal storage units. Renew Sustain Energy Rev 2011;15:
[5] Roy Mitra S, Totan. An energy audit in a tea manufacturing industry at North
1476–90. https://doi.org/10.1016/j.rser.2010.10.019.
Bengal, India. Int J Res Eng Technol 2016;5:83–9.
[43] Kumar A, Shukla SK. A review on thermal energy storage unit for solar thermal
[6] Rubber Statistical News 2020. https://www.rubberboard.org.in (accessed April 20,
power plant application. Energy Procedia 2015;74:462–9. https://doi.org/
2020).
10.1016/j.egypro.2015.07.728.
[7] Statistics of Coffee 2020. https://www.indiacoffee.org/(accessed April 20, 2020).
[8] Tea Production. 04:1350, http://www.teaboard.gov.in/. [Accessed 20 April 2020].
15You can also read