Adani Enterprises Limited - Growth
←
→
Page content transcription
If your browser does not render page correctly, please read the page content below
Adani Enterprises Limited
                       Investor Presentation
Growth
    With
   Goodness                      April 2019
Legal Disclaimer
Certain statements made in this presentation may not be based on historical          AEL assumes no responsibility to publicly amend, modify or revise any forward
information or facts and may be “forward-looking statements,” including those        looking statements, on the basis of any subsequent development, information
relating to general business plans and strategy of Adani Enterprises Limited         or events, or otherwise. Unless otherwise stated in this document, the
(“AEL”), its future outlook and growth prospects, and future developments in its     information contained herein is based on management information and
businesses and competitive and regulatory environment, and statements                estimates. The information contained herein is subject to change without
which contain words or phrases such as ‘will’, ‘expected to’, etc., or similar       notice and past performance is not indicative of future results. AEL may alter,
expressions or variations of such expressions. Actual results may differ             modify or otherwise change in any manner the content of this presentation,
materially from these forward-looking statements due to a number of factors,         without obligation to notify any person of such revision or changes.
including future changes or developments in its business, its competitive            No person is authorized to give any information or to make
environment, its ability to implement its strategies and initiatives and respond     any representation not contained in and not consistent with this presentation
to technological changes and political, economic, regulatory and social              and, if given or made, such information
conditions in India. This presentation does not constitute a prospectus, offering    or representation must not be relied upon as having been authorized by or on
circular or offering memorandum or an offer, or a solicitation of any offer, to      behalf of AEL. This presentation is strictly confidential.
purchase or sell, any shares and should not be considered as a recommendation        This presentation does not constitute an offer or invitation
that any investor should subscribe for or purchase any of AEL’s shares. Neither      to purchase or subscribe for any securities in any jurisdiction, including the
this presentation nor any other documentation or information (or any part            United States. No part of its should form the basis of or be relied upon in
thereof) delivered or supplied under or in relation to the shares shall be deemed    connection with any investment decision or any contract or commitment to
to constitute an offer of or an invitation by or on behalf of AEL.                   purchase or subscribe for any securities. None of our securities may be offered
AEL, as such, makes no representation or warranty, express or implied, as to,        or sold in the United States, without registration under the U.S. Securities Act
and does not accept any responsibility or liability with respect to, the fairness,   of 1933, as amended, or pursuant to an exemption from registration therefrom.
accuracy, completeness or correctness of any information or opinions                 This presentation is confidential and may not be copied or disseminated, in
contained herein. The information contained in this presentation, unless             whole or in part, and in any manner. This presentation contains translations of
otherwise specified is only current as of the date of this presentation.             certain Rupees amounts into U.S. dollar amounts at specified rates solely for
                                                                                     the convenience of the reader.

                                                                                                                                                                   2
Contents

      Adani Group

      Company Profile

      AEL: Coal Mining & ICM

      Adani Wilmar Ltd

      Mundra Solar PV Ltd

      Others

      Carmichael Mine, Australia

                                   3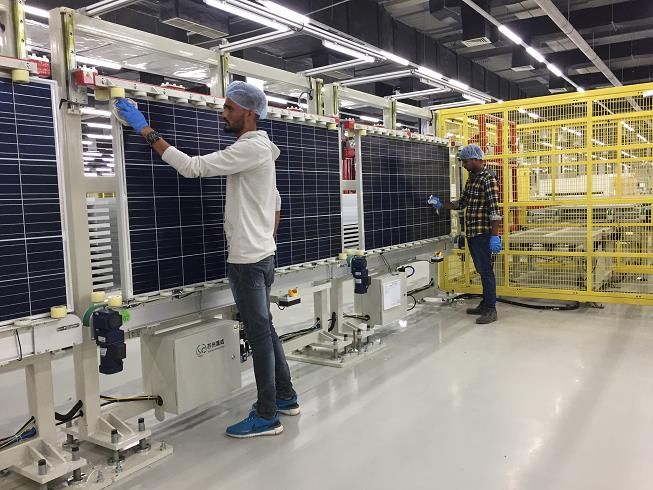
Nation Building - Responding strategically to some of India’s profound challenges

      World’s fastest growing                                                  Rising middle class                  Encouraging policy
                                          Inadequate investments
    economy – 6th largest in the                                              aspirations requires               initiatives augur well for
                                           in the past resulted in
    world today & estimated to                                               massive investments in               growing Private Sector
                                         insufficient infrastructure
       be 3rd largest by 2030                                              Infrastructure and Energy                    participation

                               ENERGY                                               INFRASTRUCTURE (Transport & Logistics)

•    India’s per capita electricity consumption of 1010 kwh –          •   90% of volume and 72% of value of India’s international trade
     among the lowest in the world                                         is by sea

•    Thermal generation moderating but will remain mainstay for        •   Proxy to India's growth (>7% GDP) & economic development
     energy requirements (45% of energy basket)
                                                                       •   Logistics costs in India are among the highest in the world - 13-
•    Renewables capacity growing rapidly at ~25%; expected to be           14% of GDP vs 8% global average
     ~24% of energy basket by 2027
                                                                       •   ~6% Indian travels by Air (among the lowest globally); - India to
•    Historical under-investment in Transmission & Distribution;           be 5th largest aviation market by 2025
     $100 bn opportunity over next 5 yrs
                                                                       •   India has low road density of 4.6 km / 1000 person (~60%
•    Natural Gas contributes 6% in India’s energy basket, expected         unpaved roads) resulting in low road speed
     to be 20% by 2025; $ 16+ bn investment in next 10 years

          Adani Group is a market leader among private sector participants across both Energy & Infrastructure Sector and
                                    is well placed to participate in these key nation building efforts

                                                                                                                                              4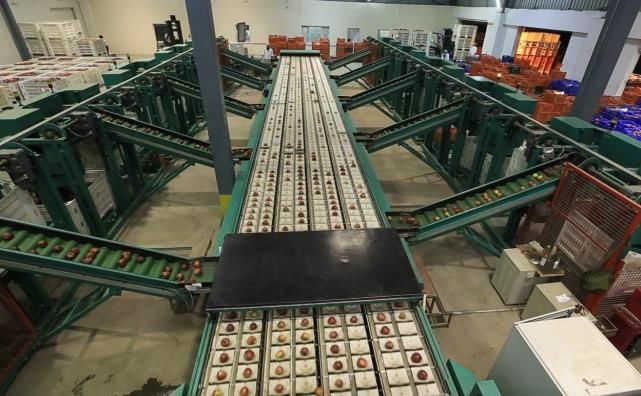
The Making of India’s Leading Energy & Infrastructure Group (1988 – 2018)
1988 1995 2002 2009 2019
Coal ICM Commenced Integrated
Started (1999) #2 ICM player in the
world Coal
Commodity
Management
Gautam Adani Trading Awarded India’s
Listed in 1994
Chairman 1st MDO
(2006)
Acquired Bunyu
Acquired Carmichael
Coal Mine
coal mine Australia
Indonesia (2008)
(2010)
Coal Mining
Mundra Port
(MDO)
1995 Commenced
operations 50: 50 JV with
(1995) Commissioned
Wilmar International
(2000) Mundra Solar PV plant
(2017)
Solar
2002 Grain Silo Depot Manufacturing
commissioned at 7
Llsted in locations (2007)
(MSPVL)
1st CNG Station
2009 Ahmedabad
Listed in (2004)
2007 “Fortune”
Largest Food
FMCG brand in
India
2009 Commissioned 1st transmission
Mundra unit line JV with
(2009) commissioned
Worlds Largest IOC (2014)
(2009)
Single location Agro
Solar Power Plant
Bangladesh PPA Signed (648 MW) (2017)
(2017) Listed in 2015 Listed in
Nov 2018
Operates 10 Project Commissioned
ports/terminals > 2GW by Mar 2018
2019 Awarded LoI for Korba
Mumbai GTD acquisition
(2018)
Listed June
2018
Adani Gas
AGL
Adani Ports Adani Power Adani Transmission Adani Green Energy
APSEZ APL ATL AGEL
FMCG = Fast-moving consumer goods
ICM = Integrated Coal Management 5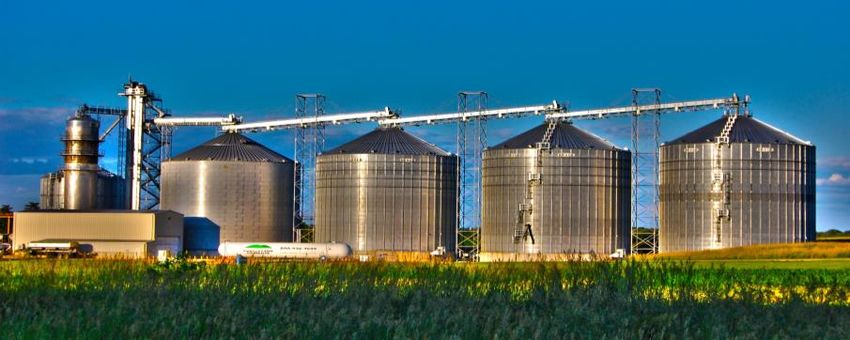
Adani Group – At a Glance

                              Pit to Plug Integration in Energy Value Chain                                                         Presence across Transport & Logistics Space

   4,560 MW      ~ 5% of India’s Renewable Generation Capacity                                                           200 MMT       ~ 15% of India’s EXIM trade
   10,440 MW     ~ 5% of India’s Thermal Generation Capacity                                                             200 Km        - India’s only private rail network owner & operator
   13,464 Ckt Km ~ 3% of India’s Transmission Network
                                                                                                                                                                                           Australia
    Promoter Group                   Promoter Group                 Promoter Group             Promoter Group                Promoter Group                Promoter Group                Promoter Group

                 75.0%                            74.9%                         86.5%                      74.8%                        74.9%                         62.3%                          100%

      Adani Power                  Adani Transmission            Adani Green Energy               Adani Gas                 Adani Enterprises           Adani Ports and SEZ          Abbot Point, Australia

–Installed capacity of          –Installed Capacity            –Installed capacity of     –Focused Pure Play Gas        –Coal Mining: 9 coal MDO      –10 Ports across Indian       –Strategically positioned
 10,440MW; under                 9,132ckt km; under             1,970 MW; under            Marketing and Distribution                                  coast with market share of    coal terminal with 50 mtpa
 construction 1,600 MW           construction 3,792 ckt km      construction 2,590 MW      company                      –Coal Logistics: ~50%          21% in India’s EXIM           operational capacity
                                                                                                                         market share (66 MTPA)
–Low Merchant Risk – 95%        –IG rated by Moody’s, S&P,                                –Operational 4 GAs + 15                                                                   –Proximity to World’s
                                                               –Renewables Capacity:                                                                  –Multi-modal logistics
 PPA (25 yr)                     Fitch                                                     new                          –Carmichael Mine,                                            largest metallurgical &
                                                                4.5 GW (Solar: 57%;
                                                                                                                         Australia: 11 mtpa phase 1                                  thermal coal basins
                                                                Wind: 34% & Hybrid: 9%)
–Low Fuel Risk                                                                            –Total authorization for 38    COD Mar 2021                 –Mundra SEZ (8481 ha)
  • FSA 93% of domestic                            100%                                    GAs (AGL + JV)                                                                           –Limited competition with
                                                               –Geographically
    coal based capacity                                                                                                 –Airports – announced L1                                     high barriers to entry
                                           AEML                 diversified portfolio                                                                 –IG rated by Moody’s, S&P,
                                                                                                                         bidder for 6 airports
  • Coal price pass-through                                                                                                                            Fitch
                                –Acquired Mumbai GTD in                                                                                                                             –Long term take-or-pay
    97% of import based
                                 Aug 2018 for ₹130 Bn                                                                   –Roads                                                       contracts with
    capacity
                                                                                                                                                                                     Socialization of costs
                                –Serving 3 mn consumers in                                                              –Water
                                 suburban Mumbai (500MW                                                                                                                             –IG rated by S&P, Fitch
                                 of captive generation)

  Market Cap: ₹ 18,590 Cr         Market Cap: ₹ 23,910 Cr         Market Cap: 5,795 Cr      Market Cap: 14,155 Cr        Market Cap: ₹ 16,140 Cr       Market Cap: ₹ 78,313 Cr

                              Note 1: Market cap is as of 29th March 2019                                                                                                                            6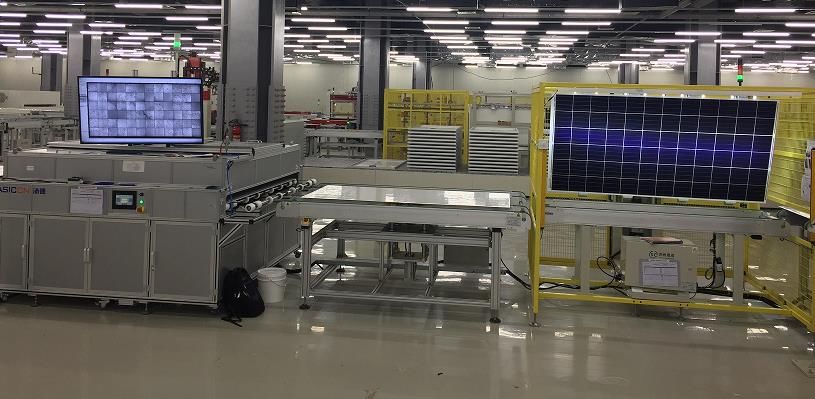
Adani Enterprises: a Diversified Incubator
Adani Enterprises: Key Strengths

            Unique Incubator with a distinctive capability in nurturing businesses of national
            importance creating value for all stakeholders

            Massive Scale - Largest & best in class

            Unmatched Execution - Greenfield assets in record time

            Experienced Management Team - Expertise in regulatory environment in India

            Operational Excellence - Focus on productivity, lowest cost

            Delivered stupendous CAGR of 30%+ for 24 years (since listing)

                                                                                                 8
Adani Enterprises : Evolution

                                                          2018
                                                          • Demerger of Adani Green Energy & Adani Gas

                                               2010
                                               • QIP of $ 850 mn
                                               • Acquired Carmichael Coal Mine
                                               • Won First Coal MDO contract

                                  2007
                                  • APSEZ IPO subscribed 116x
                                  • FCCB Issue of $ 250 mn
                                                                                                 2017
                     2001                                                                        • Solar Mfg plant commissioned
                     • Adani Gas Started
                                                                                             2015
                                                                                             • Demerger of APSEZ, APL & ATL
1996
• Bonus Issue of 1 : 1
                                                                             2009
                                                                             • APL IPO subscribed 21x
                                                                             • Bonus Issue of 1 : 1

                                                       2006
                                                       • Stock Split : Ratio 10 : 1
Nov-1994 listed on
BSE & NSE @ Rs
150/share                  1999
Subscribed 25x             • Signed JV with Wilmar, Singapore
                           • Bonus Issue of 1 : 1

                                                                                                                                  9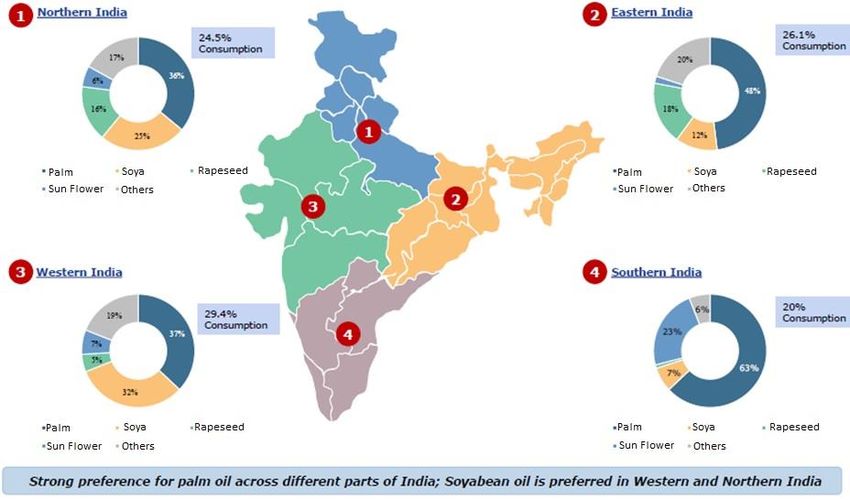
AEL: Corporate Structure

                                                                                         Promoters

                                                                                                  75%
                                                                                Adani Enterprises Limited
                                                                                         (AEL)

 Coal MDO             ICM **
 (Division)         (Division)

                                               100%                                51%                             50%                       100%
                                                                                                                      AWL
                                        Adani Global                                 MSPVL
                                                                                                                  (Edible Oil &                Others
                                          Mauritius                                (Solar Mfg)
                                                                                                                     Food)*

                                 100%                                 100%
                                                                                                                                      100%    Airports
                                   AGPTE                      AGFZE
                                  Singapore                     Dubai                                                                 100%     Roads

                 100%              100%                100%              100%                                                         100%     Water
                  AMPTY                 PTAG                ASPL              ABPL
                 Carmichael         Bunyu Coal
                 Coal Mine             Mine
                                                          Shipping           Bunkering                                                100%    Defence
                                                        (Singapore)           (India)
                 (Australia)        (Indonesia)

  Consolidated Financials FY18 (₹ in Crs)
   Parameter                   Total              Coal MDO               ICM               AGL          MSPVL           AALL+AAFL   Others      AWL*

   Revenue                     37,984                 863               29,454             1,309            554             314     5,406      26,435

   EBIDTA                      3,002                  466               1,261               374             328             100      473        1,010

               * AWL financials shown are on 100% basis
               ** ICM – Integrated Coal Management
                                                                                                                                                         10
Adani Enterprises : Exemplary Value Creation
Evolving EBIDTA Mix
AEL delivered CAGR of 36% since listing FY2012
Vs Others, 8%
Nifty CAGR of 9.6%
ICM, 28% APSEZ, 38%
500000
APL, 26%
50000
5000
FY2018
9%
500
Coal
Solar Mfg 50% 25%
50 AGEL (Renewables)
1994 1997 2000 2003 2006 2009 2012 2015 2018
AGL (CGD)
Others
11%
AEL Nifty Sensex 5%
Note: Chart value in log scale rebased to 100
11Mine Developer & Operator (MDO)
AEL:
Integrated Coal Management (ICM)
12Global Coal Scenario: Demand to remain stable with geographic shift to Asia
India net imports, Australia net exports to be the highest Global coal demand to remain stable
-38
300 285 300
187 371 522
-67 988 614 433
+40
397 710 955
+95 +69
+21 1,914 1,841 1,552
-67
2015 2030 2040
-3 +130 China India OECD Other Emerging Asia RoW
/ Net exports/ imports in 2035 over 2017 levels
Demand to remain upbeat with growth in thermal power capacity India coal imports over the next 5 years expected to be range bound
227 227 224 225 225 220
Capacity Addition
240 1,117
1,050
988
886 930 897
852 825
763
659 706
625
204
FY 18 FY 19 FY 20 FY 21 FY 22 FY 23
FY18 FY23
Total Demand Total Supply Imports
India remain dependent on high GCV imported coal for blending in supercritical thermal power plants
Source: Wood Mackenzie
13Integrated Coal Management (ICM) - Our Global Footprint
Multi-Country Multi modal Customer Account
Financing
Procurement Logistics Management
ICM Integrated presence in complete
supply chain with embedded
technology provides sustainable
Yamunagar
competitive advantage
Private Adani Power Overseas
PSU Suratgarh Panipat
Business Ltd business Harduaganj
Hissar
Dadri Tanda Vindyachal
Kota Unchahar Kahalgaon
Badarpur
Parichha Sagardighi
Chhabra Rihand
Dhamra Bakreshwar
Kandla Mejia Bandel
Panki Durgapur
Mundra Wanabori
Sipat Kolaghat
Gandhinagar Tarakan
Bedi Navlakhi Korba [Talcher] Haldia
Tiroda Samarinda Tanjung Bara
Dahej Koradi Bontang
Paradip
Hazira Chanderpur
Parli
Ramagundam Vishakhaptnam
Simhadri
Muara Satui Indonesia
Tanjung
Kondapalli Gangavaram Pemancingan
Kakinada
Richard Bay
Goa
South Africa Queensland
Ennore
Mettur Tuticorin
North Chennai Australia
Ports
Locations served
Tuticorin
We are a team of 200+ with global operations run through 20+ India offices, 3 overseas offices
14ICM – Market Leader with Consistent Operational Performance
Resilient Business Model with Leading Market Position Sales Mix
In MMT FY 18
47% 56% 45% 48% 32%
7%
164
145 147 SEBs
22%
APL
66 MMT
81 83 Exports
78
66 70 63%
8% Private/Others
34 26
FY16 FY17 FY18 1H FY18 1H FY19
AEL ICM Volume India Steam Coal Import
Stable Operating Performance Realizations on an uptrend
in ₹ Crs. In $/ MT
27446 30232 29454 66.6 67.6
13412 12916
55.8
52.8
967 998 1261
353 454
2.9
2.4
1.9 1.8
FY16 FY17 FY18 1H FY18 1H FY19 FY16 FY17 FY18 1H FY19
Revenue EBIDTA Revenue / MT EBIDTA / MT
15India Coal Mining: Regulatory Evolution, Opportunities and Potential
• Allowed private sector participation in coal mining for captive usage
Amendment to Coal Mines Nationalization Act (1973), 1991
• Case to case basis allotment of 218 coal blocks
• Additional regionally-explored (RE) coal blocks allocated to various PSUs - 14 for Power end use & 3
Auction by Competitive Bidding of Coal Mines Rules, 2012
for commercial mining
• Various complaints were received by the Govt.
CAG Report, 2012 & SC Judgement in 2014
• Arbitrary and non transparent allotment led to cancellation of 204 coal blocks out of 218
• Re-Allocation of the coal blocks; 2- pronged strategy
Coal Mines Special Provisions Act, 2015
• Auction for Private & Allocation for PSUs - either for captive or commercial use
• MoC has opened commercial mining for private sector under Act’ 2015
Way Forward
• Methodology for auction published on Feb 27, 2018 and tender process expected soon
Captive Mines portfolio including CIL’s mines for potential MDO business
Category No. of Blocks
Category No. of Coal Blocks
Allocation & Auction 86
Category No. of Coal Blocks ~52 Bn Ton
Allocation/Auction under Coal Mines Act 2015 204 To Allocate/ Auction 118
Pakri Barwadih, Tasra 2
Allocation under CMN Act 1973 14 Category No. of Coal Blocks ~7 Bn Ton
UMPP Linked Block 12
Sub Total (Coal Blocks) 218 PSUs – Power; allocated 10
~9 Bn Ton
Allocation under Mining Rules 2012 17 PSUs- Power; cancelled 4
Category No. of Coal Blocks
Commercial Mining 3
CIL Coal Block for MDO 3 ~2 Bn Ton
Kaniha , Siarmal, Pelma 3
Grand Total 238 70 Billion Ton
16MDO - Largest Mine Developer & Operator in India
MDO Business Order Book of 80 MMTPA A natural progression into Coal MDO
Successfully developed
Power projects and Ports –
Parsa East and Kanta Basan, Gained experience in LA,
Peak Capacity 15 MMTPA
Kushmunda Washery Community engagement,
Peak Capacity – 10 MMTPA
infra development – critical
Kente Extension activities in Coal mining
Peak Capacity – 7 MMTPA Mining in Indonesia since
Presence in Coal Trading
2007- Credence to venture
Parsa, business with PSUs, SEBs –
Gidhpuri Paturia Peak Capacity – 5 MMTPA into Indian mining industry
Peak Capacity – 5.6 MMTPA Strong relationship with
after experiencing
PSUs
Gere Pelma -III Jitpur, success on foreign soil
Peak Capacity – 5 MMTPA Peak Capacity – 2.5 MMTPA
Gere Pelma - I & II Hingula Washery
Peak Capacity – 39 MMTPA Peak Capacity – 10 MMTPA Entered
India Coal
Bailadela Iron Ore MDO
Peak Capacity – 10 MMTPA Business in
2008 - with
Talabira II & III RVUNL
Peak Capacity – 20 MMTPA
Operational
Under Development
Iron Ore
Washery
Estimated work
Average potential
force of 3200
mine life of 30 years
Mine personnel
Land
Exploration operations
Acquisition
and Logistics
LA: Land Acquisition
MMTPA: Million Metric Tons/ Annum 17Coal MDO: Robust Business Model with Growing Project Pipeline
Mine Owner
Payments to MDO
Coal Delivery by MDO
Facilitating in obtaining clearances, DPR / mine plan, Land acquisition
Mine Developer and R&R
and Operator (MDO)
Construction of Infra such as CHP, Washery, rail siding etc.
Bundled /
Coal & OB Removal customized
Package
Coal Loading & Transport
MDO to do all Investments as per
Scope of Work of which some part O&M of Washery & Disposal of rejects
are reimbursable
O&M of railway siding
Major risks are transferred to one contractor - Ease in Contract Management
Parsa East & Kente Gare Gare Pelma - Talabira Bailadela Gidhpuri Gare Kushmunda Hingula
Parsa Total
Kante Basan Extension Pelma - III II II & III Iron Ore Paturia Pelma - I Washery Washery
Owner RRVUNL RRVUNL RRVUNL CSPGCL Mahagenco NLC NCL* CSPGCL GSECL SECL MCL 9 MDO
Geological
516 256 200 210 736 589 362 281 607 3757
Reserves (MnT)
Mineable
452 184 160 (Est) 94 553 554 325 158 428 2908
Reserves (MnT)
Capacity
15 5 7 (Est) 5 24 20 10 5.6 15 10 10 127
(MTPA)
Status of Operational
2019 2021 2019 2021 2019 2020 2020 2021 2020 2020
Production since 2013
Adani Role MDO MDO MDO MDO MDO MDO MDO MDO MDO Washery Washery
LoA LoA LoA LoA LoA
Contract Status Signed Signed Signed Signed LoA awaited Signed
Received awaited awaited awaited awaited
NCL: NMDC-CMDC Ltd 18PEKB Project - World class infrastructure developed within a record time
Mining Operation Started in Jan 2013 Infrastructure consisting Pit top railway siding, silo
with Rapid Loading system for evacuation of coal is
Coal Production commenced in Feb 2013
under final completion
Mining operations started within record time of 5 Strong EBIDTA Margins & Profitability with stable cash
years from the date of allocation of coal block inflows and robust financial indicator
In-house expert team of Geologists and Mining
Engineers
8.27 8.33
More than 25 MMT coal produced since the start of 6.3
mine
3.44
Peak Mining capacity as per approved plan - 15
MMTPA
Developed world class coal washery and CHP FY 15 FY 16 FY 17 FY 18
ROM Production (MMT)
PEKB mine - a model project - it is vertically integrated through private rail corridor (SRCPL) to provide last mile delivery of
coal at TPS
PEKB – Parsa East & Kante Basin 19Competitor Landscape
Turnover (Rs.Cr) Financial Position of Competitors FY16-17 Networth (Rs.Cr)
10000 JSPL* 10000
Jaypee Power
Adani
Turnover Networth Essel
8000 8000
Less
6000 Dilip Buildcon Aggressive 6000
Most Aggressive Competitors Competitors
Adani
4000 Sadhbhav 4000
Jaypee Power
Monte Carlo BGR Lanco Sadhbhav
2000 Sainik 2000
AMR Dilip Buildcon
VPR Sical Essel
Southwest Ambey Thriveni
0 Lanco 0
Dhansar Mahalaxmi
Single Mine with Highest Mineral Production in one
Mineral (Mn Mineral+OB
40 Ton) Year From FY11-FY17 80 80
(Mn Cum)
Mineral (LHS)
30 60
MDO for Coal/Lignite/Iron Ore
20 40
10 20
0 0
Dhansar
Sainik
AMR
JSPL
VPR
Essel
Mahalaxmi
Sadhbhav
PT Darma
Southwest
Monte Carlo
Sical
Ambey
BGR
Adani
Jaypee Power
Thriveni
Indonesian
Company
* JSPL : Turnover - Rs. 15494 Cr. ; Networth – Rs. 21675 Cr. Source: Adani Analysis, Company Reports
20Coal MDO: Sustainable & Responsible operations driving strong financial performance
Run of Mine (ROM) Production (MMT) Washed Coal Dispatch* (MMT) Responsible Green Miner
8.3 8.3 7.3 7.1 Community
Bringing Mine
6.7 Engagement
6.3 5.5 back to its
5.2 and
pristine stage
Development
4.3 3.4
Technology
Interventions Awards and
for Efficient Accolades
mining
FY16 FY17 FY18 1H FY18 1H FY19
FY16 FY17 FY18 1H FY18 1H FY19
Revenue (Rs Crs) EBIDTA (Rs Crs) & EBIDTA Margin (%) Community Engagement
Health &
Sanitation
863 63% 64%
58% 55% 54%
Sports Skill Development
712
656 Promotion & Entrepreneurship
466
546 418
394
366 317
230
Improvement in Increasing Farmer’s
Education level productivity
Infrastructure
FY16 FY17 FY18 1H FY18 1H FY19 FY16 FY17 FY18 1H FY18 1H FY19 Development
* Sarguja Rail COD April 2018 has boosted coal dispatches in FY19 21AEL: Adani Wilmar – Edible Oil & Food www.farmpik.com
Edible Oil Industry in India
 •   India consumes almost 21 MMT edible oil every year
 •   Consumption of edible oil growing @ CAGR of approx. 4%
 •   India is the third largest consumer of edible oils (12% of global consumption), after China and the EU
 •   Every increase in income translates to a rise in demand for food products including cooking oil.
 •   Consumption-driven demand growth has outstripped domestic supply growth, increasing the country's import dependence to nearly 60%.

                                                                                                                                23
Indian Edible Oil Consumption Growth Drivers
One of the lowest per capita oil consumption (in kg) Market Dynamics
70
59.7 61.1 63.9 63.9 63.6
60 62.4 62.8 64.2
59.5 60.1 • Exponential increase in consumption driven by rising
50 income levels and aspiration.
41.2 43.8 43.8
40 39.6 39.7
30 • Imports which constituted 3% in late nineties of overall
25.1 25.7 26.2 26.4 26.6
consumption now at 70%.
20 17.4
14.9 15.4 15.8 16.7
10
• Per capita consumption to rise to about 23kg by 2025
0 with a growth likely to be around 4%.
2011-12 2012-13 2013-14 2014-15 2015-16
EU USA China Brazil India • Indian oilseed production stagnating and not likely to
grow – fueling growth of Imports
Consumption to grow manifold
• Lowest Per Capita Consumption (Kg) of Edible Oil in
India – Huge potential to grow.
30
26
20
23 • 50% of consumption still catered by unorganized
17 20
sector- Huge potential for consumer pack business.
• Demand not constraint - Supply is abundant.
2015-16 2020-21 2024-25
Per Capita (In Kg) Demand (MMT)
24Adani Wilmar: Strong Growth through Brand across Food segments
Edible Oil and Food Business Dominant Market Share
(as at Mar-19)
20%
14%
5% 4% 4%
AWL RUCHI SOYA KALEESUWARI GEMINI EMAMI
Basket of Brands for Edible Oil & Food Products
Edible Oil
Rice
Besan /
Flour
• 50-50 JV between Adani Enterprises and Wilmar International Soya
• 18 Refineries & 10 Crushing Units
• Refining capacity 11,340 tpd + Crushing 8,950 tpd + Packaging 8,360 tpd
• 5000 + distributors Pulses
25Business Model & Strategy
Journey so far….
• Set up first refinery at Mundra with a refining capacity of 600 TPD in the year 1999
• Launch of Fortune Brand in the year 2000
• Grown from 1 refinery in 1999 to 18 refineries in 2018
• Refining capacity increased from 600 TPD in 1999 to 11000 TPD in 2018
• Owns 18 refineries and 10 crushing units at various strategic locations across India.
• One of the leading exporters of Castor Oil, Oleo-Value Added Products and De-oiled Cakes
• Revenue went up from INR 417 Cr to INR 25000 Cr over these years
• Capital investment of INR 2500 Cr as on date
Competitive Advantage Future Plans
• 18 Refineries & 10 Crushing Units • To be considered as FMCG Food Company instead of only edible
• Refining capacity of over 11,340 tonnes per day
oil company
• Seed crushing capacity of 8,950 tonnes per day
• Packaging capacity of 8,360 tonnes per day • Overall Volume Target – 10 MMT by 2021-22
• 5000+ distributors & >1 mn outlets serve 30 mn households • Consumer Packed Oil Business – 3LMT/Month as against 1.75-1.80
• India’s No.1 edible oil brand “Fortune” having presence all over
LMT/Month at present
India
• Diversified food products such as Rice, Soya, Pulses, Besan, Castor • Plan to Grow in new business segments like Wheat Flour, Rice,
and Soya & Oleo value added products Soya Nuggets and Sugar
26Financial Parameters
Volume MMT Revenue Rs Cr
5.00 30000 26435
CAGR : 11% 4.27 CAGR : 16%
3.92 25000 23215
4.00
3.15 17828
2.78 2.73 20000
3.00 14836 14861
15000
2.00
10000
1.00 5000
0.00 0
FY14 FY15 FY16 FY17 FY18 FY14 FY15 FY16 FY17 FY18
EBIDTA Networth
Rs Cr Rs Cr
1200 2000
1010
CAGR : 24% 1655
1000 CAGR : 21%
783 1500 1280
800
961 1048
600 502 525
426 1000 776
400
500
200
0 0
FY14 FY15 FY16 FY17 FY18 FY14 FY15 FY16 FY17 FY18
27Key Investment Highlights
1
Maintain leading position in
edible oil market
7 2
Exploring the business
Focus on business strategy
potential in regional overseas
aligned to shift in
markets
consumption pattern
6 Adani Wilmar 3
Focus on operational Pan India network of
synergies and financial manufacturing, marketing,
flexibility sales and distribution
5 4
Diversified product portfolio and
Prudent risk management focus on branding to capture
incremental market share
28AEL: Mundra Solar PV - Solar Manufacturing
29Solar Manufacturing – Demand for domestic solar module expected to grow at a double digit growth rate
Low Penetration in Global Energy Demand Global solar PV demand to grow at 13% CAGR Solar Manufacturing concentrated in China
(in GW) Total Cell Capacity Total Module Capacity
8.8% RoW EU India Japan USA China
168 GW 219 GW
119 121 122
7.4% 116
106
6.2% 99 33
38 India, 2% Others, Vietnam, USA, 2% Others,
42
5.0% 45 Canada, 3% 6%
79 4%
45 14 4% India,
13 5
3.6% 3.3% 52 13 4%
12 7 S Korea,
2.8% 2.6% 51 34 7 17
2.2% 12 6 16 7% Canada,
12 13 15 4%
15 7 14
12 12 Taiwan,
0.9% 0.6% 15 11 13 S Korea,
7 8 7%
12 9 10 6% China,
9 40 China,
2 5 7 31 35
9 7 21 28 75%
11 76%
6 9
2015 2016 2017 2018 2019e 2020e 2021e 2022e
Global Growth Drivers / Opportunities India: 31% power generation from Solar by 2030 Global Solar Module oversupply bottoming out
• Cells / Modules imported from India exempt Installed Capacity Projected Capacity
USA from tariffs
• Projected market of ~350 MW / year
• Subsidy for new solar projects supportive to
Utility
global demand
China 60
• Better than expected China solar target (i.e.,
>300 GW by 2020) positive for solar module
• Resurgence of demand from Govt auctions & 88
residential will bring 43% annual growth from 73
Europe
2017 levels of 6.3 GW
Rooftop
58
• Spain & Italy will contribute 67 GW by 2030
40
28
Africa & 22
• MENA targets 84 GW by 2023 12
Latin 4 7
• Latin America targets 40 GW by 2021
America
2015 2016 2017 2018 2019 2020e 2021e 2022e Target
To achieve global sustainable development target, Solar PV requires annual growth of 17% till 2030
Source: CS Primer, 2019, GTM / BNEF, IEO – International Energy Outlook 30AEL: MSPVL – Largest Solar PV manufacturer in India… Competing on Quality, Cost & Scale
Largest integrated module manufacturer in India Global recognition for quality & performance World Class Manufacturing Facility
Module Cell
Rated as Tier 1 Rated as
12001200
by BNEF in Bankable by
1000 2018 CEA in 2018
900
Rates as
500 Rated as Top
Bankable by
410 430 performer by
Munich RE in
300 DNV in 2018
2018
Rated as Rated as
Bankable by Bankable by
Adani Tata Vikram Waaree Indo Solar Jupiter Solarbuyer in Black & Veatch
Power Solar Solar Solar
2018 in 2018
Solar Manufacturing Facility at Mundra, Gujarat
Investments in vertical integration enhance cost competitiveness • State of art manufacturing facility built in a year
• Best in class equipment from European & Chinese
suppliers
Investments
Large scale of
in ancillary • Energy efficient building with IGBC Platinum rating
operations
units
Unique location to leverage cost advantages
Long term Regulatory
supplier financial • Adani Solar can access cheaper raw material and
relationships support
enable supply of high quality PV products to more
lucrative markets due to our unique location
Low • Adani ports are the most efficient and have the
High level of taxes/duties
automation in SEZ quickest turnaround time when compared globally
location
31AEL: MSPVL – Best in Class Technology, Process & Performance resulting into Diversified Marquee Clientele
Process & quality assurance enable superior product Experienced team to ensure long term process sustenance
• Leading QMS and excellent product quality assurance Our team has ~4500 man years experience in the sector
• Triple stage Electro-luminescence inspection
• Working on the principle of lean manufacturing Operations and Maintenance
• Co-locating ancillaries to achieve strict quality control
SCM & Marketing
• Tie-ups with leading global institutes (ISC, UNSW, PI Berlin, Fraunhofer etc.) for
material and process improvements Projects
• Dedicated R&D center to enable continuous upgrading of lines as per latest
Technology
developments
• Process based on Just-In-Time procurement enabled by raw material tie-up
through tolling / LTA
• Strong inbound and outbound logistics management team
Better quality & performance vis-a-vis peers… …resulting into Diversified Marquee Clientele
Adani Competitor Top Export
91 Top Developers Top EPC players
players
88 88 88
87
86
85 85 85
84
83 83
82 82 82 82
81 81 81
80 80 80 80
79 79
78 78 78 78
76
• Adani ~4MW at Mahoba, UP along with another Chinese Premium Tier-1 module > 50 MW
• Performance Ratio* of Adani modules were consistently 3-5% higher than Chinese Premium
Tier-1 module manufacturer
* Performance Ratio (PR) = Energy measured(kWh) / [Irradiance(kWh/m2) on the panel x Active area of PV module(m2) x PV module efficiency]
32AEL: MSPVL – Strategic Priorities aligned to leverage Growth in Industry
Strategic Priorities Order Book provides Growth Visibility
Expand EPC and Solutions offering along with latest technology implementation to Actual Sales Order Pipeline
achieve a policy independent self-sustainable business model
298
Order book of
259 ~800* MW
228
134 126
EPC Services 120 111
65
Pumps/ Other
O & M Services
Solutions Q1FY19 Q2FY19 Q3FY19 Q4FY19 Q1FY20 Q2FY20 Q3FY20 Q4FY20
* the above book excludes spot orders of ~15-20 MW per month
Key Drivers for Growth
Strategic Priorities
Forayed in to retail segment by appointing Channel Sales Partners on Pan-India basis to
tap up to 100 MW annually with high margins
Latest Technology Rollover of CPSU scheme of 12 GW to boost solar manufacturing with additional margins
Branding through
Adoption to improve Channel Sales Government Schemes like KUSUM, SRISTI, SKY to augment additional demand
unit economics
Building sustainable model by booking value added solutions viz EPC/RT/DG/Pump
business upto 25% of the capacities to give additional margins of Rs.3~5 per wp.
Cost-
comeptetiveness No moving parts, ideal for distributed generation – generation that occurs close to the
through value point of consumption
engineering
Unlimited resources with no cost (irradiation level varies)
No carbon footprint from solar
Decline in battery storage product price
33AEL: MSPVL – Key Investment Highlights
Attractive growth potential - India’s thrust to develop solar power generation
Supportive Government policies – Make in India, capital subsidy & other incentives
Strong sponsorship – AEL 51% & Promoter Group 49%
Moderate technology risk – best in class technology with in-house R&D
Strong track record of execution of large size and complex projects
World class manufacturing facility with BNEF* and DNV.GL^ accreditation
Note: * BNEF - Bloomberg New Energy Finance
34
^ DNV GL - Det Norske Veritas & Germanischer Lloyd (international accredited registrar and classification society)AEL: Airports
India Aviation – A Strategic Market

                                 India Aviation Industry                                           Globally India has low domestic penetration for flying
                                                                                                                                                    (trips per capita per annum)
•     Low penetration of flying (0.07 trips per capita per annum vs. 0.3 in China)
                                                                                        Norway                                                                      5.24
•     3rd largest domestic aviation market in 2016; poised to become 3rd largest       Australia                                              3.5
      global aviation market by 2025                                                        USA                                    2.59
                                                                                        Canada                             1.57
•     Indian aviation industry has grown @ ~10% in the last 5 years; high growth
                                                                                          Japan                     1.18
      expected to increase over the next 5 years
                                                                                          Brazil             0.65
•     Aviation policy aims for domestic ticketing of 500 million & international         France           0.49
      ticketing of 200 million by 2027                                                 Germany            0.43
                                                                                             UK           0.42
                 10 Largest Air Passenger Markets Over 2016-2036
                                                                                          China          0.34
    Rank, based on no of passengers
                                                                                           India      0.07

                                                                                                             Passenger traffic at Indian Airports
                                                                                       Total Passengers Handled (millions) at Indian Airports, fiscal years 2012 - 2022

                                                                                     Source: CAPA Advisory Research
                                                                                                                                                                      36
Adani Airports
Poised to become the Leading Airport Operator in India Key Highlights of Recently Won Projects
Qualified Successful Bidder of 6 of India’s Leading Strategically located
Airports handling 30+ million passengers
Robust Portfolio Tracking Consumption Trend – Passenger Traffic
Growth of 17% for 6 airports vs. India’s Traffic Growth of 12% (5 years)
Jaipur Lucknow
FY18 Px: 4.7 Mn FY18 Px: 4.8 Mn Guwahati Robust Concession Structure – 50 year concession, 100% Ownership
FY18 Px: 4.7 Mn
Ahmedabad Operating in a stable regulatory environment – Hybrid Till model (Post
FY18 Px: 9.2 Mn tax return on regulated asset base with pass through on all costs and
taxes) with Upside from 70% of Non- Aero Business
Large Non Aeronautical Potential – Current Spend of ~INR 80 / pax vs
Privatized airports of INR 200-300 / Pax
Significant Expansion Potential – Opportunity to Expand Combined
Capacity to over 100 mn Pax in the next 10 years
Circle size indicates
Mangaluru FY18 passenger traffic
FY18 Px: 2.3 Mn
Large and attractive land for monetization – 225 acres available
Trivandrum
FY18 Px: 4.4 Mn
37Adani Airports – Successful Foray into Airports Sector
Portfolio of rapidly growing Airports Adani emerged successful in 6 recent airports bids (Rs/Domestic Px)
Among the highest & most diversified portfolio of Airports in India 177 174 155 171 155
146 168
(NIIF) 139 160 (NIIF)
135
Traffic growing at 15% - 20% YoY (NIIF) (AMP) (KSIDC)
115
Low non aeronautical penetration (~Rs 80 / Px) provides a unique
opportunity to enhance returns
45
Significant opportunities to improve efficiencies (CIAL)
100% equity ownership vs only majority stake for other airport
operators Ahmedabad Jaipur Lukhnow Guahati Trivandrum Mangaluru
Adani Bid 2nd Bidder
Ahmedabad Jaipur Lucknow Guwahati Trivandrum Mangluru Total
Concession Agreement (CA) Signing by July 2019
Concession Period (Yrs) 50 50 50 50 50 50
CoD Date (estimated) Jan 2020 Jan 2020 Jan 2020 Jan 2020 Jan 2020 Jan 2020
Total Land Available / City Side Land (Acre) 987 / 28 777 / 17 1259 / 110 826 / 60 637 / 2 584 / 10 5,069 / 227
Initial Capex (Rs Cr) 416 518 580 465 438 190 2,606
Additional Capex (Rs Cr) 10 years 2,500 1,100 1,650 1,000 800 1,200 8,250
38Adani Airports – Airport Portfolio witnessing growing propensity to fly
Robust Passenger Traffic with Growth higher than Domestic average
21.4%
17.1% 18.6% 17.6% 16.8%
9.1%
9.2
Domestic Px (FY18 in Mn)
International Px (FY18 in Mn)
7.3 4.8 4.8 4.7 4.4 CAGR (last 5 Yr) (%)
1.9 2.3
4.2 4.0 4.6
2.5 1.5
1.9
0.5 0.7 0.1 0.8
Ahmedabad Jaipur Lucknow Guwahati Trivandrum Mangluru
Resilient Revenue Profile with healthy EBITDA margin (FY18)
46% 49% 48%
40%
34%
19%
11% 18% 16% 17%
22% 21% Non-Aero Revenue
Aero Revenue
EBITDA Margin (%)
89% 82% 84% 83%
78% 79%
Ahmedabad Jaipur Lucknow Guwahati Trivandrum Mangluru
39Adani Airports – 30% Hybrid Till Model
Hybrid Till Model – WACC based regulated returns to be provided in every 5 year block
Returns on Regulated Asset Base (RAB) Annual Aero Revenue Annual Airport Revenue
Revenue Determination
Return on Assets Annual Aero Revenue
Opening RAB
Aero O & M Normalized Aero Revenue *
Capex
Depreciation for Aero Assets Total Non-Aero Revenue
Depreciation
Closing RAB Taxes on Aero Revenues Revenue Share
Post Tax WACC 30% of Non-Aero Revenues Annual Airport Revenue
Return on Assets Annual Aero Revenue True up in 5 yr block
Aero Revenue Non-Aero Revenue
City Side Development
• Duty Fee
• Land Fees
• Retail Licenses
• Parking & Housing Fees • Development Rights on Land
• Food & Beverages
• User Development Fees
• Advertising
• Cargo Handling
• Land License Fees
• Ground Handling
• Space Rental
• Aircraft Fueling
• Car Parking
* Aero revenue is normalised over the 5 year regulatory period using the CPI-X Model 40AEL: Roads
Roads

                                 Road Industry                                                                    Projects under Execution

                                                                                           Particular           Project I               Project II     Project III

                                                                                                             4-lane 53 Km          4-lane 42 Km      4-lane 59 Km
                                                                                                               road from             road from         road from
                                                                                        Project               Bilaspur to         Mancherial to       Suryapet to
                                                                                                             Patharapali in       Repallewada in     Khammam in
                                                                                                              Chattisgarh           Telangana         Telangana

                                                                                                                                       2 Yrs              2 Yrs
                                                                                                                 2 Yrs
                                                                                                                                   Construction       Construction
                                                                                        Project              Construction
                                                                                                                                    Period + 15        Period + 15
                                                                                        Period             Period + 15 Years
                                                                                                                                    Years O&M          Years O&M
                                                                                                             O&M Period
                                                                                                                                      Period             Period

                                                                                                            Hybrid Annuity        Hybrid Annuity     Hybrid Annuity
                              Potential & Outlook                                       Project Mode
                                                                                                                Model                 Model              Model

• 53000 kms of NHs have been identified to be built under Bharatmala                    Concession             Signed on              LOA on             LOA on
                                                                                        Agreement            14th May 2018        8th March 2019     8th March 2019
• Rs 5.35 tn earmarked for 1st phase of Bharatmala scheme (24,800 Km)
• Government “Char Dham Connectivity Scheme” Rs 1570 tn (48000 Km)                      Project Cost          Rs 1,140 Crs          Rs 1,357 Crs      Rs 1,566 Crs
• Shift to EPC/HAM projects to insulate developer’s risk with respect to BOT            Financial
                                                                                                              Completed           Under Process      Under Process
 Projects, primarily related to traffic growth etc.                                     Closure

• Toll-Operate-Transfer new PPP model introduced for monetization of road               NHAI Grant            Rs 456 Crs            Rs 543 Crs         Rs 626 Crs
 assets
                                                                                                                             Strategy
• NHAI has identified first 75 TOT projects spanning 4500 km, considering an
                                                                                        • Focus on the projects across India initiated by NHAI & MORTH
 annual toll revenue collection of Rs 2700 Crs.
                                                                                        • Target selected projects under BOT, TOT, HAM model which can offer scale
• NHAI and MoEF have relaxed Land Acquisition norms and ensuring 80% of
                                                                                         and complexity to create a differentiated value
 Land is in possession at the time of awarding of projects.
                                                                                        • In-organic growth through M & A

                      MORTH – Ministry of Road Transport and Highways; PMGSY - Pradhan Mantri Gram Sadak Yojana; DFC – Dedicated Freight Corridor              42
                      BOT – Build-Operate-Transfer; TOT - Toll-Operate-Transfer; HAM - Hybrid Annuity Model
AEL: Water
Water: Significant Investment Opportunities

   Water Stress (withdrawals/available supply) in India        • Global water demand expected to grow rapidly to touch >5,200 cubic kilometres per year
                                                                by 2025 (growing at over 1.2% every year)
                                                               • Agriculture in India is the prime user of freshwater with a share of 80% followed by
                                                                industry & domestic applications
                                                               • Per capita water availability was 5177 cm in 1951, which is down 70% to 1545 cm in 2011
                                                               • According to McKinsey, there will a demand-supply gap of 50% by 2030 in India
                                                               • Indian Government foreseeing an investment of around Rs 12,000 trillion              Including
                                                                National Mission for Clean Ganga (NMCG)
                                                               • This budget is expected to be spent towards water supply and sanitation and “water
                                                                security” at individual states level

                                                                                                  Project under Execution
                                                                     Particular                                          Detail

                                                                                           •   Development of Sewage Treatment               Plant   (STP)    and
                                                               Project
                                                                                               Associated Infrastructure in Allahabad

                                                               Project Period              •   2 Years Construction Period + 15 Years O&M Period

                                                                                           •   DBFOT with PPP Hybrid Annuity (40% from Govt. and 60% by
                                                               Project Mode
                                                                                               Project Developer)

                                                               Project Cost                •   Rs 908 Crs (Financial tie up under process)
• ~13 states in India spanning around 300 districts face       Concession Agreement        •   Signed on 11th Jan 2019 with NMCG and UP Jal Nigam (UPJN)
 water stress                                                                              •   New STP: 72 MLD Cumulative at 3 Locations (42+14+16)
• Despite a long coastline of ~7600 km, coastal areas have a                               •   Rehabilitation STP: 254 MLD Cumulative at 6 Locations
                                                               Brief Scope                     (80+29+50+60+10+25)
 huge problem of water scarcity due to poor river water                                    •   Raising Main and Gravity Main Piping : 7 Km
 availability, low ground water levels & high demand                                       •   Pumping Stations: 17 Nos (New + Rehabilitation)

                                                                                                                                                         44
AEL: Agro, Bunkering, Shipping and Defence
45Agro Infrastructure
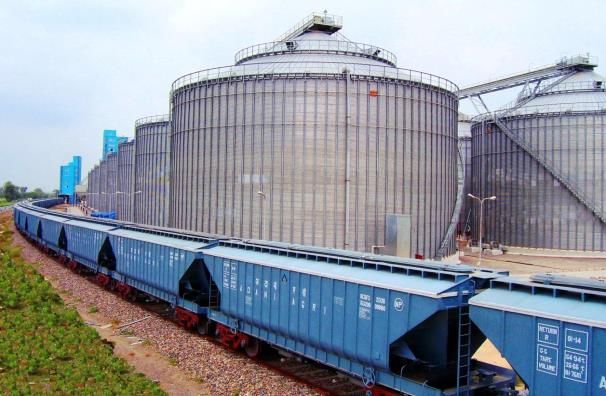
Fruits Storage Business Grain : Logistics, Storage and Distribution
• 35% fruits & vegetable lost due to lack of storage infrastructure in • 7% grain lost due to lack of storage infrastructure in India
India • Introduced first of its kind modern and scientific storage facilities in India , ensuring
• Brand FARM-PIK, India’s largest selling fruit brand negligible losses and minimal human touch
• Pioneer to introduce Controlled Atmosphere (CA) technology in India, • Capacity with private railway sidings, transporting grains in bulk from grain-
for increased fruit storage life producing states to consumption areas
• Three Controlled Atmosphere (CA) storages with capacity to store • Current total storage capacity of 1 MMT is set to rise to 2 MMT by 2021
24,000MTs in the heart land of Apple orchards in HP • Since 2005, built storage capacity of 850,000 tons at 13 locations in India
• A boon to farmers which has changed the apple marketing landscape − Operates storage facilities of 5,50,000 tons at 7 locations under BOO for FCI for
in HP 20 Years
• Sourcing fruits globally for the Indian market − Operates storage facilities of 3,00,000 tons at 6 locations under DBFOT for
• Selling through a wide network of retail chain stores across the major MPWLC for 30 Years
cities in India • Building silos in 10 more locations across India for FCI and PGPCL, with a capacity of
4,75,000 tons under DBFOT/DBOO for 30 Years
BOO - Build Own Operate; DBFOT - Design, Build, Finance, Operate, Transfer; FCI – Food Corporation of India
MPWLC = Madhya Pradesh Warehousing and Logistics Corporation PGPCL = Punjab Grain Procurement Corporation Ltd 46Adani Bunkering – a leading bunker supplier in India & Adani Shipping
Bunkering : Re-fueling of ships with different grades of Fuel Oil
Sourcing Shipping Storage Blending Bunker Delivery
Integrated yet independent business model
Adani Bunkering - Factual Snapshot Adani Shipping - Factual Snapshot
• 45% Market Share in India
• Adani Shipping Pte Ltd – a Singapore (AEL’s wholly owned
• Total Volume ~ 7.8 Lac tons subsidiary)
• Owns two ocean going bunker barges with a capacity of • Operator of 5 foreign flag Cape size Bulk Carriers
~3,000 MTs each (biggest bunker barges in India)
• Vessel Capacity range – 175,000 MT to 185,000 MT.
• Dedicated tankages at Mundra (80 KT), Hazira (10 KT) and
• Engaged in transportation of bulk coal / iron ore
Goa (10 KT)
• Counterparty - Both group captive as well as external
• Operating across all major ports of India & South Asia
Rating – BBB+/Stable
47Defence & Aerospace
PLATFORMS AND COLLABORATE WITH GROW INDIAN MSMEs FOCUS ON
1 TECHNOLOGIES
2 GLOBAL PARTNERS
3 4 INDIGENISATION
Focus on platforms and Collaborate with credible and Help develop and grow the Focus on capabilities critical
technologies of critical committed global partners dynamic MSME’s, which are for indigenisation including
importance, to assert India's willing to team up for the long critical for a fast scale-up and design, system integration,
military competence, to meet term and who are willing to sustainable ecosystem in India maintenance & support in
emerging security challenges transfer technology & skills India
UPGRADES &
LIFE CYCLE MANGEMENT - Prime
Fighter aircrafts (Gripen AEROSTRUCTURES & COMPOSITES
E/F) • High quality machined components
supplier to Global OEMs – GE, MRO* & SUPPORT - Prime
Honeywell, UTC etc.
Advanced Materials • Composite parts supplier for SYSTEM
• Fighter Crafts (Composites) INTEGRATION - Prime
aircrafts, missiles & unmanned aerial
• Unmanned Aerial Systems vehicles.
SUB-ASSEMBLY &
• Helicopters AVIONICS & SYSTEMS SUB-SYSTEMS - Support
Unmanned Aerial Systems • High end built to specification
• Satellites (Hermes 450 and 900)
supplier of avionics systems for
• Radars & Electronic Warfare Systems fighter aircrafts, helicopters, UAV’s. COMPONENTS - Support
• Machining and Gear Manufacturing • Focus on design and development
with a well-developed supply chain DESIGN & R&D - Prime
• Carbon Composites Aerostructures
for fabrication etc..
MSME PARTNERS
• Skill Building & Training Centre
* MRO – Maintenance, Repair & Others
48Cement
Cement Plant Footprints & Capacities – Phase I Cement Business Growth Plan
• Adani Cementation (ACL) plans to be among the top by 2025
• ACL plans to achieve this feat in three phases i.e. Phase I & IA, Phase II and
Phase III
• In its Phase I, ACL plans to put Cement Unit at Mundra, Udupi, Dahej and
Raigarh (near Mumbai)
Lakhpat Integrated Unit • The clinker for the planned units will be produced at Lakhpat, which will also be
Clinker Capacity: 3.2 MTPA
an integrated unit
• ACL has also acquired a limestone mine with reserves of 170+ mt
Lakhpat IU Mundra BT
Phase I – Status of Statutory Clearance
Clinker/Cement to
Cement Capacity: 0.55 MTPA
be fed to Gus/BU
Mundra BT Clearanc
by Sea route
Lakhpat Mundra Udupi Dahej Raigarh
e
Dahej GU Dahej GU
Site visit Date for Filing of
Cement Capacity: 1.1 MTPA Environmen completed by
Public
Public TOR meeting Application
Hearing
t Clearance EAC, TOR Hearing completed for TOR
Completed
awaited Awaited completed
Raigarh BT Site visit by
Raigarh BT
Cement Capacity: 1.65 MTPA Forest Range Forest
Not Required Not Required Not Required Not Required
Clearance Officer
completed
Udupi GU Mining Plan Approved Not Required Not Required Not Required Not Required
Udupi GU Cement Capacity: 2.2 MTPA
Aviation NOC from AAI NOC from AAI
Completed Completed In Process
Clearance in process in process
In process to In process to
In process to
sign fly ash In process to sign fly ash
Linkages of Limestone sign fly ash
agreement sign fly ash agreement
Raw Mine agreement
with Adani agreement with Adani
Material acquired with Reliance
Power, with UPCL Power,
The total installed cement capacity of 5.5 MTPA by 2020 Mundra
Industries
Mundra
GU: Grinding Unit
49
BT: Bulk TerminalAEL: Carmichael Mine, Australia
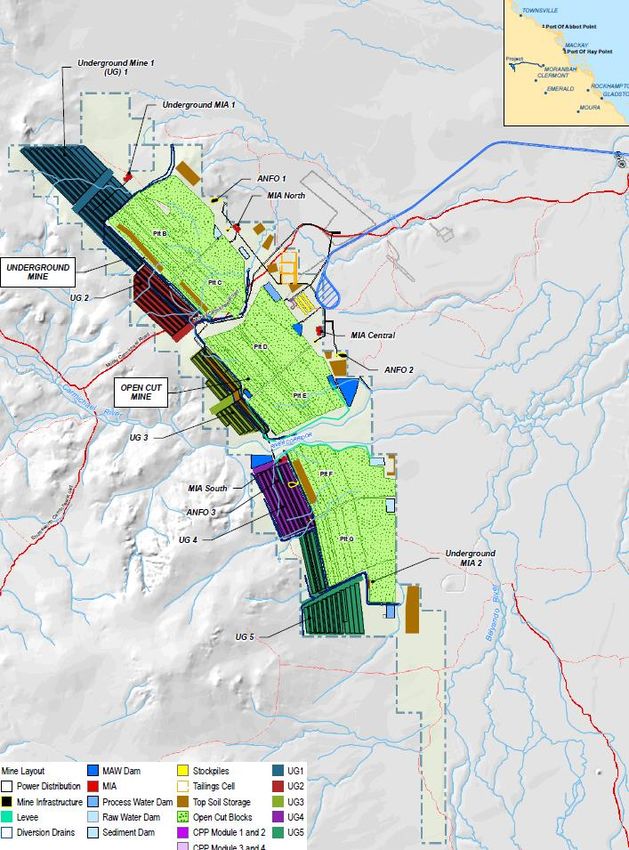
50Carmichael Coal Mine - Overview
Location Galilee Basin, Queensland, Australia
11 BT JORC compliant Resource
Resource
880 Mn T JORC compliant Reserves
Moderate to high energy thermal coal suited for Asian markets
Current development: open cut mine capacity of 11 mtpa
Phase I Deferring certain on site and off site infrastructure
Ensures sustainability and positive cash flows on the 11 mtpa
1st Coal on rail by March 2021
Phase II
Decision to ramp up to 15/ 20 mtpa in year 2 and 3 of operations
Received required approvals
Further Judgement on
Matter Counterparty Initial Judgement
Appeal Further Appeal
Grant of Mine Environmental Land Services of Coast and ✔
No n/a
Authority on February 2, 2016 Country Inc In favour of Adani
Land Services of Coast and ✔
Land Court Hearing No n/a
Country Inc In favour of Adani
Grant of Mine EPBC Approval on Australian Conservation ✔ ✔
Yes
October 14, 2015 Foundation Incorporated (ACF) In favour of Adani In favour of Adani
Determination of National Native ✔ ✔
Adrian Burragubba Yes
Title Tribunal dated April 8, 2015 In favour of Adani In favour of Adani
Adrian Burragubba, Linda
Grant of Mining Lease on April 3, ✔ ✔
Bobongie, Lester Barnard, Delia Yes
2016 In favour of Adani In favour of Adani
Kemppi and Lyndell Turbane
Grant of Environmental Authority
Whitsunday Residents Against ✔
for Port Development dated n/a n/a
Dumping Ltd In favour of Adani
December 7, 2015
Adrian Burragubba, Linda Hearing in the
Application to register the ILUA
Bobongie, Lester Barnard, Delia Federal Court to n/a n/a
on April 27, 2016 by Adani
Kemppi and Lyndell Turbane be held
51Carmichael Mine: A conventional, commercially robust and competitive coal mine
• Large resource and reserves base (Pit DE >30 years)
• Deposit characteristics well understood
1. Conventional mine
development and operational • Major approvals already in place for current and future developments
approach
• Proven mining method enables product strategy and reduces operational risk
• Conventional construction and execution strategies to efficiently manage cost, schedule and risk
• Comprehensive approach to product strategy development
2. Product strategy well
positioned to take advantage • Carmichael 5,000kcal product aligned to resource quality and operating strategy
of market requirements
• Target markets’ demand increasing and forecast to continue
• Consistent low strip ratio
3. Commercially robust with • Sustainable low operating costs
competitive advantage • Competitive capital costs
• Strategically positioned to rapidly expand
52Sustainability
• Business in harmony with Nature
• Measurement of carbon footprint across all business
operations
• Management systems & policies in place to ensure efficient
use of resources
• Strategies & initiatives to reduce resources consumption and
maximize recycling
Environment
• Streamlined governance structure with • Business growth in tandem with
system, process & policy community development
Governance Social • CSR activities thrust areas – Education,
• Governance percolates down to the Health, Livelihood development and Rural
lowest level Infrastructure
• Special projects – SuPoshan (Better
• Regular monitoring & review of nutrition), Swachhagraha (Clienliness),
performance Saksham (Skill development) and Udaan (
Career building)
• All operations & activities subjected to • Operations across 12 states, 1470
regular external reviews & audits villages, touching 4 lakh+ families
53One vision,
One team
Growth
With
Goodness
To be the globally admired leader in integrated infrastructure businesses with a deep commitment
to nation building. We shall be known for the scale of our ambition, speed of execution and quality
of operation.
54You can also read