April 2019 Kagiso Asset Management Quarterly - Mediclinic International, in recovery pg 1 Barloworld - not enough mileage pg 5 A maturing steel ...
←
→
Page content transcription
If your browser does not render page correctly, please read the page content below

April 2019
Kagiso Asset Management
              Quarterly

                        Mediclinic International, in recovery pg 1
          Barloworld - not enough mileage pg 5 A maturing steel market pg 9

                                www.kagisoam.com
1 Mediclinic International, in recovery          Sarah le Roux

                5 Barloworld - not enough mileage           Meyrick Barker

               9 A maturing steel market          Mandi Dungwa

              13 Tower power    Simon Anderssen

              17 Performance table

Unconventional thinking
Mediclinic International, in recovery
                              Sarah le Roux - Investment Analyst

Over the past three years Mediclinic International has
been impacted by a number of setbacks. More recently,
regulatory challenges in Switzerland have materially
altered the outlook for the group. We investigate where
the opportunities lie going forward.

                                                               1
Mediclinic International, in recovery
An extensive footprint                                                       Similarly, Mediclinic Middle East’s (Mediclinic ME) extensive
In the space of a decade, Mediclinic transformed itself into a               experience in operating outpatient clinics is being called upon
leading global hospital operator with almost 70% of revenue                  to assist Hirslanden in adapting their model to the new
currently generated outside of South Africa. The group operates              regulatory environment in Switzerland.
in the premium segment of the market, investing heavily in
                                                                             Diverse operating models
facilities and equipment, and aims to attract the best doctors
                                                                             In South Africa, independence between different healthcare
with a key focus on quality and clinical excellence. To this end,
                                                                             service lines is prescribed by law. With limited exceptions, the
Mediclinic makes use of patient satisfaction surveys, developed
                                                                             private hospital sector cannot directly employ doctors and is
by Press Ganey, to benchmark their performance against
                                                                             also prohibited from owning laboratory and radiology services.
international competitors. The results of these surveys are then
                                                                             Procedures are generally charged on a fee-for-service model,
published in the public domain to reinforce their position as a
                                                                             where each service provider charges for the specific service they
hospital operator of choice across Switzerland, South Africa
                                                                             render. Patients therefore receive multiple bills for a single
and the United Arab Emirates (UAE).
                                                                             hospital stay, either directly or via their medical aid. Although one
Still early in its journey, Mediclinic has only just begun to reap           may receive an estimate of the surgeon’s fees beforehand, the
the benefits of a wider geographical footprint. The procurement              entire cost of an operation remains largely unknown until one
function is in the process of being centralised so that medical              is discharged. The amount owed to the hospital is particularly
consumables and equipment can be bought in bulk for the                      difficult to determine in advance as it is calculated based on
entire group. Through this process, the group is targeting savings           several variables, including theatre time and equipment usage,
of approximately £20 million per annum over the medium                       type of patient recovery room, total length of stay, and
term. Mediclinic is utilising its global skills base by transferring         medication and consumables used while in hospital.
cancer specialists from the Swiss operation to the UAE to
                                                                             In contrast, pricing in Switzerland and Abu Dhabi is fixed per
assist in setting up a world-class cancer centre at
                                                                             procedure with all service providers (surgeon, anaesthetist,
Mediclinic City Hospital in Dubai.
                                                                             hospital, etc) allocated a portion thereof. Dubai is following

 A brief history of Mediclinic International

      1983            1986         1995                    2006             2007                           2012                   2015                   2016

   Founded by     Listed on the      Strong growth in SA via        Acquisition of leading             Buyout of              Acquired a           Expansion into
  Rembrandt in    JSE Securities     organic expansion and          Swiss hospital group                minority            29.9% minority            Abu Dhabi
   South Africa     Exchange        acquisition of 37 hospitals          Hirslanden                  shareholders in          interest in          via acquisition
                                                                                                       Mediclinic          Spire Healthcare           of Al Noor
                                                                                                       Middle East             in the UK          Hospitals Group,
                                                                                                                                                     leading to a
                                                                                                                                                  secondary listing
                                                                  Entered Dubai by acquiring                                                        on the London
                                                                     a controlling interest                                                        Stock Exchange
                                                                    in Emirates Healthcare,
                                                                  subsequently rebranded to
                                                                     Mediclinic Middle East

                                                                          Source: Mediclinic annual reports and investor presentations, Kagiso Asset Management research
suit and implementing a similar tariff system. This pricing               order to attract a more premium patient base has been
        structure incentivises providers to be more efficient, as any             challenging. It has also had a material impact on the financial
        additional costs incurred beyond what is included in the tariff           performance of the UAE operations since acquisition.
        calculation are not recoverable. There are no laws requiring
                                                                                  By March 2023, Mediclinic International is expected to have
        independence between the various healthcare functions. By
                                                                                  around 1,100 hospital beds in the UAE, a 43% increase since
        vertically integrating services and directly employing doctors,
                                                                                  March 2018. This should result in substantial earnings growth
        hospitals can in effect receive the full tariff and control all cost
                                                                                  over the medium to long-term. In the short term, occupancy
        elements, maximising overall profit per procedure. Hirslanden
                                                                                  will be low, and costs will rise as these facilities are opened.
        and Mediclinic ME employ doctors and perform radiology and
                                                                                  This is expected to offset some of the benefits of the recovery
        laboratory services, although Hirslanden also relies heavily on
                                                                                  in Abu Dhabi (graph below).
        independently contracted doctors.
                                                                                  Increased competition poses a threat to how quickly the group
        Dissecting the UAE position
                                                                                  can fill these beds, however, Mediclinic’s brand strength is a
        Following the acquisition of Al Noor Hospitals Group, substantial
                                                                                  competitive advantage which is expected to assist the group in
        work was required to align their Abu Dhabi operations with
                                                                                  navigating this journey. Furthermore, Mediclinic’s investment
        Mediclinic’s existing business in Dubai. Doctors in Abu Dhabi
                                                                                  in an extensive network of primary care and outpatient
        were receiving commissions on laboratory work and radiology
                                                                                  facilities in prime locations should assist in directing patient
        tests, thereby incentivising them to over-service patients by
                                                                                  referrals to Mediclinic hospitals when specialist care is required.
        ordering more tests than were strictly necessary. Despite this
                                                                                  The group has also worked hard to strengthen their relationship
        being common practice in the UAE, Mediclinic took a firm
                                                                                  with regulators in Dubai and Abu Dhabi. Regulations surrounding
        stance that this was contrary to the group’s values on ethical
                                                                                  clinical quality and appropriate utilisation of services are
        treatment. Doctor remuneration was restructured to remove
                                                                                  expected to be introduced over the medium to longer-term
        any such incentives and, as a result, many of the doctors
                                                                                  and Mediclinic should be well positioned as a net gainer of
        resigned. The process of recruiting new doctors, rebranding
                                                                                  market share when these regulations come into effect.
        hospitals and improving overall quality and service levels in

          Five-year bed expansion plan in the UAE

1,200

                                                                                                                     40                                   1,070
                                                                               100
1,000
                                                  182

 800                 748

 600

 400

 200

   0
              Total UAE beds 2018          Mediclinic Parkview    Airport Road Hospital expansion        Western Region Hospital                   Total beds FY2023
                                            Hospital Dubai                   Abu Dhabi                         Abu Dhabi
                                                                                Source: Mediclinic annual reports and investor presentations, Kagiso Asset Management research
Mediclinic International, in recovery
The graph below illustrates the significant UAE revenue growth Attributing value
in the four years following the opening of the City Hospital in The South African and Middle East businesses have little debt
Dubai in 2009, demonstrating that the local management attached to them and all geographies are highly cash generative.
team has a good track record in filling new capacity. Looking forward, the South African operations are expected to
deliver a steady performance. In the UAE, the worst of the
The Swiss dilemma
restructuring financial impacts appear to be over and
Swiss regulations have recently come into effect to lower
performance is beginning to improve, with contributions to
tariffs and restrict treatment options on certain medical
total group earnings expected to increase meaningfully as
procedures. A large number of operations that were previously
capacity fills.
performed in hospital with overnight stays now need to be
treated as day case surgeries, for a significantly lower fee. While there are substantial concerns around regulation and the
As a result, hospitals are struggling to fill beds and cover performance of the Swiss business, investors are currently
costs. Mediclinic’s Hirslanden business has had to accept a paying a fair price for a stable South African business, purchasing
larger proportion of lower revenue, basic insured patients, the UAE business at a discount and paying next to nothing for
leading to a material decline in profitability. The business is the Swiss business. For this reason, our clients are now invested
struggling to adjust its cost base to cater for the new regulatory in Mediclinic.
environment and there are significant risks of further negative
changes in the medium term. There is, however, substantial
value in the Swiss asset base and the acquisition debt is tied to
the Swiss operations with no recourse to the remainder of the
Mediclinic business. Therefore, despite weak prospects and
high uncertainty, we believe there is little risk of a net
negative contribution to the group.
The evolution of international expansion
Pound
3,500 weakness post 9,000
Brexit vote 8,131
8,000
3,000
6,776 Al Noor 7,000
Swiss acquired**
2,500 regulations
New Dubai hospital
Number of hospital beds
Total revenue £ millions
turn negative 6,000
more than doubles
2,000 UAE capacity
5,000
Hirslanden
and Mediclinic 4,000
1,500
ME acquired
3,000
1,000
1,805 2,000
1,301
500 748
721 1,000
321 382
120
0 0
2007 2008* 2009 2010 2011 2012 2013 2014 2015 2016** 2017 2018
SA revenue Swiss revenue UAE revenue SA hospital beds Swiss hospital beds UAE hospital beds
*Swiss revenue for FY08 has been annualised for comparative purposes. Mediclinic ME was acquired at the beginning of the financial year so no adjustment was required.
**The acquisition of Al Noor occurred just before year end. Therefore, although the number of UAE hospital beds increased in FY16, the revenue impact of the acquisition only came through in FY17.
Source: Mediclinic annual reports and results presentations, Kagiso Asset Management research .
Barloworld - not enough mileage
                             Meyrick Barker - Investment Analyst

South Africans’ interest in Barloworld would be
through renting a car from Avis or Budget, walking
into one of Barloworld’s 45 car dealerships, or seeing
Barloworld-branded trucks traversing our freeways.
On a mining or construction site, the Caterpillar
equipment surrounding you would have been sold
by Barloworld. In days gone by though, this industrial
conglomerate’s offering was significantly broader.

                                                               5
Barloworld - not enough mileage
   Once a South African giant                                                                     Despite significantly streamlining its business offerings, Barlows
   Barloworld, originally “Barlows”, traces its roots to the turn of                              has been a weak economic performer for an extended period,
   the 20th century when Major Ernest (Billy) Barlow established                                  persistently failing to generate adequate shareholder returns
   Thomas Barlow & Sons, in Durban, and began trading in woollen                                  on capital (graph below). Barlows has since chosen to focus on
   goods. His eldest son “Punch”, an engineer by trade, took over                                 what can loosely be called a distribution business (split across
   the business in 1927 and in the same year, Barlows became                                      two divisions, Equipment and Automotive), and a separate
   the South African sales agent for Caterpillar. Legend has it                                   sub-scale Logistics business.
   that Punch’s first sale was attributed to winning a bet with a
                                                                                                  Currently, the group is undergoing a management transition,
   sugarcane farmer that a tractor could out-plough a span of oxen.
                                                                                                  presenting an opportunity for the new CEO (appointed in 2017)
   Barlows listed on the Johannesburg Stock Exchange in 1941 and,                                 to address the poor returns on capital. The search for a
   over the next five decades, rapidly expanded both its geographic                               replacement CFO is ongoing.
   reach and business sector exposure. Stock listings in London and
                                                                                                  Big, yellow machinery
   Frankfurt followed and, by the late 1980s, Barlows was listed in
                                                                                                  Barloworld Equipment generates 55-60% of group profits, with
   the top 100 on the Fortune 500 list of largest global companies.
                                                                                                  exposure to South Africa, Russia and sub-Saharan Africa (in
   At its peak, Barlows was the second largest industrial and mining
                                                                                                  decreasing financial significance).
   company in South Africa, ranking only second to Anglo American.
   Business interests then spanned non-durable consumer goods,                                    The group acts as the independent local distributor, handling
   gold and coal mining, sugar, wood, steel and cement.                                           sales and aftermarket service for the Caterpillar brand including
                                                                                                  their more cost-effective Chinese brand, SEM. Key clients include
   Streamlined but sub-par
                                                                                                  mining and construction firms.
   Beginning in the 1990s, investors increasingly placed pressure on
   diversified industrial conglomerates to simplify. Consequently,                                The global distribution model employed by Caterpillar is a
   household names including Nampak, Plascon, Tiger Brands,                                       means to achieve geographical coverage, while mitigating the
   PPC, Adcock Ingram, Reunert and Illovo Sugar were moved out                                    associated risks. With little capital investment by Caterpillar (the
   of Barlows.                                                                                    original equipment manufacturer, or OEM), a local distributor

           Failure to generate adequate shareholder returns on capital

           3,000
                               Headline earnings     Economic profits*
            2,500

           2,000

                1,500
Rand millions

            1,000

                500

                  0

                -500

          -1,000

           -1,500
                        2002     2003    2004      2005   2006     2007      2008      2009       2010       2011       2012      2013       2014      2015       2016      2017       2018
                                                                    *Positive economic profits are earned when headline earnings exceed the minimum return required by the providers of capital
                                                                                                                               Source: company reports and Kagiso Asset Management research
such as Barloworld is appointed to address regulatory                                                  when interest rates increase, fleet services benefit, but at the
        requirements, invest in growing brand presence, hire and                                               cost of car rental and new car sales.
        manage local employees and handle the peculiarities unique to
                                                                                                               Barloworld is the South African car rental market leader with
        that territory. The distributor must invest in stock to ensure
                                                                                                               their brands, Avis and Budget, enjoying around 40% combined
        that customers can be serviced promptly. This includes
                                                                                                               market share. The fleet business manages 270,000 vehicles on
        deploying capital in potentially higher risk jurisdictions, such as
                                                                                                               behalf of corporates and the South African government.
        the Democratic Republic of Congo, enabling Caterpillar to avoid
                                                                                                               Minimising the holding cost of a vehicle (depreciation/lease
        taking direct exposure. Essentially, the distributor acts as the
                                                                                                               charges/interest) is key to a successful car rental and fleet
        shock absorber for the OEM by suffering the associated working
                                                                                                               management agency. Barloworld have developed a highly
        capital strain when sales slow or customers delay payments.
                                                                                                               efficient online disposal model whereby, within 48-hours of a
        Although, in boom times, the distributor can enjoy significant
                                                                                                               vehicle coming to the end of its rental term, it will be sold to
        profits - returns are typically low over time.
                                                                                                               one of some 3,000 trade buyers. The ability to quickly scale and
        This dynamic was most evident in Barloworld’s Iberian territory,                                       de-fleet the vehicle parc (total number of vehicles considered
        which generated significant profits prior to the financial crisis,                                     collectively) in response to changing demand dynamics, helps
        only to lose money for the eight years thereafter, before                                              to protect the bottom line.
        ultimately being sold (graph below).
                                                                                                               Although new transport options such as Uber pose a risk to
        On the right track                                                                                     short-term rentals, Barloworld typically makes inadequate returns
        The Automotive division, generating 35-40% of group profits,                                           on 1-day corporate rentals. Foregoing market share in this segment
        was originally solely a dealership business - a fixed cost model                                       can be tolerated as the average car rental period is five days.
        that is highly cyclical and struggles to generate consistent
                                                                                                               Barloworld sells approximately 30,000 vehicles per year
        returns. In 2005, Barlows acquired and delisted Avis South Africa
                                                                                                               across their dealership footprint, which includes the likes of
        from the JSE Securities Exchange. The diversification into a
                                                                                                               Barloworld Toyota, NMI Durban South Motors and Barons.
        leasing, rental and fleet management operation provides
                                                                                                               The group favours partnering with OEMs that have a local
        natural hedges within the combined division. For example,
                                                                                                               manufacturing base to minimise currency fluctuation impacts.

                          Iberian Caterpillar distributorship: boom and bust

                                            In periods of strong volumes, a distributor earns high profits
                                  700

                                  600

                                  500
Operating profits rand millions

                                  400
                                                                                                                                                      Decision taken to sell operations
                                  300

                                  200

                                  100

                                    0

                                  -100

                                  -200
                                                                                                                      During periods of weak volumes, a distributor will struggle to cover
                                                                                                                                          their high fixed cost base
                                  -300
                                         2002     2003       2004      2005       2006       2007       2008   2009    2010       2011      2012        2013      2014       2015       2016

                                                                                                                                                                         Source: company reports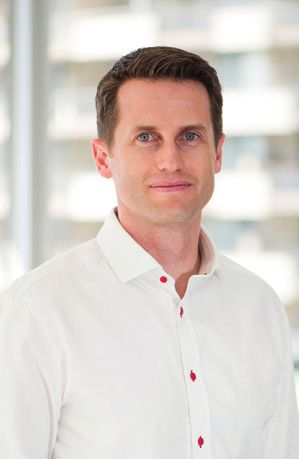
Barloworld - not enough mileage
                       Goods on the move                                                          participation in this deal, with limited alignment to Barloworld
                       Barloworld Logistics was established in 2001 and today includes            shareholder interests and substantial downside protection.
                       the Manline and Timber24 brands. Transport solutions for the
                                                                                                  Optimising the capital base
                       movement of freight, fuel and abnormal loads, as well as supply
                                                                                                  In an effort to improve the return on capital and cashflow
                       chain management services are at the core of the business.
                                                                                                  generated by the business, management are exploring funding
                       Freight forwarding and warehousing solutions are also offered.
                                                                                                  structures that will shift the car and equipment rental funding
                       Having failed to deliver positive economic profits for the past            off balance sheet. Without knowing the details of the transaction,
                       seven years, Barloworld recently considered disposing of this              and importantly, the cost of the targeted off balance sheet
                       division. Extensive changes have also been made to the                     financing, it is unclear whether any shareholder value will
                       management team and operating structure as a final attempt                 be created.
                       to improve the business. Although initial indications are positive,
                                                                                                  Limited growth prospects
                       given the division’s inconsequential size in relation to the group,
                                                                                                  Given South Africa’s economic challenges, it is difficult to see
                       its prospects have limited bearing on the investment case.
                                                                                                  significant growth opportunities across any of Barloworlds’
                       The Khula Sizwe BEE transaction                                            divisions. Particular uncertainty relates to Barloworld Equipment’s
                       A top-up BEE transaction is currently being implemented -                  prospects, which are tied to mining capital expenditure levels.
                       there are two elements to the transaction: 1) the creation of a            Although global mining capital expenditure may grow off the
                       foundation holding 3% of Barloworld shares, and 2) the transfer            current base, existing political and labour dynamics will likely
                       of R2.8 billion of Barloworld property to a black-owned property           result in mining companies continuing to favour investing in
                       company. Positively, the foundation has a permanent                        regions other than Southern Africa. Recent tariffs imposed on
                       shareholding structure and a mandate to focus on poverty                   Russia, the Equipment divisions’ other key territory, risk
                       alleviation, education and youth development. Negatively                   reducing current profits if sustained.
                       though, the cost to shareholders relative to the increase in BEE
                                                                                                  The substantial BEE deal dilution prospects and management
                       shareholding achieved is very high. We are also concerned by the
                                                                                                  conflicts of interest posed by it are a further investment
                       conflicts of interest introduced by the material management
                                                                                                  concern. For these reasons, Barloworld is currently not included
                                                                                                  in our portfolio.
                                  Divisional operating profits for Barloworld

                                  5,000

                                             Equipment    Automotive    Logistics

                                  4,000
Operating profits rand millions

                                  3,000

                                  2,000

                                  1,000

                                     0
                                          2006     2007     2008       2009         2010   2011   2012      2013          2014          2015         2016          2017          2018
                                                                                                                   Note: Discontinued operations have been excluded from prior year results
                                                                                                                                                                 Source: company reports
A maturing steel market
Mandi Dungwa - Portfolio Manager
China produces more than half of the world’s steel, and
as its demand outlook for steel is set to decline due to
changes in its economic structure, this presents the
single largest threat to medium to long-term steel, and
therefore, iron ore demand.
9A maturing steel market
Iron ore is one of the most abundant elements on earth and is global seaborne market. An estimated 63% of global iron ore
the primary component used in the production of steel. To supply is not consumed in the country in which it is produced,
better understand its expected future price levels, we delve requiring transportation by sea to its final destination. This
into the supply and demand dynamics for iron ore in relation exported iron ore forms the “seaborne market”.
to developing economies.
The four key iron ore producers include: Rio Tinto, BHP Group,
Nearly all the earth's major iron ore deposits are in rocks that Fortescue Metals (all Australian), and Vale (Brazilian).
formed over 1.8 billion years ago. Then, the oceans contained As per the graph below, Australia evidently has the largest
abundant dissolved iron, but without the oxygen needed for global iron ore reserves (29% of total) and currently produces
oxidation. Iron ore deposits began forming when the first 37% of the global annual total. Brazil, China and Russia also
organisms capable of photosynthesis started to release have large reserves, yet the quality of their ore differs
oxygen into the waters. The oxygen immediately combined significantly by way of the concentration of iron found per
with the dissolved iron to produce iron oxides, or iron ore. tonne of ore. The graph on the following page illustrates that
Brazilian ore contains considerably more iron than the
While iron makes up 6% of the earth’s crust and entire core, it
Australian variant, making Vale the largest producer of
does not occur in nature in a useful metallic form. It is only
high-quality iron ore products.
through the process of smelting that a usable form of iron can
be derived from iron ore. Anglo American, the sixth largest seaborne iron ore producer -
comprising Kumba Iron Ore (South Africa) and Minas Rio (Brazil)
Quality vs quantity
- also produces high quality ore products, yet only makes up 5%
Despite its abundance, the iron ore market has a high supply
of the seaborne market. South Africa has a small proportion of
concentration, with only four top producers accounting for
global reserves (1%), but together with India (5%), has the
49% of annual production in 2017 and more than 70% of the
2017 iron ore reserves by country
China
12% South Africa
India 1%
5%
Rest of the world
25%
Russia
15%
Australia
29%
Brazil
13%
Source: US Geological Surveyhighest iron contained per tonne of iron ore mined. This proves From mine to market
advantageous in that South African producers receive a higher Mining iron ore takes place in large, open pits - a method that
price for their product, and therefore, more revenue per tonne requires the clearing of soil and overlaying rock above the ore
of iron ore. body to access the ore beneath it. This movement of waste
matter is called stripping and a stripping ratio is the ratio
China imports 71% of the seaborne iron ore supply, making it
of waste material required to be moved in order to extract a
the most significant global consumer of iron ore. Seaborne
tonne of ore. The higher the stripping ratio, the higher the
producers sell the bulk of their volumes to Chinese customers
operational costs, which are based primarily on the mass of
and since these volumes are transported by sea into China,
material mined. Kumba Iron Ore (Kumba) exhibits a higher
freight costs are significant relative to the cost of mining the
stripping ratio as they move four tonnes of waste to access
ore. Based on their proximity to China, Australian producers
one tonne of ore, compared with lower cost competitors in
benefit from structurally lower freight costs, while South
other countries who, on average, move two tonnes of waste
African and Brazilian producers experience the opposite given
per tonne of ore.
their greater distance from China. South African iron ore
mines also typically pay high rail costs to transport ore to the Following successful extraction, the ore is transported to the
ports. South African producers are compelled to use Transnet, nearest port, bound for its destination via sea. The logistical
the state-owned rail operator, who charges comparatively costs to transport ore from the Northern Cape, where Kumba
high railage rates. As such, costs incurred by South African and some of its South African peers operate, to the port at
producers cannot compete with their Australian or Brazilian Saldanha Bay, is comparable to the freight cost from
counterparts. South Africa does, however, have the competitive Saldanha Bay to China. Kumba pays this rail cost to Transnet,
advantage of producing better quality ore, resulting in the who manage and operate the rail line. Competitor miners in
ability to fetch higher prices. This offsets the higher transport other countries tend to own their own autonomous
costs to some degree. locomotives, affording them control over railage costs.
Iron contained per tonne of iron ore production
60%
50%
40%
30%
20%
10%
0%
India South Russia Brazil Australia Rest of China
Africa the world
Source: US Geological SurveyA maturing steel market
Furthermore, Kumba is subjected to irregularities by Transnet, more consumer-related demand. As indicated below, China’s
such as derailments and inadequate maintenance of bridges end market demand picture is set to gradually change to
and tracks. These irregularities result in logistical insecurity, accommodate the economic growth transition from being an
high inventories and ultimately, lower realised revenues. investment-led economy to more of a consumer-led economy.
This presents the single largest threat to medium to long-term
Maturing demand
steel, and thus, iron ore demand.
Global steel demand growth is linked to global Gross Domestic
Product (GDP) growth, but there are regional differences. China Despite a stable supply outlook, a structurally declining demand
produces more than half of the world’s steel and is therefore a trend, particularly related to China transitioning towards more
large consumer of iron ore. Chinese steel demand is largely consumer-led economic growth will, in our view, result in lower
derived in construction and infrastructure development, while iron ore prices in future.
other industrialised countries show higher demand from the
Considering this, we maintain a limited exposure to iron ore
automotive, machinery and engineering markets.
miners in our portfolios. However, we are currently invested in
Steel is seen as an early development raw material that is high African Rainbow Minerals, which has material exposure to
in demand in the initial phases of economic development, iron ore through the Assmang joint venture, in which we
urbanisation and industrialisation. Late development raw continue to find value.
materials such as diamonds, platinum group metals and oil have
OECD* countries’ steel end market demand China steel end market demand
Other
Other 14%
17%
Machinery
26%
Machinery
21% Construction &
infrastructure
Domestic 56%
appliances Construction &
4% infrastructure
34%
Automobiles
Shipbuilding 18%
1%
Domestic
appliances
2%
Shipbuilding
2%
Automobiles
5%
*Organisation for Economic Co-operation and Development
Source: World Steel, CRU, Steel Business Briefing Source: World Steel, CRU, Steel Business BriefingTower power
Simon Anderssen - Portfolio Manager
With the demand for data on the rise globally, mobile
networks are poised for expansion and independent
tower companies are standing by to benefit from
this growth.
13Tower power
Tower companies own infrastructure assets that are leased out Building density and natural obstructions - the reflection
to mobile network operators and are gaining significance as and absorption of radio energy by buildings and vegetation
operators look to improve their return on capital, as regulators can be mitigated by densifying the mobile network.
seek to promote competition and as investors pursue reliable The spectrum used - high frequency mobile spectrum is able
yield generating investments. We explore these developments to travel far yet cannot penetrate obstacles such as buildings,
together with a glance at the global picture. and vice versa for low frequency spectrum.
Tower ins and outs As mobile networks become more data-centric, moving from
A mobile telephone network comprises hundreds of locations 2G to 4G (and eventually 5G), operators are likely to densify their
hosting radio network equipment that sends and receives tower networks to further cope with greater data demands.
wireless communication between the user’s handset and the
Introducing a landlord
network. South Africa is home to more than 28 000 base
In mature markets, some operators have shifted from
stations, with the highest concentration in urban areas.
differentiating themselves by network quality, to focus rather
Radio equipment is generally hosted on a tower, or elevated on services like bundled fixed-fibre and entertainment content.
location on a building, to ensure that radio frequency signals are This, however, is also notably capital intensive. Operators have
seamlessly transmitted and received. The towers are physically therefore sought to raise capital by selling their network towers
connected to a central hub, usually by way of a dedicated to independent tower companies and entering into long-term
fibre connection. Traditionally, mobile network operators have rental agreements.
evolved by establishing a physical network for their proprietary
Tower companies own the physical location or sites that host
use - a highly capital intensive undertaking.
the enabling structure, which is then leased to the mobile
The number of towers in an area will depend on: network operators on a long-term basis, with the network
The quantity of data traffic - higher consumption requires operator responsible for installing and maintaining its
more data equipment. necessary radio equipment (chart below).
Ownership components of tower sites
Owned by tower company Tenant
Tower structure: normally built with the capacity to support
four tenants Tenant
Land: owned or leased on a long-term basis Tenant
Generators are sometimes owned by the tower company to help
facilitate back-up power for the site’s tenants
Tower
Owned by tenants
Tenant
Antenna equipment, including microwave equipment
Tenant shelters containing base station equipment and heating,
ventilation and cooling (HVAC), which tenants own, operate and maintain
Tower
Network cables
Source: American TowerHistorically, a tower was built for the sole use of a mobile increases free cashflow. This is due to the large recurring capital
network operator, yet it could often accommodate multiple outlays required to build and maintain new towers being
tenants. Since fixed costs such as grounds rental, taxes and site exchanged for an expense (rent), which enables the operator
maintenance account for almost half of operational costs, to improve its return on capital employed and to invest in new
accommodating multiple operators on a single tower presents growth opportunities.
a means to increase return on investment for the owner (left
Furthermore, the operator may benefit from the tower
graph below). Therefore, as with any other landlord, the key
company’s ability to amortise operating costs across a larger
function of a tower company is to maximise occupancy by
portfolio of towers, and potentially to achieve a lower cost of
increasing the number of tenants or equipment on each tower.
funding for these assets by taking on more debt than the
Tower companies not only acquire existing towers but also operator could.
develop new towers for mobile network operators. This involves
The disadvantages of selling a tower portfolio include increased
long-term development plans for imminent network rollouts
operating complexity as additional stakeholders assert rights
or upgrades to future generations of equipment, which may
over assets that were once proprietary, and the potential to
require a denser network.
increase competition by enabling competitors access to key sites.
The operating model of a tower company is therefore attractive
The global tower landscape
to many investors, owing to the revenue stream secured by
Only 60% of the world’s 3.4 million towers are independently
long-term rental agreements against high quality tenants, with
owned and there are varying degrees of independent tower
the additional prospect of further growth through increasing
ownership across regions (graph on following page).
tenancy across the portfolio.
In data dominant markets, such as in the United States, mobile
What’s in it for the operator?
operators have sold and leased most of their towers to tower
For the network operator, separating infrastructure assets from
companies. For example, Verizon and AT&T have leased more
the customer-facing part of the business releases capital and
Comparison of ROI* of newly built towers The South African tower industry
40% 700
691
US 32% 32% 2,575 340
Latin America 275
30% 6,500
Africa
Asia 24% 25%
23%
21%
20%
17%
13% 13%
11% 7,000 10,500
10% 9%
3%
0%
One tenant Two tenants Three tenants MTN Vodacom Gyro Towers American Tower
US Latin Africa Asia Cell C Atlas Tower Sentech Smaller towercos*
America
Typical tower $250 – $85– $60 – $20 –
construction cost $300K $170K $120K $30K *Includes International Tower Corp, Eagle Towers, Coast to Coast, Blue Sky Towers,
Pro High Site Communications, Sky Coverage and Comco
*Return on investment Source: American Tower Source: TowerXchangeTower power
than 90% of their towers from independent tower companies Ownership of towers in South Africa is concentrated among
such as American Tower and Crown Castle. mobile operators (right graph on previous page) with MTN
owning the largest portfolio of towers, currently totalling
As evidenced below, China and India tower companies are
10 500. Although the number of towers is expected to grow
also well established. The Indian telecommunications sector
rapidly to accommodate the increase in data demand, the
realised dramatic growth from the late 1990s as subscriber
largest operators are not expected to divest of their tower
numbers grew rapidly and operators expanded services amid
portfolios in the near term.
hyper-competitive pricing pressures. As a result, operators
began to sell and leaseback tower infrastructure as well as Our global funds are invested in Sarana Menara, Indonesia’s
outsource network management, information technology and largest independent tower company. Indonesia is an attractive
call centres - all previously regarded as core strategic activities. market because of its large, young population and relatively
Indian tower companies have since become regarded as global low level of data consumption. Continued high rates of income
industry leaders. growth are expected to sustain significant increases in data
demand that will require the expansion and densification of
Europe, although also considered a mature market, has been
mobile networks across the complex archipelago nation.
slow to accept independent tower companies. Instead,
Sarana Menara is well positioned to benefit from this growth
regulation has encouraged operators to form partnerships to
because it owns the largest portfolio of independent towers,
share their infrastructure based on the potential to reduce
with the tenancies on these towers being relatively low. The
costs across the entire infrastructure network.
company already generates sufficient cashflow to fund a
Africa’s tower ownership has been affected by over 30 tower meaningful dividend and its strong balance sheet can support
transactions in the past six years, yet third-party ownership is continued investments.
still estimated to be between 10-15% of the total market.
Global tower landscape - total sites as of July 2016
Only 60% of towers are independently owned across the globe, versus over 90% in the US and China
100% 62% 90% 2% 56% 14% 6% 12% 72% 47% 30% 14% 93% 60%
422
Mobile operator held towers
1,539 262 2,000
Independently owned towers
Thousands
150
85 76 1,400
67 60
160 135 2 54
10 47 45
43 4 37
83 6 29 27
58 57 34 21 11
34 48 4 25
9 13 24 26 25 2
China India US Germany Indonesia France Russia Spain Brazil Italy UK South Africa Mexico World
Source: company data, Morgan Stanley researchKagiso Asset Management Funds
2 3
Performance to 31 March 2019 1 3 1 5 1 10 1 Since 1 Launch TER TC
year years years years launch
Unit trust funds 4
Equity Alpha Fund 13.7% 7.7% 5.3% 13.7% 16.4% Apr-04 1.96% 0.46%
SA Equity General funds mean 1.0% 2.2% 3.7% 11.4% 12.7%
Outperformance 12.7% 5.5% 1.6% 2.3% 3.7%
Balanced Fund 12.3% 8.0% 6.4% - 9.1% May-11 1.53% 0.50%
SA Multi Asset High Equity funds mean 5.7% 3.8% 5.5% 8.4%
Outperformance 6.6% 4.2% 0.9% 0.7%
Protector Fund 13.5% 8.9% 6.7% 8.2% 9.8% Dec-02 1.57% 0.40%
CPI + 4%* 8.3% 9.4% 9.7% 10.0% 10.5%
Outperformance 5.2% -0.5% -3.0% -1.8% -0.7%
Stable Fund 13.5% 9.1% 7.7% - 8.5% May-11 1.52% 0.50%
Total return of CPI+2% pa 6.3% 6.5% 6.1% 5.8%
Outperformance 7.2% 2.6% 1.6% 2.7%
Institutional funds5
Managed Equity Fund (SWIX) 11.8% 6.8% 4.2% 13.5% 11.3% Sep-06
FTSE/JSE SWIX All Share Index 0.4% 3.7% 6.2% 14.2% 11.5%
Outperformance 11.4% 3.1% -2.0% -0.7% -0.2%
Managed Equity Fund (Capped SWIX) 10.9% - - - 7.2% Jan-17
FTSE/JSE Capped SWIX Index -2.6% 3.4%
Outperformance 13.5% 3.8%
Domestic Balanced Fund 12.1% 8.7% 5.4% 11.2% 8.5% May-07
Peer median6 2.0% 5.5% 6.0% 12.3% 9.1%
Outperformance 10.1% 3.2% -0.6% -1.1% -0.6%
Global Balanced Fund 14.3% 9.4% 7.6% - 9.7% Jul-13
Peer median7 6.3% 5.5% 7.1% 9.1%
Outperformance 5.0% 3.9% 0.5% 0.6%
Bond Fund 5.3% 11.3% - - 9.3% Aug-15
BESA All Bond Index 3.5% 10.1% 8.1%
Outperformance 1.8% 1.2% 1.2%
Money Market Fund 8.3% 8.5% 8.0% 7.2% 7.9% Jan-04
Alexander Forbes STeFI Composite Index 7.3% 7.4% 7.0% 6.6% 7.4%
Outperformance 1.0% 1.1% 1.0% 0.6% 0.5%
Sharia unit trust funds 4
Islamic Equity Fund 10.3% 9.2% 5.7% - 11.2% Jul-09 1.44% 0.26%
SA Equity General funds mean 1.0% 2.2% 3.7% 10.6%
Outperformance 9.3% 7.0% 2.0% 0.6%
Islamic Balanced Fund 8.1% 6.7% 5.1% - 6.9% May-11 1.49% 0.17%
SA Multi Asset High Equity funds mean 5.7% 3.8% 5.5% 8.4%
Outperformance 2.4% 2.9% -0.4% -1.5%
Islamic Global Equity Feeder Fund - - - - Not yet available Jan-19
Global Equity General funds mean
Outperformance
Islamic High Yield Fund - - - - Not yet available Mar-19
Short-term Fixed Interest Index (STeFI)
Outperformance
Highest and lowest monthly fund performance Highest Lowest Highest Lowest Highest Lowest Highest Lowest Highest Lowest
Equity Alpha Fund 3.8% -3.7% 6.6% -6.0% 8.2% -6.0% 10.3% -6.0% 11.9% -9.0%
Balanced Fund 3.0% -2.9% 4.8% -3.5% 5.5% -4.2% - - 6.2% -4.2%
Protector Fund 2.6% -1.5% 2.6% -2.4% 3.4% -4.2% 4.9% -4.2% 9.5% -5.3%
Stable Fund 2.4% 0.3% 2.5% -0.9% 3.8% -3.5% - - 4.0% -3.5%
Islamic Equity Fund 3.9% -2.2% 5.3% -3.2% 7.3% -4.6% - - 8.1% -4.9%
Islamic Balanced Fund 3.6% -2.4% 4.0% -2.5% 4.6% -3.0% - - 8.2% -5.4%
Footnote and disclaimer follow overleaf.
17Kagiso Asset Management (Pty) Limited
Fifth Floor MontClare Place
Cnr Campground and Main Roads
Claremont 7708
PO Box 1016 Cape Town 8000
Tel +27 21 673 6300 Fax +27 86 675 8501
Email info@kagisoam.com
Website www.kagisoam.com
Kagiso Asset Management (Pty) Limited is a licensed financial services provider
(FSP No. 784). Reg No. 1998/015218/07.
Footnote: 1 Annualised (ie the average annual return over the given time period); 2 TER (total expense ratio) = % of average NAV of portfolio incurred as charges, levies and fees in the management
of the portfolio for the rolling three-year period to 31 March 2019; 3 Transaction costs (TC) are unavoidable costs incurred in administering the financial products offered by Kagiso Collective
Investments and impact financial product returns. It should not be considered in isolation as returns may be impacted by many other factors over time including market returns, the type of
financial product, the investment decisions of the investment manager and the TER. This is also calculated on the rolling three-year period to 31 March 2019; 4 Source: Morningstar; net of all costs
incurred within the fund and measured using NAV prices with income distributions reinvested; 5 Source: Kagiso Asset Management; gross of management fees; 6 Median return of Alexander
Forbes SA Manager Watch: BIV Survey; 7 Median return of Alexander Forbes Global Large Manager Watch.* CPI + 4% from 1 May 2018 (previously: Risk adjusted returns of an appropriate SA large
cap index).
Disclaimer: The Kagiso unit trust fund range is offered by Kagiso Collective Investments (RF) Limited (Kagiso), registration number 2010/009289/06. Kagiso is a member of the Association for Savings
and Investment SA (ASISA) and is a registered management company in terms of the Collective Investment Schemes Control Act, No 45 of 2002. Kagiso is a subsidiary of Kagiso Asset Management
(Pty) Limited [a licensed financial services provider (FSP No. 784)], the investment manager of the unit trust funds. Unit trusts are generally medium to long-term investments. The value of units
will fluctuate and past performance should not be used as a guide for future performance. Kagiso does not provide any guarantee either with respect to the capital or the return of the portfolio(s).
Foreign securities may be included in the portfolio(s) and may result in potential constraints on liquidity and the repatriation of funds. In addition, macroeconomic, political, foreign exchange, tax and
settlement risks may apply. However, our robust investment process takes these factors into account. Unit trusts are traded at ruling prices and can engage in scrip lending and borrowing. Exchange
rate movements, where applicable, may affect the value of underlying investments. Different classes of units may apply and are subject to different fees and charges. A schedule of the maximum
fees, charges and commissions is available upon request. Commission and incentives may be paid, and if so, would be included in the overall costs. All funds are valued and priced at 15:00 each
business day and at 17:00 on the last business day of the month. Forward pricing is used. The deadline for receiving instructions is 14:00 each business day in order to ensure same day value.
Prices are published daily on our website. Performance is based on a lump sum investment into the relevant portfolio(s) and is measured using Net Asset Value (NAV) prices with income
distributions reinvested. NAV refers to the value of the fund’s assets less the value of its liabilities, divided by the number of units in issue. A feeder fund is a portfolio that invests in a single portfolio
of a collective investment scheme, which levies its own charges and which could result in a higher fee structure for the feeder fund. Figures are quoted after the deduction of all costs incurred within
the fund. Individual investor performance may differ as a result of initial fees, the actual investment date, the date of reinvestment and dividend withholding tax. Kagiso may close a portfolio to new
investors in order to manage it more effectively in accordance with its mandate. Please refer to the relevant fund fact sheets for more information on the funds by visiting www.kagisoam.comYou can also read