July 2020 Kagiso Asset Management Quarterly - Trawling for opportunity pg 1 Best-laid plans for SA's private hospital groups pg 5 Nokian treads ...
←
→
Page content transcription
If your browser does not render page correctly, please read the page content below

July 2020
Kagiso Asset Management
               Quarterly

    Trawling for opportunity pg 1 Best-laid plans for SA's private hospital groups pg 5
                             Nokian treads confidently pg 13

                                  www.kagisoam.com
1 Trawling for opportunity   Dirk van Vlaanderen

                5 Best-laid plans for SA’s private hospital groups   Sarah le Roux

               9 Kinder Morgan’s resilience    Abdul Davids

              13 Nokian treads confidently     Sheldon Kisten

              17 Performance table

Unconventional thinking
Trawling for opportunity
                   Dirk van Vlaanderen - Associate Portfolio Manager

For thousands of years, humans have relied on fishing
to provide a reliable and sustainable food source.
Today, commercial fishing has morphed into a global
industry, with significant barriers to entry and large
amounts of capital investment required.

We explore the South African fishing industry and
consider its ability to meet the insatiable global
demand for wild-caught fish.

                                                                       1
Trawling for opportunity
   Give a man a rod                                                                                South Africa’s marine resources have generally been well
   The global demand for fish continues to grow unabated                                           managed, with quotas allocated to rights holders on a
   as population growth, rising income levels and increasing                                       10- to 15-year basis. This allows rights holders sufficient time
   awareness of the health benefits of eating fish (relative to                                    to earn a suitable return on the significant capital investment
   other animal proteins) make it a popular choice. The supply                                     required to fund large seagoing vessels and establish processing
   of wild-caught fish has plateaued since the mid-80s                                             facilities onshore. Each year, the Total Allowable Catch (TAC) per
   (left chart below), as overfishing and poor marine resource                                     species is determined based on the health of the biomass - the
   management saw supply unable to keep up with increased                                          size and number of the population of any given species. Quota
   demand. The rise in fish-farming, or “aquaculture”, has largely                                 holders are permitted to catch their allocated share of the TAC,
   filled the gap between the supply and demand for fish protein,                                  of which a large portion is exported.
   now contributing around 45% of fish consumed.
                                                                                                   The fisheries that generate the largest revenues are tabled on
   The South African fishing industry                                                              the next page and detailed per species as follows:
   The wild-caught fishing sector in South Africa falls under                                          Hake is by far the largest fishery, generating revenues in
   the remit of the Department of Environment, Forestry and
                                                                                                   °   excess of R5 billion per annum. South Africa’s hake resource
   Fisheries (DEFF) and includes the recreational, commercial and                                      has been certified as “blue label”, or sustainable, by the
   small-scale fishing sectors. The biggest economic contributor                                       Marine Stewardship Council (MSC) - a designation that sets
   is the commercial fishing sector, comprising 22 different                                           it apart from other hake resources around the world.
   fisheries - the largest of which are discussed in more detail                                       Sea Harvest and I&J are the two largest companies with
   herein. We estimate that the fishing industry generates over                                        local retail brands and around 60% of their product is
   R25 billion in revenues and employs over 27 000 direct                                              exported to Europe and Australia. Cape hake is regarded as a
   employees, particularly from rural communities and smaller                                          premium product in Europe and Australia based on taste
   seaside towns.                                                                                      and its MSC blue label status, and is sought after by

           Global fish supply                                                                       Abalone farm

                                                                                  Forecast
                 200
                              Wild-caught fish
                 180
                              Aquaculture
                 160

                 140

                 120
Million tonnes

                 100

                 80

                 60

                 40

                 20

                  0
                      1950 1956 1962 1968 1974 1980 1986 1992 1998 2004 2010 2016 2022E

                                                  Source: FAO, Kagiso Asset Management estimates                                               Source: globalafricanetwork.com
restaurants and retailers. The large, deep-sea vessels                  South African caught squid is exported to Southern Europe
       required, coupled with the significant investment behind                and Japan, where it is known as calamari.
       onshore processing facilities, makes this the most capital              Horse mackerel is predominantly found off the south coast
       intensive of all the fisheries.
                                                                           °   of Southern Africa and are usually frozen whole once
       Small pelagic fish (sardines/pilchards and anchovies) are               caught. It is sold as a relatively cheap form of protein,
°      caught using multi-purpose vessels, typically in shallower              mainly in South Africa and other African countries
       water than hake. South Africa’s pilchard resource is at a               (Cameroon, Nigeria, DRC, Mozambique and Angola) where
       critically low level, however, recent improvements in the               it is used to make fish stew. Exports into Africa are typically
       biomass are encouraging signs of a recovery. Pilchards are              priced in US dollars, with rapid payment terms that produce
       mostly canned and sold in South Africa and neighbouring                 good cash flow.
       African countries. The biggest brand, Lucky Star (owned by
                                                                           Sustainable opportunity in aquaculture
       Oceana), has had to adapt its model to account for the low
                                                                           Aquaculture refers to the farming of fish and other organisms
       supply of South African pilchards and is now the largest
                                                                           in a controlled environment, in either fresh or saltwater. This
       buyer of pilchards in the world - sourcing them from all over
                                                                           has seen significant investment in South Africa in recent years
       the globe to be canned in South Africa. Locally caught
                                                                           and, in 2019, aquaculture generated an estimated R1.1 billion in
       anchovies are used as a protein source in the production
                                                                           revenue. Unlike commercial fishing, it does not operate under a
       of fishmeal (used in animal feed) and fish oil (used for
                                                                           quota or TAC regime.
       aquaculture) that is sold in East Asia, Europe and the
       Middle East. Interestingly, the anchovies for sale in               South African aquaculture produces mussels, oysters, seaweed,
       South Africa are imported from Europe.                              abalone and dusky kob as saltwater species, and tilapia, barbel
       Squid is normally caught in smaller boats, close to shore,          and trout in freshwater. Abalone is unquestionably the largest
°      using lines. The biomass can vary significantly from year           value contributor to the aquaculture industry. It is farmed in
       to year, making it a more unpredictable catch. Almost all           tanks along the coast (right chart on previous page) utilising
                                                                           fresh sea water that is pumped through the hatcheries.

    Major South African fisheries

    Fish type                                                          Main markets                        Commonly served as

                                                                                                                         Fish and chips
                                                                       Europe, Australia, the US and
    Hake                                                                                                                 Fish fingers
                                                                       South Africa
                                                                                                                         Hake fillets
Small pelagic fish

                                                                       Canned pilchards: South Africa
                     Sardine (pilchard)                                                                                  Canned pilchards
                                                                       and SADC countries

                                                                       Fishmeal: East Asia (China                        Used for fishmeal and
                     Anchovy                                           and Japan), Europe and the                        fish oil as an ingredient
                                                                       Middle East                                       in animal feed

    Squid                                                              Southern Europe and Japan                         Calamari

                                                                       South Africa (mainly
    Horse mackerel                                                     Northern Cape) and other                          Fish stew
                                                                       African countries

                                                                                                          Source: FishSA, Kagiso Asset Management research
Trawling for opportunity
South African abalone is a highly sought-after, premium                    exposure to the wholesale fishing channel and its
species, which is the reason for the rampant levels of poaching            aquaculture business is in the process of ramping up
along our shorelines. It is mainly sold to China, either canned,           production volumes. Additionally, the acquisition of the
frozen or fresh.                                                           Ladismith Cheese Company in 2018 has enabled
                                                                           Sea Harvest to generate around 20% of revenues from
Recent riots in Hong Kong and the impact of restaurant
                                                                           dairy products (mainly cheese) sold in South Africa.
closures in China during the Covid-19 pandemic have seen
                                                                           Oceana’s biggest exposure is to pilchards through the
significant disruption to exports, resulting in near-term             °    “Lucky Star” brand, and fishmeal through its US-domiciled
pressure on profitability for abalone producers. The demand
                                                                           Daybrook business and South African fishmeal operations.
for South African abalone is, however, likely to remain strong
                                                                           Hake and horse mackerel make up the balance of this more
when markets recover and the future potential for this
                                                                           diversified specie exposure.
industry continues to be bright.
                                                                           Premier Fishing is mostly exposed to deep-sea lobster and
Quite a catch
                                                                      °    squid, both of which are predominantly exported.
South Africa has several JSE-listed commercial fishing companies,
                                                                      Fishing for returns
each with their own unique mix of species and end markets
                                                                      The finite supply of wild-caught fish, with increasing demand,
(charted below).
                                                                      suggests an attractive outlook for those companies that are
     I&J forms part of the AVI group and has a large exposure to
°    hake through its well-known South African brand and
                                                                      able to profitably meet this demand. While fishing relies on
                                                                      uncontrollable factors such as the weather and health of the
     export business. It includes an established abalone business
                                                                      biomass, fishing companies are likely to deliver decent returns
     that contributes around 15% to its fishing profits.
                                                                      to shareholders through the cycle. Considering this, we hold
     Sea Harvest also has a large exposure to hake. The acquisition
°    of the Viking Seafood business in 2019 resulted in greater
                                                                      shares in Oceana and Sea Harvest on behalf of our clients.

    Revenue by geography                                                  Revenue by species

    100%                                                                  100%

     80%                                                                   80%

     60%                                                                  60%

     40%                                                                   40%

     20%                                                                   20%

      0%                                                                   0%
               I&J       Sea Harvest      Oceana   Premier Fishing                  I&J         Sea Harvest         Oceana       Premier Fishing

              Export markets    South Africa                                       Hake                    Horse mackerel           Fishmeal
                                                                                   Squid                   Lobster                  Aquaculture
                                                                                   Pilchards               Dairy                    Other

                                                                                               Source: company reports, Kagiso Asset Management estimates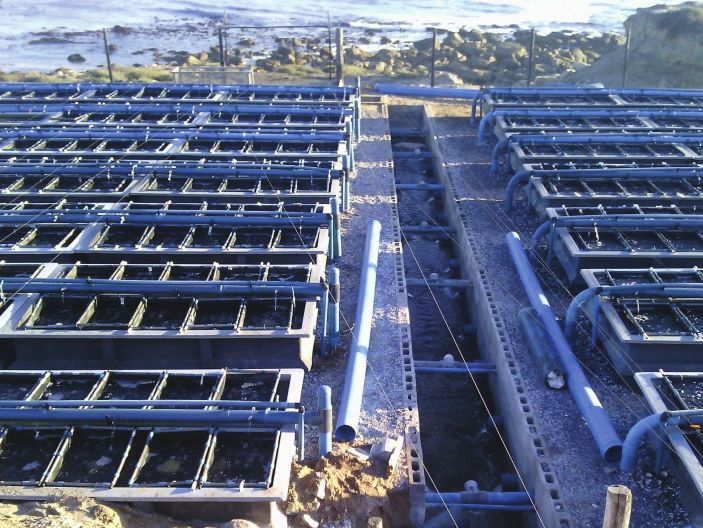
Best-laid plans for SA’s private
hospital groups       Sarah le Roux - Investment Analyst

The Covid-19 pandemic has not evolved as initially
expected and the impact on the South African private
healthcare sector has been complex. We investigate the
potential longer-term implications of the pandemic’s
fallout on the operations of South Africa’s big three
hospital groups: Life Healthcare, Netcare and Mediclinic.

                                                        5
Best-laid plans for SA’s private hospital groups
Preparing to peak in hospital utilisation over the short term. Consequently, all three
The lockdown measures that were introduced in March 2020 listed hospital groups made deep losses for April, while level five
impacted admissions to private hospitals on multiple levels: lockdown measures were in place. Patient volumes began to rise
Social distancing practices greatly reduced the seasonal gradually in May as regulations eased and pent-up demand for
° spread of flu and other viruses, thereby reducing the number urgent surgical procedures started to manifest.
of medical cases admitted to hospital. The left chart below
Which way will the pendulum swing?
contrasts the proportion of Ampath's respiratory viral cases
While the peak of the pandemic in South Africa was expected
that tested positive in April 2020 relative to the prior year.
sometime between July and September, its potential size and
Restrictions on alcohol sales in lockdown levels five and
° four, coupled with fewer cars on the road, materially
intensity was unknown and the possibility of further waves
remains as such. In the lead up to the peak, private hospitals
reduced trauma case volumes. The right chart below
continued to operate at sub-optimal capacity utilisation levels
indicates the dramatic decline in weekly deaths from
with empty beds reserved for Covid-19 patients.
unnatural causes in April and May relative to expectations
based on historical data from 2018 and 2019. Over the peak, higher occupancy levels are expected to have led
Freeing up hospital capacity for the imminent arrival of to a more efficient use of hospital assets, which should have
° Covid-19 patients led to a widespread delay in surgical cases. restored profitability to some extent - even where public patients
were treated on a cost recovery basis. However, where Covid-19
The lockdown restrictions resulted in an almost 3-month
cases replaced more lucrative surgical procedures, or where
delay in the influx of Covid-19 patients relative to earlier
medical admissions covered by private medical aid were
forecasts. Therefore, despite hospitals remaining open
replaced by government patients treated at cost, the net impact
throughout lockdown, occupancy levels were significantly
on profit margins is expected to have been negative.
down over the period compared to prior years.
To date, South African public sector hospitals have managed
Over half of a hospital’s operating costs are fixed or staff-related,
remarkably well with limited assistance from the private
limiting the opportunity to adapt the cost base to reductions
Ampath respiratory viral case statistics comparison SA weekly deaths from unnatural causes
35% 1,400
33 33
April 2019 April 2020 Actual Forecast
30% 1,200
Percentage of positive specimens
25
25% 1,000
20% 800
15% 13 600
11
10
10% 400
7 7
5 5
5% 3 3 3 3 200
2
1 1 0 00 1 1
0% -
Jan 20 Feb 20 Mar 20 Apr 20 May 20 Jun 20
s
s
s
s
A
B
s
1 -4
s
s
B
iru
ru
se
ru
ru
ru
iru
A&
za
za
vi
ru
vi
vi
vi
a
ov
ov
en
en
nz
ca
ro
on
ro
V
i
av
en
in
RS
flu
flu
te
ue
te
Be
um
Rh
n
Ad
En
En
In
In
nf
ro
ne
o/
i
Co
ra
ap
in
Pa
Rh
et
M
Source: South African Medical Research Council, Network 2020 results presentation,
Source: Ampath, Netcare 2020 results presentation Kagiso Asset Management estimates
sector. The number of provinces experiencing their peak                     outweighed by the negative consequences of further delay. The
simultaneously would have limited the degree to which                       upturn in elective surgeries may be delayed if patients choose
government was able to shift public sector medical staff                    to avoid hospitals until a vaccine becomes available. The loss of
between provinces to meet demand. Despite this, only a                      medical admissions, particularly those related to viral infections,
limited number of public sector Covid-19 cases have ultimately              are generally more permanent and may also remain structurally
been treated in the private sector.                                         below previous levels as new norms in distancing behaviour
                                                                            continue to dampen the spread of other viruses in years to come.
A snapshot of hospital assets
The charts below illustrate the provincial split of beds among              The portion of the population that is typically responsible for
the big three hospital operators. Private hospital operators                the greatest proportion of healthcare spend, namely those aged
with a higher proportion of their total beds in provinces that              over 65 and those with lifestyle diseases, are also most at risk of
experienced a more intense peak, or where government                        adverse outcomes should they become infected by Covid-19.
facilities were under more pressure, are expected to have had               These patients are more likely to stay away from hospitals for
a greater proportion of Covid-19 patients in their overall mix              as long as possible. Once a vaccine is approved it could take up
(for example Netcare’s greater exposure to Gauteng).                        to 18 months to become widely available due to high global
Provinces that peaked first will likely have seen a faster return           demand, further impacting the normalisation of patient
to normality with non-Covid cases coming back sooner.                       volumes - with some patients potentially only returning to
Mediclinic’s greater exposure to the Western Cape may,                      hospitals post 2021.
therefore, have allowed for a faster recovery in non-Covid-19
                                                                            The prevalence of co-payments - where doctors charge above
patient volumes versus other operators.
                                                                            medical aid rates - is also likely to have an impact on elective
A bumpy road to recovery                                                    procedures going forward. In households where at least one
Post the peak, urgent surgical procedures are likely to normalise           breadwinner has suffered a loss of income or a material
rapidly as the risk of potential infection during recovery is               decline in their retirement savings, elective surgeries risk

 Geographic split of acute hospital beds for big three hospital operators

               Mediclinic                                             Netcare                                           Life Healthcare
  General beds 7 517 Critical care 1 000               General beds 8 653 Critical care 1 393                General beds 7 190 Critical care 1 035

              33.7%                                                       11.6%                                         9.4%            15.8%
                                                                                   5.1%
                                  8.5%

                                                                                                                                                      18.1%
                                      8.5%                                            17.2%

                                                          59.1%
                                      5.1%
                                                                                                                   43.1%                              4.8%
      25.4%                                                                                    1.4%
                               7.0%          3.4%                                            2.8%
                      8.5%                                                                2.7%                                                5.5%         3.3%

  Northwest                  Gauteng                KZN
  Free State                 Western Cape           Limpopo
  Mpumalanga                 Eastern Cape           Northern Cape                               Source: UBS estimates, company websites, reports and presentations
Best-laid plans for SA’s private hospital groups
being deferred or cancelled altogether in favour of cheaper           operator, therefore appearing best placed to adapt to this
alternative treatment paths because of the unaffordability            environment. Netcare’s larger proportion of ICU beds relative
of the co-payments.                                                   to competitors could prove to be a disadvantage in tariff
                                                                      negotiations as these beds are more expensive to operate,
In April 2020, National Treasury estimated that pandemic
                                                                      leading to a higher average cost per bed.
related domestic job losses could be over the three million
mark. Coupled with the potential implications of a planned            Medical aid funders are also hoping to fast-track the shift away
R160 billion reduction in the public sector wage bill over the        from more expensive in-hospital care to managed care at home
next three years, there is a significant risk to the overall size     and telemedicine. Historically, these sorts of initiatives have
of the medical aid base. While the threat of infection lingers,       met with resistance from both doctors and patients, however,
there is an incentive for individuals to try and retain their         fears around Covid-19 are changing that. If successful, these
medical aid cover, reducing the expected reduction in medical         efforts would likely have a negative longer-term impact on
aid coverage over the near term.                                      hospital admissions and length-of-stay.

The gradual shift to lower cost “network” medical aid                 Beyond Covid-19
arrangements has been an enduring trend over the past few             The economic crisis brought about by the pandemic has
years. Network plans limit a patient’s choice to a prescribed list    accelerated long-term affordability headwinds for private
of designated healthcare service providers. This is expected to       healthcare. While the long-term outlook for South African
continue, particularly as above-inflation medical aid fee increases   hospital operators remains relatively unchanged, the
have led to an incrementally larger share of disposable income        short- to medium-term prospects have deteriorated significantly.
being consumed by health insurance. The negative impact of            Operators that prove themselves to be the most adaptable
the pandemic-led economic crisis on disposable incomes is             and cost efficient will be best positioned. We remain cautious
likely to accelerate this trend towards more affordable plans.        on the recovery path of the South African operations across all
Bargaining power in tariff negotiations on network deals tends        three hospital groups, however, we see value based on where
to favour medical aids over hospital operators, as more               they are currently trading. Consequently, we have retained
expensive hospitals are excluded from the networks. Of the            some exposure in our clients’ portfolios.
three listed players, Life Healthcare is currently the lowest cost
Kinder Morgan’s resilience
Abdul Davids - Portfolio Manager
The recent weakness and volatility in oil prices has
materially impacted the global economy as worldwide
lockdowns and other containment measures - in
response to the Covid-19 pandemic - caused a sudden,
substantial decline in oil demand. Consequently, the
share prices of most oil companies collapsed as oil
prices dropped sharply.
9Kinder Morgan’s resilience
Kinder Morgan, one of the largest energy infrastructure The US oil price futures contracts require the physical delivery
companies in the US, also fell victim to the share price rout of oil to settle each contract. In April 2020, US oil storage
despite the company’s stable, fee-based income that is not facilities were full, with a record-setting 160 million surplus
directly affected by oil price moves. We discuss whether their barrels of oil stored on tankers at sea1 . Normally, futures
midstream infrastructure will remain impervious to the effects contracts would be rolled over to the following month without
of the current energy market distress. physical settlement taking place. However, the market turmoil
with the US in lockdown and little visibility on oil demand
A market in (turm)oil
recovery, prompted oil traders to view the May contract as
The global oil market has been in a state of oversupply for the
untouchable. With no one willing or able to accept deliveries
last few years as many oil producing countries increased their
and storage filled to capacity for the first time in history,
respective production levels to offset the lower prices - with
producers were willing to pay buyers to take oil off their hands.
Russia and the US focussed on growing their market shares. In
This resulted in oil prices sinking to below zero, with May
2019, the OPEC grouping of oil producing countries implemented
futures for West Texas Intermediate (WTI) oil closing at -$37.63
voluntary production cuts to reduce the supply of oil and
on 20 April 2020.
invited non-OPEC countries like Russia to do the same. However,
in February 2020 (as OPEC and Russia tried to negotiate a Kinder Morgan hitches a price-ride
production cut due to concerns that Covid-19 would massively Oil prices have somewhat recovered, and the chart below
reduce oil demand) Russia walked away from negotiations and highlights the contiguous performance of US oil prices
Saudi Arabia responded by increasing supply and undercutting alongside Kinder Morgan’s share price since the start of the
oil prices by $6-8 per barrel. year. Evidently, Kinder Morgan’s share price has declined in
lockstep with the oil price and, at mid-June, both were trading
Excess oil production continued despite global lockdowns and
close to 20% lower than the January 2020 levels.
a concomitant demand collapse and, while Russia and Saudi
Arabia then agreed to further supply cuts, prices had already 1 According to Reuters
plummeted 60% from the February 2020 levels.
Kinder Morgan share return and US WTI oil price
120
100
80
Indexed to 100
60
40
20
0
Dec 19 Jan 20 Feb 20 Mar 20 Apr 20 May 20
US WTI oil price Kinder Morgan share return
Source: BloombergUnparalleled asset footprint Earnings stability amid pandemic-induced volatility
Kinder Morgan is a ‘midstream’ energy company - a term used Kinder Morgan uses its unparalleled $73 billion asset base to
to describe one of the three major stages of the oil and gas generate fee-based revenues, with over 90% of the company’s
industry. Midstream activities include the processing, storing, revenue linked to take-or-pay contracts or fixed-fee revenues
transporting and marketing of oil and natural gas. Upstream based on volumes moved through the vast pipeline
(raw crude oil and natural gas exploration and production) and infrastructure. Take-or-pay contracts entitle the business to
downstream (refining crude oil into gasoline, diesel and other receive payments regardless of throughput or utilisation of the
fuels) are the two other stages. company’s assets by its customers, therefore ensuring a high
degree of certainty and revenue stability. Their asset base
The company operates across five divisions including the
shares some of the desirable characteristics of a “toll
transportation of natural gas and crude oil, as well as the
bridge-like business” in that:
storage of refined energy products and carbon dioxide. Assets
the vast infrastructure of pipelines that span the breadth of
are dominated by the vast network of pipelines used to transport ° the US is not easily replicable, ensuring a monopoly position;
natural gas from various production and processing facilities
the company earns a reliable and predictable revenue stream
to customers across the US - accounting for 60% of profits. Their ° from the use of its infrastructure that offers long-term
considerable pipeline network spans almost 113 000 kms, moving
earnings visibility; and
approximately 40% of the natural gas consumption of the US,
the business model is uncomplicated and relatively easy
further augmented by over 4 800 kms of crude oil pipelines, ° to manage.
147 terminals and 16 product tankers (illustrated below).
Kinder Morgan’s customers are primarily the end-users of the
In 2015, natural gas surpassed coal as the largest consumed fuel
products transported and handled by the pipeline infrastructure.
source for electricity generation in the US, becoming the fuel of
Typically, they include large integrated state utility companies
choice to drive the US economy (left chart on following page).
such as oil refineries and other industrial users, many of which
Kinder Morgan remains well-placed to continue to benefit from
are substantial businesses with strong balance sheets and
the increasing domestic consumption of natural gas in the US.
Kinder Morgan’s asset footprint
Natural gas pipelines KM Midstream
Pipelines Pacific Double H
Under construction
Processing
LNG terminals
Ruby
Storage
WIC Utopia
Products pipelines Norhern
CIG
CP
Pipelines TCGT NGPL TGP
Calnev
Terminals Mojave KM Midstream
EPNG
Cortez Plantation
Terminals FEP
Elba Express
Terminals
Pacific
Jones Act tankers Sierrita MEP
SNG ELG
Wink KM Midstream
CO2 KMLP
PHP GLNG FGT
CO2 pipelines (Underway)
GCX
CO2 source fields Cypress CFPL
KMCC/
Oil fields Double Eagle
Source: Kinder MorganKinder Morgan’s resilience
excellent credit ratings. Consequently, the business’s quarterly Notwithstanding a $40 per barrel decline in US oil prices since
profits have remained stable over the last 21 quarters. the start of 2020, the company is only expecting an 8% decline
in earnings and cashflow for the 2020 financial year. In addition,
The right chart below depicts Kinder Morgan’s quarterly adjusted
the business announced that it will be increasing its dividends
earnings (EBITDA) together with the US oil price. In 2018, oil
by 5% in 2020, from the 2019 level of $1 per share. This is a
prices dropped by approximately $25, yet operating earnings
positive indication of the company’s highly resilient earnings
only declined by $15 million, which is less than 1% over the
amid unprecedented volatility and weakness in energy prices,
period. The company has consistently generated more than
particularly at a time when many energy companies are
$1.7 billion in operating earnings over the last five years despite
cutting or suspending dividend payments.
periods of significant oil price volatility and weakness.
Prepared to weather the storm
Covid-19 impact expected to be less severe
The economic impact of Covid-19 is still evolving and it is,
The Covid-19 pandemic has had a profound impact on the US
therefore, too early to distinguish genuine value opportunities
economy, which ground to a halt as many states implemented
from potential value traps among the energy companies.
lockdown measures to slow the spread of the virus. Energy
Those such as Kinder Morgan that are structurally sound,
demand declined significantly, forcing Kinder Morgan to
with stable cash flows, manageable balance sheet debt and
assess the likely impact of the pandemic on the business.
disciplined management, are likely to weather the storm.
US electricity generation by source Quarterly earnings vs US oil price
60% 2 100 80
Percentage of US electricity consumption
1 900
70
Adjusted quarterly earnings USD
50% 1 700
1 500
60
US oil price USD
40% 1 300
1 100 50
30% 900
40
700
20% 500
30
300
10% 100 20
2003 2005 2007 2009 2011 2013 2015 2017 2019 Mar 15 Dec 15 Sep 16 Jun 17 Mar 18 Dec 18 Sep 19
Coal share of power generation Generic WTI futures contract
Natural gas share of power generation Kinder Morgan quarterly EBITDA $m
Source: EIA, Bloomberg Source: Kinder MorganNokian treads confidently
Sheldon Kisten - Investment Analyst
In countries with colder climates it is commonplace,
and often compulsory, for vehicle owners to change
their car tyres seasonally. Higher natural rubber content,
wider tread blocks, deep grooves and studs are some
of the characteristics of winter tyres that enable better
performance in challenging conditions.
13Nokian treads confidently
Since splitting from the Nokia Corporation in the 1980s, Nokian well-honed experience paid off in 1978, when Finland passed
has grown into a diversified tyre manufacturer targeting many a law deeming the use of winter tyres as mandatory. Germany
tyre segments and geographical markets. As the inventor of and Russia, among others, later followed suit with this practice.
the winter tyre and in many respects pioneering innovation in
The demand for winter tyres is inherently seasonal, with the
this regard, Nokian has become the market leader in the Nordic
laws governing usage typically enforced for only a portion of
region and, in our view, is poised for global growth.
the year. For Nokian, this translates to seasonality in inventory
Viking of the Nordics levels and a cost to financing the higher average working
In Finland, the 1920s brought about a transition from capital they require. The company uses the seasonal demand
horse-drawn carriages to trucks and lorries that motorised to their advantage by offering a storage service to their
road and goods transportation. Weather conditions often customers - winter tyres can be stored when not in use and
proved treacherous, with heavy rain and snow regularly refitted when required. This strengthens customer relations
endangering drivers, pedestrians and horses. Drivers resorted and boosts brand loyalty. Despite the seasonality element,
to attaching snow chains to their truck tyres to gain more Nokian has achieved strong margins through its specialisation,
traction on the slippery roads. quality product and enduring client relationships, producing
high returns over time.
In 1934, Nokian manufactured the first winter tyre for trucks,
which boasted a transverse groove type of tread, providing a Strength in diversity
tooth-like grip and greatly improved traction in the soft mud Nokian’s geographic footprint has grown extensively over the
and snow - unique at the time. This period also saw a flood of years and now services tyre markets across the Nordics, the
passenger vehicles on the roads and Nokian quickly identified rest of Europe, the US, Canada, Russia and China. It develops and
the need for similar technology to be applied to smaller car manufactures winter, summer, all-season and heavy tyres and,
tyres. This gave rise to the first winter tyres for passenger alongside wholesalers and distributors, services aftermarket
vehicles in 1936 and, in the 50 years that followed, the company tyre demand through the Vianor chain of car service and
demonstrated a great deal of innovation in this area. Their maintenance centres. Its product offering is manufactured
Price premium vs competitors
250
Premium to average price (>=17” tyres)
201 196
200
182
175
162
150
100
50
0
Bridgestone
Firestone
Seiberling
Barum
Continental
General
Gislaved
Matador
Semperit
Uniroyal
Viking
Debica
Dunlop
Fulda
Goodyear
Sava
Kleber
Michelin
Falken
Hankook
Laufenn
Nokian
Pirelli
Yokohama
Bridgestone Continental Goodyear Michelin Other
Source: Citi research, Innovation Labacross four large factories in Finland, Russia and the US, with Growth carries a price
an additional two tyre testing centres in Finland and another Over the last three years, Nokian has invested €661 million on
being built in Spain. capital expenditure for growth. It has completed its new US
factory, acquired the Finnish heavy equipment wheel
Nokian entered the Soviet Union market soon after Finland’s
manufacturer, Levypyörä Oy (a pre-existing supplier) and,
trade agreement with the USSR in the 1960s. Four decades on,
in Finland, made further factory upgrades and built a new
in the early 2000s, Finland’s neighbouring country, Russia, was
research and development centre.
targeted as a growth market with Nokian building a large
factory there. When the use of winter tyres in Russia became Located in Dayton, Tennessee, the new US factory is intended
mandatory, the company again worked on developing customer to directly supply the US - the world’s largest tyre market.
relationships and brand loyalty, as well as further expanding While Nokian had established a presence in the winter tyre
local production capacity. Today, Russia is home to two of the market in the US prior to the construction of the Dayton
four factories and serves as a low-cost base that exports to over factory (charts below), the distribution network has proven
35 countries. This makes Nokian the single largest exporter of fragmented. The company anticipates that tyres from the new
consumer goods in Russia. factory, with a “Made in America” stamp, will enable it to gain
US market share.
Lower cost base means better margins
Innovation, coupled with a focus on product quality and service, It is also expected that the US tyre distribution network will
has propelled Nokian to the top of the Nordic and Russian tyre be consolidating in the medium term, which will see tyre
markets, enabling them to command a price premium as manufacturers and wholesalers joining forces to the benefit
evidenced in the chart on the previous page. Nokian’s resultant of large players. The recent joint venture between Goodyear
high margins and good returns on capital have helped maintain and Bridgestone, called TireHub, is evidence of this trend.
a strong balance sheet. The company’s profit margins are,
Local Nokian production in the US will reduce lead times
however, influenced by cyclically priced raw materials
and transportation costs, and improve the servicing of
(currently low), emerging market production currencies
North American customers. However, a focus on the more
(currently weak) and relatively low Russian labour costs.
Nokian production capacity over time by region Nokian revenue over time by region
30 1 800
1 600
25
1 400
20 1 200
Million tyres
EUR million
1 000
15
800
10 600
400
5
200
0 0
2005 2007 2009 2011 2013 2015 2017 2019 2021E 2023E 2005 2007 2009 2011 2013 2015 2017 2019
US Finland Russia Other countries North America Other Europe
Russia Nordics
Source: Citi research, company data Source: Kagiso Asset Management research, company dataNokian treads confidently
competitive all-season tyre market and increased operating Patience will be rewarded
costs will result in lower margins. We anticipate that the Nokian’s current performance is depressed by low consumer
margin pressure will ease over time as the factory ramps up spending and milder winters in many of their key markets.
to full capacity and greater economies of scale are achieved. This, coupled with the margin-dilutionary expansion into the
US and scepticism about recent capital expenditure, seems to
Due to a colder climate, Nokian’s two Finnish testing centres
have weakened investor sentiment towards the company -
are limited in their ability to test all-season and summer
evidenced by the multi-year low share price now.
tyre products. The new testing centre in Spain is therefore
much needed - particularly as the US factory focuses on Nevertheless, Nokian has a well-established presence in
all-season tyres. their primary markets and the groundwork in place to enable
further penetration into their growth markets. Despite this
Aftermarket strength
capex cycle placing the company in a net debt position for the
The new vehicle market has been very negatively impacted
first time in 10 years, Nokian’s strategy remains to carry as
by the Covid-19 pandemic (charted below) due to declining
little debt on the balance sheet as possible. They are backed
incomes and low consumer confidence. Yet, distances driven
by a history of generating solid margins and high returns.
are expected to return to pre-Covid levels quicker than new car
Furthermore, the appointment of a new CEO with prior
sales (as the resumption of daily activity begins to normalise),
experience in the North American and European markets
which should result in the replacement tyre market being more
should stand them in good stead on the growth and
resilient than the new car sales market. As Nokian has no
development front. We believe their prospects are strong.
exposure to original equipment manufacturers (OEM’s) for
passenger vehicles, solely servicing aftermarket tyre demand,
they are seemingly better placed than other tyre manufacturers.
Global tyre demand (year to May)
- 11%
- 22% - 5%
- 41% - 35%
- 20% - 25%
-42% - 25%
- 42%
Percentage decline
- 18%
- 33%
- 50%
- 34%
Passenger car Truck and bus Passenger car Truck and bus
Original equipment Replacement
China South America North America Europe Source: Citi research, Michelin market dataKagiso Asset Management Funds
2 3
Performance to 30 June 2020 1 3 1 5 1 10 1 Since 1 Launch TER TC
year years years years launch
Unit trust funds 4
Equity Alpha Fund -5.8% 2.7% 3.5% 8.8% 14.7% Apr-04 2.24% 0.53%
SA Equity General funds mean -7.4% 0.3% 0.3% 7.7% 11.2%
Outperformance 1.6% 2.4% 3.2% 1.1% 3.5%
Global Equity Feeder Fund - - - - -1.0% Nov-19
Global Equity general funds mean 12.8%
Outperformance -13.8%
Balanced Fund -3.0% 3.6% 4.8% - 7.6% May-11 1.58% 0.47%
SA Multi Asset High Equity funds mean 0.5% 3.6% 3.5% 7.4%
Outperformance -3.5% 0.0% 1.3% 0.2%
Protector Fund -3.3% 3.3% 4.8% 6.6% 9.0% Dec-02 1.58% 0.32%
CPI + 4% 6.1% 7.9% 9.0% 9.7% 10.2%
Outperformance -9.4% -4.6% -4.2% -3.1% -1.2%
Stable Fund -7.4% 2.8% 4.7% - 6.6% May-11 1.52% 0.43%
Total return of CPI + 2% pa 4.1% 5.9% 6.0% 5.7%
Outperformance -11.5% -3.1% -1.3% 0.9%
Institutional funds5
Managed Equity Fund (SWIX) -5.8% 3.2% 3.0% 9.3% 10.0% Sep-06
FTSE/JSE SWIX All Share Index -7.5% 1.5% 1.8% 10.5% 10.0%
Outperformance 1.7% 1.7% 1.2% -1.2% 0.0%
Managed Equity Fund (Capped SWIX) -9.0% 1.3% - - 2.4% Jan-17
FTSE/JSE Capped SWIX Index -10.8% -0.8% -0.3%
Outperformance 1.8% 2.1% 2.7%
Domestic Balanced Fund -6.3% 3.2% 4.0% 7.7% 7.3% May-07
Peer median6 -5.2% 1.8% 3.0% 8.9% 7.9%
Outperformance -1.1% 1.4% 1.0% -1.2% -0.6%
Global Balanced Fund -1.6% 5.2% 6.2% - 7.9% Jul-13
Peer median7 1.4% 4.7% 5.0% 7.9%
Outperformance -3.0% 0.5% 1.2% 0.0%
Bond Fund 1.3% 8.2% - - 7.9% Aug-15
BESA All Bond Index 2.8% 8.1% 7.4%
Outperformance -1.5% 0.1% 0.5%
Money Market Fund 8.0% 8.4% 8.4% 7.2% 7.9% Jan-04
Alexander Forbes STeFI Composite Index 6.9% 7.2% 7.2% 6.5% 7.3%
Outperformance 1.1% 1.2% 1.2% 0.7% 0.6%
Sharia unit trust funds 4
Islamic Equity Fund -6.4% 3.3% 4.7% 8.2% 9.3% Jul-09 1.50% 0.24%
SA Equity General funds mean -7.4% 0.3% 0.3% 7.7% 8.7%
Outperformance 1.0% 3.0% 4.4% 0.5% 0.6%
Islamic Global Equity Feeder Fund 13.8% - - - 14.4% Jan-19
Global Equity General funds mean 16.6% 21.7%
Outperformance -2.8% -7.3%
Islamic Balanced Fund 0.0% 4.4% 4.8% - 6.0% May-11 1.51% 0.17%
SA Multi Asset High Equity funds mean 0.5% 3.6% 3.5% 7.4%
Outperformance -0.5% 0.8% 1.3% -1.4%
Islamic High Yield Fund 4.1% - - - 5.0% Mar-19
Short-term Fixed Interest Index (STeFI) 6.9% 7.0%
Outperformance -2.8% -2.0%
Highest and lowest monthly fund performance Highest Lowest Highest Lowest Highest Lowest Highest Lowest Highest Lowest
Equity Alpha Fund 12.6% -21.6% 12.6% -21.6% 12.6% -21.6% 12.6% -21.6% 12.6% -21.6%
Balanced Fund 6.9% -15.7% 6.9% -15.7% 6.9% -15.7% - - 6.9% -15.7%
Protector Fund 5.1% -13.9% 5.1% -13.9% 5.1% -13.9% 5.1% -13.9% 9.5% -13.9%
Stable Fund 4.0% -11.4% 4.0% -11.4% 4.0% -11.4% - - 4.0% -11.4%
Islamic Equity Fund 8.2% -14.3% 8.2% -14.3% 8.2% -14.3% 8.2% -14.3% 8.2% -14.3%
Islamic Balanced Fund 7.5% -9.3% 7.5% -9.3% 7.5% -9.3% - - 8.2% -9.3%
17
Footnote and disclaimer follow overleaf.Kagiso Asset Management (Pty) Limited
Fifth Floor MontClare Place
Cnr Campground and Main Roads
Claremont 7708
PO Box 1016 Cape Town 8000
Tel +27 21 673 6300 Fax +27 86 675 8501
Email info@kagisoam.com
Website www.kagisoam.com
Kagiso Asset Management (Pty) Limited is a licensed financial services provider (FSP No. 784).
Reg No. 1998/015218/07.
Footnote: 1 Annualised (ie the average annual return over the given time period); 2 TER (total expense ratio) = % of average NAV of portfolio incurred as charges, levies and fees in the management
of the portfolio for the rolling three-year period to 30 June 2020; 3 Transaction costs (TC) are unavoidable costs incurred in administering the financial products offered by Kagiso Collective
Investments and impact financial product returns. It should not be considered in isolation as returns may be impacted by many other factors over time including market returns, the type of
financial product, the investment decisions of the investment manager and the TER. This is also calculated on the rolling three-year period to 30 June 2020; 4 Source: Morningstar; net of all costs
incurred within the fund and measured using NAV prices with income distributions reinvested; 5 Source: Kagiso Asset Management; gross of management fees; 6 Median return of Alexander
Forbes SA Manager Watch: BIV Survey; 7 Median return of Alexander Forbes Global Large Manager Watch.
Disclaimer: The Kagiso unit trust fund range is offered by Kagiso Collective Investments (RF) Limited (Kagiso), registration number 2010/009289/06. Kagiso is a member of the Association for Savings
and Investment SA (ASISA) and is a registered management company in terms of the Collective Investment Schemes Control Act, No 45 of 2002. Kagiso is a subsidiary of Kagiso Asset Management
(Pty) Limited [a licensed financial services provider (FSP No. 784)], the investment manager of the unit trust funds. Unit trusts are generally medium to long-term investments. The value of units
will fluctuate and past performance should not be used as a guide for future performance. Kagiso does not provide any guarantee either with respect to the capital or the return of the portfolio(s).
Foreign securities may be included in the portfolio(s) and may result in potential constraints on liquidity and the repatriation of funds. In addition, macroeconomic, political, foreign exchange, tax and
settlement risks may apply. However, our robust investment process takes these factors into account. Unit trusts are traded at ruling prices and can engage in scrip lending and borrowing. Exchange
rate movements, where applicable, may affect the value of underlying investments. Different classes of units may apply and are subject to different fees and charges. A schedule of the maximum
fees, charges and commissions is available upon request. Commission and incentives may be paid, and if so, would be included in the overall costs. All funds are valued and priced at 15:00 each
business day and at 17:00 on the last business day of the month. Forward pricing is used. The deadline for receiving instructions is 14:00 each business day in order to ensure same day value.
Prices are published daily on our website. Performance is based on a lump sum investment into the relevant portfolio(s) and is measured using Net Asset Value (NAV) prices with income
distributions reinvested. NAV refers to the value of the fund’s assets less the value of its liabilities, divided by the number of units in issue. A feeder fund is a portfolio that invests in a single portfolio
of a collective investment scheme, which levies its own charges and which could result in a higher fee structure for the feeder fund. Figures are quoted after the deduction of all costs incurred within
the fund. Individual investor performance may differ as a result of initial fees, the actual investment date, the date of reinvestment and dividend withholding tax. Kagiso may close a portfolio to new
investors in order to manage it more effectively in accordance with its mandate. Please refer to the relevant fund fact sheets for more information on the funds by visiting www.kagisoam.comYou can also read