169 CPB - The Container Port of Buenos Aires in the Mega-Ship Era
←
→
Page content transcription
If your browser does not render page correctly, please read the page content below
CPB
                Corporate Partnership
                Board

The Container Port of
Buenos Aires in the
Mega-Ship Era
                                           169                          Roundtable

Discussion Paper
                                        Olaf Merk
                                        International Transport Forum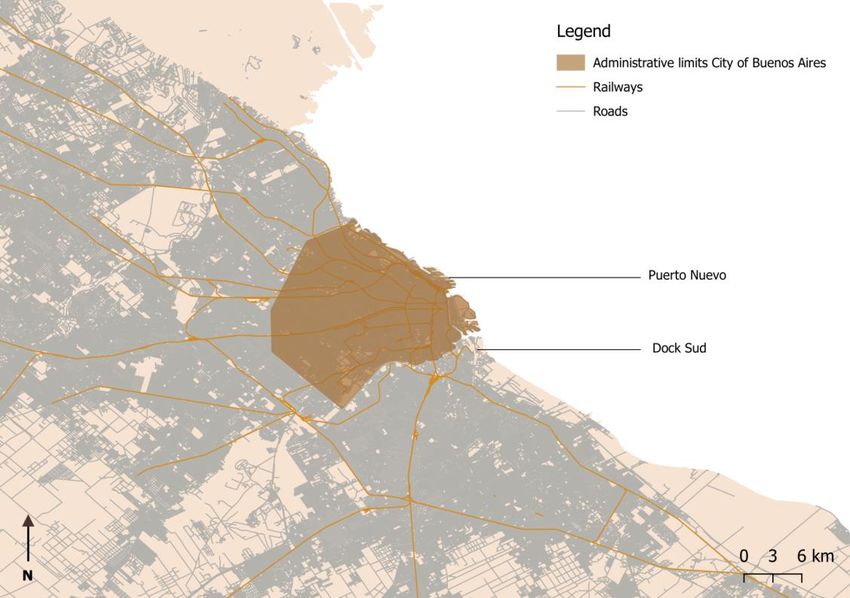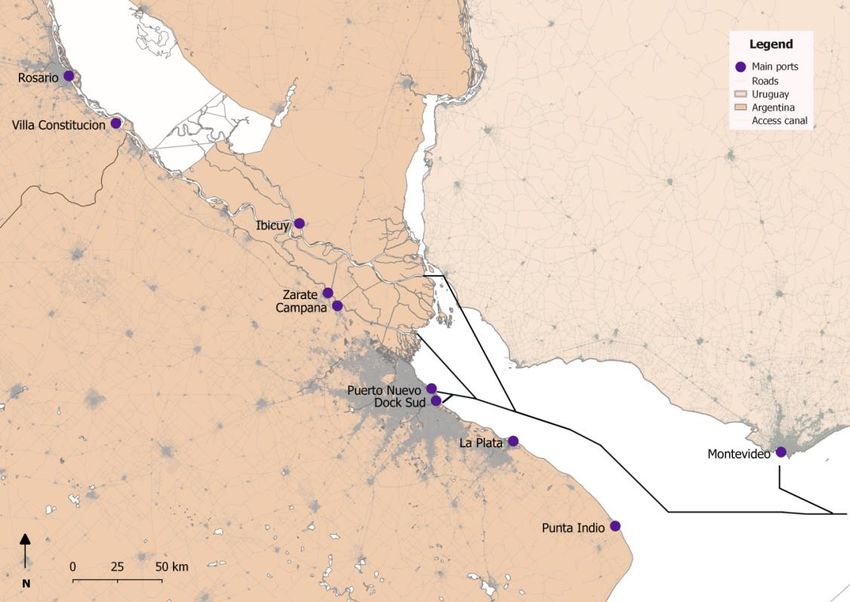
The International Transport Forum

The International Transport Forum is an intergovernmental organisation with 59 member countries. It
acts as a think tank for transport policy and organises the Annual Summit of transport ministers. ITF is
the only global body that covers all transport modes. The ITF is politically autonomous and
administratively integrated with the OECD.
The ITF works for transport policies that improve peoples’ lives. Our mission is to foster a deeper
understanding of the role of transport in economic growth, environmental sustainability and social
inclusion and to raise the public profile of transport policy.
The ITF organises global dialogue for better transport. We act as a platform for discussion and pre-
negotiation of policy issues across all transport modes. We analyse trends, share knowledge and
promote exchange among transport decision-makers and civil society. The ITF’s Annual Summit is the
world’s largest gathering of transport ministers and the leading global platform for dialogue on transport
policy.
The Members of the Forum are: Albania, Armenia, Argentina, Australia, Austria, Azerbaijan, Belarus,
Belgium, Bosnia and Herzegovina, Bulgaria, Canada, Chile, China (People’s Republic of), Croatia, Czech
Republic, Denmark, Estonia, Finland, France, Former Yugoslav Republic of Macedonia, Georgia, Germany,
Greece, Hungary, Iceland, India, Ireland, Israel, Italy, Japan, Kazakhstan, Korea, Latvia, Liechtenstein,
Lithuania, Luxembourg, Malta, Mexico, Republic of Moldova, Montenegro, Morocco, the Netherlands,
New Zealand, Norway, Poland, Portugal, Romania, Russian Federation, Serbia, Slovak Republic, Slovenia,
Spain, Sweden, Switzerland, Turkey, Ukraine, the United Arab Emirates, the United Kingdom and the
United States.

                                     International Transport Forum
                                           2 rue André Pascal
                                         F-75775 Paris Cedex 16
                                          contact@itf-oecd.org
                                            www.itf-oecd.org

                                 ITF Discussion Papers
ITF Discussion Papers make economic research, commissioned or carried out in-house at ITF, available to
researchers and practitioners. They describe preliminary results or research in progress by the author(s)
and are published to stimulate discussion on a broad range of issues on which the ITF works. Any
findings, interpretations and conclusions expressed herein are those of the authors and do not
necessarily reflect the views of the International Transport Forum or the OECD. Neither the OECD, ITF
nor the authors guarantee the accuracy of any data or other information contained in this publication
and accept no responsibility whatsoever for any consequence of their use. This document and any map
included herein are without prejudice to the status of or sovereignty over any territory, to the
delimitation of international frontiers and boundaries and to the name of any territory, city or area.
Comments on Discussion Papers are welcome.
Cite this work as: Merk, O. (2018), “The container port of Buenos Aires in the mega-ship era”, Discussion
Paper, International Transport Forum, Paris.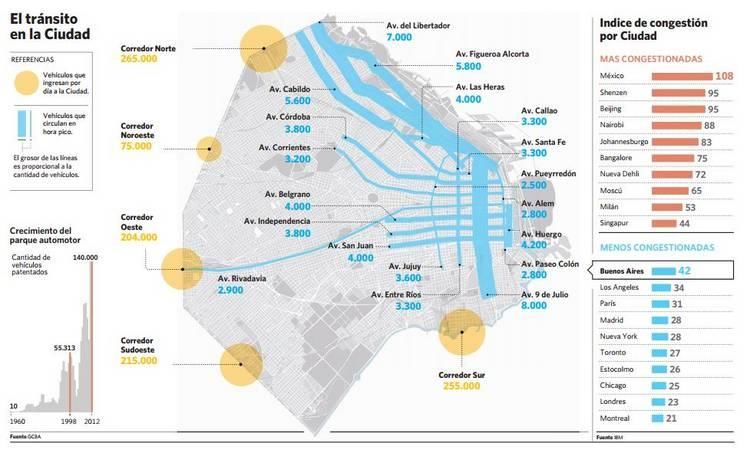
THE CONTAINER PORT OF BUENOS AIRES IN THE MEGA-SHIP ERA | DISCUSSION PAPER | ITF ROUNDTABLE 169

                                    Acknowledgements

This paper is written by Olaf Merk. It draws on contributions by Julie Lannou. Valuable comments on a draft version
of this paper were provided by Stephen Perkins, Trevor Heaver, Dario Gonzalez, Andreas Meyer and Antonio
Zuidwijk. The paper also benefits from discussions at the ITF Roundtable on Container Port Strategy, organised in
Buenos Aires (Argentina) in April 2017: https://www.itf-oecd.org/container-port-strategy-roundtable.

.

© OECD/ITF 2018                                                                                                    3
THE CONTAINER PORT OF BUENOS AIRES IN THE MEGA-SHIP ERA | DISCUSSION PAPER | ITF ROUNDTABLE 169
Table of contents
Performance of the container port of Buenos Aires .............................................................................. 5
Outlook of the container port of Buenos Aires ................................................................................. 5
Performance of the port of Buenos Aires ....................................................................................... 10
Future requirements for container ports ............................................................................................. 14
Future trade projections .................................................................................................................. 14
Container ship size ........................................................................................................................... 15
Industry consolidation and alliances ............................................................................................... 19
Regional port competition ............................................................................................................... 19
Policies to adapt to future requirements ............................................................................................. 21
Current policies ................................................................................................................................ 21
How well are policies adapted to future requirements? ................................................................ 23
Suggestions for policy ...................................................................................................................... 25
Notes .................................................................................................................................................... 26
References ........................................................................................................................................... 27
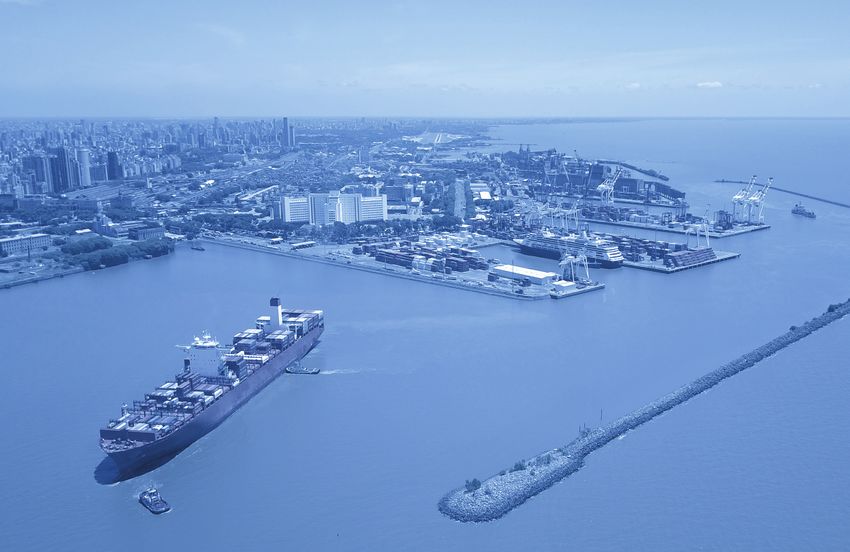
4 © OECD/ITF 2018THE CONTAINER PORT OF BUENOS AIRES IN THE MEGA-SHIP ERA | DISCUSSION PAPER | ITF ROUNDTABLE 169 Performance of the container port of Buenos Aires The port of Buenos Aires is the main container port of the country, handling 85% of the nation’s containers. The port is the main cargo entry point for the province of Buenos Aires, where most of Argentina’s population, economic activity and manufacturing activity is concentrated. The province alone accounts for 37% of the national exports, but the port plays a role for the whole country, with hinterlands that extend to many other parts of Argentina. This paper answers three questions: What are the characteristics of this port? How does it perform, and what are its main challenges? Outlook of the container port of Buenos Aires The port of Buenos Aires is very urban. It is located on the River Plate surrounded by the agglomeration of Buenos Aires, home to around 14 million people. Buenos Aires accounts for one-third of Argentina’s population, with a density of 5 000 people per km2. Since the port reforms in the 1990s, the port of Buenos Aires consists of two parts: Puerto Nuevo and Dock Sud, which have separate locations and institutional structures.1 Puerto Nuevo is inserted in the north-east of a very central urban area, at the heart of the city, the core of offices, government and financial institutions. Further south is Dock Sud, located outside the boundaries of the city of Buenos Aires, and more industrial in character, but still part of the larger agglomeration of Buenos Aires (Figure 1). The port is located upstream in the River Plate (Rio de la Plata) estuary. It is a shallow estuary with depths that mostly range from 3 to 5 metres. In order to access it, ships need to navigate in a 239 km long access channel, which is limited in depth and width, to a greater or lesser extent depending on the specific part of the channel (Figure 2). The last few kilometres of the channel, the Canal Norte leading to Porto Nuevo and Canal Sur leading to Dock Sud, are the most constrained parts of the channel, with around 60-80 metres width and 9.75 metres depth. The access channels in the River Plate need dredging, which is carried out by the company Hidrovia S.A. that dredges the main channels (Emilio Mitre, Acceso, Intermedio and Punta Indio), which is covered by tolls from the passing cargo ships. The North and South channels are subject to tenders by each port (Puerto Nuevo and Dock Sud) and there is no direct toll on them. The constraint of depth and related dredging costs distinguishes the port of Buenos Aires from the Uruguayan port of Montevideo that is located further downstream and in particular from the Brazilian port of Santos that has deep sea access. © OECD/ITF 2018 5
THE CONTAINER PORT OF BUENOS AIRES IN THE MEGA-SHIP ERA | DISCUSSION PAPER | ITF ROUNDTABLE 169

                                      Figure 1. Buenos Aires and its two ports

                                   Figure 2. The River Plate Estuary and its ports

Note: Access channel indicated by the black lines in the river estuary. The access channel to La Plata is not
included in this picture.

 6                                                                                                   © OECD/ITF 2018
THE CONTAINER PORT OF BUENOS AIRES IN THE MEGA-SHIP ERA | DISCUSSUION PAPER | ITF ROUNDTABLE 169
The port of Buenos Aires handled 1.4 million TEUs in 2015, which represents 85% of the nation’s
maritime container traffic. This market share of Buenos Aires has declined over the last decade from 95%
in 2006. Total container volume in Argentina has fluctuated somewhat over the last decade, but its level
in 2015 was slightly below the 2006 level, which was 1.7 million TEU (Figure 3). The second container
port in Argentina is the river port Zarate, upstream from Buenos Aires, that handled 0.1 million TEUs in
2015. A new Argentinian container port, La Plata, was opened in 2015, but it has for the moment not
managed to attract significant container traffic; this port is operated by ICTSI, the global terminal
operator headquartered in the Philippines.
The port of Buenos Aires has witnessed a decline of container volumes over the last decade, falling 12%,
from 1.6 million in 2006 to 1.4 million in 2015 (Figure 3). This volume makes Buenos Aires the
eight-largest container port in Latin America, and the only large container port in the region with
declining growth rates.
Figure 3. Container port development in Argentina 2006-15
2.5
2.0
TEU volume (millions)
Rosario
1.5
Bahia Blanca
Ushuaia
1.0 Zarate
Buenos Aires
0.5
0.0
2006 2007 2008 2009 2010 2011 2012 2013 2014 2015
Source: ITF elaboration based on data from Lloyds Intelligence Unit.
Containerships represent a third of ship calls to the port of Buenos Aires, which is only 10% for the
average port in Argentina. The share of tankers in Buenos Aires (almost half of all cargo ship calls) is also
higher than the average in Argentinian ports (40%) (Figure 4). Most of the tankers call at Dock Sud that
has specialised liquid bulk terminals. Puerto Nuevo is predominantly a container port. Bulk carriers
represent the largest category of ships coming to Argentina (almost half), but there are hardly any bulk
carriers calling Buenos Aires. One of the major dry bulk ports in Argentina is Rosario. Cruise shipping is an
emerging activity, with 102 cruise calls in Puerto Nuevo in the cruise season 2015/16 carrying
313 640 passengers (AGP, 2016).
Major containerised exports from Puerto Nuevo (by weight) include manufactured products (56%), meat
(14%), fruits (13%) and chemical products (8%). Main containerised import goods are manufactured
goods (40%) and oil products (36%). The loading and unloading of containers are almost perfectly in
balance in Puerto Nuevo, with 440 000 TEUs inbound and 441 900 TEUs outbound in 2016. Yet, there is a
© OECD/ITF 2018 7THE CONTAINER PORT OF BUENOS AIRES IN THE MEGA-SHIP ERA | DISCUSSION PAPER | ITF ROUNDTABLE 169
striking difference with regards to full and empty containers: 10% of the import containers in 2016 were
empty, whereas 48% of export containers were empty (AGP, 2016).
Container port operations are carried out by private operators with Buenos Aires’ port characterised by a
high degree of intra-port competition. There are four different container terminals, competing for the
same cargo, each of them controlled by one of the four largest global terminal operators, sometimes in
joint ventures with local actors. The terminal operators Hutchison, DP World and APMT operate in
Puerto Nuevo, whereas PSA operates in Dock Sud (Exolgan) (Table 1). This system of private port
operations has been in place since the beginning of the 1990s, when the Argentinian port framework
was substantially reformed.
Figure 4. Port calls per ship type in Buenos Aires and Argentina
100%
90%
80%
70%
60% General cargo
50% Tankers
40% Bulk carriers
30% Containerships
20%
10%
0%
Buenos Aires Argentina
Source: ITF elaboration based on data from Lloyds Intelligence Unit.
Table 1. Container terminals in Buenos Aires and their operators
Terminal Place Terminal operator
Rio de la Plata Puerto Nuevo DP World (55.62%)
Buenos Aires Container Terminal Services (BACTSSA) Puerto Nuevo Hutchison Port Holdings (100%)
Terminal 4 Puerto Nuevo APMT (100%)
Exolgan Dock Sud PSA (50%) and TIL/MSC (50%)
Source: ITF elaboration based on data from Drewry.
The two largest container terminals in Buenos Aires are Rio de la Plata and Exolgan (Dock Sud), both of
which represent around a third of total container port volume in Buenos Aires. The other two container
terminals, BACTSSA and Terminal 4, together represent the remaining third of the container volume. The
market shares of the two largest terminals have remained fairly constant since 2008, but there have
been some changes with respect to the market shares of the smaller terminals, with Terminal 4
increasing from 13% in 2008 to 19% in 2015 and BACTSSA declining from 23% to 12% (Figure 5).
8 © OECD/ITF 2018THE CONTAINER PORT OF BUENOS AIRES IN THE MEGA-SHIP ERA | DISCUSSUION PAPER | ITF ROUNDTABLE 169
The largest container lines calling Buenos Aires all have their preferred terminals. Not surprisingly this is
related to the vertical links of shipping lines and their terminal subsidiaries. So, Maersk uses Terminal 4,
the terminal in the hands of its terminal operator APM Terminals. MSC uses Exolgan, in which its
terminal operator TIL has a 50% share. Hamburg Süd, second largest carrier in East Coast South America,
mainly uses the Rio de la Plata-terminal. Yet, most carriers spread their calls over different terminals: so
Maersk also uses Exolgan and Hamburg Süd also uses APM Terminals. The merger of Hamburg Süd and
Maersk in 2018 has resulted in a shift of calls to the APM Terminal.
Figure 5. Volumes at Buenos Aires container terminals 2008-15
2.5
2.0
TEU volume (millions)
1.5 Rio de la Plata
BACTSSA
1.0 Terminal 4
Dock Sud
0.5
0.0
2008 2009 2010 2011 2012 2013 2014 2015
Source: ITF elaboration based on data from Drewry.
Figure 6. The layout of Puerto Nuevo
Note: TRP is also covering the area indicated as “Terminal de Cruzeros”; container vessels are also operated there
Source: AGP.
© OECD/ITF 2018 9THE CONTAINER PORT OF BUENOS AIRES IN THE MEGA-SHIP ERA | DISCUSSION PAPER | ITF ROUNDTABLE 169
The lay-out of Puerto Nuevo is characterised by finger piers, with seven port basins (Figure 6). This
design, originating from traditional cargo ports, is considered less adapted for modern containerships, as
it means that there are no linear quay lines and there is limited space for stacking containers. Dock Sud
has linear quays.
Performance of the port of Buenos Aires
Port performance can be schematically broken down into three parts: maritime connectivity, port
operations and hinterland connectivity. How does Buenos Aires perform on these indicators?
Maritime connections
The port of Buenos Aires is relatively well connected with other ports. It has direct connections with
around fifty non-Latin American ports worldwide via a number of weekly services provided by container
lines. Most of these connections are with ports in North America (13), Asia (10), North Europe (10) and
Mediterranean (8). There are 21 container lines that offer regular services that include the port of
Buenos Aires. Many of these services are shared between container lines, so are identical. If corrected
for this, six weekly services to Asia were identified in 2015, 5.1 weekly services to North America, 4.5
weekly services to North Europe and four weekly services to the Mediterranean (Table 2). As such, the
port of Buenos Aires is one of the best-connected container ports at the East Coast of South America.
Only the Brazilian ports of Santos and Paranagua have more direct port connections.
Table 2. Main maritime connections of the port of Buenos Aires in 2015
Region Number of Ports connected
weekly services
Far East 6 Busan, Qingdao, Shanghai, Ningbo, Chiwan, Shekou, Yantian, Hong Kong, Singapore,
Port Klang
North Europe 4.5 Rotterdam, Hamburg, Bremerhaven, Tilbury, Antwerp, Le Havre, Vigo, Bilbao, Lisbon,
Sines
Mediterranean 4 Tangier-Med, Valencia, Gioia Tauro, Livorno, Genoa, Marseille, Algeciras, Barcelona
North America 5.1 New York, Philadelphia, Norfolk, Baltimore, Charleston, Jacksonville, Port Everglades,
Houston, New Orleans, Savannah, Altamira, Tampico, Veracruz
Source: ITF elaboration based on data from container shipping lines.
A challenge to the maritime connectivity of the port of Buenos Aires is the draft limitation in the port and
access channel in the River Plate. Current maximum depth at Puerto Nuevo is 36 feet, which roughly
allows 10.36 metres depth for navigation. As larger containerships generally have drafts that are deeper
than this, these ships have difficulties calling the port of Buenos Aires. There are two ways in which
shipping lines have managed to adapt to these constraints. First, some of the largest container shipping
companies calling in South America, in particular Hamburg Süd and Maersk, have deployed ships that
were tailor-made for South America trades, which compensate for shallow draft by being broader (and
with high reefer plug capacity needed for fresh food products). Maersk even deploys a series of ships
that are aptly called South America Maximum (SamMax) ships. A second way in which shipping lines
currently deal with the draft limitations is via the structure of the ports network. The trick is to call twice
at the port of Santos, first to unload the import cargo, so that the ships are much less full, which means
10 © OECD/ITF 2018THE CONTAINER PORT OF BUENOS AIRES IN THE MEGA-SHIP ERA | DISCUSSUION PAPER | ITF ROUNDTABLE 169
that they ride higher in the water and are able to continue with calls to ports like Buenos Aires where
they unload import cargo and load export cargo. After such calls to Buenos Aires and Montevideo, ships
call again at Santos to take on Brazilian export cargo.
Port operations
The average container ship turnaround time in Buenos Aires was 1.8 days in 2015. This is considerably
longer than in other main container ports in the region, for which the average ship-turnaround times are
below one day (Figure 7). According to the AGP (2011-16), the port authority of Buenos Aires, the
average number of ship moves per hour in Puerto Nuevo was 59 in 2015, up from 52 in 2014, although it
is not entirely clear what definition of ship moves per hour was used to arrive at these numbers. On the
same indicator, a few differences between terminals were noticeable, with Terminal 4 scoring
consistently higher scores than Terminals 1-3 and Terminal 5 scoring the highest monthly score, namely
80 container moves per hour in November 2015. Such indicators are not available in the public domain
for the Exolgan terminal.
In addition, many ships calling the port of Buenos Aires face waiting times before entering the port. Our
numbers over 2015 show that approximately half of the vessels calling the port of Buenos Aires wait at
the La Plata anchorage point; the average waiting time for these ships is 0.5 day. Delays in maritime
access to the port are related to one-way traffic in parts of the access channel; some of these delays are
related to priority for passenger ships, such as cruise ships, priority for LNG vessels and slow speeds
when Panamax bulkers come down from Rosario of San Lorenzo.
Figure 7. Ship turn-around times in Buenos Aires and other ports (2015)
2.0
Average ship turn around time (days)
1.5
1.0
0.5
0.0
Source: ITF elaboration based on data from Lloyds Intelligence Unit.
Dwell times in container ports do not seem to be structurally measured, at least, we have not come
across specific container dwell time data in Puerto Nuevo; this could be a serious concern if it indicates
that such numbers do not exist, because it would be difficult to manage if unmeasured. Some indicative
observations could be drawn from World Bank’s Logistics Performance Indicators for Argentina. Its 2016
data indicate an average export lead time in port or airport supply chain of two days, and four days for
© OECD/ITF 2018 11THE CONTAINER PORT OF BUENOS AIRES IN THE MEGA-SHIP ERA | DISCUSSION PAPER | ITF ROUNDTABLE 169 imports. A considerable share of this lead time seems related to inspections: clearance time without inspections is on average one day, but four days in case of physical inspections. Physical inspections take place in 28% of the imported shipments. One of the scores on sub-items in the LPI in which Argentina scores well below the average of peer countries is on customs (World Bank, 2016). This observation is confirmed in other studies: almost 30% of Argentinian firms in manufacturing perceive customs and trade regulation as a major constraint for doing business, the worst score found among Latin American countries (OECD/UN-ECLAC/CAF, 2013). The costs of container transport via Buenos Aires are relatively high. The average cost of import (via port or airport) in 2014 was USD 1 670 in Argentina; this was USD 1 015 for Brazil (World Bank, 2014). Part of the difference in price might be related to relatively high port costs in Buenos Aires. According to Filadoro and Sanchez (2016), 23% of the costs of a container vessel calling Buenos Aires are related to the toll for the access channel and 14% for pilotage services needed to navigate on the access channel. These costs translate in USD 49 per TEU and USD 30 per TEU respectively. Hinterland connectivity Considering the port’s central role in the national port system, hinterland connectivity is a crucial element. Its hinterland is extensive: it not only includes the province of Buenos Aires, main centre of population and economic activity, but also various other regions of Argentina, in particular the northern provinces of Cordoba and Santa Fe. Considering that a high share of Argentina’s exports (more than 65%) is time sensitive (OECD/UN-ECLAC/CAF, 2013), smooth connections with the hinterland are all the more relevant. Road transport is the dominant hinterland transport mode. Although there are no official statistics on this, it is estimated that 93% of the containers handled in Puerto Nuevo are transported by truck, 6% by train and 1% by barge. Although such shares are not unusual in South America – and indeed globally – it is also clear that various ports have managed to achieve a more balanced modal share. In the case of Argentina, this would be perfectly possible considering an extensive network of railways and navigable waterways that were used in the past. The high modal share of trucks, in combination with the location of the port, results in high interference of port truck traffic with regular urban road traffic. Port traffic uses main central city road axes, such as the Madero-Huergo axis that links Puerto Nuevo and Dock Sud and that carries 10 000 truck movements per day (Figure 8). This situation is exacerbated by the lack of truck waiting areas, which means that waiting times at the port gate translate to congestion of the urban road network. Argentina has an extensive railway network, but it has suffered from poor maintenance in the past. Of the 37 000 kilometres of railway network, only 18 000 kilometres are operational (CNRT, 2015) A large part of the railway network is in mediocre shape and does not support heavy loads, even at low speeds (Martínez, 2014). The system is operated by four different operators, three of them private concessionaires operating since the 1990s. The inter-operability of the whole network is challenging as there are three different rail gauges. One of the challenges for the port of Buenos Aires is the linkage to the railway network. Urban rail traffic gets preference, therefore container trains use night hours for operation. Most of Argentina’s railway branch lines have traditionally served its inland waterway and most of the maritime ports, yet most ports have gradually lost their railway links. Puerto Nuevo has rail access to the north and south of the port, but both connections are somewhat complicated by illegal land occupancy and informal settlements. 12 © OECD/ITF 2018
THE CONTAINER PORT OF BUENOS AIRES IN THE MEGA-SHIP ERA | DISCUSSUION PAPER | ITF ROUNDTABLE 169

                             Figure 8. Road congestion in the city of Buenos Aires

Note: This figure indicates the level of road congestion in Buenos Aires. The yellow numbers indicate the daily
amount of cars passing through the respective points. The blue indicates the hourly number of cars in peak hours
at the respective places.
Source: http://www.clarin.com/ciudades/atascos-calle-crecen-tiempos-viaje_0_955704555.html.

The River Plate estuary is strategically located at the mouth of the Paraguay-Paraná river complex. This is
a huge navigable river-system connected to Argentina, Bolivia, Brazil, Paraguay and Uruguay, providing
potential for freight transport. Current use is fairly modest: in 2010 around 14 million tonnes of freight
were transported on it. According to World Bank (2010), Argentina makes use of the river in four
different ways:
    1. to move domestic dry bulk from the northern regions to the transfer area in the River Plate
       estuary
    2. to receive cargo from upstream countries, such as soy and iron ore, for processing in its
       manufacturing plants
    3. to transfer freight to ocean-going vessels
    4. to facilitate imports to Paraguay and Bolivia, such as fuel and wheat.
The principal river container traffic flow of Buenos Aires is with Asunción; smaller flows connect Buenos
Aires with Zarate; and there is an incipient flow from Rosario to Montevideo. It should also be noted that
Uruguayan port of Nueva Palmira is a major transfer port for the inland waterway transport.
There are various infrastructure constraints on the Paraguay-Paraná river-system, related to limited
depth, signalling, maintenance, high costs and union working conditions. No less than two dozen studies
since 1962 have suggested recommendations to improve the navigability of the river system but
progress has been slow, basically related to a lack of international co-operation. Co-operation between
the five countries of the river-system is needed as the costs and benefits of improvements are unevenly
distributed. Argentina has the most to gain from improvements of the river-system, whereas most of the

© OECD/ITF 2018                                                                                                  13
THE CONTAINER PORT OF BUENOS AIRES IN THE MEGA-SHIP ERA | DISCUSSION PAPER | ITF ROUNDTABLE 169
costs would be incurred in Bolivia and Paraguay. In such a context, national or bilateral measures can at
best only partially resolve the challenges.
Consequently, the costs of hinterland transport are high in Argentina. The average land transport costs
of importing a 40-feet container in 2014 were USD 2 943 in Argentina and USD 1 191 in Brazil; these
numbers are USD 1 842 and USD 1 000 for exporting via land transport. Data by CEDOL show that the
logistics costs over 2016 have risen with 32%. This undermines the competitiveness of Argentina’s
exporting sectors, such as the soybean cluster (Gauthier et al., 2016).
Planning for the whole freight transport chain is complicated by the division of responsibilities over
different government levels. The AGP is a federal body that acts as the port authority of Puerto Nuevo,
the only port that has not been decentralised to provinces. In contrast, Dock Sud, the other port in the
metropolitan region, is administered by the province of Buenos Aires. An additional layer of complexity is
generated through the geographical proximity of the port to the city, which means that the city of
Buenos Aires – not a stakeholder in the AGP – has limited incentives to accommodate demands of the
port – and might indeed be more focused on using parts of the port land for urban development. The
division of responsibilities over different government tiers also complicates planning and governance
with regards to connection of the port to the hinterland.
Future requirements for container ports
Future requirements for container ports are shaped by future demand for containerised transport
services and probably even more important: the way these containers will be transported. Important
elements in this respect are the size of containerships and consolidation of the industry, which will
determine port network structures.
Future trade projections
The long-term trade prospects for Argentina – and the Buenos Aires region - are favourable. This can be
concluded from the prognoses of the ITF Freight model, which projects the flows of 18 different cargo
types between 226 places in 84 different countries (Martinez et al., 2014).2 For the Buenos Aires region
the model foresees trade volumes in 2050 to be five times the volumes of 2010. This would be driven by
strong growth in exports of manufactured goods and food. The question is how such trade growth might
translate into growth of containerised transport. Some of Argentina’s major exports, grain and soy, are
currently mostly transported as bulk goods, not in containers. Yet, it would be possible to transport these
in containers – as long as oil prices are low - since similar products are transported thusly with low
container freight rates. Focusing on high value added export products might be a way to avoid the
current empty backhaul containers from Buenos Aires, which represents almost half of all outgoing
containers at the moment. Depending on assumptions of containerisation rates, demand for
containerised transport to the Buenos Aires region could rise with a factor of three to four by 2050.
14 © OECD/ITF 2018THE CONTAINER PORT OF BUENOS AIRES IN THE MEGA-SHIP ERA | DISCUSSUION PAPER | ITF ROUNDTABLE 169
Container ship size
Container ship size has quadrupled over the last two decades (ITF, 2015). The average global container
ship capacity in 2016 was around 4 000 TEU, with the largest container ships able to carry 19 200
containers. The increase in container ship size is driven by the quest for economies of scale, in particular
on the Far East-Europe trade line where the largest ships are deployed. This deployment has effects on
all maritime trade lanes, via cascading of vessel types: due to the new larger ships, the ships that were
used previously on Far East-Europe trade lanes will become superfluous and will be used on other trade
lanes, such as Transpacific routes; the ships previously used on this trade lane may then be used in other
trade lanes, and so on. These cascading effects also touch the East Coast of South America.
Table 3. Dimensions of container ships
Vessel TEU capacity Length (m) Width (m) Draught (m)
MSC Oscar 19 200 399 60 16.0
CMA CGM Tigris 10 600 300 48 14.8
Hamburg Süd Cap San Nicolas 10 500 333 48 14.0
Hamburg Süd Santa Clara 7 100 299 43 13.5
Source: ITF elaboration based on data from Dynamar and SeaIntel.
Figure 9. Vessel size on selected East Coast South America trade routes in 2016
8000
Average size container ship (TEU capacity)
7000
6000
5000
4000
3000
2000
1000
0
ECSA-Far East ECSA-North Europe ECSA-North America
Source: ITF elaboration based on data from Dynamar and SeaIntel
The ECSA trade route in which the largest containerships are used is with the Far East. The average ship
capacity on this route was 7 600 TEUs in 2016, slightly larger than the capacity of the Santa-class ships of
Hamburg Süd. The average ship capacity is lower on trade lanes with North Europe and North America,
namely 6 000 TEUs (Figure 9). The largest container ships that has called the port of Buenos Aires is the
CMA CGM Tigris that has a capacity of around 10 600 TEUs. A more or less similar carrying capacity is
© OECD/ITF 2018 15THE CONTAINER PORT OF BUENOS AIRES IN THE MEGA-SHIP ERA | DISCUSSION PAPER | ITF ROUNDTABLE 169
reached with the “Cap”-class ships deployed by Hamburg Süd, an example of the tailor-made ships for
South America, with shallower draft compensated by length. These ships are considerably smaller than
the largest container ship, the MSC “Oscar”-class deployed on Far East-Europe routes (Table 3).
The average container ship size calling Buenos Aires has grown substantially over the last years. This is
part of a global phenomenon reflecting what happens on other trade lanes. Nevertheless, there are
indications that the increase since 2012 has been particularly fast for the East Coast of South America
(Figure 10). The average container ship size on the trade lane with the US East Coast has over 2012-16
increased with 50%, 46% on the trade lane with the Far East and 40% on the trade lane with North
Europe.
Figure 10. Increases in vessel size on selected trade routes 2012-16
16000
14000
Average vessel size (TEU)
12000
10000
8000 2012
6000 2016
4000
2000
0
Asia - N Asia - Asia - Asia - Asia - N Eur - USEC - N Eur -
Eur Med ECSA USWC USEC ECSA ECSA USEC
Source: ITF elaboration based on data from Dynamar and SeaIntel.
This trend of larger container ship sizes is going to continue over the next years. According to ISL’s
Container Fleet Forecast, the share of ships with more than 18 000 TEU will increase from 0.7 % in 2016
to 6.8 % in 2025, their number will increase from 35 to around 350 (Figure 11). Especially the large
number of new orders for ships with 400 metres length and 59 metres beam will fuel the crowding-out
of smaller units from the Europe-Far East trades. Within a short time, ships of 18 000 TEU and more will
be standard on the major North Europe-Far East routes, while operators will continue to use smaller
ships on the minor Europe-Far East routes such as Mediterranean-Southeast Asia. According to the
cascade model, which estimates how ships will move from one trade area to another based on scale
economies, the pressure to use much larger ships on the Transpacific trade (i.e. the “smaller” 18 000 TEU
units crowded out of Europe-Far East) is imminent and ships of 18 000 TEU may be crossing the Pacific
soon – even if the current 21 000 TEU ship design remains the largest until 2025.
16 © OECD/ITF 2018THE CONTAINER PORT OF BUENOS AIRES IN THE MEGA-SHIP ERA | DISCUSSUION PAPER | ITF ROUNDTABLE 169
Figure 11. Container fleet forecast 2016-25 by size classes
100%
Share in the total fleet based on number
90%
80% 18 000 - 22 000 TEU
70% 14 000 - 17 999 TEU
60% 10 000 - 13 999 TEU
50% 6 000 - 9 999 TEU
40% 4 000 - 5 999 TEU
2 000 - 3 999 TEU
30%
1 000 - 1 999 TEU
20%
up to 999 TEU
10%
0%
2016 2020 2025
Source: ITF (2016).
Through the cascade effect, this ship size increase will also affect South America trades. On the Latin
America-Asia trade lane, we may soon see the first 18 000 TEU vessels trickling down from the major
East-West trades. After further ordering of 20 000+ TEU from 2017/18 onwards (delivered after 2020),
we may even spot first 20 000 TEU vessels on this route by 2025. The average ship size on these trades
will grow substantially from 7 700 TEU in 2016 to 12 100 TEU in 2025. A rather surprising result of the
model is the rather modest ship size growth until 2020 despite the Panama Canal opening, that can
accommodate vessels with capacity up to 14 000 TEU. First, the services between Europe on the one
hand and the Caribbean and the South American East Coast on the other hand are not affected as
post-Panamax vessels are already used on this link. Second, despite the massive withdrawal of Panamax
vessels from the fleet, there will still be many Panamax units looking for employment in the not-so-far
future. Due to the age structure of the fleet, scrapping of Panamax vessels will accelerate after 2020 and
lead to an acceleration of the cascade effect in the medium size classes, possibly moderated by the
possibility of new SamMax vessels. Therefore, the average size on the Latin America-Europe services will
increase markedly until 2025 (Figure 12). At the same time, many of the “old” 18 000 TEU vessels – today
still the state-of-the-art for the major East-West trades – will be looking for employment elsewhere and
may also be spotted between Latin America and Europe.
The average capacity of containerships calling the port of Buenos Aires could be around 12 000 TEUs for
the trade lane with the Far East and 6 500 TEUs for the trade lanes with North Europe and North America
in 2025. Disregarding draft limitations for a moment, the largest container vessel calling Buenos Aires by
2020 could have a capacity of around 14 000 TEUs and 18 000 TEU by 2025. The essential question is if
the port of Buenos Aires – but also the other ports in ECSA - would be able to handle such a situation?
And related to that, will the two mechanisms highlighted earlier, namely tailor-made ships and double
dipping in Santos, still work in such a situation?
It is likely that the share of tailor-made ships for the South American market will decrease. Already now a
significant share of the large ships operating in South America have cascaded from other trade lanes
© OECD/ITF 2018 17THE CONTAINER PORT OF BUENOS AIRES IN THE MEGA-SHIP ERA | DISCUSSION PAPER | ITF ROUNDTABLE 169
where these ships started their operations. The current situation of huge overcapacity and uncertainty
over the future of trade – and with it the future deployment of ships – makes ship owners wary of
ordering additional ships for one specific trade. This means that future container ship size will
predominantly be determined by cascading effects, at least for the next decade.
Figure 12. Forecast of ships deployed on major intercontinental routes up to 2025
25,000
Latin America-Asia Latin America-Europe
20,000
15,000
10,000
5,000
0
2016 2020 2025 2016 2020 2025
Minimum 4,250 4,896 5,610 1,608 1,645 1,808
Average 7,659 9,773 12,114 4,202 5,189 6,477
Maximum 13,630 18,270 20,000 9,669 10,100 18,000
Source: ITF (2016).
Larger ships mean larger call sizes, so a larger amount of containers per ship. For Buenos Aires, located at
the end of a string of ports in South America, this means that ships approaching the port of Buenos Aires
will generally have deeper drafts than is currently the case. The average call size in Buenos Aires was
2 220 TEUs per ocean going vessel in 2015, 20% higher than the year before (AGP, 2015). These call sizes
will of course be different according to the trade lane. The reason of the double dipping in Santos is that
this is more beneficial for shipping companies than using Santos as a hub and adding feedering services
from Santos to the other ECSA ports. This might change if the ships become too large to call the other
ECSA ports effectively, so if the relative call size needs to decline to make calls still possible. This is
influenced by conditions in Brazilian trade and ports, i.e. conditions on the whole port range. Cargo
volumes from the Plate estuary are considerably smaller than the ones generated by Brazil, so the
question is: why would Brazilian exporters prefer to have a very large ship around to Argentina more
than 70% before they can use it for their exports?
Another consequence of larger ships and the related larger call sizes is more intense peaks to handle
within the terminal. If cargo flows are less spread out over the week but come all at once, the container
yard risks becoming quickly congested. So, larger ships increase the need for low dwell times and
additional buffer capacity. The ports that are visited by larger ships also have larger terminal space to be
able to handle the peaks in the yard.
It cannot be excluded that at some point in the 2020s there will be even larger ships than currently
ordered. Studies show that 25 000 TEU and even 30 000 TEU ships would be technically feasible, to be
deployed on Asia-Europe routes. Whatever one might think about the desirability or economic logic of
this, the fact is that some ports have already prepared for 25 000 TEU ships, in terms of depth, quay
length and yard capacity, so availability of suitable ports is probably not going to be a constraining factor
for shipping companies. The result of such a development could be the emergence of ships larger than
18 000 TEU at the East Coast of South America.
18 © OECD/ITF 2018THE CONTAINER PORT OF BUENOS AIRES IN THE MEGA-SHIP ERA | DISCUSSUION PAPER | ITF ROUNDTABLE 169
Industry consolidation and alliances
Recent years have been characterised by increasing consolidation in container shipping. Various mergers
have led to a much more concentrated industry; when all the currently announced mergers are
operational in 2018, the top seven carriers will have a global market share of 77%. In parallel, the
coverage of alliances has increased and since April 2017 the number of alliances has been reduced from
four to three. These developments playing out at a global scale have clear impacts on the ports system
on the East Coast of South America.
The container shipping industry active in East Coast South America will in turn become highly
concentrated: we estimate that the two dominant firms will have around 62% of the market share in
2018, when all of the currently announced mergers are operational. In 2018, the top four carriers might
have a market share of 82%; this was 67% in 2010, already an indication of high concentration (Figure
13). The recent merger between Hapag Lloyd and CSAV, made Hapag Lloyd the third carrier in ECSA in
2015. The merger that had the biggest impact is Hamburg Süd-Maersk, respectively the second and
fourth carrier active in ECSA. Competition authorities have approved that merger only under the
condition that the merged entity gives up some of its combined network in South America.
Figure 13. Potential concentration rates of carriers active in ECSA in 2018
40%
35%
30%
Share of capacity
25%
20%
15%
10%
5%
0%
Source: ITF elaboration based on data from Dynamar and SeaIntel.
The global developments with regards to alliances will have less impact. In contrast to the East-West
container trades, vessel sharing agreements on the ECSA are more flexible and do not follow the general
pattern for the major East-West trades. We would expect that competition authorities would prohibit
2M (Maersk-MSC) joint services to ECSA, considering their projected market share of 62%.
Regional port competition
Increasing ship size and alliances could give rise to concentration of port systems. With stable cargo
flows, the combination of bigger ships and industry consolidation leads to less service frequency and less
© OECD/ITF 2018 19THE CONTAINER PORT OF BUENOS AIRES IN THE MEGA-SHIP ERA | DISCUSSION PAPER | ITF ROUNDTABLE 169
direct port-to-port connections. This is happening in many world regions, including in East Coast South
America. For example, the number of weekly ECSA-Far East container services has declined from seven
in 2013 to three services in 2016 (Figure 14). Similar reductions in service frequency have taken place on
other major ECSA trade lanes: with North Europe, the Mediterranean and North America. This means
increased peak concentration in the ports used in these services. The reduction of the number of
different ECSA ports visited is not yet taking place on all trade lanes, but has been observed on the
ECSA-Med trade lane (from 16 ECSA ports in 2013 to 13 in 2015) and the ECSA-North America trade lane
(from 17 ECSA ports in to 15 in 2015) (Dynamar, 2015). We already mentioned that bigger ships have led
to larger absolute port call sizes, which means requirements for deeper drafts. The additional effect of
alliances is a reduction of the number of ports called at, so larger relative call sizes for some of the larger
ports. Some of the smaller ports in the string of ports will be left out of the loops, increasing the share
that the remaining ports will handle. In terms of consumer markets, Buenos Aires would be well placed
to increase market share; the challenge is how to accommodate larger call sizes, considering draft
limitations and peak effects. If no convincing answer is found to these challenges, it is likely that other
ports will take market share from Buenos Aires. There is port competition in the region that makes this a
real possibility.
Figure 14. Weekly ECSA-Far East container services 2012-16
8
7
6
5
4
3
2
1
0
2012 2013 2014 2015 2016
Source: ITF elaboration based on data from Dynamar and SeaIntel.
Regional port competition takes different forms. For the gateway traffic from and to the larger Buenos
Aires region, Puerto Nuevo and Exolgan continue to be the most logical choices, but TecPlata could be an
alternative provided that it improves its hinterland connections. If maritime accessibility and spatial
constraints in Puerto Nuevo do not improve, shipping companies might reach a point where leaving
Buenos Aires out of their direct intercontinental connections is beneficial. Traffic to and from Buenos
Aires could in that case be assured via feedering services with ports like Montevideo, Paranagua or
Santos. With regards to transhipment cargo, it should be noted that Buenos Aires is the dominant
container port in Argentina, but in fact not used as the main hub for other Argentinian ports. A large
share of Argentina’s grain exports is transported via the port of Rosario to deep sea ports like Santos
where it is transhipped to larger ships before continuing. Similarly, much of the cargoes coming from the
south of Argentina use ports like Bahia Blanca, Ushaia, Puerto Deseado, Puerto Madryn and Mar del
20 © OECD/ITF 2018THE CONTAINER PORT OF BUENOS AIRES IN THE MEGA-SHIP ERA | DISCUSSUION PAPER | ITF ROUNDTABLE 169
Plata to go to Montevideo or South Brazil where the cargoes are transhipped to larger ships. Using the
port of Buenos Aires is not an option as it adds cost and travel time considering its location more than
200 kilometres upstream on the River Plate. Although enough cargo flows are generated in Argentina to
justify an Argentinian container port hub, the upstream location does not make Buenos Aires suited to
such a role.
Policies to adapt to future requirements
Bigger ships, industry consolidation and increased trade will pose numerous challenges for the port of
Buenos Aires, already constrained by modest performance. Policies have been adopted to improve this
situation; these are reviewed in this section and additional potential measures are discussed.
Current policies
Improving trade and infrastructure is central to the agenda of the Macri government that took office
December 2015. Its medium-term strategic framework focuses on four critical priorities: poverty
eradication, economic reforms to boost longer-term productivity growth, improved governance and
global integration. As part of its economic reforms it intends to facilitate international trade and invest in
infrastructure, including in ports, railways, roads and waterways. As part of its priority of global
integration, the government wants to engage in trade talks on various fronts. Since it took office, the
government has brought import licenses in line with WTO procedures and lifted or reduced export
taxes.3 These trade-friendly measures will facilitate the maritime trade of Argentina and growth in cargo
handling at Argentinian ports.
The government’s transport agenda for 2016-19 contains many elements that should improve freight
transport and maritime trade in Argentina. It is based on three strategic pillars (infrastructure
investment; connectivity and safety; quality and sustainability), covering all modes and providing an
investment envelope of USD 30 billion. While most of these funds are reserved for roads, a substantial
part is also to be invested in freight rail and ports (Figure 15), in particular the port of Buenos Aires
(USD 1.5 billion). Goals to be achieved in 2019 include an increase of rail freight transport of 50% and
faster and more reliable water transport.
The question is how government policy addresses the main challenges related to the port of Buenos
Aires, as identified in previous sections. This will be treated below, by assessing policies on container
terminal capacity, port-city interfaces, hinterland connectivity and governance.
© OECD/ITF 2018 21THE CONTAINER PORT OF BUENOS AIRES IN THE MEGA-SHIP ERA | DISCUSSION PAPER | ITF ROUNDTABLE 169
Figure 15. Planned government investments in transport 2016-19
14
12
10
Billion US dollars
8
6
4
2
0
Roads Urban Freight rail Ports and Air
mobility waterways
Source: ITF elaboration based on data from Argentina government.
Container terminal capacity
The immediate concern is to secure container handling capacity, considering the imminent expiration of
concessions of the three container terminals at Puerto Nuevo. The concessions of all three container
terminals will expire in the course of 2019. Expiration in 2019 was intended at the granting of the
concessions for Rio de la Plata and Terminal 4. The concession for Terminal 5 officially expired in October
2012, was then temporarily extended and then granted an additional extension of five years in 2015
(Table 4). Although AGP, the port authority of Buenos Aires, did not intend to grant extensions of the
concessions or renegotiate contracts for existing concessions, it will extend existing concessions to 2020.
Table 4. Expiration of container terminal concessions at Puerto Nuevo
Terminal Concession-holder Expiry date
Terminal 1-2-3 Rio de la Plata November 2019
Terminal 4 APM Terminals February 2019
Terminal 5 BACTSSA October 2019
Source: ITF elaboration.
AGP has formulated a plan to make the port ready for the largest container vessels. This plan essentially
consists of land reclamation in the current port, which will transform some of the current finger piers
into linear quays. This new port layout would make it possible to accommodate 14 000 TEU ships with a
length of 365.5 metres and beam of 51.2 metres. A crucial element of the plan is to move from three to
one container terminal, which would increase terminal size. The needed investments are stated to be
USD 1.2 billion, half of which would be paid by the Argentinean government and the other half by the
new terminal operator. The duration of the new concession is said to be 50 years or 35 years with a
possible 15 years extension.
22 © OECD/ITF 2018THE CONTAINER PORT OF BUENOS AIRES IN THE MEGA-SHIP ERA | DISCUSSUION PAPER | ITF ROUNDTABLE 169 Hinterland connectivity The government has announced major infrastructure investments that should improve the freight transport system connecting the ports to their hinterlands. In particular this is the case for the investments in road infrastructure and freight railways, specifically aimed at better connecting North West Argentina. We have not come across a strategic analysis by the government identifying the largest bottlenecks, the main current and potential freight flows and where it would make most sense to improve networks. So, at this point it is difficult to assess how current infrastructure investments might improve the freight transport network. Government policy with respect to hinterland connectivity of the port of Buenos Aires might have mixed results. An important project in this respect is the Paseo del Bajo project that will connect the Buenos Aires-La Plata and Illia highways, whilst creating new green spaces in the El Bajo area of Buenos Aires. Its aim is to relieve congestion in the city and improve the North-South connections with 12 new lanes over six kilometres, including a semi-underground road of four lanes intended for heavy vehicles. This new access will allow freight traffic to exit the Buenos Aires-La Plata highway, cross the centre without traffic lights and to enter the port directly, which could improve travel times. Yet, as part of the works associated with the Paseo del Bajo project, the national government is putting some key port land up for sale: the railway sidings at Empalme Norte (Retiro) and practically all of the customs warehouses adjacent to the container handling facilities in Puerto Nuevo. This might complicate railway access and detract from value added logistics services in the port: it takes rear space away from the port necessary to keep the port operational. How well are policies adapted to future requirements? The AGP proposal foresees deepening of the access channels in the River Plate to 11 metres. Earlier we showed that the arrival of 14 000 TEU ships in Buenos Aires by 2020 and 18 000 TEU ships could be the outcome of cascading effects from current and future ship orders of mega containerships up to 2020 and 2025. Considering that most of these ships are not tailor-made for South America, a depth limit of 11 metres would impose limits on the extent to which these ships could be loaded when calling Buenos Aires. None of the generic containerships would be able to call Buenos Aires half loaded or more; ships up to 10 000 TEU could only call at the port if loaded at 25% of capacity (Table 5). Ships with a capacity larger than 10 000 TEU would only be able to call Buenos Aires if loaded less than 25%. Dredging the River Plate to 12.8 metres is generally considered to be the maximum feasible, considering geology and other characteristics of the river. Dredging to that depth would make it possible to have calls from ships with capacity up to 20 000 TEUs as long as these are not loaded beyond 25% capacity. The proposal for restructuring of the container terminals would increase yard space, but only fairly modestly. The current container yard space of the three terminals together is 77 hectares; in the proposal this would increase to 91 hectares. One could wonder if this will provide the appropriate buffer capacity needed for handling larger ships. It is well-known that the number of unproductive yard moves (reshuffling) increases exponentially when yard utilisation rates exceed 80%. The high call sizes of larger ships create peaks during which these critical thresholds are exceeded – unless considerable changes in procedures are considered. In order to avoid this, some buffer capacity is needed. It has been shown that doubling average ship size calling at a terminal requires around a third more yard capacity, if terminal congestion needs to be at similar levels (Drewry, 2016). Ship size is increasing quickly; in ECSA average ship size increased 40-50% between 2012 and 2016 and is expected to rise at similar pace in the coming years. This suggests that the buffer capacity created by the additional yard space is fairly limited. This © OECD/ITF 2018 23
THE CONTAINER PORT OF BUENOS AIRES IN THE MEGA-SHIP ERA | DISCUSSION PAPER | ITF ROUNDTABLE 169

means that congestion of the container yard can only be avoided by increasing the quay side
productivity, decreasing dwell time in yards and improving port gate policies.

               Table 5. Draft requirements of container ships according to size and utilisation rate
                           Draft requirements with utilisation rates of:
Ship capacity              100%                   75%                      50%                      25%
> 20 000 TEU               18.0                   16.2                     14.4                     12.6
≤20 000 TEU                16.5                   14.9                     13.2                     11.6
≤15 000 TEU                16.0                   14.4                     12.8                     11.2
≤10 000 TEU                15.5                   14.0                     12.4                     10.9
≤5 000 TEU                 14.0                   12.6                     11.2                     9.8
≤3 000 TEU                 13.9                   12.5                     11.1                     9.7

Note: This table reflects generic designs of containerships, not tailor-made SamMax ships.

Source: ITF elaboration based on data from Palsson et al.

If container volumes grow by a factor of three to four as predicted by our freight model, there will be a
moment in the next three decades when demand will exceed projected container terminal capacity. In
the short term there certainly is not a lack of container port capacity – although most of this capacity
might not be suitable for the ship sizes that will soon come to the East Coast of South America. Currently
available capacity (almost 3 million TEU handling capacity in the Buenos Aires region) is around double
the volume handled. If all of the possible extensions and announced plans would be realised, this
capacity would even rise to almost 4 million TEU.

                            Table 6. Maximum capacity of main ECSA container terminals
Terminal                                  Current capacity (mln TEU)               Max. future capacity (mln TEU)

Dock Sud (Buenos Aires)                   0.9                                      1.1

TecPlata                                  1.0                                      1.0

TCP (Montevideo)                          0.9                                      1.9
Tecon Rio Grande                          1.1                                      2.0

Tecon Paranaguá                           1.5                                      2.5

Brasil Terminal Portuario (Santos)        1.5                                      2.2

Embraport (Santos)                        1.2                                      2.5
Tecon Santos                              2.0                                      2.4

Source: ITF elaboration based on data from Dynamar, Drewry, terminal operators and port authorities.

 24                                                                                                        © OECD/ITF 2018
THE CONTAINER PORT OF BUENOS AIRES IN THE MEGA-SHIP ERA | DISCUSSUION PAPER | ITF ROUNDTABLE 169
Table 7. Projected capacity of Buenos Aires container ports
Port Volume 2015 Capacity 2015 Max. planned capacity
Puerto Nuevo 1.0 1.5 1.8
Dock Sud 0.5 0.9 1.1
TecPlata 0.0 0.5 1.0
Total 1.5 2.9 3.9
Source: ITF elaboration based on data from Dynamar, Drewry, terminal operators and port authorities.
Suggestions for policy
The government can be commended for its willingness to solve challenges related to the freight
transport system. Infrastructure investments might solve bottlenecks and the focus on improving the
port of Buenos Aires could reduce transport costs and thus facilitate Argentina’s trade. The government
has made a principled choice to open a public tender with competitive bids. The AGP has come up with a
proposal based on the assumption that the port of Buenos Aires is only viable in the future if it has fewer
but larger terminals with linear quays. Although these ideas are correct, one can wonder if the proposal
in its current form will appeal to potential bidders.
The proposal for Puerto Nuevo is framed as a solution for the long term, but it is most likely only a
solution for the short – and possibly medium – term. The rapid increase of container ship size,
consolidation of the container shipping sector and rationalisation of port networks means fewer but
much larger call sizes. The container port of the future needs to be deep and large with a fast
turnaround. The port of Buenos Aires is at this moment none of the above. The AGP proposal will only
solve these challenges partially. It envisages the deepening of the access channel, but to a depth that will
only be sufficient for a few years, so dredging would need to be guaranteed constantly for the next 35-50
years. In addition, it is not very clear how current bottlenecks – such as waiting time in the access
channel, high ship turnaround times, long container dwell times and expensive hinterland transport – will
be solved with the proposed changes. Moreover, the plan has a considerable price tag, to be covered by
bidders for the two concessions. Future concessionaires would want to recover their investment costs,
which means that the concession duration would need to be relatively long, e.g. 20-25 years.
Buenos Aires is an interesting market for a global terminal operator, but not against all odds. It is the
gateway to Argentina, second largest economy in South America, with huge potential for growth. Not
surprisingly, Buenos Aires is one of the few places on earth where all four large global terminal operators
have a terminal. However, this is not a guarantee for future interest. The place of Buenos Aires within
the port system of the East Coast of South America is under pressure. If other ports in the regions – with
deep sea access and larger terminals – would become more attractive, shipping companies might decide
to cut Buenos Aires out some of their loops if they have cheaper alternatives available, e.g. in the form of
hub-and-spoke networks. So the interest of potential bidders cannot be taken for granted. This means
that the task for AGP is delicate: it has a vision on what Puerto Nuevo could look like, but could end up
with a lack of interest in the tender.
This is not an issue for Buenos Aires alone. The question at stake is: what is the most effective future
container transport system for Argentina as a whole? This requires careful analysis of current and
potential future trade flows and transport costs. The trade competitiveness of Argentina would benefit
from the lowest possible transport costs for its exporters. This might be achieved in different ways;
© OECD/ITF 2018 25You can also read