London Borough of Newham Cycling Strategy 2017/18 2024/25
←
→
Page content transcription
If your browser does not render page correctly, please read the page content below
London Borough of Newham

Cycling Strategy 2017/18 – 2024/25
Contents

Contents .................................................................................................................................................. 1
Table of Figures ....................................................................................................................................... 3
Foreword................................................................................................................................................. 4
Executive Summary................................................................................................................................. 5
Policy Context and Rationale .................................................................................................................. 7
   Public health ....................................................................................................................................... 7
   Cycling investment .............................................................................................................................. 8
Cycling Environment in Newham ............................................................................................................ 9
   Geography and demography .............................................................................................................. 9
   Transport and severance .................................................................................................................... 9
   Street pattern and profile ................................................................................................................... 9
Cycling in Newham................................................................................................................................ 10
Cycling safety in Newham ..................................................................................................................... 17
Addressing barriers to cycling ............................................................................................................... 19
Objective 1 - Create safer and more inviting conditions for cycling ..................................................... 20
   Design principles ............................................................................................................................... 20
   Network ............................................................................................................................................ 21
   Existing Facilities ............................................................................................................................... 21
   Future Network ................................................................................................................................. 26
   Healthy Streets and Neighbourhoods............................................................................................... 28
   Planned Road Maintenance and Improvements .............................................................................. 29
   Infrastructure Programme ................................................................................................................ 34
   Short Term (2017/18 – 2018/19): ..................................................................................................... 34
   Medium Term (2019/20 – 2021/22): ................................................................................................ 34
   Longer Term (2022>): ....................................................................................................................... 35
Objective 2 - Provide the education to cycle ........................................................................................ 46
   Cycle Training .................................................................................................................................... 46
   School Travel Plan Programme ......................................................................................................... 48
   Sustrans ‘Bike-It’ Project ................................................................................................................... 49
Objective 3 - Improve access to, and maintenance of, cycles ............................................................. 50
   Cycle Hire .......................................................................................................................................... 50
   Cycle Maintenance............................................................................................................................ 51

                                                                                                                                                           1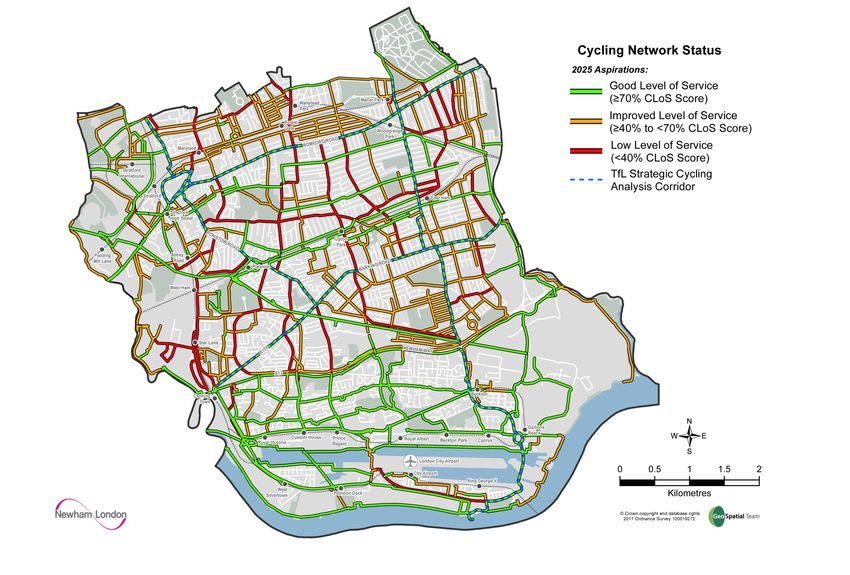
Objective 4 - Improve enforcement and security for cycling ............................................................... 53
   Cycle Storage..................................................................................................................................... 53
   Enforcement ..................................................................................................................................... 53
Objective 5 - Normalise cycling in Newham and inspire more residents to cycle ................................ 55
References ............................................................................................................................................ 58

                                                                                                                                                        2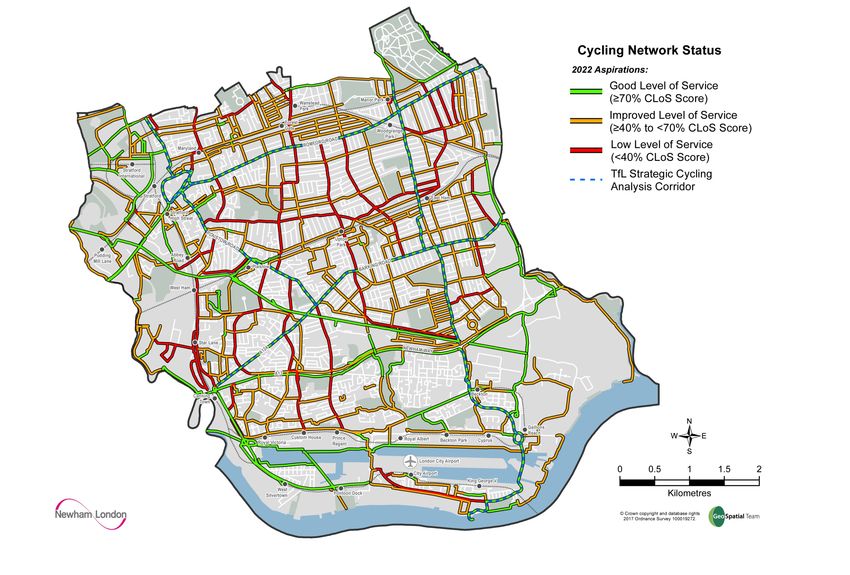
Table of Figures

Figure 1 - Measures of cycling in Newham ........................................................................................... 12
Figure 2 - Resident Modal Split in Newham (Source: London Travel Demand Survey, TfL) ................. 13
Figure 3 - Commutes by cycle, Newham 2011...................................................................................... 15
Figure 4 - Commutes by cycle, Newham and neighbours, 2011........................................................... 16
Figure 5 - 2010-2014 Casualties on Newham roads by user................................................................. 17
Figure 6 - Number of cyclist casualties in Newham by severity ........................................................... 17
Figure 7 - Number of pedal cycle user casualties 2010-2014 in Newham by route ............................. 18
Figure 8 - Newham Cycling Levels of Service, 2016 .............................................................................. 24
Figure 9 - Methods and examples of creating space for cycling in Newham ....................................... 26
Figure 10 - Proposed Strategic Cycling Corridors in Newham .............................................................. 30
Figure 11 - LBN Identified Strategic Cycling Network Corridors (Table) ............................................... 32
Figure 12 - LBN Identified Strategic Cycling Network Corridors (Graph) .............................................. 33
Figure 13 - LBN Identified Cycling Infrastructure Programme - Short Term 2017/18 – 2018/19......... 36
Figure 14 - LBN Identified Cycling Infrastructure Programme - Medium Term: 2019/20 – 2021/22... 37
Figure 15 - LBN Cycling Levels of Service - Short Term Programme ..................................................... 40
Figure 16 - LBN Cycling Levels of Service - Effect of Short Term Programme ...................................... 41
Figure 17 - LBN Cycling Levels of Service - Medium Term Programme ................................................ 42
Figure 18 - LBN Cycling Levels of Service - Effect of Medium Term Programme.................................. 43
Figure 19 - LBN Cycling Levels of Service - Long Term Programme ...................................................... 44
Figure 20 - LBN Cycling Levels of Service - Effect of Long Term Programme ....................................... 45
Figure 21 - Cycle Training Outcomes 2013/14 - 2015/16 ..................................................................... 47
Figure 22 - Mode of travel to school 2013/14 - 2015/16 ..................................................................... 49

                                                                                                                                     3
Foreword

We are all impacted by the challenge of toxic air and inactivity, and as a Council we have always
believed in helping people make a positive change to their lives.

That’s why the council has been working to create a new Cycling Strategy which aims to make is
easier, safer and cheaper to take to pedal power.

With our new cycling strategy we aim to more than double the number of journeys taken by bike
between now and 2025.

Doubling the levels of journeys made by bike will help build personal resilience through encouraging
healthier and active lives, while also building community resilience through reducing congestion on
our roads and pollution in the air we breathe.

To make the strategy a reality we will commit to investing in our roads and cycle facilities to make
them safer for cyclists and ultimately make the borough a more attractive place to live and to get
around. We will also continue to train more residents to ride bicycles safely and we will also improve
enforcement and security for cyclists.

We will make it easier and cheaper for residents to access and use bicycles across the borough
through the introduction of a new “dockless” cycle hire scheme that will put an affordable bicycle
journey within easy reach of residents.

We want a sustainable future for Newham with residents that can live healthy lives thanks to the
work we do, and I want to encourage you all to get on a bike!

Sir Robin Wales

                                                                                                    4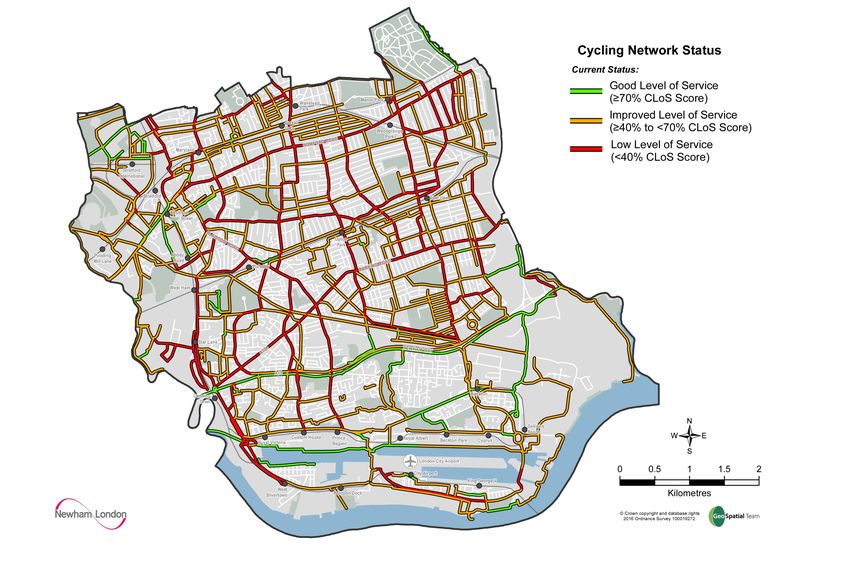
Executive Summary

Newham, along with the rest of London, faces both an inactivity crisis leading to poor health, and a
serious challenge to deliver ‘good growth’ without a deterioration in the transport, environmental
and health conditions for our existing residents. Unless we can change the way that people travel in
Newham, and wider across London, we are unlikely to be able to tackle either challenge effectively.

In order to encourage more sustainable and active travel across the Borough, the support for trips
made by sustainable modes must be embedded in Councils’ thinking and supported by policy.

This Borough Cycle Strategy 2018-2025 sets outs the Council’s policy to support cycling and a
presents a plan of action to deliver greater numbers of cycling trips in Newham, with a target of 5%
of trips across the Borough being made by bike by 2025. This is more than a doubling of existing
levels of cycling across the Borough.

The Borough seeks to achieve this increase with a series of targeted interventions based around five
broad objectives:

   1. Create safer and more inviting conditions to cycle – by ensuring cycling infrastructure is of
      better quality and delivers a ‘grid’ of routes with a high Cycling Level of Service. This
      includes segregation of cycle tracks and the implementation of a ‘Healthy Neighbourhoods’
      approach using filtered permeability to reduce motor traffic volumes and speeds, and
      improve physical activity levels, air quality, and community cohesion in residential areas
      bounded by classified roads.

   2. Provide the education to cycle – by ensuring the Council maintains a programme of adult,
      young adult and child cycle training, including encouraging cycling to school through the
      School Travel Plan and Bike It programmes.

   3. Improve access to, and maintenance of, cycles – by expanding opportunities to hire a cycle
      across the Borough and to continue the Council programme of bike check and repair events,
      incorporating basic bicycle maintenance training opportunities for local residents.

   4. Improve enforcement and security for cycling – by continuing to roll-out secure residential
      cycle parking on demand, applying security markings to bicycles at events, and working with
      the MPS to address theft and issues regarding cyclist behaviour.

   5. Normalise cycling in Newham, and inspire more residents to cycle – by encouraging
      participation in led-rides and other introductory events, by targeting groups with known
      resistance to cycling by the identification and use of ‘community cycling champions’ for
      promotion and by increasing the profile of cycling and its benefits across Council
      communication channels.

The strategy sets out the steps needed to deliver a significant increase in the levels of cycling in
Newham and improve safety, including the transformation of the built environment so that all
residents can benefit from increased levels of physical activity, improved air quality, less noise

                                                                                                  5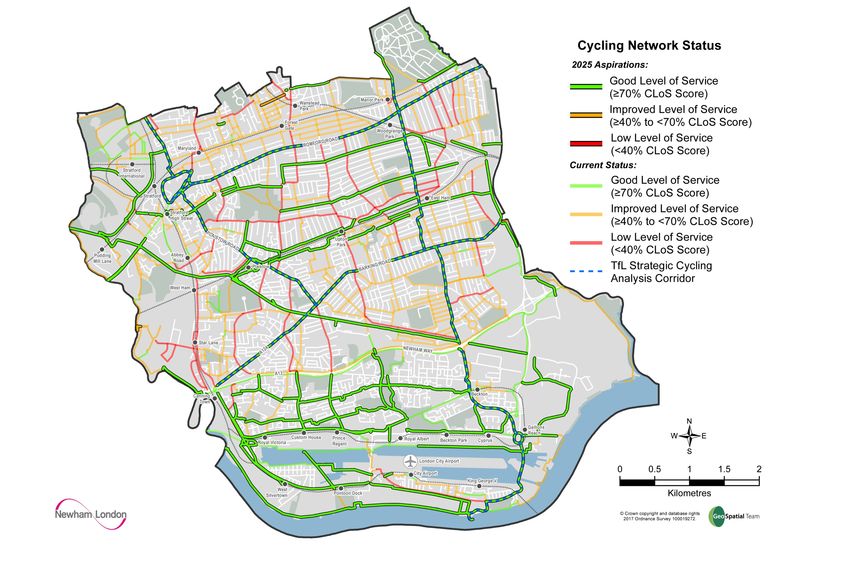
pollution and unnecessary traffic, better access to employment and services, and the resilience this
brings.

This is an evidence-based, coherent strategy to coordinate investment, including levering significant
external contributions, for the maximum benefit of Newham residents.

                                                                                                   6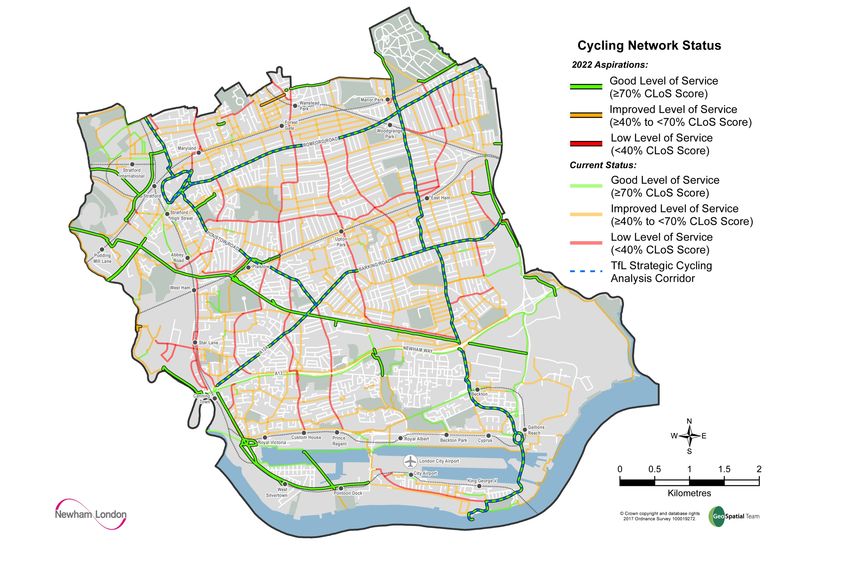
Policy Context and Rationale

Recognition of the current, and huge potential positive contribution of cycling to transport, health,
and environmental objectives is contained in both regional policy, in the form of the London Plan
(GLA, 2015; and draft 2018) and the draft Mayor’s Transport Strategy (GLA, 2017); and locally in
Newham’s Core Strategy (adopted in 2012) and draft Local Plan where the need to improve
conditions to facilitate more cycling is highlighted in multiple policies. 1

In addition, it is increasingly recognised at a regional level that more and safer cycling can make a
vital contribution to the health of Newham’s and London’s population. Transport for London’s (TfL’s)
action plan ‘Improving the Health of Londoners’ (TfL, 2014) as part of the ‘Healthy Streets’ approach,
highlights the valuable contribution that cycling make towards increasing physical activity, improving
air quality, reducing noise pollution, and improving access to housing, employment, and services.

The draft Mayor’s Transport Strategy (GLA, 2017) sets out a range of ambitious cycling targets for
2041, including achieving an 80% mode share for sustainable modes across London, ensuring that
70% of Londoners live within 400m of a high-quality, safe cycle route, and helping all Londoners do
at least the 2x10 minutes of active travel they need to stay healthy every day.

Public health

With the responsibility for public health passed to Local Authorities in 2013, the London Borough of
Newham, in addition to being the local Highway and Planning Authority, is now well placed to
coordinate actions to facilitate an increase in cycling to lever significant health and other benefits for
Newham’s population. Facilitating cycling and active travel 2 forms a crucial element of the Joint
Strategic Needs Assessment (JSNA) for Newham, and of particular importance, the Needs
Assessment 3 for Physical Activity.

Physical inactivity directly contributes to one in six deaths in the UK, the same number as smoking,
and costs the UK economy at least £7.4 billion a year (Wen and Wu, 2012; cited PHE 2014). There
are significant levels of physical inactivity in Newham with only 44.8% of adults (age 16+) achieving
at least 150 minutes of physical activity per week in 2015 compared to the London average of 57.8%
(PHE, 2016). This presents significant challenges around improving life expectancy and extending
years of good health. In addition, 39.8% of adults are classed as inactive – doing less than 30
minutes of physical activity a week. This equates to approximately 90000 4 adults across the
borough. Every 1 percentage point increase in the share of trips by bicycle by Newham residents
could represent up to approximately 3300 more people being physically active 5 and thus has
unparalleled potential to reduce the number inactive. As TfL and the GLA recognise, active travel is

1
  S1 Spatial Strategy, SP2 Healthy Neighbourhoods, SP3 Quality Urban Design within Places, SP7 Quality
Movement Corridors and Linear Gateways, INF1 Strategic Transport, and INF2 Sustainable Transport (LBN,
2012) .
2
  Active travel includes walking and cycling, including to access public transport
3
  JSNAs are assessments of the current and future health and social care needs of the local community
(Department of Health, 2013)
4
  225,228 (GLA Population estimate, age16+, 2015)*0.398 = 89,640
5
  Calculations from London Travel Demand Survey (TfL)

                                                                                                         7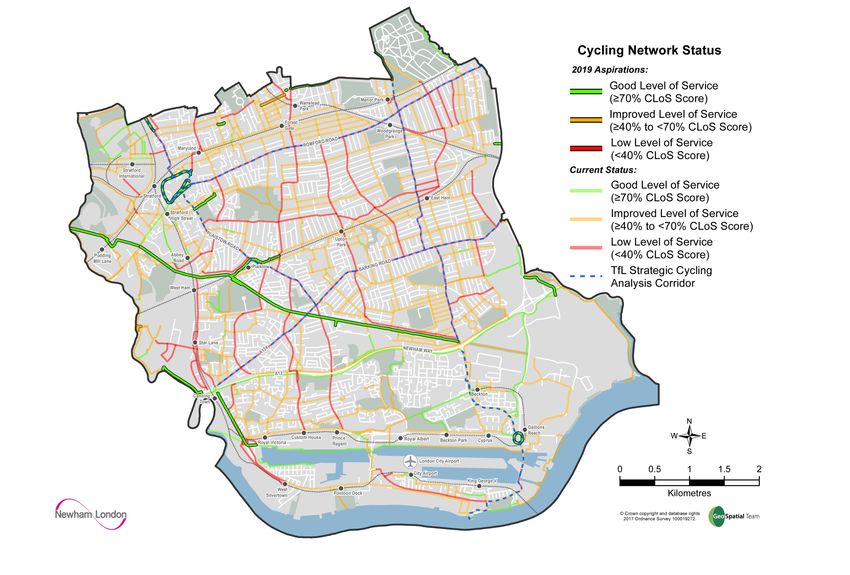
the only viable option for significantly increasing physical activity levels across London’s whole
population (FPH, 2013; cited TfL, 2014a).

Newham council and Newham Clinical Commissioning Group are developing an Integrated
Prevention Strategy to identify the root causes of physical inactivity and develop and adapt services
through a communities approach, making every community and building count and making every
contact count. In addition, with a growing awareness of the need to improve air quality and address
London’s inactivity crisis it is clear that a modal shift to cycling can make a huge contribution to
levels of physical activity, increased life expectancy and extending the years in good health of
Newham’s population.

Cycling investment

The previous Mayor of London’s Vision for Cycling (GLA, 2013) outlined the strategic ambition for
cycling across the capital through to the early 2020’s, in accordance with the then current London
Plan that aimed for 5% of all trips by London residents to be made by bike by 2026, from 2.7% in
2016 (2.2% in Newham). Central to the vision was the need to create conditions that entice a much
wider range of people on to bikes, and for cycling to be seen as a routine and viable method of
transport for everyone.

A City for all Londoners (GLA, 2016) set out the ‘Healthy Streets’ approach as a pre-curser to the
Mayor’s Transport Strategy, builds upon this vision and highlights the role and potential of the
Healthy Streets Approach to encourage more walking and cycling to improve the health and quality
of life of all Londoners. The latest TfL Business Plan, published in December 2016, sets out a total of
£770m to be spent on cycling schemes up to 2022 as part of a wider £2.1bn Healthy Streets
portfolio. This strategy and investment will help Newham seize opportunities to access investment
to improve air quality, levels of physical activity and the health of residents.

Following the success and inspiration of the Olympic Games, Newham engaged with TfL to deliver
some of the first infrastructure working towards the high standard envisioned, in the form of the
extension of Cycle Superhighway 2 from Bow to Stratford which opened in late 2013. Subsequently,
Newham, along with all other outer London boroughs, were invited to bid to TfL under the Mini-
Holland programme for major transformation to conditions for cycling across the borough. Whilst
unsuccessful in the final round, significant elements of Newham’s bid, such as the transformation of
Stratford gyratory and town centre, and improvements to the Newham Greenway, are now being
taken forward under different programmes. Newham’s bid under the Mini-Holland programme, and
subsequent work undertaken following the publication of the revised London Cycling Design
Standards (LCDS) (TfL, 2016) inform this strategy to facilitate more and safer cycling in Newham.

Newham’s current Local Implementation Plan (LIP) and the forthcoming revision in LIP3 sets out the
local policies and programmes over rolling three year period that contributes to the delivery of the
outcomes identified in the Mayor’s Transport Strategy as well as borough specific outcomes, and
forms the funding bid to TfL for schemes to deliver these. Since 2008 many LIP and other externally
funded schemes have contributed to improving conditions for cycling in Newham; there is now an
opportunity to ensure that the next LIP (2018/19 – 2020/21), and funding directly from the Mayor’s
Vision for Cycling and other sources, including improvements secured from new development via

                                                                                                     8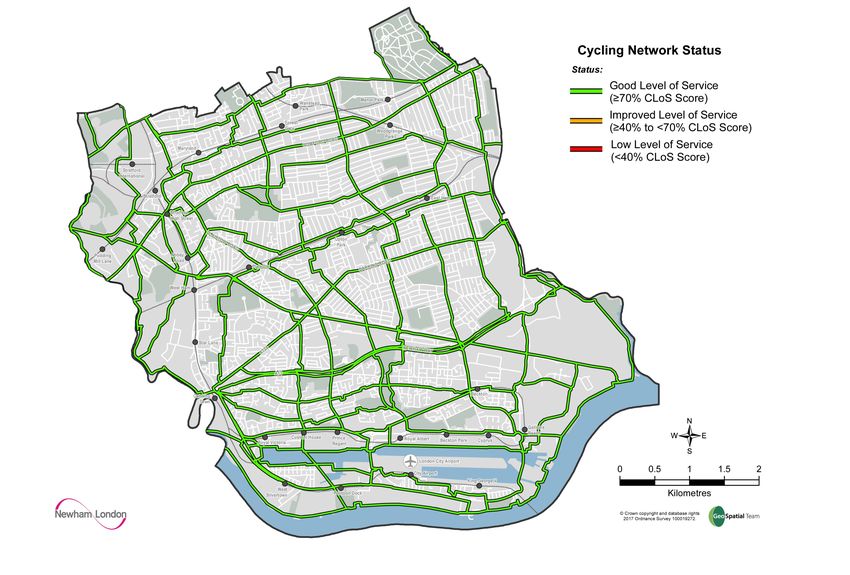
the planning system, make a significant contribution to achieving the increased levels of cycling
needed for the health and resilience of Newham’s residents.

                             Cycling Environment in Newham

Geography and demography

Newham is located five miles east of the City of London, occupying 14 square miles (36 square
kilometres) and is bounded by the rivers Lea to the west, Thames to the south, and Roding to the
east and by the A12, Leytonstone, and Wanstead Flats to the north. Newham is among the flattest of
London Boroughs with the majority of the borough below 15m above sea level.

Neighbouring boroughs are Waltham Forest, Redbridge, Barking & Dagenham, Tower Hamlets,
Hackney, and Greenwich.

Newham’s population has increased significantly in recent years to approximately 330,500 (2015
estimate, GLA) suggesting a population density of 23,800/sqmile (9200/km2), the 11th highest in
London. However, with Newham’s population expected to grow to above 400,000 by 2031 this
would result in a population density of 28,900/sq mile (11,200/km2), the equivalent of the sixth
most densely populated London borough in 2015.

Transport and severance

Newham has arguably some of the best public transport connections in the UK (and a corresponding
high proportion of trips) and owing to Newham’s position the majority of road and rail infrastructure
runs from west to east, radiating out from Central London.

East-west severances include the Thames, Royal Docks, the DLR (x2 lines), the A13, the Northern
Outfall Sewer (NOS, aka The Greenway), the District Line, and to a lesser extent the A12, the Gospel
Oak to Barking London Overground Line and Wanstead Flats. In addition, north-south severances
include the River Lea and tributaries, the A12, the DLR/Jubilee Line, the A406, and the River Roding.

Therefore there are at least ten east-west, and five north-south, major geographical severances in
the borough, all with limited points of access across.

These severances represent barriers that generally cannot be crossed at ground level and therefore
require significant infrastructure (ramps, bridges or subways) for road transport, and in particular
the sustainable modes of walking and cycling, to overcome.

Street pattern and profile

The residential street pattern in Newham is broadly characterised by a dense grid network of
relatively narrow (7m carriageway, 12m highway) uniform Victorian terraced streets to the north
and east; a mixture of pre and post-war (but still high density) streets with a higher proportion of
green space and the Royal Docks to the south; and increasingly, modern higher-rise and density
developments in the ‘arc of opportunity’ running from Stratford and the Queen Elizabeth Olympic
Park (QEOP) in the northwest to Canning Town and the Royal Docks in the southwest and south.

                                                                                                   9
In addition to the A13 there are 13 classified ‘A’ and ‘B’ roads in the borough, generally wider (up to
18m+ carriageway in places, 25m+ public highway between building lines) though some have pinch
points ranging down to a 7m carriageway and 10m highway (e.g. A1011 Manor Road).
The vast majority of roads in the borough are controlled by Newham as the Highway Authority, with
the exception of the A13, and the A117/A1020 Pier Road/Royal Docks Road to the A13, effectively
forming the south-eastern extent of the north circular road to the Woolwich Ferry, that are
controlled by TfL.
Newham’s major town centres are located at Stratford in the north west and East Ham towards the
east. District centres are located at Canning Town to the south west, Forest Gate to the north, Green
Street towards the centre and Beckton to the south east.
The density, proximity to inner and central London, supporting planning polices promoting mixed-
use development, and flat topography, have the potential to be strong enabling factors to much
higher levels of cycling in Newham, provided that the other physical conditions for cycling (Cycling
Levels of Service) are improved sufficiently, severance challenges addressed, and that people can
access bicycles, and are given the adequate education and inspiration to cycle.
Cycling in Newham
According to the London Travel Demand Survey (LTDS) the proportion of trips by bicycle made by
Newham residents (and originating in Newham) has increased from 0.7% in 2007-10 to 2.1% in 2013-
16, an increase of 200%.
This is in the context of an increasing proportion using rail and underground (from 11% to 15.4%)
and bus (from 15.9% to 17.9%), a decline in walking (from 38.5% to 36.2%), and a steadily declining
proportion using car and taxi (from 33.8% to 28.2%), with overall share of trips by sustainable modes
(active travel and public transport) increasing from 66.1% to 71.6% in that period.
This data broadly corresponds to trends in census data showing the proportion of working age adults
in work in Newham travelling by bicycle increasing from 1.37% in 2001 to 1.63% in 2011, an increase
of 18%. Again this is in the context of significant increases in the proportion using public transport
(from 52.2% to 63.8%) and a declining proportion using private motorised transport (from 30% to
21.2%) and walking (from 7.4% to 6.4%) with overall share of trips by sustainable modes (active
travel and public transport) increasing from 60.9% to 71.1% in that period. In reflection of this trend,
the proportion of households with access to a car fell from 51.1% in 2001 to 47.9% in 2011; the
majority of households in the borough are now car-free.
The relatively small increase in the share of trips by bicycle masks the increase in the absolute
number of people cycling due to the significant increase in population in Newham over the same
period. Whilst census data suggests the proportion of trips by bicycle to work increased by 18%
between 2001 and 2011, the overall population increased by approximately 26% (some additional
64,000 residents), and thus the absolute number of Newham residents cycling to work increased
from 1,188 in 2001 to 2,153 in 2011, an increase of 81.1%. Thus, observers would be correct in
thinking that there appear to be far more people cycling in Newham now than ten years ago. More
recent data from the London Travel Demand Survey suggests the absolute numbers of cycling trips
10has increased from around 3,800 per day (2007-10) to 14,595 per day (2013-16). TfL’s Strategic
Cycling Analysis (June 2017) illustrates significant current cycle flows in Newham based on the
output of the Cycle Network for London (Cynemon) model. Significant east-west current cycle flows
can be seen from Ilford to Stratford and from the Royal Docks towards Canning Town, along with
significant north-south cycle flows between Leyton, Stratford and the Royal Docks.
However, whilst levels of cycling have increased in Newham, levels remain the lowest of any inner
London borough and below the inner London average (3.6%), and greater London Average (2.7%).
Given Newham’s location in relation to inner London, and proximity to boroughs with much higher
levels of cycling, it is fair to say that levels of cycling are below what should be expected and that are
very realistically achievable in the short term.
The population in Newham is expected to continue rising 6 and with an increasing population density
and finite road space the arguments in favour of facilitating and encouraging the use of the most
sustainable and efficient modes become more apparent.
Acknowledging that there has been a significant increase in cycling in Newham, the potential for a
step-change in cycling levels from the current low base is best understood in the context of
neighbouring boroughs Hackney and Tower Hamlets with cycling mode shares of 6.6% and 3.4%
2012-2015 respectively, and in the case of Hackney where more residents travel to work by bicycle
than by private car (Census, 2011).
This is further highlighted in TfL’s own Analysis of Cycling Potential (2017b), which showed that a
conservative estimate of 41% of trips in Newham could be made by cycling 7 and that of these, 39%
are under 2km and 81% are under 5km. This suggests that there is massive potential for modal shift
to cycling from both private and public motorised modes for local journeys (under 5km). This is
further reflected in the analysis showing that the vast majority of cyclable trips are to destinations
within Newham (69%) followed by neighbouring Tower Hamlets (9%), Redbridge (8%), Waltham
Forest (7%), Barking and Dagenham (3%), Hackney (2%), and Greenwich (1%).
TfL’s Strategic Cycling Analysis (June 2017) illustrates this potential spatially, highlighting the roads
and paths that would host the highest volumes of these potential cycle trips. Significant east-west
and north-south flows can be seen across the borough, connecting key destinations and linking to
neighbouring boroughs. This shows the incredible potential to switch trips from motorised modes to
cycling in the borough. The Strategic Cycling Analysis also highlights the significant potential for
motorised trips to be switched to walking in Newham, especially around Stratford and in the centre
of the borough.
Newham also has the second highest percentage of residents of any London borough who never
cycle (91% in 2012/13 – 2014/15); with this proportion being uniformly high among all age
categories (ranging from 89% of 5-16 yr olds to 96% of 60+ yr olds). Newham also has the second
highest proportion of women who never cycle (96%) of any London borough and corresponds to the
6
GLA 2015 Round Population Projections
7
This excluded mechanised trips made by young children, elderly and disabled people; trips longer than 8km
or which would take at least 20% more time if cycled; trips made at night; trips made with heavy or bulky
goods; and trips made by non-London residents.
11very high share of participants in Newham’s adult cycle training programme who are female (83%) or
complete beginners (50%) who have never cycled.
Figure 1 - Measures of cycling in Newham
Measure Source Frequency
Resident trips by cycle (% and no.) London Travel Demand Annual
Survey, TfL
Cycling through Inner London Cordon and Inner London Cordon and Annual/every 2
Thames Screenline (4 sites, % and no.) Thames Screenline counts, TfL years
Trips to school (% and no) School Hands-up Surveys, LBN Annual
Resident travel to work by cycle (aged 16- Census, ONS 10 years
74) (% and no.)
Route counts (TfL routes and sample, Automatic and manual counts, Continuous/Annual
NCN13) LBN, TfL, Sustrans
12Figure 2 - Resident Modal Split in Newham (Source: London Travel Demand Survey, TfL)
Newham Resident Modal Shift
100%
90%
27.5% 26.9% 26.3% 26.9%
31.4% 30.1%
32.5%
80%
1.2% 1.4% 1.6% 1.3%
70% 1.1%
1.2%
1.3%
17.7% 18.6% 18.2% 17.9%
60% 16.1% 17.1%
15.9% Car / Motorcycle
Taxi/Other
50% Bus
11.1% 10.6% 12.0% 12.7%
9.0% 9.9% 10.4% Underground/DLR
2.7% 2.6% Rail
40% 2.0% 2.2% 2.2% 2.8% 2.7%
Walk
Cycling
30%
20% 38.5% 38.2% 38.1% 38.5% 38.5% 36.8% 36.2%
10%
0% 0.7% 0.9% 1.0% 1.3% 1.3% 2.3% 2.1%
2007/8 to 2008/9 to 2009/10 2010/11 2011/12 2012/13 2013/14
2009/10 2010/11 to to to to to
20011/12 2012/13 2013/14 2014/15 2015/16
Achieving a significant increase in cycling in Newham will necessarily have to address current
barriers to cycling in the borough.
The low levels of cycling amongst all parts of the population suggests that significantly improved
conditions for cycling are required if genuine long-term increases in cycling are to be achieved.
Data from the census provides the only indication of cycling levels at the geographical scale smaller
than the borough (cycle to work).
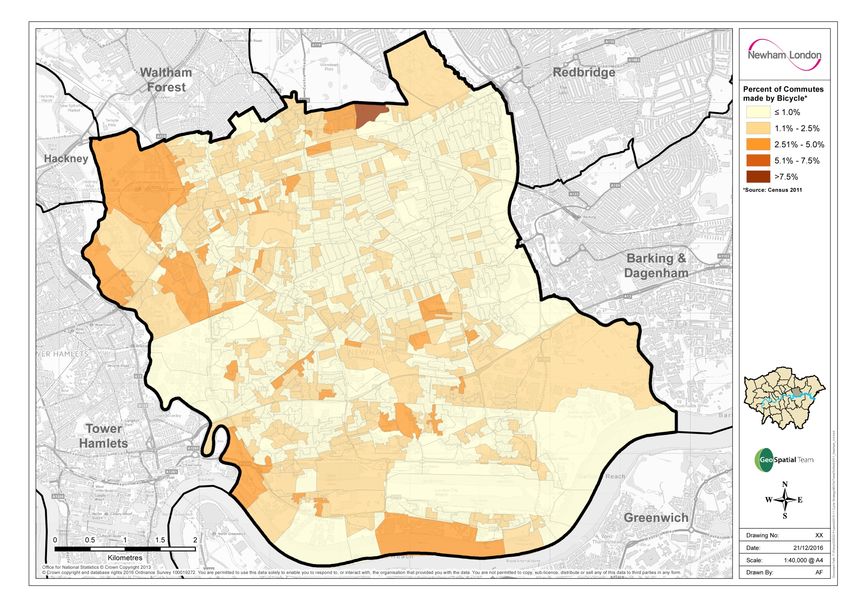
13Figure 3 shows the percentage of residents in work whose main method of commuting is bicycle
from the 2011 census. It is important to note that levels of Newham residents cycling to work (0.98%
of all working age population) are relatively low in all areas and wards of Newham ranging from
0.2% 8 to 3.77% 9 at the smallest scale and 0.46% 10 to and 1.77% 11 at ward level. These figures
compare to averages of 1.9% for England and Wales, 2.6% for London as a whole, 4.4% for inner
London, 1.4% for outer London, 9.2% for Hackney, 1.8% for Waltham Forest, 0.7% for Redbridge,
0.8% for Barking and Dagenham, 1.5% for Greenwich, and 4.1% for Tower Hamlets. Some areas
immediately to the west of Newham (in parts of Hackney Wick) have levels as high as 10%.
The data available for Newham suggests higher levels of cycling in the north and north-west
including Forest Gate and Stratford; followed by a mixed picture in the west, south, and central
including Canning Town, Royal Docks, and Plaistow; with the lowest levels in the east including
Green Street, Manor Park, and East Ham.
This broadly reflects higher levels of cycling in areas of closer geographical proximity to inner and
central London. As the census data is from 2011, it can be expected that the ‘cliff edge’ between the
high levels of cycling in eastern parts of Tower Hamlets and Hackney and low levels in Stratford has
begun to soften as the Queen Elizabeth Olympic Park has re-opened following the games, reducing
the severance of the River Lea and the A12, and as cycling will be a more geographically viable mode
for the new population living the park itself.
One possible correlation can be speculated between the very low levels of cycling in the east and
north-east of the borough and furthest proximity to any roads, paths, or connections with a high
Cycling Level of Service (CLoS) as shown in Figure 8 and discussed in the action plan for
infrastructure.
8
E01003531, lowest Super Output Area (SOA) , east and south of Plashet Park
9
E01003547, highest SOA, west of Manor Park Cemetery
10
East Ham North, lowest ward
11
Forest Gate North, highest ward
14Figure 3 - Commutes by cycle, Newham 2011
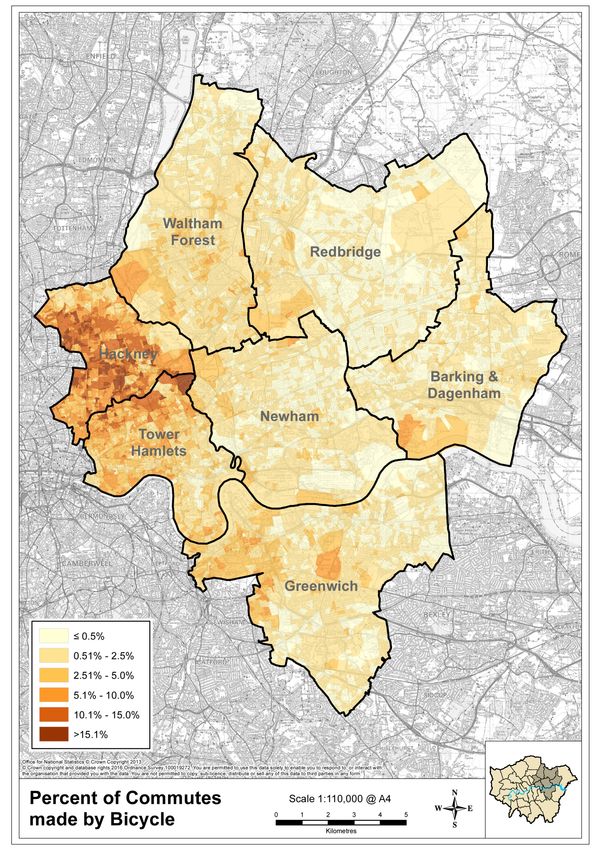
15Figure 4 - Commutes by cycle, Newham and neighbours, 2011
16Cycling safety in Newham
In 2015/16 LBN commissioned an insight study to analyse trends in road traffic casualty data for all
vulnerable road users (pedestrians, pedal cyclists, and motorcyclists). Selected extracts are included
below. The latest data on the number of cyclist casualties in Newham is also presented.
Figure 5 - 2010-2014 Casualties on Newham roads by user
User Fatal Serious Slight Total
Drivers 8 148 2,391 2,547
Passengers 3 47 868 918
Pedestrians 10 137 926 1,073
Pedal Cycle 1 46 447 494
Car Occupants 4 80 2,121 2,205
Motorcycle 6 50 414 470
Figure 6 - Number of cyclist casualties in Newham by severity
Year Fatal Serious KSI Slight Total
2004 0 7 7 55 62
2005 0 5 5 47 52
2006 1 8 9 61 70
2007 1 6 7 57 64
2008 0 10 10 61 71
2009 2 6 8 77 85
2010 0 12 12 78 90
2011 0 11 11 86 97
2012 1 9 10 80 90
2013 0 6 6 83 89
2014 0 8 8 120 128
2015 0 7 7 95 102
2016 0 10 10 69 79
As discussed earlier, the numbers of people cycling in Newham has increased over the last decade
and figure 6 shows there has sadly also been a rise in total cyclist injuries. The latest data from the
London Travel Demand Survey suggests that there has been a 287% increase in the absolute number
of daily cycling trips per day by Newham residents from 2007/8-2009/10 to 2013/14-2015/16 and a
28% increase in the average number of cyclists casualties for the same periods.
The insight study provides more detail on the risk factors of the cyclist casualties including
information about the collision and information about the person involved. Weekdays at busy
commuter times see the largest percentage of crashes with a larger peak in the late afternoon and
early evening, with only a quarter injured during the hours of darkness and almost all of these in
street lit areas. Unsurprisingly the cycling casualty numbers peak in the summer from June to
September, as the number of cyclists overall increases. The majority are injured on busy A roads (see
figure 7 below) with T-junctions being the most common junction type. Cyclists are more likely to be
injured when proceeding normally along the road; two fifths where the other vehicle involved being
17in the act of turning when collisions occur. In terms of ‘contributory factors’ 40% of cyclists were
deemed to have contributed in some way to collisions compared to 59% of drivers, with both parties
most commonly making observation errors.
The data suggests that schemes such as the upcoming return of Stratford Gyratory (comprising of
parts of the A11 and A118) to two-way operation with separated turning movements at junctions
should help to significantly reduce cyclist casualty rates at this location and make a valuable
contribution to cyclist casualty reduction across the borough as a whole. It also suggests that the
key main road corridors of the A118 (Stratford High Street, gyratory and Romford Road), A124
(Barking Road), A112 (West Ham Lane/Plaistow Road/Prince Regent Lane), and A117 (High Street
East Ham, Woolwich Manor Way, Pier Road) will need to be addressed in order to achieve significant
reductions in the absolute and relative level of casualties. These routes are also identified as top
potential connections in the TfL Strategic Cycling Analysis (2017) which presents the opportunity to
both address existing safety issues whilst create an inviting environment that should induce a
significant increase in cycling. It is also clear that a significant amount of casualties occur on minor
and residential roads, highlighting the need for treatment in residential neighbourhoods as well as
on strategic corridors.
Figure 7 - Number of pedal cycle user casualties 2010-2014 in Newham by route
Route Number Share
Unclassified/ C Roads 96 19%
A118 153 31%
A124 59 12%
A112 43 9%
A117 40 8%
18Addressing barriers to cycling
Regular surveys and analysis by Transport for London (2015) suggest that the main deterrents to
increased cycling continue to be related to the environment for cycling with the volume of traffic,
fear of collisions, and poor infrastructure commonly cited in addition to fear of cycle theft,
workplace facilities, lack of confidence and perceived distance/time.
In the context of the high potential for more cycling in Newham (a high proportion of current trips
being relatively short in time and distance by school and working age without bulky of heavy load),
the following section details five objectives to address the barriers to, and enable, more cycling in
Newham.
19Objective 1 - Create safer and more inviting conditions for cycling
Ref Action Target
Timescale
01-01 Maintain an up-to-date map of Cycling Levels of Service (CloS) with any Annual,
changes as part of an annual ‘Cycling Account’. ongoing
01-02 Designate a grid, ideally of parallel 400m, existing and indicative potential 2016/17
cross-borough routes where maximum CLoS scores could be attained.
01-03 Identify full funding and progress design and implementation of the next 2016/17-
phase (short term) of routes and upgrades, as shown in figure 13, including 2017/18
securing improvements through the planning system.
01-04 Identify full funding for feasibility assessments, design, and implementation 2018/19
of identified medium term routes and upgrades, as shown in figure 14, –
including securing improvements through the planning system. This includes 2020/21
proposals for strategic cycling routes that would serve the core cycling
connections identified in TfL’s Strategic Cycling Analysis (2017).
01-05 Identify full funding for feasibility assessments, design, and implementation 2021/22
of identified longer term routes and upgrades, as shown in figure 15, –
including securing improvements through the planning system. 2023/24
01-06 Seek to increase the CLoS of all streets, particularly in areas between Annual,
upgraded strategic routes above, wherever possible during any road schemes on-going
(including planned maintenance through ‘Keep Newham Moving’, including
consideration of 20mph speed limits and filtered permeability).
01-07 Seek funding for feasibility assessments for piloting a ‘Heathy 2016/17
Neighbourhoods’ approach using filtered permeability to reduce motor –
traffic volumes and speeds, and improve physical activity levels, air quality, 2020/21
and community cohesion in at least 6 areas bounded by classified roads.
Design principles
Addressing the design of the borough’s streets and other environments will address the most
commonly cited barriers to people starting and keeping cycling and their safety whilst doing so.
Physical conditions that are relatively more or less likely to generate high levels of cycling and cycling
safety can be quantified in a Cycling Level of Service (CLoS) score (out of 100) as described in the
London Cycling Design Standards, based upon international best practice.
The CloS score rates 33 characteristics of an environment contributing to the six design principles of
safety, directness, coherence, comfort, attractiveness, and adaptability. Of these, the score is heavily
20weighted towards safety (48/100). The weighting of safety, and in particular, the risk of collision with
motor vehicles and feeling of safety, reflects the two different ways that good conditions for cycling
can be created: (1) by segregating cycling from high volume and speed motor traffic where it exists;
or (2) reducing the volume and speed of motor traffic to levels with very low levels of risk.
Conditions for cycling with scores below 40 and/or with safety critical characteristics typically
represent uncomfortable, higher risk conditions, even for many of the small proportion of people
who already cycle regularly. Scores between approximately 40 and 70 typically represent
environments with measures to reduce risk and that the small proportion of people who cycle
regularly find tolerable; whilst scores from approximately 70 or above are more likely to be low risk
and inviting enough to entice more people to cycle, more often, and more safely, and to keep doing
so.
Places with the highest levels of cycling and cycling safety internationally typically have a dense
network of cycling routes with environments equivalent to CloS scores of approximately 70 and
above, with critical factors consistently addressed (TfL, 2014b).
Network
For high levels of cycling and cycling safety to be achieved, people must be able to access every place
where they might live, work, study, shop, or visit via good conditions for cycling. As such, a high
density of routes with good conditions for cycling is needed to facilitate high levels of cycling.
The Cycling Level of Service assessment suggests that a minimum grid density of high quality cycling
routes of 400m is needed to facilitate high levels of cycling. This broadly means that a good quality
parallel cycling route can be found at least every 400m.
The draft MTS (2017) highlights the importance of developing a pan-London strategic cycling
network. TfL’s Strategic Cycling Analysis (SCA) (2017) identifies and prioritises the indicative cycling
connections that would form this network at a London-wide scale. The SCA identifies a number of
indicative cycling connections in Newham, many of which align with the future network set out in
Figure 10.
Existing Facilities
Figure 8 shows a plan of Newham overlaid with a 400m grid. Each road or path currently signed or
mapped for cycling is shown with its CLoS score, colour coded with scores of under 40 in red, 40-69
in orange, and 70 and above in green. In addition, roads where recent traffic surveys have been
completed as part of other schemes have also been scored.
The majority of classified road (A and B roads) score in the range 30-40%, reflecting the high volumes
and relatively high speeds of motor traffic as would be expected given their strategic importance,
but also reflecting the relative lack of segregated space for cycling on these direct corridors.
Segregation on the A118 Stratford High Street (as part of CS2), the A13 (as part of CS3) and to a
lesser extent on the A1020 North Woolwich Road are notable exceptions, scoring in the range 64-
75%, with the lack of separation at junctions generally a barrier to higher levels of service.
21The majority of unclassified, local residential roads score in the range 40-60%. Many local roads that
form effective rat-runs for motorised traffic have moderate volumes (200-500 motor vehicles/hour
at peak) and higher-than-welcome speeds (25-30mph+). The lower scoring streets tend to have
collision risk from on-street car parking on both sides and meet busier major roads with higher levels
of risk.
However, where not forming particularly useful through-routes for motor traffic, many local
residential roads have much lower volumes of motorised traffic (below 200 vehicles/hour at peak)
and speeds (around or below 20mph), and still benefit from regular lighting and being overlooked by
residents. The higher scoring of these minor roads have raised entry treatments at junctions to
reduce the likelihood of turning conflicts, more limited car parking with more effective width, good
surfacing, and in some cases have dedicated connections to other cycling routes and public
transport.
Paths completely separated from the highway score in the range 68 (or 52 weighted for limited
opening hours) to 89. These benefit from the obvious full elimination of risk of collision with motor
vehicles, and in most cases have proximity to green spaces and distance from the stress of noise
pollution. However, many suffer from a lack of lighting and natural surveillance and variable or poor
surfaces.
It can be seen from Figure 8 that there is generally a higher concentration of ‘green’ (70+) routes in
the northwest and south, and a lack of routes with higher levels of service in the east. This is broadly
correlated with cycle to work ward-level data from the census.
Whilst there is a general scarcity of routes and areas with higher CLoS in the borough, there are
individual examples of routes with good scores in a variety of contexts: busier and quieter roads, and
routes through green spaces, housing areas, and along waterways. However, many of these routes
do not connect to form a coherent network and/or meet less inviting roads or areas of much higher
risk.
In addition, as noted earlier, there are at least ten east-west, and five north-south major
geographical severances in the borough, all with limited points of access across. To create a network
with the level of directness and grid coherence needed to achieve higher levels of cycling across the
borough, the existing limited number of connections across the physical boundaries need to be
upgraded or new connections created with good levels of service for cycling.
22Page left intentionally blank
23Figure 8 - Newham Cycling Levels of Service, 2016
24Page left intentionally blank
25Future Network
There are broadly four methods of creating space for cycling on routes and there are examples in
Newham where these conditions have already been created, as shown on figure 9, however in the
majority of cases it will require active intervention to create the required conditions.
Figure 9 - Methods and examples of creating space for cycling in Newham
Method Description Newham Example (photo + description)
Filtered Permeability The use of traffic
management (such as
road closures and one-
way streets) to
significantly reduce
motor traffic volumes
in certain areas and
routes by preventing
motor traffic ‘cutting
through’ residential
areas.
Henniker Road/Leyton Road, E15
Quietway 6, Anna Neagle Close, E7
Segregation from high The allocation of space
volume/speed motor within the public
traffic on links highway dedicated for
cycling. This can range
from mandatory cycle
lanes to full kerb
segregation. Space can
be re-allocated from
central medians,
general traffic lanes,
car parking, or as a last
resort from footways.
This should include Cycle Superhighway 2, Stratford High Street,
separation from E15
interaction with buses
wherever possible.
26Segregation (in The use of signal
time/space) from high phases, or banning
volume/speed motor certain movements, to
traffic at major separate turning
junctions conflicts at junctions .
Cycle Superhighway 2, Mile End Road/Grove
Road, London Borough of Tower Hamlets
Upgrading off-road The use of good
paths surfacing, lighting,
access, and opening
hours to upgrade off-
road paths to the same
comfort and social
safety of on-road links.
Greenway, Barking Road to Prince Regent Lane
An indicative Strategic Cycling Network of 33 existing and potential routes across Newham has been
identified that preliminary investigations suggest have, or could be upgraded to have, high levels of
service (70+) for cycling, totalling approximately 150km, using the techniques above. There are 11
north-south and 22 east-west identified alignments, reflecting the dominant east-west transport
alignments radiating from central London. These would be formed from streets with very low
volumes and speeds of motor traffic, major roads if space for appropriate segregation can be re-
allocated, and high quality paths through green spaces and along waterways, but all must link to an
appropriate connection across existing physical boundaries for a dense pan-borough network to be
created.
The Strategic Cycling Analysis (TfL, 2017) identifies a core London-wide cycle network which could
contribute to the growth of cycling in London and help achieve the ambitious targets set out in the
draft Mayor’s Transport Strategy.
The SCA identifies 25 Top potential cycling connections in inner and outer London. Of those 25, four
are in Newham:
• Stratford to Ilford
• Leyton to Barking Road
27• Canning Town to Barking
• Manor Park to Woolwich Crossing
In addition, the SCA identifies 2 High potential connections (Plaistow to Royal Docks; Stratford to
Leytonstone) and 3 Medium potential connections (Canning Town to Woolwich Ferry; Stratford to
Canning Town; Forest Gate to Upton Park). Many of these connections align with the proposed
Strategic Cycling Network for Newham, as set out in Figure 10. Delivery of these routes would
therefore serve cycling within Newham as well as trips made between Newham and neighbouring
boroughs. The SCA also highlights the great potential for these routes to improve conditions for
walking and safety, and enhance access to public transport.
A map showing the proposed Strategic Cycling Network corridors and local connections can be seen
here and at Figure 10.
Figures 11 and 12 show the indicative future Strategic Cycling Network corridors, their length, and
current Cycling Levels of Service by distance.
Healthy Streets and Neighbourhoods
Analysis suggests that the identified Strategic Cycling Network of pan-borough corridor routes alone
would not create the density of routes needed to enable the majority of residents to easily access
them. As such, a sub-network of local connections that also have the potential for high levels of
service (CLoS: 70+) and that tackle local severances, such as bridges/tunnels across geographical
features or crossings of busy roads where dedicated cycling provision cannot feasibly be provided, is
needed to link to these routes.
All neighbourhoods could then be linked to the wider strategic network by applying a ‘filtered
permeability’ traffic management approach. This would involve defined neighbourhoods, bounded
by busier classified roads, where traffic management and landscaping is used to create ‘Healthy
Streets and Neighbourhoods’ (GLA, 2016a) by reducing motor traffic volumes, speeds and noise; and
improving levels of physical activity, air quality, and community cohesion. Evidence shows that
residents on streets with lower levels of motor traffic count more neighbours as friends and
acquaintances with more social interactions, perceive a larger ‘home territory’ to care for, and
afford a greater degree of independence to children (Appleyard, 1969, 1980, 1981; Hart and
Parkhurst, 2011). This approach therefore has great potential to not only increase levels of physical
activity through cycling and walking but may also help to address other objectives such as reducing
crime (including environmental crime), educational outcomes, and population transience. This is
particularly pertinent to improving school travel patterns, as almost all of the 108 schools in the
borough are located on residential streets with relatively small catchment areas.
This approach is championed in A City for all Londoners (GLA, 2016) and Newham is well placed to
secure improvements through the Healthy Streets Approach. Chapter 4 of the Strategic Cycling
Analysis (TfL, 2017) highlights the great potential for such an approach in Newham, based on an
analysis of street connectivity. As well as well-connected streets in areas with high cycling potential,
the SCA also highlights that new developments offer the opportunity to influence the street network
in positive ways for walking and cycling, including creating more permeable streets.
28A sensible first step would be to apply this method in the areas in the north of Newham bordering
the London Borough of Waltham Forest. As this is the only border of Newham permeable at
residential street level it will require coordination with the neighbouring authority to maximise
benefits for residents of both boroughs and has the potential to build upon and expand the
successful work of Waltham Forest’s ‘villages’ schemes as part of the ‘Walk, Cycle, Enjoy Waltham
Forest’ programme.
Planned Road Maintenance and Improvements
In 2016 the London Borough of Newham announced the introduction of ‘Keep Newham Moving’, a
programme to invest £100 million over ten years to improve the borough’s roads, footpaths, and
streetlights to help people travel across Newham as safely and smoothly as possible. In addition to a
massive programme of road re-surfacing, improving the levels of service for cycling and reducing the
likelihood of localised failures (e.g. potholes), the programme also includes elements that have
significant indirect benefits for cycling in Newham, including reducing demand for road space
through the introduction of car club bays and residential parking zones across the borough. The
programme also provides the opportunity to introduce improvements to the cycling network when
resurfacing takes place; in the first year of the programme several residential roads have been
identified for introducing contraflow cycling when the carriageway has been resurfaced, improving
neighbourhood permeability and local links. LBN will continue to co-ordinate improvements to
conditions for cycling wherever possible.
29Figure 10 - Proposed Strategic Cycling Corridors in Newham
30Page left intentionally blank
31Figure 11 - LBN Identified Strategic Cycling Network Corridors (Table)
Open
CLoS
Range Not 70- km
Ref Name % Realised 0-39 40-69 100 (total)
NS001 Leaway 32-89 0.5 1.6 3.8 1.7 7.7
NS002 Temple Mill - Three Mills 37-81 0.3 0.67 1.97 0.58 3.5
NS003 Channelsea - Twelvetrees 42-70 0.94 0.98 0.67 2.6
NS004 N-S DLR Parallel 42-87 0.22 3.17 0.66 4.1
NS005 Greenway - Thames Barrier 35-51 1.02 0.91 1.36 0 3.3
NS006 A112 Corridor 26-69 5.15 1.79 0.37 7.3
NS007 N-S County Boundary 37-74 0.48 0.02 6.11 0.99 7.6
NS008 B109 Corridor 33-72 0.47 1.82 2.94 0.64 5.9
NS009 A117 Corridor 36-68 1.86 3.58 5.4
NS010 Manor Park - Gallions Reach 31-72 0.07 2.29 1.94 1.95 6.3
NS011 Roding Valley Way 30-80 1.4 0.76 1.34 1.55 5.1
EW001 Quietway 6 26-82 0.05 1.59 3.02 0.9 5.6
EW002 Ilford Link N/R 0.38 0.6 1.0
EW003 Stratford - Epping 38-73 0 0.38 1.38 0.18 1.9
EW004 Woodgrange Village 30-59 0.03 2.11 2.1
EW005 Stratford Town Centre 32-79 0.41 0.39 0.16 1.0
EW006 Cycle Superhighway 2- Ilford 31-74 4.73 0.52 1.15 6.4
EW007 Stadium - Roding 31-81 0.62 0.23 5.87 0.03 6.8
EW008 West Ham Park - Plashet Park 48-50 0.25 0.05 2.72 3.0
EW009 Stratford - East Ham 29-77 0.03 0.44 3.49 0.12 4.1
EW010 Plaistow - East Ham 42-54 0.57 0.1 3.72 4.4
EW011 Newham Greenway 47-57 1.92 6.46 0.1 8.5
EW012 A124 Barking Road Corridor 25-33 4.75 0.17 0.14 5.1
EW013 CS3 Northern Parallel 67 0.14 3.91 4.1
EW014 Cycle Superhighway 3 74-75 5.89 5.9
EW015 Mitchell Way 39-53 2.32 0.05 1.48 3.9
EW016 Residential Street 35-48 1.32 0.08 1.35 2.8
EW017 Beckton Corridor 32-72 0.29 3.42 1.67 5.4
EW018 Strait Road 65-79 0.46 2.74 0.21 3.4
EW019 NCR13 32-78 0.87 0.33 0.71 3.98 5.9
EW020 Docklands South 42-64 1.01 0.38 1.01 1.45 3.9
EW021 North Woolwich Road 50-64 3.03 3.0
EW022 Thames Path 42 5.85 3.84 0.61 10.3
33 21.1 29.1 80.9 25.7 157.2
13.4% 18.5% 51.5% 16.4%
32Figure 12 - LBN Identified Strategic Cycling Network Corridors (Graph)
LBN Cycling Network, CLoS by Route, 2016
km
0.0 2.0 4.0 6.0 8.0 10.0 12.0
Leaway 0.5 1.6 3.8 1.7
Temple Mill - Three Mills 0.3
0.67 1.97 0.58
Channelsea - Twelvetrees 0.94 0.980.67
N-S DLR Parallel 0.22 3.17 0.66
Greenway - Thames Barrier 1.02 0.91 1.36 0
A112 Corridor 5.15 1.79 0.37
N-S County Boundary 0.48
0.02 6.11 0.99
B109 Corridor 0.47 1.82 2.94 0.64
A117 Corridor 1.86 3.58
Manor Park - Gallions Reach 0.07 2.29 1.94 1.95
Roding Valley Way 1.4 0.76 1.34 1.55
Quietway 6 0.051.59 3.02 0.9
Ilford Link 0.38
0.6
Stratford - Epping 0.38
0 1.380.18
Not Realised
Woodgrange Village 0.03 2.11
0-39
Stratford Town Centre 0.41
0.39
0.16
40-69
Cycle Superhighway 2- Ilford 4.73 0.521.15
70-100
Stadium - Roding 0.62
0.23 5.87 0.03
West Ham Park - Plashet Park 0.25
0.05 2.72
Stratford - East Ham 0.03
0.44 3.49 0.12
Plaistow - East Ham 0.57
0.1 3.72
Newham Greenway 1.92 6.46 0.1
A124 Barking Road Corridor 4.75 0.17
0.14
CS3 Northern Parallel 0.14 3.91
Cycle Superhighway 3 5.89
Mitchell Way 2.32 0.051.48
Residential Street 1.320.081.35
Beckton Corridor 0.29 3.42 1.67
Strait Road 0.46 2.74 0.21
NCR13 0.870.670.71 3.98
Docklands South 1.010.381.01 1.45
North Woolwich Road 0.55 3.03
Thames Path 5.85 3.84 0.61
33You can also read