A USERS MANUAL - Climate Change and Canada's National Parks - January 2003 - Parks Canada History
←
→
Page content transcription
If your browser does not render page correctly, please read the page content below

Climate Change and Canada’s National Parks

                       A USERS MANUAL

 Brenda Jones2, Daniel Scott1, Elaine Barrow1 and Nancy Wun2

  1 – Adaptation and Impacts Research Group, Environment Canada
      2 – Faculty of Environmental Studies, University of Waterloo

                        January 2003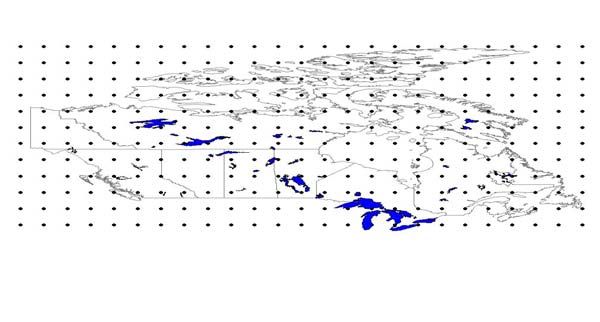
Climate Change Scenarios for Canada’s National Parks

Scénarios de changement climatique pour les parcs nationaux
du Canada
This users manual was prepared for Parks Canada by the Adaptation & Impacts Research Group
(AIRG), Environment Canada and the Faculty of Environmental Studies (FES), University of
Waterloo. This manual is the second in a series of collaborative technical reports on climate change
and Canada’s national park system.

This manual refers to climate change scenario data for existing and proposed* national parks
contained on the CD-ROM entitled Scenarios & Impacts: Climate Change and Canada’s National
Park System.

Brenda Jones2 , Daniel Scott1, Elaine Barrow1 and Nancy Wun2

     1    Adaptation and Impacts Research Group, Environment Canada
          c/o Faculty of Environmental Studies, University of Waterloo
          Waterloo, Ontario N2L 3G1
          519-888-4567 ext. 5497            dj2scott@fes.uwaterloo.ca

     2    Department of Geography
          Faculty of Environmental Studies, University of Waterloo
          Waterloo, Ontario N2L 3G1

* The proposed national parks in the study were those in public discussion at the time the analysis was done,
but at the time of final editing only Bathurst Island, East Arm of Great Slave Lake, Gulf Islands, Manitoba
Lowlands, Mealy Mountains, Torngat Mountains and Ukkusiksalik remain under consideration. Wolf Lake
results are included for information only and do not reflect the pursuit of this area by Parks Canada for a
potential national park.

Photos © Parks Canada and Government of Canada

Climate Change Scenarios for Canada’s National Parks: A Users Manual                                            i
Scénarios de changement climatique pour les parcs nationaux du Canada: guide de l’utilisateur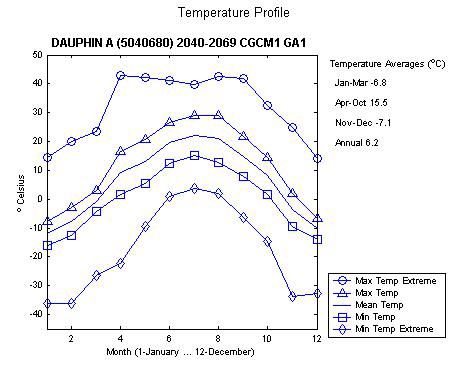
Climate Change Scenarios for Canada’s National Parks: A Users Manual                            ii
Scénarios de changement climatique pour les parcs nationaux du Canada: guide de l’utilisateur
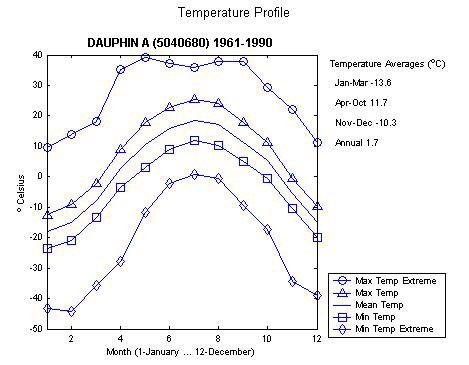
Table of Contents

List of tables and figures ...................................................................................................................... iv
List of acronyms .................................................................................................................................. v
Executive summary .............................................................................................................................. vi
Sommaire .............................................................................................................................................. ix

1.0 Introduction to the Manual ........................................................................................... 1
         1.1 Climate Change and National Parks .................................................................................. 1
         1.2 Climate Change Scenarios................................................................................................... 3
         1.3 Objectives and Outline ....................................................................................................... 4

2.0 GCM Scenarios ................................................................................................................ 5
         2.1    What are GCMs? ................................................................................................................ 5
         2.2    What are GCM scenarios? .................................................................................................. 5
         2.3    What GCM Scenarios are Available? ................................................................................. 8
         2.4    How Do I Choose Which GCM-Based Sscenario To Use? ................................................ 10
         2.5    How Do I Access and Interpret GCM-Based Scenario Data? ............................................ 11

3.0 Bioclimate Scenarios ....................................................................................................... 15
         3.1    What are Bioclimate Profiles? ............................................................................................ 15
         3.2    How are Bioclimate Profiles Established? ......................................................................... 15
         3.3    How are Bioclimate Scenarios Generated? ........................................................................ 15
         3.4    How Can I Access and Interpret Bioclimate Scenario Data? ............................................. 17

4.0 Daily Scenarios ................................................................................................................ 21
         4.1    What are Stochastic Weather Generators? ......................................................................... 21
         4.2    How is Synthetic Weather Generated? ............................................................................... 21
         4.3    How Do I Interpret Daily Scenario Data? .......................................................................... 21
         4.4    What About Daily Scenarios For Other National Parks ..................................................... 26

References .............................................................................................................................. 27

Appendix ................................................................................................................................ 28

Climate Change Scenarios for Canada’s National Parks: A Users Manual                                                                                   iii
Scénarios de changement climatique pour les parcs nationaux du Canada: guide de l’utilisateur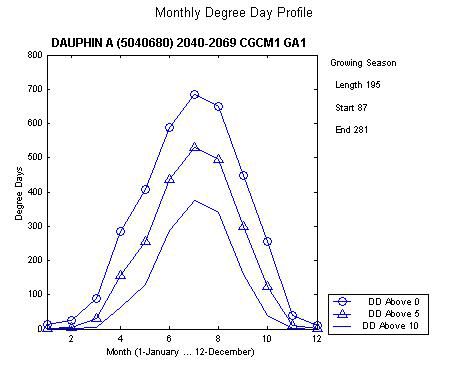
List of Tables and Figures
Table 1. Comparison of IS92 emission scenario assumptions ........................................................... 7
Table 2. GCM comparisons ................................................................................................................ 9
Table 3. Comparison of GCM scenario availability ........................................................................... 9
Table 4. Reference climate stations for each Canadian national park ................................................ 16

Figure 1. Regional cross cutting climate change impacts in Canada’s national parks ...................... 2
Figure 2. GCM grid points (CGCM1) ............................................................................................... 5
Figure 3. Comparison of SRES emission scenario family assumptions ............................................ 8
Figure 4. Climate change scenario comparison (annual 2050s) - Riding Mountain National Park .. 10
Figure 5. Climate change scenario comparison (annual 2050s) - Banff National Park .................... 11
Figure 6. GCM scenario data: file structure ...................................................................................... 11
Figure 7. Partial ridingmtn_temp worksheet ..................................................................................... 12
Figure 8. Partial ridingmtn_precip worksheet ................................................................................... 13
Figure 9. Climate change scenario comparison (annual 2050s)- Riding Mountain National Park .... 14
Figure 10. Grid box application ........................................................................................................... 15
Figure 11. 1961-90 observed averages (temp) .................................................................................... 18
Figure 12. 2050s projections (temp) .................................................................................................... 18
Figure 13. 1961-90 observed averages (precip) .................................................................................. 19
Figure 14. 2050s projections (precip) .................................................................................................. 19
Figure 15. 1961-90 observed averages (degree units) ......................................................................... 20
Figure 16. 2050s projections (degree units) ........................................................................................ 20
Figure 17. Partial ridingmtn_LARS_example worksheet (CCSR-ga1) ................................................ 23
Figure 18. Growing degree days (ridingmtn_LARS_example) ........................................................... 24
Figure 19. Frost degree days (ridingmtn_LARS_example) .................................................................. 25

Climate Change Scenarios for Canada’s National Parks: A Users Manual                                                                       iv
Scénarios de changement climatique pour les parcs nationaux du Canada: guide de l’utilisateur
List of Acronyms

 CCIS               Canadian Climate Impacts and Scenarios
 CCSR               Centre for Climate System Research
 CGCM               Coupled General Circulation Model
 CSIRO              Commonwealth Scientific & Industrial Research Organization Model
 GCM                Global Climate Model
 GHG                Greenhouse Gases
 GFDL               Geophysical Fluid Dynamics Laboratory
 ECHAM              European Centre Hamburg Model
 HadCM              Hadley Centre Coupled Ocean-Atmosphere Climate Model
 IPCC               Intergovernmental Panel on Climate Change
 LARS               Long Ashton Research Station
 TAR                Third Assessment Report
 VIA                Vulnerability, Impact and Assessment

Climate Change Scenarios for Canada’s National Parks: A Users Manual                            v
Scénarios de changement climatique pour les parcs nationaux du Canada: guide de l’utilisateur
Executive Summary
Nearly a century after the link between increasing concentrations
of greenhouse gases from industrial emissions and a changing
global climate system was first theorized, the United Nations
Intergovernmental Panel on Climate Change (IPCC) declared
that ‘the balance of scientific evidence indicates a discernable
human influence on the global climate’ (1995). The magnitude
of climate change is expected to be similar to that of the
transition from the last glacial to interglacial period (about 5°C),
yet occur during a single century, rather than over a few
thousand years. A screening level impact assessment (Scott and
Suffling, 2002) concluded that the implications of climate
change for Canada’s national parks are considerable.

An important component of any response by park officials to climate change will be the use of climate
change scenarios to examine the potential climate change impacts and the implications of adaptation
strategies. Most climate change scenarios used by the vulnerability, impact and adaptation (VIA)
researchers are computer-generated descriptions of plausible scientific future climates, which describe
possibilities rather than provide predictions. There are many climate change scenarios. This report
describes the development of three types of climate change scenarios (scenarios from global climate
models (GCMs), bioclimate scenarios and daily scenarios) for use by Parks Canada.

Understanding the differences between the three types of scenarios and interpretability of their output
data is often difficult for first-time users. Climate Change Scenarios for Canada’s National Parks
is a plain-language manual designed to guide people through the selection and interpretation of the
three types of climate change scenarios listed above. Prepared for Parks Canada, by the Adaptation &
Impacts Research Group (Environment Canada) and the Faculty of Environmental Studies (University
of Waterloo), this manual is the second in a series of collaborative technical reports on climate change
and Canada’s national park system. The manual addresses the theoretical and practical foundations of
each climate change scenario, outlines how to retrieve output data from each scenario from the CD-
ROM, and includes hands-on exercises to assist in their interpretation.

Chapter one provides an introduction to the manual. Some of the ecological and tourism-related
challenges posed by climate change for management of Canada’s system of national parks in the 21st
Century are explored in its first section. The three types of climate change scenarios (GCM, bioclimate
and daily scenarios) are introduced in the second half of Chapter one. Each type of climate change
scenario is defined here, and the spatial and temporal characteristics that distinguish each type are
described. For example, GCM scenarios operate at the global scale because climate change impacts
are examined at regional and local levels. GCM scenarios are often downscaled (spatially and
temporally) for use in impact assessments. Two approaches used to downscale GCM-based climate
change scenarios to local climate stations are described in this manual (bioclimate and daily scenarios
with the LARS weather generator). An indication of the intrinsic relationship between the three types
of climate change scenarios is also included in this chapter.

The development, characteristics and use of GCM-based climate change scenarios are the focal points
of Chapter two. GCM scenarios are the most commonly employed type of climate change scenario and
provide the basis for all three climate change scenario types. They are widely accepted as the primary
means for making plausible projections about the magnitude of future climate change. The first part of
Chapter two distinguishes between GCMs and GCM scenarios. The two are in fact different, although
the terms are often used interchangeably. General circulation models, or global climate models, are
three-dimensional models of the earth’s climatic system in which the physical processes governing
climate are represented in mathematical terms. GCM-based climate change scenarios simulate how
climate may change in the future in response to changing levels of greenhouse gases in the
atmosphere, based largely on assumptions about such factors as global population and economic

Climate Change Scenarios for Canada’s National Parks: A Users Manual                                 vi
Scénarios de changement climatique pour les parcs nationaux du Canada: guide de l’utilisateur
growth and energy use. These factors are integrated into different emissions scenarios, which are used
to drive, or ‘force’ a GCM to determine the climate response. IS92 and SRES are the two families of
emissions scenarios currently employed by the IPCC for climate change impact assessments. The
assumptions for both families are summarized in this chapter.

A great deal of uncertainty surrounds the selection of specific scenarios for use in a climate change
impact assessments. In the second part of Chapter two, this uncertainty is addressed. Government
agencies and research organizations around the world that are actively involved in the development of
GCMs; there were eight GCMs available through the IPP as the time this manual was prepared:
Coupled General Circulation Model (CGCM - Canada); Hadley Centre Coupled Ocean-Atmopshere
Model (HadCM – United Kingdom); European Centre/Hamburg Model (ECHAM – Germany); Centre
for Climate System Research (CCSR-98 – Japan); Commonwealth Scientific and Industrial Research
Organizational Model (CSIRO – Australia); and Geophysical Fluid Dynamics Laboratory Model
(GFDL – United States). However, each of these general circulation models has different spatial
characteristics and includes numerous IS92 and SRES emissions scenarios, which amounts to more
than 100 climate change scenarios for researchers to choose from for use in an impact assessment. As
a general rule of thumb, the IPCC recommends that multiple climate change scenarios, spanning a
range of possible future conditions, be used in impact assessments. Scatter plots are commonly used to
determine which scenarios to select. Scatter plots represent annual mean temperature change and
annual precipitation change, and are graphical tools used to illustrate the range of future climate
scenarios. A series of scatter plots are presented in this chapter to help clarify the range of future
climate scenarios projected by different climate change scenarios.

The final section of Chapter two takes the reader through a hands-on exercise. The step-by-step
instructions provide guidance in the selection of climate change scenarios for a hypothetical climate
change impact assessment of Riding Mountain National Park. The exercise uses data contained in a
series of Microsoft Excel worksheets provided on the accompanying CD-ROM. GCM scenario data
for each of Canada’s existing and proposed national parks is also provided on the CD-ROM.

Chapter three describes the second type of climate change scenario provided by this manual –
bioclimate scenarios. Similar to the previous chapter, the first part of this chapter describes the
characteristics of bioclimate scenarios, focusing on the use of GCM output data to transform
bioclimate profile data. Profiles are comprised of individual climate variables and related indices that
are derived from a 30-year average of site-specific daily climate observations from across Canada. To
provide future projections of different aspects of the bioclimate, GCM-derived climate change
scenario output is applied to it. Since this type of climate change scenario has an advantage over the
GCMs in that it provides a finer spatial resolution for impact assessments, a reference list of climate
stations near each existing and proposed national park is provided in the report. The proximity of each
national park to one of the Canadian reference climate stations varies considerably. Also described in
this section are the four categories of bioclimate data that are available for use by Parks Canada in
impact assessments – temperature, precipitation, degree-days and water availability.

The latter part of Chapter three describes the method for using bioclimate data. The step-by-step
instructions provide guidance in accessing bioclimate data from the Canadian Climate Impacts and
Scenarios (CCIS) Project website. Using the Dauphin, Manitoba climate station as an illustrative
example, the exercise depicts projected changes in temperature, precipitation and degree days for
Riding Mountain National Park in the 2050s (2040-69) with respect to the 1961-90 normal.

The last chapter in the manual examines daily scenarios. Daily scenarios are a temporally downscaled
version of the GCM-derived scenario output data. Daily scenario data is derived by applying climate
change scenarios at the monthly time scale to a statistical representation of observed climate data in
stochastic weather generator. Stochastic weather generators are statistical tools that simulate daily
weather data for a suite of climate variables at a given site. They are a means to generate ‘synthetic’
(simulated) weather that is statistically similar to observed climate data from climate stations and can
also be used to derive daily scenario data from climate change scenarios at the monthly time scale.

Climate Change Scenarios for Canada’s National Parks: A Users Manual                                 vii
Scénarios de changement climatique pour les parcs nationaux du Canada: guide de l’utilisateur
They are inexpensive computational tools that can provide site-specific multi-year climate change
scenarios at a daily temporal level. The technical process of generating synthetic weather with the
Long Ashton Research Station (LARS) weather generator, a specially designed software program
from the University of Bristol (UK) is described in section one. A hands-on exercise completes this
chapter. This type of scenario data is useful in situations that rely on climatic thresholds at a very
small temporal scale, such as forest fire season, berry producing season, recreational season length and
drought conditions. A sample data set of temperature, precipitation and frost and growing degree days
are provided again for Riding Mountain national Park, although data for Prince Edward Island and
Simirlik National Parks are also provided for comparison. Daily scenario data for other national parks
can be generated by running the GCM scenario output data through the LARS weather generator
program; this program is available for downloading from the CCIS Project website.

An appendix of additional resources is provided at the end of the manual. A number of journal
publication, government report and Internet website citations about the three types of climate change
scenarios are provided in the report. However, it is important to note that these resources are generally
more technical in nature than the manual.

Climate Change Scenarios for Canada’s National Parks: A Users Manual                                 viii
Scénarios de changement climatique pour les parcs nationaux du Canada: guide de l’utilisateur
Sommaire
Pratiquement un siècle après l’établissement d’un lien entre l’augmentation des concentrations de gaz
à effet de serre provenant des émissions industrielles et le changement du système climatique de la
planète, le Groupe intergouvernemental d’experts sur l’évolution du climat (GIEC) des Nations Unies
a déclaré que « la prépondérance de la preuve indique qu’il existe une influence humaine évidente sur
le climat du globe » (1995). On s’attend à ce que le changement climatique atteigne une ampleur
similaire à celle de la transition de la dernière époque glaciaire à l’époque interglaciaire, le tout
concentré sur un siècle plutôt que sur quelques milliers d’années. Une évaluation préliminaire a permis
de conclure que les conséquences du changement climatique pour les parcs nationaux du Canada sont
énormes.

Un élément important de la réaction des responsables des parcs face au changement climatique sera
l’utilisation des scénarios de changement climatique pour examiner les répercussions potentielles et les
conséquences des stratégies d’adaptation. La plupart des scénarios de changement climatique utilisés
par les chercheurs spécialisés en vulnérabilité, impacts et adaptation (VIA) sont des descriptions
créées par ordinateur de climats futurs reposant sur des données scientifiques plausibles, qui sont des
possibilités plutôt que des prévisions. Il existe de nombreux scénarios de changement climatique. Le
présent rapport décrit l’élaboration de trois types de scénario (modèles de circulation générale (MCG),
scénarios bioclimatiques et scénarios quotidiens) qu’utilisera Parcs Canada.

Il est parfois difficile pour les personnes qui utilisent les scénarios pour la première fois de
comprendre la différence entre les trois types et d’interpréter les données qui en découlent. Scénarios
de changement climatique pour les parcs nationaux du Canada : guide de l’utilisateur est un
document de vulgarisation visant à guider les personnes dans le choix et l’interprétation des trois types
de scénario de changement climatique énumérés ci-dessus. Le guide traite des fondements théoriques
et pratiques de chaque scénario, explique comment tirer des données de chaque scénario figurant sur le
CD-ROM et comprend des exercices pratiques pour en faciliter l’interprétation.

Le chapitre 1 renferme une introduction. La première partie examine certains des défis liés à l’écologie
et au tourisme que pose le changement climatique pour la gestion du réseau des parcs nationaux du
Canada au XXIe siècle. La deuxième partie du chapitre 1 présente les trois types de scénario de
changement climatique (MCG, scénarios bioclimatiques et scénarios quotidiens). On y trouve une
définition de chaque type ainsi que les caractéristiques spatiales et temporelles de chacun. Par
exemple, les scénarios de MCG sont utilisés à l’échelle mondiale parce que les répercussions du
changement climatique sont examinées aux niveaux régional et local. L’échelle de ces scénarios est
souvent réduite (spatialement et temporellement) aux fins de l’évaluation des répercussions. Le guide
décrit deux approches utilisées pour réduire l’échelle des scénarios de changement climatique fondés
sur les MCG à des stations climatiques locales (scénarios bioclimatiques et quotidiens avec le
générateur de données météorologiques de la Long Ashton Research Station (LARS)). Le premier
chapitre du guide explique également le lien intrinsèque entre les trois types de scénario de
changement climatique.

L’élaboration, les caractéristiques et l’utilisation des scénarios de changement climatique fondés sur
les MCG sont décrites au chapitre 2. Les scénarios de MCG sont les plus couramment utilisés et
servent de fondement aux trois types de scénario. Ils sont largement reconnus comme étant le principal
moyen de faire des projections plausibles quant à l’importance du changement climatique à venir. La
première partie du chapitre 2 fait la distinction entre les MCG et les scénarios de MCG. Ces deux
notions sont bel et bien différentes même si on les utilise souvent l’une pour l’autre. Les modèles de
circulation générale sont des modèles tridimensionnels du système climatique de la planète où les
processus physiques qui régissent le climat sont représentés en termes mathématiques. Les modèles de
climat du globe sont des scénarios de changement climatique fondés sur les MCG qui simulent les
changements climatiques possibles en fonction de l’évolution du niveau des gaz à effet de serre dans
l’atmosphère, en partant surtout d’hypothèses concernant des facteurs comme l’augmentation de la
population mondiale, le développement économique et la consommation d’énergie. Ces facteurs sont

Climate Change Scenarios for Canada’s National Parks: A Users Manual                                  ix
Scénarios de changement climatique pour les parcs nationaux du Canada: guide de l’utilisateur
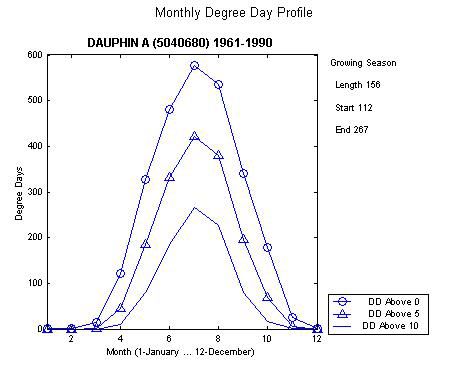
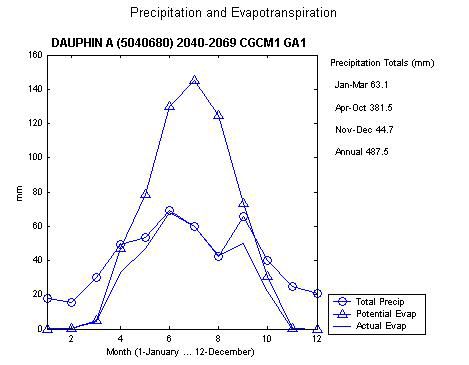
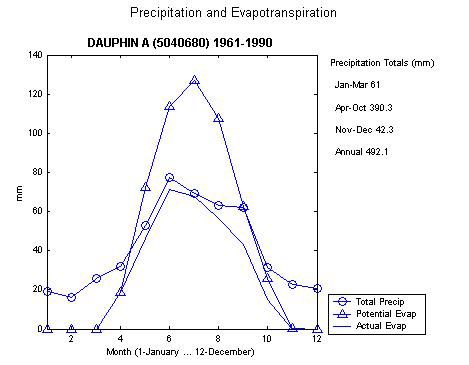
intégrés dans différents scénarios d’émissions qui sont utilisés pour inciter ou « forcer » un MCG à
déterminer la réaction climatique. IS92 et SRES sont les deux types de scénarios d’émissions
actuellement utilisés par le GIEC pour évaluer les répercussions du changement climatique. Les
hypothèses concernant les deux types sont résumées au chapitre 2.

Le choix de scénarios particuliers pour évaluer les répercussions du changement climatique
s’accompagne de beaucoup d’incertitude. Dans la deuxième partie du chapitre 2, il est question de
cette incertitude. Un certain nombre d’agences gouvernementales et d’organismes de recherche de par
le monde s’emploient activement à élaborer des MCG. Au moment où le guide a été rédigé, le GIEC
offrait huit MCG : le modèle couplé de circulation générale (MCCG – Canada); le modèle couplé
océan-atmosphère du Hadley Centre (HadCM – Royaume-Uni); le modèle du Centre de recherches
climatiques de l’Allemagne/Hambourg (ECHAM – Allemagne); le modèle du Centre japonais de la
recherche sur les systèmes climatiques (CCSR-9 – Japon); le modèle de la Commonwealth Scientific
and Industrial Research Organization (CSIRO – Australie); et le modèle du Geophysical Fluid
Dynamics Laboratory (GFDL – États-Unis). Toutefois, chacun de ces modèles de circulation générale
a des caractéristiques spatiales différentes et comprend de nombreux scénarios d’émissions IS92 et
SRES, ce qui oblige les chercheurs à choisir parmi plus de 100 scénarios de changement climatique
pour faire une évaluation des répercussions. En règle générale, le GIEC recommande d’utiliser pour
l’évaluation des répercussions de nombreux scénarios de changement climatique présentant un
éventail de conditions futures possibles. Les diagrammes de dispersion sont couramment utilisés pour
déterminer les scénarios qu’il convient de choisir. Ces diagrammes représentent le changement de la
température moyenne annuelle et la variation des précipitations annuelles, et sont des outils graphiques
qui permettent d’illustrer l’éventail des scénarios climatiques futurs. Le chapitre 2 renferme une série
de diagrammes de dispersion qui permettront de préciser l’éventail de scénarios climatiques futurs
prévus par différents scénarios de changement climatique.

La dernière partie du chapitre 2 propose un exercice pratique au lecteur. Les directives étape par étape
aident à choisir les scénarios de changement climatique pour une évaluation hypothétique des
répercussions du changement climatique au parc national du Mont-Riding. L’exercice utilise les
données qui figurent sur une série de feuilles de travail Microsoft Excel qu’on trouvera sur le
CD-ROM. Les données du scénario de MCG pour chaque parc national proposé et existant du Canada
figurent également sur le CD-ROM.

Le chapitre 3 décrit le deuxième type de scénario de changement climatique qui figure dans le guide :
les scénarios bioclimatiques. Comme pour le chapitre 2, la première partie du chapitre 3 décrit les
caractéristiques des scénarios bioclimatiques en mettant l’accent sur l’utilisation des données des
MCG pour transformer les données du profil bioclimatique. Les profils se composent de différentes
variables climatiques et d’indices connexes tirés d’observations climatiques quotidiennes propres à un
lieu et échelonnés sur une moyenne de 30 ans dans l’ensemble du pays. Pour obtenir des projections
de différents aspects du bioclimat, on lui applique des données des scénarios de changement
climatique tirés des MCG. Comme ce type de scénario de changement climatique a un avantage par
rapport aux MCG en ce qu’il fournit une résolution spatiale plus fine pour les évaluations des
répercussions, le rapport renferme une liste des stations climatiques proches de chaque parc national
existant et proposé. La proximité de chaque parc national par rapport à une station climatique
canadienne varie considérablement. Cette partie du chapitre 3 décrit également les quatre catégories de
données bioclimatiques que Parcs Canada peut utiliser pour évaluer les répercussions – températures,
précipitations, degrés-jours et hydraulicité.

La dernière partie du chapitre 3 décrit la méthode d’utilisation des données bioclimatiques. Les
directives étape par étape expliquent comment consulter les données bioclimatiques du site Web du
Projet canadien des scénarios de répercussions climatiques (PCSRC). En utilisant la station climatique
de Dauphin (Manitoba) à titre d’exemple, l’exercice décrit les changements prévus de température, de
précipitation et de degré-jour au parc national du Mont-Riding dans les années 2050 (2040 à 2069) par
rapport à la période de référence (1961-1990).

Climate Change Scenarios for Canada’s National Parks: A Users Manual                                  x
Scénarios de changement climatique pour les parcs nationaux du Canada: guide de l’utilisateur
Le dernier chapitre du guide porte sur les scénarios quotidiens. Ces derniers sont une version à échelle
réduite dans le temps des données des scénarios tirés des MCG. Les données des scénarios quotidiens
sont obtenues par l’application des scénarios de changement climatique établis au mois à une
représentation statistique des données climatologiques observées dans un générateur de données
météorologiques stochastiques. Ce dernier est un outil statistique qui simule des données
météorologiques quotidiennes pour une série de variables climatiques à un endroit donné. C’est une
façon de produire des données météorologiques « synthétiques » (simulées) qui sont statistiquement
semblables aux données observées aux stations climatiques et d’obtenir des données de scénarios
quotidiens à partir des scénarios de changement climatique produits mensuellement. Il s’agit d’un outil
de calcul peu coûteux qui peut fournir quotidiennement des scénarios de changement climatique
propres à un lieu sur plusieurs années. Le processus technique de production de données
météorologiques synthétiques au moyen du générateur de données météorologiques de la Long Ashton
Research Station (LARS), programme logiciel expressément conçu par l’Université de Bristol
(Royaume-Uni), est décrit dans la première partie du chapitre. Celui-ci se termine par un exercice
pratique. Ce type de données tirées de scénarios est utile dans des situations qui reposent sur des seuils
climatiques à une très petite échelle temporelle comme la saison des feux de forêt, la saison des petits
fruits, la saison des activités récréatives et les conditions de sécheresse. Des données-échantillons de
température, de précipitation et de gel et des données correspondant à l’augmentation des degrés-jours
sont fournies pour le parc national du Mont-Riding en plus de données pour les parcs nationaux de
l’Île-du-Prince-Édouard et Simirlik qui sont fournies à des fins de comparaison. Les données des
scénarios quotidiens pour d’autres parcs nationaux peuvent être obtenues par l’application des données
du scénario de MCG au programme de générateur de données météorologiques de la LARS; ce
programme peut être téléchargé à partir du site Web du PCSRC.

Une annexe renfermant des ressources additionnelles se trouve à la fin du guide. Un certain nombre de
publications, de rapports gouvernementaux et d’extraits de sites Web sur les trois types de scénario de
changement climatique sont également mentionnés dans le rapport. Toutefois, il importe de noter que
ces ressources sont en général plus techniques que le guide lui-même.

Climate Change Scenarios for Canada’s National Parks: A Users Manual                                   xi
Scénarios de changement climatique pour les parcs nationaux du Canada: guide de l’utilisateur
1.0 Introduction to the Manual
                 aturally-occurring, radiatively-active gases, the so-called greenhouse gases (GHG), in
                the Earth’s atmosphere (e.g., water vapour, carbon dioxide, methane, nitrous oxide) trap
                long wave energy radiated from the surface and atmosphere, which results in the global
                 mean near-surface temperature being about 33oC warmer than it would otherwise be.
                 Life as we currently known it would not be possible without the warming influence of
                 this natural ‘greenhouse effect.’

The theory that industrial emissions of these greenhouse gases would influence the global climate
system was first formulated by the Swedish chemist Svante Arrhenius over 100 years ago. Arrhenius
(1896) concluded that the world’s supply of coal and other fossil fuel resources would be exhausted
before there would be an appreciable human influence on global climate. However, this is not the case.
In 1995, nearly a century later, the United Nations Intergovernmental Panel on Climate Change
(IPCC) declared that ‘the balance of scientific evidence indicates a discernible human influence on the
global climate’ (IPCC, 1996) The magnitude of climate change is expected to be similar to that of the
transition from the last glacial to interglacial period (about 5°C), yet to occur during a single century,
rather than over a few thousand years. The implications for human and environmental systems in park
management are considerable.

1.1 Climate Change and National Parks
Climate change was identified as a significant stressor by seven national parks in Canada’s The State
of the National Parks Report (1997). A screening level impact assessment (Scott and Suffling, 2000),
conducted by the Adaptation & Impacts Research Group (Environment Canada) and the University of
Waterloo (Faculty of Environmental Studies) in collaboration with Parks Canada, further examined
the implications of climate change for Canada’s 38 national parks. The results of this assessment are
summarized by region in Figure 1.

Climate change will pose a number of ecological and tourism-related challenges for park management
in Canada. The first challenge relates to conservation. Climate change embodies a simultaneous threat
and opportunity to different species and ecological communities within the national parks system. It is
projected that as individual species respond to climate change, current ecological communities will
begin to disassemble and ‘re-sort’ into new assemblages. The dynamic biogeography brought about
by global climate change will effectively alter the ‘rules’ of ecological conservation. The current
system of conservation lands in Canada was established, however, to protect ecosystems and species
according to their current distributions. The mandate of Parks Canada is to conserve representative
examples of Canada’s biodiversity for perpetuity. The spatial displacement of ecosystems and species
over varying time scales, will pose a serious challenge to maintaining the ecological integrity of a
representative sample of the nation’s biodiversity.

The second challenge for park management is related to tourism in national parks. It is expected that
climate change will alter the recreational opportunities and visitation patterns within and among
national parks. Changes in these factors will significantly influence the viability of tourism and
recreational activities in parks and the stability of local economies dependent on park-based tourism.
As it is, Canada’s system of national parks represents a major tourism resource. Tourism expenditures
attributable to national park visits exceeded $1.2 billion in 1994/95 (Parks Canada, 1998).

Climate Change Scenarios for Canada’s National Parks: A Users Manual                                    1
Scénarios de changement climatique pour les parcs nationaux du Canada: guide de l’utilisateur
WESTERN CORDILLERA PARKS
• altered seasonal hydrology
• increased snow pack and avalanche activity
• possible temporary elevation of river toxins resulting from
increased glacial melting
• altered river ecology
• latitudinal and elevational migration of ecozones
• loss of some Alpine assemblages from mountain peaks
• increased forest fire frequency and intensity ARCTIC PARKS
• increased forest disease outbreak and insect infestations • northward expansion of treeline
• increased wintering zone pressures and impaired migration of • increased permafrost active layer and thawing
large animals
• reduced sea and lake ice seasons and altered sea
mammal distributions
• increased snow pack and ice layers (reducing
browsing accessibility for ungulates)
• greater severity and length of insect seasons
(increased harassment of ungulates)
• altered migration patterns and diminished genetic
PACIFIC PARKS exchange among arctic islands
• potential for altered predator-prey relationships
2
• sea-level rise
• increased ocean surface temperatures
• greater storm intensity and frequency
• increased salt water intrusion
• reduced nutrient upwelling and
increased incidence of red tide blooms
• reduced cold water habitat and
expansion of southern fish species
populations
• altered seasonal hydrology PRAIRIE PARKS
• altered spawning and migration • altered seasonal hydrology
patterns • increased frequency and intensity of drought
• loss of Alpine species from higher stress GREAT LAKES-ST.LAWRENCE BASIN PARKS
elevations • reduced wetland area • lower average water levels ATLANTIC PARKS
• accelerated forest insect and disease • altered waterfowl breeding and migration • increased lake and stream water temperatures • sea-level rise and greater storm
cycles patterns • loss of cold-water fish habitat and altered intensity/frequency
• altered fish species composition (expansion breeding/spawning and migration patterns • increased coastal erosion and salt water
of warm water species) • reduction of significant wetland areas intrusion
• increased forest fire frequency and intensity • increased forest fire frequency and intensity • altered marine-terrestrial interface
• increased forest disease outbreak and insect • increased forest disease outbreak and insect • possible expansion of cold-water species
infestations infestations • increased forest fire frequency
• loss of boreal forest to grassland and • altered successional trajectories and loss of mature • increased storm, fire, and pest disturbance
temperate forest forest habitat • loss of boreal forest to temperate forest
• loss of boreal forest to temperate forest
• expansion of southern exotics
Figure 1. Regional Cross-Cutting Climate Change Impacts in Canada’s National Parks
Source: Summarized from Scott and Suffling, 2000Two recreation dimensions highly sensitive to climatic changes are the length of operating seasons and the quality of tourism experiences. Any changes in season length would have considerable implications for both the short-term and long-term viability of tourism and recreation activities. Winter activities, such as cross-country skiing and snowmobiling, as well as the businesses and destination areas associated with them are likely to be negatively impacted. Recent assessments (Scott et al., 2002) of the tourism industry in central Ontario suggest that the ski seasons could be reduced by 50% as early as the 2020s. Alternatively, warmer temperatures could also be beneficial. Season lengths of certain recreational activities (e.g., camping) could be extended and the occurrence of other activities could be possible in parks where the activities are currently not as common. However, locally important tourism resources, such as Athabasca Glacier in Banff National Park or polar bears in Wapusk National Park will likely be at risk. The possibility of economic benefits may occur at the expense of increased environmental deterioration, as destinations will likely host more visitors for longer periods of time, the quality of recreation resources (e.g., water quality) and experiences may decline, and increased inter-sectoral resource conflicts may become more pronounced. 1.2 Climate Change Scenarios An important component of any response by park officials to climate change will be the use of climate change scenarios to examine the potential climate change impacts and the implications of adaptation strategies. Most climate change scenarios are computer-generated descriptions of scientifically plausible future climates that describe possibilities rather than predictions, which suggest a degree of certainty. There are three types of climate change scenarios for use by Parks Canada: 1) scenarios from global climate models (GCMs), 2) bioclimate scenarios, and 3) daily scenarios. Scenarios from global climate models GCMs are three-dimensional computer models that represent mathematically, as far as is possible, the physical processes of the atmosphere, oceans, cryosphere and land surface and the relationships and feedbacks between them. Changes in atmospheric composition (e.g., changes in the concentration of the greenhouse gases) affect the radiation balance of the Earth-atmosphere system and result in changes in climate, such as altered temperature and precipitation patterns. It is possible to simulate how climate may change in the future by running experiments in which atmospheric composition changes in response to different greenhouse gas emissions scenarios. GCMs generally work well at the global, hemispheric and continental scales and at seasonal timescales or longer, but in general, the finer the spatial and temporal resolutions the less confidence there is in their output. This means that instead of using GCM output directly to represent current or future climate conditions, it is necessary to construct climate change scenarios from this output by calculating the changes between the model’s representation of the baseline period (currently 1961-1990) and a future time period. The climate change scenarios are then applied to observed climate data in order to obtain a representation of future climate conditions. Climate change scenarios for Canada can be obtained from the Canadian Climate Impacts and Scenarios (CCIS) Project website (http://www.cics.uvic.ca/scenarios), whilst the IPCC Data Distribution Centre (http://ipcc-ddc.cru.uea.ac.uk) provides climate change scenarios at the global scale. Bioclimate scenarios Bioclimate scenarios, which provide projections of different aspects of the bioclimate (e.g., growing degree days, water deficits) at individual sites, are also available from the CCIS Project website for a number of sites across Canada. Whilst they provide site-specific future climate information, the bioclimate scenarios have been obtained using the standard scenario practice of applying coarse-scale GCM-derived climate change scenarios to observed climate data, rather than developing statistical relationships between the large-scale (i.e., GCM) climate and local weather in the process known as downscaling. Daily scenarios Although GCMs operate and provide information at the daily time scale they are considered to be less reliable at this temporal resolution. One way of obtaining daily data for a particular climate scenario is to use a statistical model known as a stochastic weather generator. These models can be used to Climate Change Scenarios for Canada’s National Parks: A Users Manual 3 Scénarios de changement climatique pour les parcs nationaux du Canada: guide de l’utilisateur
generate synthetic daily weather data for a particular climate scenario by combining the projected
monthly or seasonal changes in temperature and precipitation, for example, with the statistical
characteristics of the current climate at the site in question.

GCMs provide output for the entire globe on a grid box basis, with the grid boxes varying in size
depending on which GCM being used. The bioclimate scenarios and daily scenarios have been
obtained by taking the information from the grid box within which the site is located (or information
averaged over a number of grid boxes) and applying it to observed weather data. So although the
bioclimate and daily scenarios appear to be at fine spatial resolution, this is because the observed
weather data is providing the local detail.

1.3 Objectives and Outline
This manual is a plain-language document designed to guide people through the selection and
interpretation of the three types of climate change scenarios listed above. The manual has three
objectives:
    1) it addresses the theoretical and practical foundations of each climate change scenario type,
    2) it outlines how to retrieve output data from each type of climate change scenario, and
    3) it includes hands-on exercises to assist in the interpretation of output data for each type of
         climate change scenario.

This manual is divided into four chapters. Chapters two through four, respectively, are devoted to the
three types of climate change scenarios. Background information on the characteristics of each
scenario are provided, along with a hands-on exercise demonstrating how to obtain and interpret
associated data. For the purposes of simplicity, climate change scenarios for Riding Mountain
National Park are used in the hands-on exercises. The appendix of additional, yet slightly more
technical, information about climate change scenarios is provided at the end of this manual.

Climate Change Scenarios for Canada’s National Parks: A Users Manual                                4
Scénarios de changement climatique pour les parcs nationaux du Canada: guide de l’utilisateur
2.0 GCM Scenarios Climate change scenarios derived from GCMs are by far the most commonly employed type of climate change scenario and provide the basis for all three of the climate change scenario types introduced in Chapter one of this manual. They are widely accepted as the primary means for making scientifically plausible projections about the magnitude of future climate change and for exploring the consequences of different greenhouse gas and aerosol emissions scenarios. They have been and are routinely used in climate change vulnerability, impacts and adaptation assessments. 2.1 What are GCMs? Global climate models (GCMs), also referred to as general circulation models, are three-dimensional models of the earth’s climatic system in which the physical processes governing climate are represented in mathematical terms. The most recent generation of GCMs is able to simulate historical (from about 1850 onwards) as well as future climate conditions by modelling the climate response to changes in atmospheric composition, which affect the energy balance of the Earth-atmosphere system. The degree to which a GCM can simulate the observed climatic records hinges on the level of understanding of the processes that govern the climate system and also on available computing resources. Over the last three decades, improvements in the understanding of the individual atmospheric, oceanic and associated processes and the tremendous increase in the power of computer technology have advanced the development of climate models. In the early 1970s and 1980s, the representation of complex atmospheric and oceanic processes was limited to a certain extent by computing power; three-dimensional models of the atmosphere and ocean were developed separately. By the late 1990s, scientific and computer advances enabled atmospheric and oceanic models to be integrated in a process known as coupling. GCMs now include a range of atmospheric (e.g., radiation absorption, cloud formation, aerosols), oceanic (e.g., heat and salt transportation, formation of sea ice) and related (e.g., water and carbon cycle, vegetation evapotranspiration) processes and feedbacks. A GCM, operating at a spatial resolution of about 3° latitude by 3° longitude (roughly 300 km by 300 km), will take about 260 days of CPU time on a CRAY X-MP computer to simulate 200 years of output for a particular climate change experiment. 2.2 What are GCM Scenarios? Despite advances in model complexity, the output from GCM simulations does not have a sufficient spatial resolution to be used directly in climate change studies. Instead it is necessary to construct climate change scenarios based on the output. Scenarios derived from GCM output provide estimates of projected changes (with respect to a baseline or reference period) for a range of climate variables at a set of global grid points. Figure 2 illustrates the location of these grid points over Canada, as modelled by the first version of the Canadian coupled GCM, CGCM1. Figure 2 - GCM grid points (CGCM1) Climate Change Scenarios for Canada’s National Parks: A Users Manual 5 Scénarios de changement climatique pour les parcs nationaux du Canada: guide de l’utilisateur
Earlier generations of GCMs were run in what is known as ‘equilibrium’ mode. These GCMs were
basically three-dimensional models of the atmosphere coupled to a very simple representation of the
ocean. This meant that it was not possible to simulate time-dependent, or ‘transient’, climate change,
since the complex role of the oceans, particularly in heat transport, was not represented. Instead these
GCMs were used in climate change experiments examining the effect on climate of an instantaneous
doubling (or quadrupling) of atmospheric CO2 concentrations. These experiments, termed
‘equilibrium’ since the models were run until a stable, or equilibrium, climate was obtained, were run
for 1×CO2 and 2×CO2 conditions and the difference between these two runs (known as the ‘control’
and ‘perturbed’ experiments, respectively) represented the magnitude of the climate response to the
imposed forcing (i.e., the climate change in response to a doubling of CO2).

The most recent generation of GCMs is much more complex, with three-dimensional atmospheric
models coupled to three-dimensional models of the ocean. In addition there are representations of sea
ice, of the individual greenhouse gases, of the role of atmospheric aerosols and the land surface is
much more complex than in earlier GCM generations. These ‘warm start’ transient GCMs are able to
simulate climate over both the historical and future time periods and generally operate at a higher
spatial resolution than the earlier equilibrium GCM experiments. Atmospheric composition can
change on a year-by-year basis and so much more realistic experiments investigating the climate
response to different greenhouse gas and aerosol emissions scenarios can be undertaken. Since the
reliability and resolution of these GCMs are still generally insufficient for most applications, climate
change scenarios are still constructed by calculating the change between a future time period and the
baseline (currently 1961-1990) period, although these two time periods are taken from the climate
change experiment of the GCM. This experiment simulates the change in climate over the historical as
well as the future time period. For this generation of GCMs a control simulation also exists, but it has
no role in climate change scenario construction since it represents conditions in which there is no
change in atmospheric composition and so is used solely to determine the GCM’s representation of
‘natural’ climate variability. All of the GCMs used in the IPCC Third Assessment Report were of the
‘warm start’ transient variety. The climate change scenarios discussed in this manual represent three
future time periods, the 2020s (2010-2039), the 2050s (2040-2069) and the 2080s (2070-2099).

  3      GCMs produce output on a grid box by grid box basis, but a model’s ability to simulate
      current climate conditions is measured over a larger area. GCM-derived climate change
      scenario data for each national park are therefore based on an average of the grid boxes
                            surrounding each reference climate station.

2.2.1 What are emissions scenarios?
In order to simulate how climate may change in the future in response to changing levels of
greenhouse gases, we need to know how the emission of greenhouse gases will change. This will
obviously depend on such factors as global population and economic growth and energy use.
Scientific assumptions are made about the future state of these factors and integrated into a number of
proposed different emissions scenarios, which are used to drive, or ‘force’ a GCM to determine an
associated climatic response. In addition to the global warming effect of the greenhouse gases,
atmospheric aerosols (e.g., sulphate aerosols resulting from fossil-fuel combustion) generally result in
regional cooling through their direct effects on radiation scattering and their indirect effects on clouds.

IS92 Scenarios
The first comprehensive set of emissions scenarios was proposed by Leggett et al. (1992) in the 1992
Supplement to the IPCC’s First Assessment Report (IPCC, 1990). These six IS92 scenarios (IS92a to
IS92f) made assumptions concerning future social, economic and technological conditions and thus
the emissions of anthropogenic greenhouse gases into the atmosphere. The IS92a scenario is

Climate Change Scenarios for Canada’s National Parks: A Users Manual                                     6
Scénarios de changement climatique pour les parcs nationaux du Canada: guide de l’utilisateur
You can also read