Comparing the Impacts of Northeast Hurricanes on Energy Infrastructure - Office of Electricity Delivery and Energy Reliability U.S. Department of ...
←
→
Page content transcription
If your browser does not render page correctly, please read the page content below
Comparing the Impacts of
Northeast Hurricanes on
  Energy Infrastructure

Office of Electricity Delivery and Energy Reliability
            U.S. Department of Energy

                     April 2013
                                                        1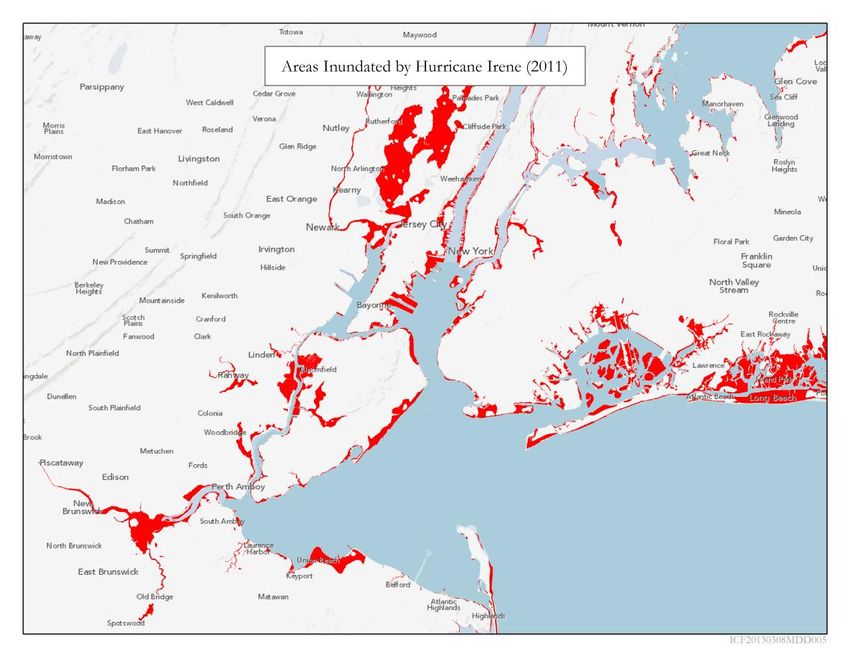
For Further Information
This report was prepared by the Office of Electricity Delivery and Energy Reliability under the
direction of Patricia Hoffman, Assistant Secretary, and William Bryan, Deputy Assistant
Secretary.

Specific questions about this report may be directed to Alice Lippert, Acting Deputy Assistant
Secretary, Energy Infrastructure Modeling and Analysis (alice.lippert@hq.doe.gov).

Kevin DeCorla-Souza of ICF International contributed to this report.

Cover: http://www.nasa.gov/images/content/701091main_20121028-SANDY-GOES-FULL.jpg

                                                                                                  i
Contents
Executive Summary ................................................................................................................... iv
Storm Comparison ..................................................................................................................... 1
   Irene ....................................................................................................................................... 1
   Sandy ..................................................................................................................................... 2
   Storm Surge and Tides ........................................................................................................... 4
Electricity Impacts ...................................................................................................................... 7
   Power Outages....................................................................................................................... 7
   Power Restoration .................................................................................................................11
   Nuclear Power Plants ............................................................................................................13
Petroleum Impacts ....................................................................................................................14
   Refineries ..............................................................................................................................14
   Transportation & Supply ........................................................................................................16
   Prices & Stocks .....................................................................................................................19
   Retail Stations .......................................................................................................................24
Natural Gas...............................................................................................................................25
   Transmission Pipelines ..........................................................................................................25
   Local Distribution Companies ................................................................................................25
Federal Actions .........................................................................................................................26
   Providing Situational Awareness ...........................................................................................26
   Facilitating Restoration ..........................................................................................................27
   Releasing Fuel Reserves.......................................................................................................29
   Easing Regulations................................................................................................................30
State & Local Actions ................................................................................................................34
   Major Disaster and Emergency Declarations .........................................................................34
   Easing Regulations................................................................................................................36
   Enforcing Price Gouging Laws ..............................................................................................37
   Facilitating Restoration ..........................................................................................................38
Appendices ...............................................................................................................................41
   Appendix 1. Peak Customer Power Outages by States .........................................................41
   Appendix 2. U.S. Coast Guard Commands ...........................................................................42
   Appendix 3. Jones Act Waiver Vessel Deliveries by Port and Product ...................................43
   Appendix 4. Major Disaster Declarations and Emergency Declarations by State and Storm ..44

                                                                                                                                                ii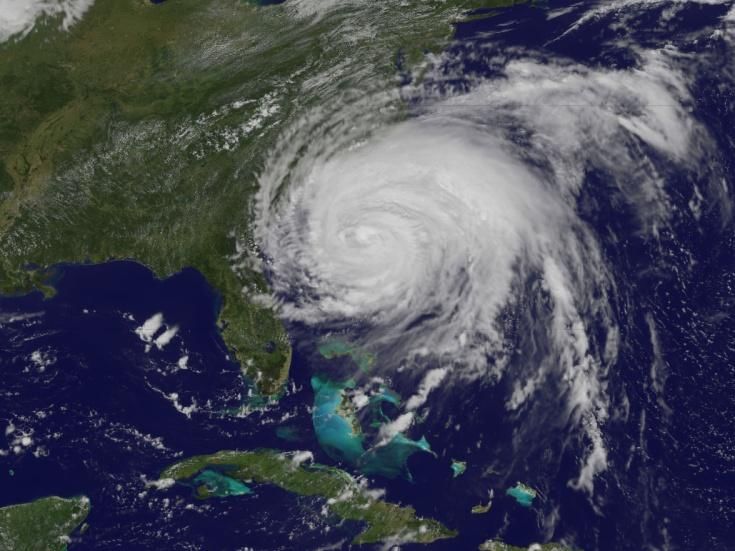
Figures
Figure ES-1. Irene and Sandy Storm Paths and Landfall Dates ................................................. iv
Figure 1. Hurricane Irene Day before First U.S. Landfall (August 26, 2011) ............................... 3
Figure 2. Hurricane Sandy Day before First U.S. Landfall (October 28, 2012) ........................... 3
Figure 3. New York Harbor Areas Flooded by Irene and Sandy ................................................. 6
Figure 4. Peak Power Outages by Select State and Storm ........................................................ 7
Figure 5. Comparison of Power Outage Restoration Percentages by Storm .............................11
Figure 6. Comparison of Power Outage Restoration Percentages by Storm .............................12
Figure 7. Weekly Gross Inputs* into East Coast (PADD 1) Refineries .......................................16
Figure 8. Weekly Petroleum Imports to the East Coast (PADD 1) .............................................19
Figure 9. Selected Daily Wholesale and Weekly Retail Petroleum Product Prices ....................20
Figure 10. New York Harbor Gasoline Stock Changes and Spot Price Differentials ..................21
Figure 11. New York Harbor Distillate Stock Changes and ULSD Spot Price Differentials ........23
Figure 12. Availability of Gasoline in the New York City Metropolitan Area ...............................24
Figure 13. EIA's Interactive Infrastructure Map for Hurricane Sandy .........................................27
Figure 14. ESF-12 Responders Deployed by Storm ..................................................................28

Tables

Table ES-1. Energy Impacts of Hurricane Irene vs. Hurricane Sandy ......................................... v
Table 1. Irene vs. Sandy Storm Comparisons ............................................................................ 1
Table 2. Maximum Recorded Storm Tides (Feet)* by Select Location and Storm ...................... 4
Table 3. Number of Energy Assets Located in Flooded Areas by Storm and State .................... 5
Table 4. Electric Infrastructure Damage by Storm and Utility...................................................... 9
Table 5. Nuclear Power Plants Units Affected by Hurricanes Irene and Sandy .........................13
Table 6. Refineries Affected by Hurricanes Irene and Sandy ....................................................15
Table 7. Petroleum Pipelines Affected by Hurricanes Irene and Sandy .....................................17
Table 8. East Coast Port Sectors Affected by Hurricanes Irene and Sandy...............................18
Table 9. Hurricane Sandy Jones Act Waiver Vessel Deliveries by Port .....................................31
Table 10. EPA Fuel Waivers Issued Following Hurricane Sandy ...............................................32
Table 11. Duration (Days) of Emergency and Major Disaster Declarations by State and Storm 35

                                                                                                                       iii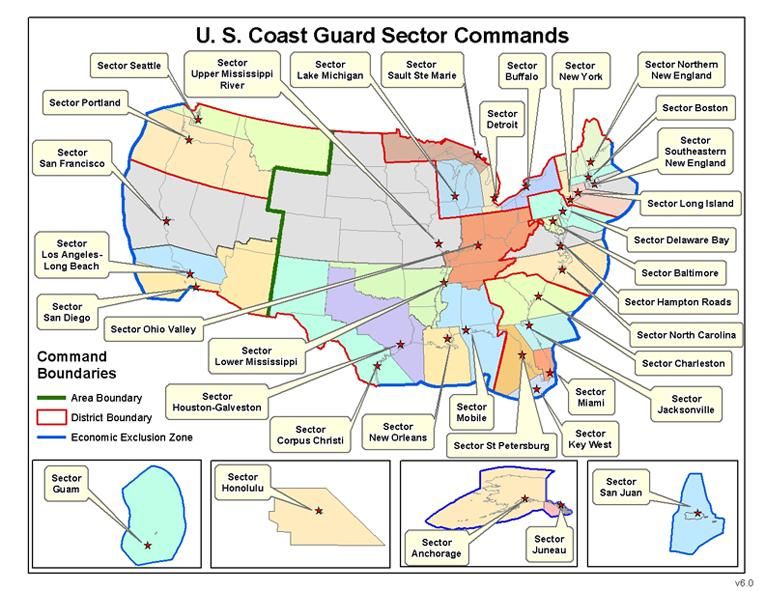
Executive Summary
Two major hurricanes have impacted the Northeastern United States over the past 2 years,
devastating coastal communities and causing widespread impacts to the region’s energy
infrastructure, supply, and markets. In late August 2011, Hurricane Irene made landfall as a
category 3 hurricane in North Carolina before moving up the East Coast, making successive
landfalls in New Jersey and New York, and affecting communities in the United States as far
north as Maine. In late October 2012, Hurricane Sandy made landfall as a post-tropical cyclone
near Atlantic City, New Jersey before moving inland. Although Sandy was weaker than Irene at
landfall, Sandy brought tropical storm conditions to a larger area of the East Coast, and blizzard
conditions as far west as the Central and Southern Appalachians. Ultimately, Sandy had a
larger and longer-lasting impact on the region’s energy infrastructure and supply than Irene, and
these impacts necessitated a greater response from Federal, State, and local governments.
Figure ES-1 compares the paths of the two storms.

               Figure ES-1. Irene and Sandy Storm Paths and Landfall Dates

Source: NOAA

Both Irene and Sandy caused extensive damage to electric transmission and distribution
infrastructure in the Northeast and Mid-Atlantic. Irene disrupted power to 6.69 million customers
from South Carolina to Maine. By comparison, Sandy (and the November 2012 Nor’easter that
followed a week later) knocked out power to 8.66 million customers from North Carolina to

                                                                                                iv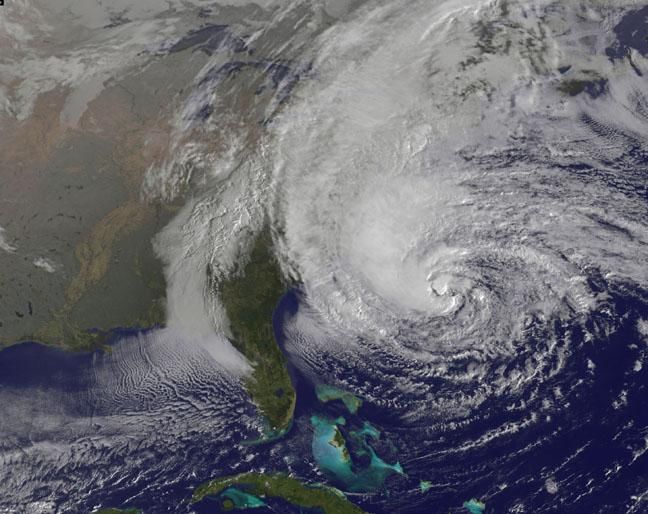
Maine and as far west as Illinois and Wisconsin. The devastation to electric infrastructure was
greater during Sandy than during Irene, and the conditions in the aftermath of the storm were
more challenging. Following Sandy, utilities had restored power to 95 percent of affected
customers 10 days after outages peaked compared with 5 days following Irene.

Sandy’s impact on the region’s petroleum infrastructure was also more severe than Irene’s
impact. Both storms caused flooding and power outages at refineries, pipelines, and petroleum
terminals in the New York Harbor area, depressing petroleum product supply in the Northeast
and leading to stock draw downs and temporary price increases. However, Sandy’s damage to
petroleum infrastructure was more extensive, and restoration of petroleum supply systems
following the storm took longer. Survey data from the Energy Information Administration (EIA)
indicate that product deliveries (outflows) from petroleum product terminals in the New York
Harbor had returned to only 61 percent of their pre-storm levels more than 9 days after Sandy
made landfall. The supply issues at New York Harbor terminals, combined with power outages
at retail fueling stations, led to widespread gasoline shortages in the New York City area in the
weeks after Sandy made landfall. No widespread supply issues or gasoline shortages were
reported following Hurricane Irene. Table ES-1 summarizes the major energy impacts of
Hurricanes Irene and Sandy. Hurricanes Irene and Sandy did not have a major impact on
natural gas infrastructure or supplies in the Northeast

            Table ES-1. Energy Impacts of Hurricane Irene vs. Hurricane Sandy

            Impact                                                  Irene     Sandy
            Electric Customer Outages (millions)                      6.69       8.66
            Petroleum Refining Capacity Shut (barrels per day)     238,000    308,000
            Petroleum Product Terminals Shut (number)                   25         57
           Source: OE/ISER Situation Reports

Following both storms, various agencies within the Federal government worked together to
provide situational awareness, facilitate restoration, and ease regulations. Following Sandy, the
Department of Energy’s (DOE) Power Marketing Administrations from the Western United
States—for the first time— assisted investor-owned utilities with power restoration under mutual
aid agreements. The Federal government also—for the first time—released supplies from the
Northeast Home Heating Oil Reserve. In addition, the Federal government issued waivers
allowing foreign vessels to ship fuel from the Gulf Coast to the Northeast, permitting greater
fuel-use flexibility for certain applications, and allowing utility and fuel truck drivers to work
longer hours to expedite the restoration of energy systems and supply.

State and local governments also worked actively to address energy issues. Following Sandy,
New Jersey and New York City implemented odd-even license plate fuel rationing programs.
New York City also launched a program to expedite repairs to residential customers unable to
receive power, gas, or heating oil due to damage within their homes.

                                                                                                    v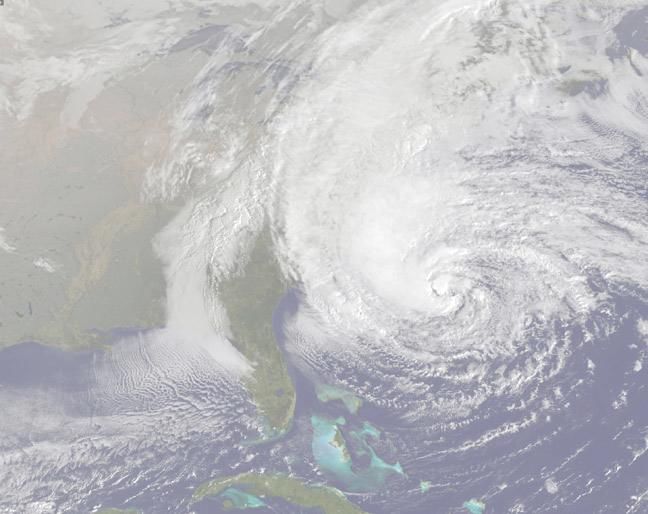
Storm Comparison
This report compares two major hurricanes that hit the Northeastern United States in 2011 and
2012 and their impacts on energy infrastructure. Hurricanes Irene and Sandy were large,
powerful storms that caused extensive damage across much of the Mid-Atlantic and Northeast.
The National Oceanic Atmospheric Administration (NOAA) ranks both storms among the
costliest and deadliest weather events in U.S. history.1 Although Sandy was weaker than Irene
when it first made landfall in the United States, Sandy was much larger, with tropical storm-force
winds reaching as far as 500 miles from the center of the storm. Table 1 compares aspects of
each storm. Figure 1 and Figure 2 on page 3 present satellite photographs of Irene and Sandy
as they approached the U.S. mainland.

                            Table 1. Irene vs. Sandy Storm Comparisons

                                 Irene                                    Sandy
Landfall Date                    August 27, 2011                          October 29, 2012
Strength at First U.S.
                                 Category 1 Hurricane                     Post-Tropical Cyclone
Landfall
                                 8/27 – Cape Lookout, NC (90 mph)
Landfall Location                                                         10/29 – Atlantic City, NJ (80 mph)
                                 8/28 – Little Egg Inlet, NJ (80 mph)
(sustained winds)
                                 8/28 – Coney Island, NY (75 mph)
Distance of Tropical
Storm-Force Winds from           300 miles                                500 miles
Center
                                 New York City* – 9.5 feet                New York City* – 14.1 feet
Peak Flooding
                                 Philadelphia – 9.9 feet                  Philadelphia – 10.6 feet
Property Damage                  $10 billion                              Est. $20+ billion
Deaths                           45                                       131
*The Battery
Sources: NOAA, EQUECAT, Property Claim Services, press

Irene
Irene made landfall as a category 1 hurricane in the Outer Banks region of North Carolina on
the morning of August 27, 2011. In the days that followed, Irene tracked towards the Northeast,
making its second U.S. landfall in New Jersey and its third and final U.S. landfall in Brooklyn,
New York. Torrential rain and storm surges of 3–4 feet caused significant river flooding across
eight States, including New York, Vermont, and New Jersey. The flood waters brought by Irene
constituted one of the worst flood disasters ever recorded in the Northeast.2 According to the
National Weather Service, total water level peaked near 9.5 feet above the mean lower low
water level at Battery Park in New York City, and at 9.9 feet along the Delaware River in
Philadelphia.

Irene was unusually large, with tropical storm-force winds extending nearly 300 miles from its
center. Irene was also a slow-moving storm, traveling at a top speed of 20 miles per hour (mph),
compared to speeds of 30–40 mph for similarly sized storms. According to NOAA, Irene caused

1
 ―Billion-Dollar Weather/Climate Disasters.‖ NOAA. NCDC. http://www.ncdc.noaa.gov/billions/events
2
 State of the Climate Hurricanes & Tropical Storms August 2011. NOAA. NCDC.
http://www.ncdc.noaa.gov/sotc/tropical-cyclones/2011/8.

                                                                                                               1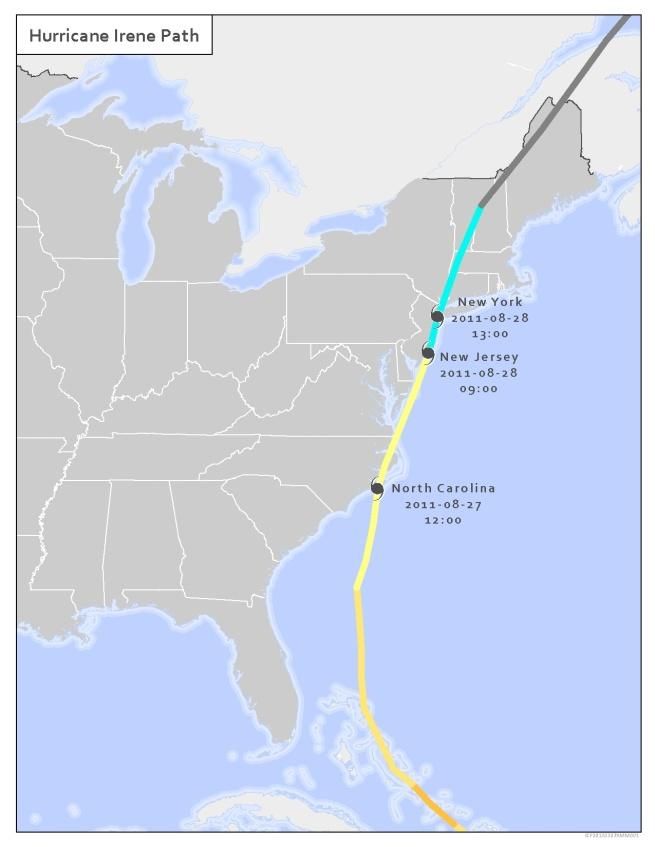
45 deaths and $10 billion in property damage, making it one of the deadliest and costliest
storms in U.S. history. In late October 2011—2 months after Irene made landfall—a historic and
unprecedented early season winter storm (known as a Nor’easter) deposited more than one foot
of heavy wet snow on interior portions of northeastern New Jersey, the Lower Hudson Valley,
and southern Connecticut.3

Sandy
Sandy made landfall near Atlantic City, New Jersey on October 29, 2012 after transitioning from
a tropical cyclone to a post-tropical cyclone. The storm had maximum sustained winds of 80
mph. Although weaker than Irene when it made landfall, Sandy was a larger storm, with tropical
storm-force winds extending nearly 500 miles from the storm’s center.4 The storm’s impact was
recorded across 24 States, although not all of these States had measurable energy impacts.
Sandy brought a large storm surge and high water levels to the coastal Northeast, where New
Jersey, New York, and Connecticut experienced the greatest impact. Record water levels were
observed at Battery Park in New York City (14.1 feet) and along the Delaware River in
Philadelphia (10.6 feet). In addition to wind, rain, and storm surge impacts in coastal areas,
Sandy also brought blizzard conditions to the Central and Southern Appalachians, where over a
foot of snow fell in six States from North Carolina to Pennsylvania.

Sandy caused large-scale flooding and wind damage across the Mid-Atlantic and Northeast.
Preliminary estimates indicate that Sandy led to at least 131 fatalities, and more than $20 billion
in property damage, making it another one of the deadliest and costliest weather events in U.S.
history.

More than a week after Sandy made landfall, an early-season Nor’easter brought wind, snow,
rain, and storm surge to parts of the Northeast still recovering from Sandy. Locations in New
Jersey, New York, and Connecticut reported record November snowfall figures as a result of the
storm.5

3
 ―October 29th Historic Early Season Snowstorm.‖ National Weather Service New York, NY.
http://www.erh.noaa.gov/okx/StormEvents/10292011/index.html and ―Transmission and Facility Outages during
the Northeast Snowstorm of October 29-30, 2011‖ Federal Energy Regulator Commission and North
American Electric Reliability Corporation. http://www.ferc.gov/legal/staff-reports/05-31-2012-ne-outage-
report.pdf
4
  ―National Summary Information - October 2012.‖ NOAA National Climatic Data Center.
http://www.ncdc.noaa.gov/sotc/summary-info/national/2012/10
5
  ―Significant Events from November and Autumn 2012.‖ NOAA National Climatic Data Center.
http://www1.ncdc.noaa.gov/pub/data/cmb/images/us/2012/nov/monthlysigeventmap-112012.gif

                                                                                                           2
Figure 1. Hurricane Irene Day before First U.S. Landfall (August 26, 2011)

Figure 2. Hurricane Sandy Day before First U.S. Landfall (October 28, 2012)

Source: NOAA

                                                                              3
Storm Surge and Tides
Flooding resulting from storm surge and storm tides was a major problem affecting energy
assets during Hurricanes Irene and Sandy. Storm surge is an abnormal rise in water levels
generated by a storm, over and above the predicted astronomical tides. Storm tides are the
abnormal rise in water levels due to a combination of storm surge and the astronomical tide.
This rise in water level can cause extreme flooding in coastal areas, particularly when storm
surge coincides with the normal high tide.6 Table 2 shows storm tides as recorded at select
locations along the East Coast following Irene and Sandy. In many cases, storm tides caused
by the hurricanes exceeded previous maximum water level records.
Table 2. Maximum Recorded Storm Tides (Feet)* by Select Location and Storm
Location Irene Sandy
Wilmington, NC 5.24 5.91
Washington, DC 3.87 6.11
Baltimore, MD 2.98 4.66
Philadelphia, PA 9.93 **10.62
Atlantic City, NJ 6.96 8.90
Bergen Point West Reach, NY **10.22 **14.58
The Battery, NY 9.50 **14.06
New Haven, CT **11.57 **12.25
Providence, RI 8.25 9.37
Boston, MA 11.95 12.92
Portland, ME 11.96 11.90
*Referenced to Mean Lower Low Water (MLLW)
** Maximum recorded water level value exceeded historical maximum value.
Source: NOAA Center for Operational Oceanographic Products and Services
The storm tide during Sandy was more severe and had a greater impact on energy assets than
the storm tide during Irene. Table 3 provides an analysis of spatial inundation data provided by
the Federal Emergency Management Agency (FEMA) following Hurricanes Irene and Sandy,
geo-located against energy assets. FEMA inundation data for Irene was available for all the
States listed in Table 3. Data for Sandy was available only for New Jersey, New York,
Connecticut, and Rhode Island. Data for Pennsylvania was not available for either storm.
Energy assets identified in Table 3 are located in areas that were fully or partially flooded but
the assets may or may not have experienced water damage depending on the level of
inundation, whether key equipment was protected or elevated, and other site-specific factors.
6
“Storm Surge Overview” National Hurricane Center. National Weather Service. http://www.nhc.noaa.gov/surge/
4Table 3. Number of Energy Assets Located in Flooded Areas by Storm and State
Storm Asset Type CT DE MD MA NC NH NJ NY RI VA Total
Irene Electric Power Plant 7 1 5 19 12 44
Electric Substations 9 1 3 1 8 21 12 9 64
NG Compressors 1 1
Oil Refineries 0
Petroleum Terminals 4 2 9 7 5 27
Irene Total 20 3 3 2 13 0 50 31 0 14 136
Sandy Electric Power Plant 7 n/a n/a n/a n/a n/a 36 24 2 n/a 69
Electric Substations 13 n/a n/a n/a n/a n/a 58 28 3 n/a 102
NG Compressors n/a n/a n/a n/a n/a 1 n/a 1
Oil Refineries n/a n/a n/a n/a n/a 1 n/a 1
Petroleum Terminals 16 n/a n/a n/a n/a n/a 33 13 n/a 62
Sandy Total 36 n/a n/a n/a n/a n/a 129 65 5 n/a 235
n/a = FEMA flood data are not available. PA flood data are not available for either storm.
Sources: FEMA, HSIP 2012, Ventyx, DOE
Table 3 indicates more energy assets were located in flooded areas during Sandy than during
Irene, including power plants, substations, refineries, and petroleum terminals. The number of
petroleum terminals in flooded areas during Sandy was more than double the number of
terminals in flooded areas during Irene. During both storms, assets in New Jersey, New York,
and Connecticut were the most severely affected, a factor that contributed to greater disruptions
and longer restoration times for electric power service and petroleum supply chains in those
States. These impacts are discussed in detail later in this report.
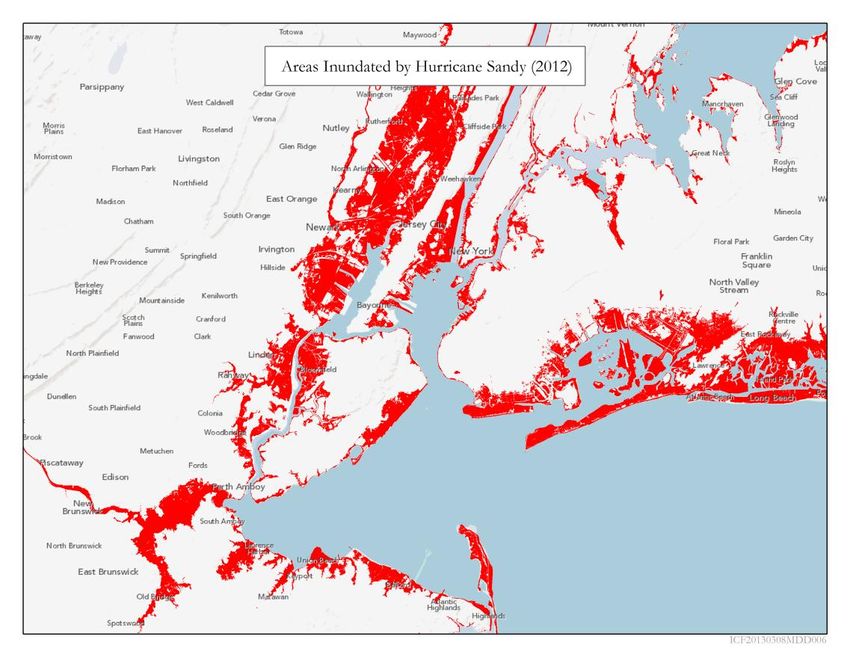
Flooding was a particular problem for petroleum assets located in the New York Harbor area
during Irene and Sandy. Figure 3 shows a wider area of inundation in New York Harbor during
Sandy than Irene, and NOAA’s tidal gauge on Staten Island (See Bergen Point West Reach, NY
in Table 2) measured a higher storm tide on the Kill Van Kull in New York Harbor during Sandy
(14.58 feet) than during Irene (10.22 feet). Phillips 66’s 238,000 barrel per day (b/d) Linden,
New Jersey refinery reported that it sustained flooding in low-lying areas of its facility during
Sandy. Petroleum terminals were also hit hard. Forty, or 76 percent, of the 53 petroleum
terminals located in the New York Harbor were in flooded areas during Sandy, compared with
16 terminals, or 31 percent, during Irene.
5Figure 3. New York Harbor Areas Flooded by Irene and Sandy
Source: FEMA
6Electricity Impacts
Both Hurricanes Irene and Sandy caused widespread damage to electric power transmission
and distribution networks and left millions of customers without power across the Eastern
Seaboard. Hurricane Sandy caused more overall customer power outages and affected more
States than Irene. Power restoration following Sandy was complicated by the November 2012
Nor’easter, and it took utilities more than twice as long to reach full restoration following Sandy
than it did following Irene.
Power Outages
During Hurricane Irene, 6.69 million customer outages were reported across 14 States and the
District of Columbia as the storm moved up the East Coast from South Carolina to Maine. By
comparison, Hurricane Sandy and the November 2012 Nor’easter caused 8.66 million customer
outages across 20 States and the District of Columbia from North Carolina to Maine and as far
west as Illinois.7 Figure 4 compares peak outages for States that experienced 500,000 or more
peak customer outages during either storm. Figure 4 shows that Hurricane Irene caused more
outages in Connecticut, Maryland, Massachusetts, North Carolina, and Virginia, while Hurricane
Sandy caused more outages in New Jersey, New York, and Pennsylvania. For a full list of peak
outages by State, see Appendix 1.
Figure 4. Peak Power Outages by Select State and Storm
3.0
Irene
2.5 Sandy
2.0
Millions of Customers
1.5
1.0
0.5
0.0
Source: OE/ISER Emergency Situation Reports
7
Outage totals for Irene and Sandy are the sum of peak outages reported for each State in Emergency Situation
Reports published by DOE’s Office of Electricity Delivery and Energy Reliability, Infrastructure Security and Energy
Restoration division (OE/ISER). Outages for Sandy include 150,000 additional outages caused by the November
2012 Nor’easter. http://www.oe.netl.doe.gov/emergency_sit_rpt.aspx
7Infrastructure Damage
Hurricanes Irene and Sandy brought devastating wind and flooding to the Northeast and Mid-
Atlantic States, damaging electric power transmission and distribution infrastructure, including
substations, power lines, and utility poles. Table 4 provides details of the damage, based
primarily on information compiled from OE/ISER Emergency Situation Reports, company press
releases, and utility filings with State public utility commissions. However, not all utilities in the
affected areas provided detailed information on such impacts, and those that did report impacts
did not often provide details in a uniform way. Consequently, it is not possible to directly
compare the damage to power infrastructure between the two storms or even between utilities
or States within the same storm. The data in the table is presented to provide perspective on the
magnitude of damage caused by Hurricanes Irene and Sandy.
Although specific conclusions cannot be drawn from the available data, generally, utilities that
experienced more customer outages experienced higher levels of infrastructure damage. In
particular, available data indicates infrastructure damage was more severe for utilities serving
customers in coastal New York and New Jersey during Sandy than Irene. The Long Island
Power Authority’s (LIPA) service territory, which serves customers on Long Island, New York,
experienced high winds and flooding during both Irene and Sandy (See Figure 3). LIPA
experienced damage to 50 substations, 2,100 transformers, and 4,500 utility poles following
Sandy, as compared with damage to 22 substations, 1,000 transformers, and 900 utility poles
following Irene.
8Table 4. Electric Infrastructure Damage by Storm and Utility
Damage Transmission
Substations Transformers Sections of Wire Poles
State/Utility Locations Lines
Irene Sandy Irene Sandy Irene Sandy Irene Sandy Irene Sandy Irene Sandy
VIRGINIA
Dominion Virginia Power 35,000 27 57 mi 1,619
MARYLAND
Baltimore Gas & Electric 0 247 4,861 2,500 348
Delmarva Power 1 40 308 53
Pepco (MD) 2 92 131 1,166 36
Potomac Edison 0 7 95 mi 14 700
SMECO 0 195 1 313
PENNSYLVANIA
Met Ed 6,889 9,500 130 304 25 41 18 mi 53 mi 143 731
PECO 13,000 278 390 90 mi 141 mi 316 750
Penelec 1,483 1,800 10 88 42 3 mi 11 mi 30 80
PPL 601 18 mi ~100 mi 900 619
UGI Utilities 617 382 1,043 39
West Penn Power 1,500 120 31 19 mi 65
NEW JERSEY
Atlantic City Electric 7 107 20 1,070 59
Jersey Central Power & Light 7 465 400 47 mi 3,400 466 800
Public Service Electric & Gas 8 31 383 1,000 1,384 599 2,500
Rockland Electric 58 974 27
NEW YORK
Central Hudson Gas & Electric 1,500 1 450 13 5 2,071 1,100 351 200
Consolidated Edison 30,000 163 4 2,598 900 91
Long Island Power Authority 18,926 22 50 1,000 2,100 61 5,953 400 mi 900 4,500
9Damage Transmission
Substations Transformers Sections of Wire Poles
State/Utility Locations Lines
Irene Sandy Irene Sandy Irene Sandy Irene Sandy Irene Sandy Irene Sandy
National Grid (NY) 196 7 672 399
N.Y. State Electric &Gas 22 64 7 38 4,985 5,000 224 1,023
Orange and Rockland 5,400 17 336 2 27 3,612 151 500
NEW ENGLAND
Connecticut Light & Power (CT) 4,968 623 2,000 105 mi 3,404 2,400 941 2,700
Central Maine Power (ME) 259 95
National Grid (RI) 37 8 1,140
National Grid (MA) 135 23 983 267
NSTAR (MA) 10,000 6 194 4 2,000 194
United Illuminating Co. (CT) 2 450 103
Sources: OE/ISER Emergency Situation Reports, utility websites, State public utility commission filings (listed below)
State Public Utility Commission Filings:
Maryland: http://webapp.psc.state.md.us/Intranet/casenum/CaseAction_new.cfm?CaseNumber=9279
Massachusetts: http://www.mass.gov/eea/grants-and-tech-assistance/guidance-technical-assistance/agencies-and-
divisions/dpu/storm-orders.html
New Jersey: http://www.nj.gov/bpu/pdf/announcements/2012/stormreport2011.pdf
New York: http://documents.dps.ny.gov/public/MatterManagement/CaseMaster.aspx?MatterCaseNo=11-M-0481 and LIPA:
http://moreland.ny.gov/sites/default/files/DPS%20Irene%20Report%20-%20LIPA.pdf
Pennsylvania: http://www.puc.state.pa.us/consumer_info/electricity/reliability.aspx
Rhode Island: http://www.ripuc.org/eventsactions/docket/D_11_94_Booth.pdf
Virginia: http://www.scc.virginia.gov/comm/reports/irene_pue.pdf
Connecticut: http://www.ct.gov/pura/lib/pura/pressreleases/2012/110909finaldecision.pdf
10Power Restoration
Full power restoration took more than twice as long following Hurricane Sandy than it did
following Hurricane Irene. Outages from Irene peaked on August 28, 2011. Three days later
utilities had restored power to 71 percent of the peak reported outages, and 5 days later power
had been restored to 95 percent of the peak.
Outages from Hurricane Sandy peaked on October 30, 2012. Three days later utilities had
restored power to 57 percent of the peak, and 6 days later power had been restored to 84
percent. Power restoration had reached more than 90 percent when the November 2012
Nor’easter slowed the progress of utility crews and added additional outages. Restoration of 95
percent was not achieved until 10 days after the peak. Figure 5 compares the progress of power
outage restoration following Hurricanes Irene and Sandy.
Figure 5. Comparison of Power Outage Restoration Percentages by Storm
100%
90%
80%
Nov. 2012
Nor'easter
70%
Percent Restored Since Peak
60%
50%
40%
30%
20% Sandy
10% Irene
0%
0 1 2 3 4 5 6 7 8 9 10 11 12 13 14
Days Since Peak
Source: OE/ISER Emergency Situation Reports
Power restoration took longer for individual States following Sandy than after Irene. Figure 6
compares power outage restoration by storm for the four States that experienced 500,000 or
more customer outages during both Sandy and Irene: Connecticut, New Jersey, New York, and
Pennsylvania. Figure 6 shows that full restoration came 8 days or more after peak outages for
11each State following Hurricane Sandy, whereas outages were fully restored or nearly restored
within 7 days for each State following Irene. Note that Hurricane Sandy caused more outages
than Irene in three of the four States observed (See Figure 4). In New York and New Jersey,
Hurricane Sandy caused more than twice the number of outages incurred during Irene.
Figure 6. Comparison of Power Outage Restoration Percentages by Storm
100%
90%
80%
Percent Restored Since Peak State Outage
70%
60%
Sandy-CT
50%
Irene-CT
40% Sandy-NJ
Irene-NJ
30%
Sandy-NY
20% Irene-NY
Sandy-PA
10%
Irene-PA
0%
0 1 2 3 4 5 6 7 8 9 10 11 12 13 14
Days Since Peak State Outage
Source: OE/ISER Emergency Situation Reports
Utility Personnel
Utilities deployed internal and external resources to restore power outages caused by
Hurricanes Irene and Sandy. During major outage events, utilities often turn to the power
industry’s mutual assistance network—a voluntary partnership of electric utilities from across the
country. These mutual assistance partnerships utilize resources, skills, personnel, and
equipment to help restore power during an emergency situation. According to the Edison
Electric Institute8, 50,000 mutual assistance workers were involved in the clean-up and power
8
The Edison Electric Institute represents shareholder-owned electric companies in the United States.
12restoration effort following Hurricane Irene.9 By comparison, 67,000 mutual assistance workers
were involved in the restoration effort following Hurricane Sandy.10
Nuclear Power Plants
Reactors at nuclear power plants in the Northeast were affected by Hurricanes Irene and
Sandy. Some reactors were shut as a precaution to protect equipment from the storm; others
were forced to shut down or reduce power output due to damage to plant facilities or
transmission infrastructure serving the plant; and still others were forced to reduce power output
due to reduced power demand caused by widespread utility customer outages. According to
data from the Nuclear Regulatory Commission, two nuclear reactors (totaling 1,470 MWs of
capacity) were shut and six others were operated at reduced capacity due to Hurricane Irene.
Due to Sandy, three nuclear reactors (totaling 2,845 MWs of capacity) were shut and five were
operated at reduced rates.
Table 5 lists the nuclear power reactors affected by Irene and Sandy. Of the nuclear reactors on
the East Coast, three were affected by both storms: Dominion’s Millstone Unit 3 in Connecticut
and Exelon’s Limerick Units 1 and 2 in Pennsylvania, which operated at reduced capacity during
both Irene and Sandy.
Table 5. Nuclear Power Plants Units Affected by Hurricanes Irene and Sandy
Capacity Impact Restoration
Storm Unit State Company Impact
(MW) Start Date Date
Irene Calvert Cliffs 2 MD Constellation 855 Shut 8/27/11 9/3/11
Oyster Creek NJ Exelon 615 Shut 8/27/11 8/31/11
Millstone 2 CT Dominion 869 Reduced 8/28/11 8/30/11
Millstone 3 CT Dominion 1,233 Reduced 8/28/11 8/31/11
Brunswick 1 NC Progress Energy 938 Reduced 8/27/11 8/29/11
Brunswick 2 NC Progress Energy 920 Reduced 8/27/11 8/30/11
Limerick 1 PA Exelon 1,130 Reduced 8/28/11 8/30/11
Limerick 2 PA Exelon 1,134 Reduced 8/28/11 8/30/11
Sandy Salem 1 NJ PSEG 1,175 Shut 10/30/12 11/5/12
Indian Point 3 NY Entergy 1,040 Shut 10/30/12 11/3/12
Nine Mile 1 NY Constellation 630 Shut 10/29/12 11/10/12
Millstone 3 CT Dominion 1,233 Reduced 10/29/12 11/2/12
Limerick 1 PA Exelon 1,130 Reduced 10/30/12 10/31/12
Limerick 2 PA Exelon 1,134 Reduced 10/30/12 11/2/12
Susquehanna 2 PA PPL 1,190 Reduced 10/30/12 11/5/12
Vermont Yankee VT Entergy 620 Reduced 10/30/12 10/31/12
Source: Nuclear Regulatory Commission
9
―Understanding the Electric Power Industry’s Mutual Assistance Network.‖ Edison Electric Institute.
10
―Multimedia Gallery Of Restoration Efforts - Superstorm Sandy.‖ Edison Electric Institute.
http://www.eei.org/ourissues/ElectricityTransmission/Reliability/Pages/MultimediaGallery-Sandy.aspx
13Petroleum Impacts
Hurricanes Irene and Sandy disrupted petroleum supply networks in the Northeast due to direct
effects from the storms (flooding, wind, etc.) as well as power interruptions caused by the
storms. In particular, the hurricanes disrupted activity in the New York Harbor area—a major
distribution hub for petroleum delivery to consumer markets in New York, New Jersey,
Pennsylvania, and New England. The terminals in the New York Harbor area, which have a
combined storage capacity of about 70 million barrels, receive product via pipeline from
refineries on the U.S. Gulf Coast, the Philadelphia area, and the two refineries located in
northern New Jersey − Phillips 66 Bayway (238,000 barrels per day) and Hess Port Reading
(70,000 barrels per day). The terminals also receive product via tanker and barge, much of it
imported from outside the United States. In addition, products from the terminals are
redistributed by barge mainly to distribution terminals throughout the New York Harbor area, up
the Hudson River as far as Albany, and into New England. Product moves via the Buckeye
pipeline to Brooklyn/Queens terminals, all regional airports, and upstate New York and
Pennsylvania. These distribution terminals supply gasoline, heating oil, and diesel fuel to trucks
for delivery to retail outlets and local distributors.11
Refineries
Several Northeast refineries were affected by flooding, wind, and other impacts brought by
Hurricanes Irene and Sandy. Area refineries were also affected by power outages and logistical
issues caused by the closure of crude oil and petroleum product transportation and distribution
systems in the wake of the storms. Hurricane Irene shut one refinery and caused reductions at
five others in the Northeast, while Hurricane Sandy shut two refineries and caused reductions at
four others. The Phillips 66 Bayway refinery in Linden, New Jersey, which is the second largest
refinery in the Northeast, was shut as a precaution prior to both storms. Following Hurricane
Sandy, the Bayway refinery lost power, sustained flooding in low-lying areas of the plant, and
remained offline for several weeks as operators conducted repairs and maintenance.12 Table 6
lists the refineries impacted by Hurricanes Irene and Sandy.
11
―New York/New Jersey Intra Harbor Petroleum Supplies Following Hurricane Sandy: Summary of Impacts Through
November 13, 2012.‖ November 2012. Energy Information Administration.
http://www.eia.gov/special/disruptions/hurricane/sandy/pdf/petroleum_terminal_survey.pdf
12
Hurricane Sandy Situation Report # 5. October 30, 2012 (3:00 PM EDT). DOE/OE ISER.
http://energy.gov/sites/prod/files/2012_SitRep5_Sandy_10302012_300PM.pdf
14Table 6. Refineries Affected by Hurricanes Irene and Sandy
Capacity Impact Restoration
Storm Refinery State Company A Impact
(b/d) Start Date Date
Irene B Reduced 8/27/11
Linden NJ ConocoPhillips 238,000 9/1/11
Shut 8/28/11
Paulsboro NJ PBF 160,000 Reduced 8/27/11 8/29/11
C
Trainer PA ConocoPhillips 185,000 Reduced 8/27/11 8/31/11
D
Philadelphia PA Sunoco 335,000 Reduced 8/29/11 9/2/11
E
Marcus Hook PA Sunoco 178,000 Reduced 8/29/11 8/29/11
Delaware City DE PBF 182,000 Reduced 8/29/11 8/29/11
Sandy Linden NJ Phillips 66 238,000 Shut 10/29/12 11/27/12
Port Reading NJ Hess 70,000 Shut 10/29/12 11/21/12
Paulsboro NJ PBF 160,000 Reduced 10/29/12 11/1/12
Trainer PA Monroe Energy 185,000 Reduced 10/29/12 10/31/12
Philadelphia
Philadelphia PA Energy 335,000 Reduced 10/29/12 11/7/12
Solutions
Delaware City DE PBF 182,000 Reduced 10/29/12 11/1/12
A
Barrels per day – B Now Phillips 66 – C Now Monroe Energy – D Now Philadelphia Energy Solutions – E Idled December 2011
Sources: OE/ISER Emergency Situation Reports, Energy Assurance Daily
Refining activity is tracked by EIA at the regional level. Figure 7 compares weekly gross inputs
of crude oil, unfinished oils, and natural gas plant liquids into atmospheric crude distillation units
at East Coast refineries (in Petroleum Administration for Defense District 1, or PADD 1) in the
weeks leading up to and following Hurricanes Irene and Sandy.13 In the week after Hurricane
Irene made landfall, gross inputs into East Coast refineries fell by 416,000 b/d, or 31 percent,
from the week prior to landfall. In the second and third weeks after landfall, refining activity
largely recovered, although not to pre-storm levels.
Hurricane Sandy disrupted East Coast refining activity for a longer period of time than Irene. In
the week after Hurricane Sandy made landfall, gross inputs into East Coast refineries fell
290,000 b/d, or 28 percent, from the week prior to the storm.14 Refineries that had reduced rates
due to Sandy ramped inputs back up to normal rates in the following weeks but refining activity
on the East Coast remained depressed due to the extended outage at Phillips 66’s 238,000 b/d
refinery in Linden, New Jersey. Refining activity did not return to pre-storm levels until a month
after Sandy’s landfall, when the Phillips refinery restarted and returned to normal rates.
13
The gross inputs presented in Figure 7 do not include inputs into Hess’s 70,000 b/d Port Reading, NJ refinery as
this facility does not have a crude distillation unit.
14
The overall lower crude runs in 2012 versus 2011 during this period is largely the result of the closure of the
Sunoco refinery in Marcus Hook, PA and pre-storm reduced rates at Monroe Energy’s refinery in Trainer, PA, which
started up in September 2012. These closures were somewhat offset by the restart of the PBF Delaware City, DE
refinery following PBF’s purchase from Valero.
15Figure 7. Weekly Gross Inputs* into East Coast (PADD 1) Refineries
Linden, NJ Resumes
Normal Rates
1,600 Landfall 9/1/11
Irene: 8/26/11
Sandy: 10/29/12 Delaware River Refineries
1,400 Resume Normal Rates
8/29-9/1/11
1,200
Thousand Barrels per Day
1,000
800
Philadelphia , PA Linden, NJ Resumes
600 Resumes Normal Rates
Normal Rates 11/27/12
11/7/12
400
Paulsboro, NJ
Irene (2011)
Trainer, PA
200 Delware City, DE
Resume Normal Rates Sandy (2012)
10/31-11/1/12
-
2011 8/19 8/26 9/2 9/9 9/16 9/23 9/30 10/7
2012 10/19 10/26 11/2 11/9 11/16 11/23 11/30 12/7
Week Ending Date
*Gross Inputs: The crude oil, unfinished oils, and natural gas plant liquids put into atmospheric crude oil distillation
units. (This does not include inputs into Hess’s Port Reading, NJ refinery.)
Sources: EIA, OE/ISER Emergency Situation Reports
Transportation & Supply
In addition to affecting refinery production, Hurricanes Irene and Sandy also disrupted
petroleum transportation and distribution assets—terminals, pipelines, and ports—that serve the
Northeast.
Terminals
Hurricanes Irene and Sandy impacted many East Coast petroleum terminals. No
comprehensive survey tracks the operational status of petroleum terminals and many
companies do not publically report operations. Information compiled from company statements,
trade press, and other media sources and published by OE/ISER in Emergency Situation
Reports indicate that at least 25 terminals were partially or completely closed following
Hurricane Irene, as compared with at least 57 terminals that partially or completely closed
following Hurricane Sandy.
A survey of New York Harbor terminal operators conducted by EIA in the aftermath of Hurricane
Sandy found that petroleum product flows remained significantly disrupted more than 9 days
after the storm made landfall. The survey found that product receipts (inflows) of petroleum
16products (gasoline, diesel, jet fuel, and ethanol) at petroleum terminals had been reduced to 65
percent of pre-storm levels during the week of November 7–13, 2012. The survey found that
product deliveries (outflows) from petroleum terminals had been reduced to 61 percent of pre-
storm levels over the same time period. By product type, outflows of gasoline had recovered the
most, with deliveries returning to 72 percent of pre-storm levels; diesel deliveries had recovered
to 55 percent; and other (jet fuel, ethanol) deliveries had recovered to just 20 percent.15 No
comparable data were collected in the aftermath of Hurricane Irene.
Pipelines
Power outages and flooding at pipeline facilities and petroleum product terminals along the East
Coast—particularly in the New York Harbor area—forced pipelines supplying the Northeast to
shut segments or operate at reduced capacity in the wake of Hurricanes Irene and Sandy. Table
7 lists the pipelines affected by each storm. Irene shut segments of three petroleum product
pipelines and one crude oil pipeline.
Sandy shut segments of three product pipelines. Both storms affected portions of the Buckeye
Pipeline—a major interstate product pipeline that originates in New York Harbor and is the
major supplier of fuel products to both the New York City metropolitan area as well as upstate
New York and portions of Pennsylvania. Colonial Pipeline—a major interstate pipeline that
supplies the East Coast with petroleum products from refineries on the U.S. Gulf Coast—
experienced flooding and the loss of power at its facility in Linden, New Jersey during Hurricane
Sandy. The Linden facility is the terminus of the Colonial Pipeline and the outage of this facility
caused Colonial to shut down the segment of its mainline system serving markets in
Philadelphia, New Jersey, and the New York Harbor.16 Colonial Pipeline brought in portable
generators to power the Linden facility and restored normal flows on the line following an outage
of roughly 5 days.
Table 7. Petroleum Pipelines Affected by Hurricanes Irene and Sandy
Capacity Impact Restoration
Storm Pipeline Type A Impact
(b/d) Start Date Date
Buckeye Product 900,000 Segments Shut 8/26/11 8/30/11
Irene Plantation Product 600,000 Segments Shut 8/27/11 8/29/11
Portland Crude 410,000 Segments Shut 8/28/11 9/1/11
TEPPCO
Product 330,000 Segments Shut 8/27/11 8/30/11
(Enterprise)
Sandy Buckeye Product 900,000 Segments Shut 10/29/12 11/3/12
Colonial Product 2,400,000 Segments Shut 10/29/12 11/2/12
Plantation Product 600,000 Segments Shut 10/30/12 10/31/12
A
Barrels per day, total system capacity
Source: OE/ISER Emergency Situation Reports
15
―New York/New Jersey Intra Harbor Petroleum Supplies Following Hurricane Sandy: Summary of Impacts Through
November 13, 2012.‖ November 2012. Energy Information Administration.
http://www.eia.gov/special/disruptions/hurricane/sandy/pdf/petroleum_terminal_survey.pdf
16
Hurricane Sandy Emergency Situation Report #4. October 30, 2012 (10:00 AM EDT). DOE/OE ISER.
http://www.oe.netl.doe.gov/docs/2012_SitRep4_Sandy_10302012_1000AM.pdf
17Ports
The U.S. Coast Guard shut ports along the Eastern Seaboard from the Mid-Atlantic to New
England in advance of both Hurricanes Irene and Sandy. Most of these ports re-opened 1 to 3
days later, after inspections and clean-up operations had been conducted. Following Sandy, a
diesel spill from a damaged tank at a Motiva Enterprises’ terminal in Sewaren, New Jersey,
along with substantial storm debris in the waterway, kept the vessel traffic closed or heavily
restricted on the Arthur Kill and surrounding waterways in New York Harbor for more than a
week after the storm had passed. This closure affected barge and vessel traffic at several
petroleum terminals in New Jersey and New York.
Table 8 lists the East Coast port sectors from North Carolina to Maine, the approximate
petroleum imports registered at ports in each sector in 2011, and the shut-down and re-start
dates for each sector in 2011 and 2012.17 For a map of U.S. Coast Guard port sectors, see
Appendix 2.
Table 8. East Coast Port Sectors Affected by Hurricanes Irene and Sandy
2011 Imports (b/d)* Irene Sandy
Port Sector
Crude Oil Products Total Shut Opened Shut Opened
North Carolina - 19,973 19,973 8/26/11 8/29/11 N/A N/A
Hampton Roads - 17,008 17,008 8/26/11 8/29/11 10/29/12 10/30/12
Baltimore - 19,425 19,425 8/27/11 8/29/11 10/29/12 10/30/12
Delaware Bay 737,534 81,715 819,249 8/27/11 8/29/11 10/29/12 10/31/12
New York 248,233 505,145 753,378 8/27/11 8/28/11 10/29/12 11/1/12**
Long Island Sound - 47,707 47,707 8/27/11 8/31/11 10/29/12 10/31/12
S.E. New England - 57,082 57,082 8/27/11 8/31/11 10/29/12 10/31/12
Boston - 154,216 154,216 8/27/11 8/31/11 10/29/12 10/30/12
N. New England - 119,764 119,764 N/A N/A N/A N/A
Grand Total 985,767 1,022,035 2,007,802
*Barrels per day. The volumes include only international imports.
**On November 1, 2012 the Port of New York reopened to all vessels. Due to an oil spill, traffic on the Arthur Kill and
Kill Van Kull remained closed or restricted until November 7.
Sources: OE/ISER Emergency Situation Reports, EIA
Imports
Hurricanes Irene and Sandy disrupted imports of petroleum products and crude oil into the
Northeast due to the closure of port infrastructure was forced shut by from water and wind
impacts, the inability of many terminals to receive cargoes, and outages and reductions at crude
oil refineries. Figure 8 shows petroleum product and crude oil imports into the East Coast
(PADD 1) in the weeks before and after Hurricanes Irene and Sandy made landfall. The data in
Figure 8 show product imports into the East Coast following Irene fell by 264,000 b/d, or 23
percent, from the week before the storm. Following Sandy, East Coast product imports fell by
roughly 668,000 b/d, or 62 percent, from the prior week. Figure 8 indicates that petroleum
17
Drawn from the latest annual data available from EIA at the time of this report.
18product imports began to return to pre-storm levels in the second week after the storms made
landfall.18
Figure 8. Weekly Petroleum Imports to the East Coast (PADD 1)
Irene (2011)
1.5
Imports of Petroleum Products into East Coast (MMb/d)*
1.0
0.5
0.0
8/19 8/26 9/2 9/9 9/16 9/23 9/30 10/7
Landfall (8/27)
Products Crude
Sandy (2012)
1.5
1.0
0.5
0.0
10/19 10/26 11/2 11/09 11/16 11/23 11/30 12/7
Landfall (10/29) Week Ending Date
*MMb/d = million barrels per day
Source: EIA
Crude imports were also affected in weeks following Irene and Sandy. In the week Irene made
landfall, crude oil imports into the East Coast fell by 769,000 b/d, or 48 percent, from the
previous week. By contrast, crude oil imports increased by 198,000 b/d, or 19 percent, in the
week that Sandy made landfall. This increase may have been due to shipments that were en
route to the East Coast in the week prior to landfall having to wait to come into port until Sandy
had passed. In the next 2 weeks after Sandy’s landfall, imports fell to as low as 500,000 b/d, or
about half of their pre-storm levels, in part due to the extended shutdown of the Phillips 66
refinery in Linden, New Jersey.
Prices & Stocks
Hurricanes Irene and Sandy disrupted the petroleum supply chain, impacting petroleum product
stocks and prices in the Northeast. Figure 9 summarizes the daily spot prices for conventional
gasoline and ultra-low sulfur diesel (ULSD) traded in New York Harbor (NYH), as well as weekly
18
The weekly data presented in Figure 8 are aggregated at the regional level and may mask port-specific impacts.
For instance, product shipments into New York Harbor remained reduced 1 week after Sandy’s landfall, but increased
shipments to other East Coast ports may have offset this in the regional data.
19retail prices for reformulated gasoline in New York Harbor and ULSD in the Mid-Atlantic region
(PADD 1B), in the weeks leading up to and following the two storms. West Texas Intermediate
and Brent crude spot prices were not affected by Irene and Sandy and therefore are not shown
in Figure 9. A detailed analysis of gasoline and distillate stocks and prices appears later in this
report.
Figure 9. Selected Daily Wholesale and Weekly Retail Petroleum Product Prices
NYH Wholesale Conventional Gasoline NYH Wholesale Ultra-Low Sulfur Diesel
NYH Retail Reformulated Gasoline (Regular) PADD 1B Retail Ultra-Low Sulfur Diesel
Irene Landfall
$4.25
$4.00
$3.75
$3.50
$3.25
$3.00
$2.75
Price ($/gallon)
$2.50
2011 8/20 8/27 9/3 9/10 9/17 9/24 10/1 10/8
$4.25 Sandy Landfall
$4.00
$3.75
$3.50
$3.25
$3.00
$2.75
$2.50
10/22 10/29 11/5 11/12 11/19 11/26 12/3 12/10
2012
Source: EIA
Gasoline
Disruptions to refineries and petroleum transportation infrastructure caused by Hurricanes Irene
and Sandy forced regional gasoline distributors to draw down gasoline stocks and led to
temporary increases in spot gasoline price differentials. Figure 10 plots the change in week-
ending (Friday) stocks of conventional gasoline in the Northeast—a combination of the New
England (PADD 1A) and Mid-Atlantic (PADD 1B) regions—against the difference between the
week-ending (Friday) spot gasoline price in New York Harbor and the week-ending spot
gasoline price in the Gulf Coast for the weeks leading up to and following Hurricanes Irene and
Sandy.
The New York Harbor/U.S. Gulf Coast (NYH/USGC) gasoline price differential measures the
difference in the price of gasoline in the two regions. Because the Northeast receives gasoline
20shipments by pipeline from the Gulf Coast, the price of gasoline in New York Harbor is typically
higher than the price of gasoline in the Gulf Coast due to the added transportation costs. An
increase in the NYH/USGC differential may indicate that regional factors—such as storm-related
supply disruptions—could have increased the New York Harbor gasoline price relative to the
price in the Gulf Coast.
Figure 10. New York Harbor Gasoline Stock Changes and Spot Price Differentials
50 2011 3
2
25
1
0 0
8/26 9/2 9/9 9/16 9/23 9/30 10/7
Price Difference (Cents/Gallon)
Stock Change (Million Barrels)
(1)
(25)
(2)
Irene
Landfall 8/27 Northeast Conventional Gasoline Stock Change
(50) (3)
NY Harbor/Gulf Coast Gasoline Price Differential
50 2012 3
2
25
1
0 0
10/26 11/02 11/09 11/16 11/23 11/30 12/07
(1)
(25)
(2)
Sandy
(50) Landfall 10/29 Week -Ending Date (3)
Source: EIA
Figure 10 indicates that Northeast gasoline stocks experienced a large 1-week draw down
following Hurricane Irene. The day before Irene made landfall, gasoline stocks in the Northeast
stood at 29.9 million barrels. By September 2, 2011—6 days after the storm made landfall—the
region’s gasoline stocks had fallen by 2 million barrels, or roughly 7 percent, from pre-storm
levels. The draw down following Irene was short-lived; by September 9—13 days after landfall—
Northeast gasoline stocks had recovered to surpass pre-storm levels.
Regional gasoline prices also experienced a temporary increase in the weeks following Irene’s
landfall. By September 2, the NYH/USGC conventional gasoline price differential had increased
by 17 cents from a week earlier—from negative 9 cents per gallon (indicating a surplus gasoline
situation in New York Harbor) to positive 8 cents per gallon (indicating a shift to much tighter
supply in New York Harbor). In the following weeks, New York Harbor gasoline remained at a
premium to the Gulf Coast despite the recovery in the Northeast gasoline stocks. However, as
21previously noted, New York Harbor gasoline prices typically exhibit a small premium to Gulf
Coast gasoline prices under normal market conditions.
The impact to Northeast gasoline stocks and prices from Hurricane Sandy was slower to
develop but larger and longer-lasting than the impact from Irene. On October 26, 2012—3 days
before Sandy made landfall—Northeast gasoline stocks stood at 26.8 million barrels, or roughly
10 percent below where they stood prior to Irene. Over the next 2 weeks, Northeast stocks fell
by 2.2 million barrels, or roughly 8 percent, from pre-storm levels. Stocks began to build again in
the third week after landfall but did not return to pre-storm levels until November 30, the fifth
week after landfall.
Although slower to develop, the temporary increase in the NYH/USGC gasoline price differential
was larger following Hurricane Sandy than Hurricane Irene. By November 2—4 days after
Sandy made landfall—the differential fell 2 cents from the previous week. This may have been
due to lower demand as drivers stayed off the road while recovery efforts continued, and as
many stores and business remained closed. A week later, drivers had returned to the roads but
the petroleum supply chain remained disrupted. As a result, the New York Harbor premium
more than doubled from 18 cents per gallon on November 2, to 46 cents per gallon on
November 9, an increase of 28 cents. In the following weeks, the New York Harbor premium fell
from its peak but remained higher than before the storm.
Distillate
Disruptions to petroleum supply infrastructure by Hurricanes Irene and Sandy also affected the
distillate fuel oil market. Figure 11 plots the weekly change in stocks of distillate fuel oil in the
Northeast against the difference between the spot ULSD price in New York Harbor and the spot
ULSD price in the U.S. Gulf Coast (the NYH/USGC differential) for the weeks leading up to and
following Hurricane Irene and Sandy. Note that ULSD, the fuel used for the price analysis,
represents only a portion of total distillate stocks in the Northeast, although ULSD prices and
other distillate fuel oil prices typically closely follow one another.19
19
ULSD represented 28 percent of total Northeast distillate fuel oil stocks in the week prior to Irene and 35 percent
prior to Sandy.
22Figure 11. New York Harbor Distillate Stock Changes and ULSD Spot Price Differentials
25 2011 3
15 2
1
5
0
(5) 8/26 9/2 9/9 9/16 9/23 9/30 10/7
(1)
Price Difference (Cents/Gallon)
Stock Changes (Million Barrels)
(15) (2)
Irene
(25) Landfall (3)
(8/27)
Northeast Distillate Fuel Oil Stock Change
NY Harbor/Gulf Coast ULSD Price Differential
25 2012 3
15 2
1
5
0
(5) 10/26 11/02 11/09 11/16 11/23 11/30 12/07
(1)
(15) (2)
Sandy
Landfall
(25) (10/29) Week-Ending Date (3)
Source: EIA
Hurricane Irene had a modest impact on Northeast distillate markets. Prior to Irene, Northeast
distillate fuel oil stocks stood at 48.4 million barrels. In the weeks after Irene made landfall,
stocks fell by 1.1 million barrels, or about 4 percent, leading to a 6-cent increase in the week-
ending NYH/USGC ULSD spot price differential, from 2 cents per gallon on August 26, 2011 to
8 cents per gallon on September 9.
Hurricane Sandy (and the Nor’easter that followed), on the other hand, had a larger impact on
Northeast distillate markets than Irene. Prior to Sandy, Northeast distillate fuel oil stocks stood
at 28.6 million barrels, more than 40 percent below where they stood prior to Irene. In the weeks
following Sandy, distillate stocks fell by a total of 2.8 million barrels, or 10 percent, from pre-
storm levels. This large draw down in stocks was likely due to both supply disruptions caused by
Hurricane Sandy as well high demand for heating oil due to cold weather in the Northeast,
including the effects of the Nor’easter in early-to-mid November. In the weeks after Sandy made
landfall, the week-ending NYH/USGC price differential more than doubled from 10 cents per
gallon on October 26, 2012 to 23 cents per gallon on November 16.
23You can also read