The Municipal Liquidity Facility - Federal Reserve Bank of ...
←
→
Page content transcription
If your browser does not render page correctly, please read the page content below
NO. 985
                 The Municipal
SEPTEMBER 2021
                 Liquidity Facility
                 Andrew Haughwout | Ben Hyman | Or Shachar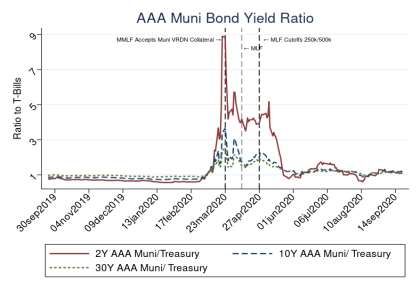
The Municipal Liquidity Facility
Andrew Haughwout, Ben Hyman, and Or Shachar
Federal Reserve Bank of New York Staff Reports, no. 985
September 2021
JEL classification: G14, G18, H74

                                                  Abstract

At the onset of the COVID-19 pandemic, state and local governments were among the sectors expected to
experience the most severe distress. The combination of a sharply deteriorating revenue picture, a
pressing need for additional expenditures, delays in the receipt of substantial taxes owed, and an inability
to access the financial markets raised serious concerns among many observers about the ability of state
and local governments to meet their public service delivery responsibilities. In April 2020, the Federal
Reserve announced the establishment of the Municipal Liquidity Facility (MLF) to help municipalities
manage the cash flow challenges that the pandemic produced. The MLF ultimately offered three-year
loans at penalty rates to a set of eligible municipal issuers that included states, large cities and counties,
and a number of revenue bond issuers. Research suggests that the MLF, in spite of lending to only the
State of Illinois and the Metropolitan Transportation Authority, contributed to a healing in the municipal
securities market as a whole. Effects on real economic outcomes like employment in the sector are harder
to attribute to facility.

Key words: municipal debt, state and local governments, COVID-19, Federal Reserve lending facilities

_________________

Haughwout, Hyman, Shachar: Federal Reserve Bank of New York (emails:
andrew.haughwout@ny.frb.org, ben.hyman@ny.frb.org, or.shachar@ny.frb.org). This paper was
prepared for an upcoming issue of the Economic Policy Review and a related New York Fed conference,
“Implications of Federal Reserve Actions in Response to the COVID-19 Pandemic.” The authors are
grateful for comments from the editor, an anonymous referee, Won Chai, Anna Kovner, Timothy Little,
Byron Lutz, Susan McLaughlin, and Jennifer Wolgemuth.

This paper presents preliminary findings and is being distributed to economists and other interested
readers solely to stimulate discussion and elicit comments. The views expressed in this paper are those of
the author(s) and do not necessarily reflect the position of the Federal Reserve Bank of New York or the
Federal Reserve System. Any errors or omissions are the responsibility of the author(s).

To view the authors’ disclosure statements, visit
https://www.newyorkfed.org/research/staff_reports/sr985.html.
At the onset of the COVID-19 pandemic, state and local governments were among the
sectors expected to experience the most severe distress. These governments’ dependence on
revenue streams that were either rapidly declining or delayed, along with severe dislocations in
municipal debt markets, created a “perfect storm” of developments that threatened their ability to
function effectively when they were most needed. Many analysts predicted a state and local
fiscal crisis that could be unprecedented in speed, severity, and scope.

       In the spring of 2020, the Federal Reserve System, in collaboration with the U.S.
Treasury, established for the first time a program under which it offered short-term funding to
states, localities, and other municipal entities. In this article, we discuss the basic economics of
state and local governments and the ways they use debt. We then turn to the motivation for the
Municipal Liquidity Facility (MLF), as it was called, while the COVID-19 pandemic was
causing severe disruptions in the municipal bond market. We provide details on how the MLF
was set up, how it operated, and what is known about the effects it had on the sector and the
economy.

1. Background

1.1 State and Local Government Finances

       The state and local government sector is a unique but economically very important part of
the U.S. economy. In calendar year 2019, the last full year prior to the pandemic, state and local
government consumption and gross investment totaled $2.3 trillion in the National Income and
Product Accounts. This amount represented 10.9 percent of GDP in that year, a figure that had
been above 10 percent since the mid-1960s. At the end of 2019, the sector employed nearly 20
million workers, ranging from police officers to state governors.

                                                                                                       1
State and local governments, unlike the federal government, are primarily in the business
of direct service provision.1 Public safety, education, transportation, and sanitation are just a few
of the services where these governments play an important role. One additional area, especially
important in a pandemic, is health care. Maintaining these services in periods of economic and
fiscal stress is a challenge, particularly because the sector is also unique in its financing. State
and local governments are generally required by their constitutions or by statute to balance their
operating budgets—in other words, they are not allowed to spend more than they collect in
revenue. These balanced budget requirements (BBRs) are intended to help control spending and
reduce intertemporal burden shifting. Therefore, state and local governments primarily issue
long-term debt in order to finance long-lived infrastructure investments like bridges, sewers, and
schools. Thus, while there is a very large market in long-term municipal bonds, those bonds are
usually sold to finance capital projects and not to spread the costs of economic downturns or
fiscal stress.2
BBRs, however, can have some unintended effects in aggregate. In particular, they tend
to induce some pro-cyclicality in the behavior of the sector as a whole. Generally speaking, as
the economy contracts, state and local government tax bases decline as well, leading to pressure
for reductions in (expected or realized) tax and fee revenues. BBRs force public officials to make
difficult choices to increase tax rates—further reducing private disposable income—or to cut
spending. In addition to the human toll caused by reduced incomes and/or employment, and the
likely deterioration in the core public services produced by the sector, these actions put further
downward pressure on economic activity, just as the economy is weakening.
The structure of state and local government budget processes does tend to build some
lags into these responses: Subnational governments’ fiscal years typically begin in July and end
in June, and unanticipated changes in the economy after budgets are adopted may not produce
immediate changes in spending or taxes. In addition, much of the sector’s revenue (and direct
1
For the purposes of this article, we will use broad terms like “state and local government sector,” “state and local
governments,” “municipal issuers,” and “municipalities” to refer to the vast array of subnational governmental
entities in the United States, including states, cities, counties, transit agencies, and school districts, among others.
2
This is not to say that such bonds can never be used to help fund current operations. For example, bonding
against tobacco settlement payments or pension obligation bonds can be used as means to reduce near-term
budget pressures. See Calabrese and Ely (2013) and Johnson (2004). State and localities can also use rainy day
funds and accounting maneuvers of various sorts to smooth their spending through recessions.
2spending) is at the local level, where dependence on property taxes is high. Since assessed
property values are less strongly correlated with overall activity than sales and income are—sales
and income being states’ primary tax bases—local budgetary pressures tend to lag even further,
becoming apparent when assessed property values fall and/or when state aid (a crucial part of
local budgets) is cut.
These features of the sector were apparent in the 2007-09 recession. In the roughly two
years between the second quarter of 2005 and the third quarter of 2007, state and local
government activity contributed an average of +7 basis points to aggregate GDP growth. The
economy was expanding for most of this period, and state and local governments were
contributing positively to that growth, albeit slightly. In the early stages of the recession that
began in late 2007, the sector’s growth contributions actually increased—state and local
government activity averaged a contribution of +20 basis points as the economy experienced its
first four quarters of recession. But by late 2008, the sector’s growth contribution turned sharply
negative, and its annual contribution remained negative through 2013. Employment in the sector,
shown in Chart 1, fell sharply beginning in the middle of the recession, and did not recover to its
pre-recession level until the end of 2015. The sector’s slow rebound, then, was part of the
explanation for the slow national recovery from the Great Recession, making the sector’s
resiliency an area of concern for future macroeconomic policy.3
1.2 Municipal Debt
There are two important qualifications to the important role that BBRs play in the state
and local sector. We have already briefly discussed the first: the issuance of long-term municipal
bonds as a mean of financing long-lived infrastructure investments like public buildings, roads,
and water systems. The second is the ability of many municipalities to use short-term notes to
smooth cash flows within a fiscal year. In this section, we will provide an overview of these
markets, as they are important for understanding the purposes and limitations of the MLF.
3
See Bernanke (2020).
3Bonds
The $3.8 trillion municipal bond market contains more than 50,000 issuers and one
million individual bonds, making it approximately half the size of the corporate bond market
with ten times as many issuers. Roughly 90 percent of this market is exempt from federal income
tax, and more than 80 percent is rated investment grade. Consequently, default rates on rated
municipal bonds have historically been very low, although unrated bonds have defaulted more
frequently (Appleson et al. 2012; Moody’s 2020). As of May 2020, 26 percent of outstanding
debt was issued directly by state, city, county, and other local governments, 41 percent by
utilities, service, and transit issuers, 21 percent by school districts, and 8 percent by public
hospitals. Unlike Treasury and corporate bond markets, 70 percent of municipal debt is held by
retail investors seeking tax advantages associated with municipal bond returns, with a third of
that total in mutual funds and exchange-traded funds (see Chart 2). Unlike the corporate sector,
municipal debt is also commonly issued in deals containing many different tenors as independent
bonds, facilitating more predictable budget smoothing but complicating the analysis of the
market.
General obligation (GO) bonds, which constitute approximately 30 percent of the long-
term municipal market, are not secured by a specific revenue source but are instead backed by
the “full faith and credit” of the taxing authority and typically finance capital projects like
bridges and schools. The large remainder of the long-term market (60 percent) is dominated by
revenue bonds (RB), frequently issued by public enterprises and secured by defined revenue
sources (such as transit user fees, airport revenues, and road and bridge tolls).
Notes
Less well known but quite important in general and specifically in the pandemic, state
and local governments also frequently leverage the $440 billion short-term municipal note
market to bridge cash flow gaps within fiscal years. This short-term borrowing can be useful
because states and localities depend on revenues (tax receipts, federal grants, the proceeds of
bond issues, and other revenues) that are received at specific intervals during the fiscal year. But
the timing of spending needs—for example, for payroll—may not be well-matched with the
arrival of receipts, creating a need for a way to smooth spending in anticipation of such receipts.
These governmental entities can do so by issuing tax anticipation notes (TANs), revenue
4anticipation notes (RANs), tax and revenue anticipation notes (TRANs), and bond anticipation
notes (BANs). These notes are typically secured by funds expected to be received later in the
fiscal year and are paid off when the relevant funding is received. Note that issuers typically seek
funding at the same time each year, and market access is critical to maintaining liquidity.
A classic example of a mismatch between the timing of receipts and expenditure needs is
the proceeds from final settlement of state income tax returns. In most states that levy an income
tax, these settlements are due on the federal government’s tax day, typically April 15. For states
like New Jersey, these final settlements are often substantial (New Jerseyans in aggregate owe a
substantial amount of tax on unearned income and capital gains) and many of these proceeds are
received right around the end of the state’s fiscal year, which closes June 30. The value of these
settlements is based on activity that occurred in the previous calendar year, so it is known with a
relatively high degree of confidence. Therefore, New Jersey could issue a TAN in January, with
a maturity of April 30, to enable it to spend part of the expected settlement amount in the interim.
It is important to note that the primary market interest rates at which governments issue
new debt in the municipal market are strongly linked to secondary market yields. This is because
primary market pricing is usually benchmarked to secondary market prices of similar bonds, and
the willingness of dealers to underwrite bonds is affected by market conditions (Boyarchenko
et al. 2020). Price discovery occurs through submissions to exchanges, and is exceptionally low
in this market in part due to the low volume of transacted trades (Green et al. 2010). In an
average expansion year (such as 2019), there are 6,500 trades a day, with a median trade size of
about $30,000, far less frequent and at lower volumes than corporate bonds (Haughwout,
Hyman, and Shachar 2021).
2. State and Local Budgets in the Era of COVID-19
As the cataclysmic economic consequences of the pandemic began to become evident in
the United States during spring and summer of 2020, several concerns directly related to states
and municipalities came to the fore. First, many analysts predicted dire consequences for the
revenues of state and local governments. Disruptions to economic activity threatened virtually all
forms of the sector’s revenues. One analysis (Fiedler and Powell 2020), using data from previous
5downturns, suggested that each year-over-year percentage point increase in the unemployment
rate had historically been associated with a $45 billion deterioration in the fiscal situation of state
and local governments, the vast majority of which consists of revenue declines associated with
reduced economic activity. In April 2020, the unemployment rate stood at 14.7 percent, a
stunning 11.1 percentage points higher than its level a year earlier (and 11.2 percentage points
above its level of two months earlier, in February 2020). This change suggested an annual fiscal
shock of around $500 billion to the sector. Fiedler and Powell (2020) describe several sources of
uncertainty in this estimate, including reasons to have expected the shock to be larger (for
example, noting that business closures may mean that the sales tax elasticity to unemployment
turns out to be larger than usual) or smaller (observing that the increase in unemployment was
unusually concentrated among low-wage workers, thereby reducing the income tax elasticity to
below-normal levels). By mid-summer, it was becoming clear that at least some of the sharp
increase in unemployment was transitory. By July, the rate stood at 10.2 percent, still far above
its year-ago level, but already down 450 basis points from its April peak. Estimates from this
period suggested state fiscal impacts in the neighborhood of $75-$100 billion for fiscal year
2020, and $100-$300 billion for 2021 (Dadayan 2020; McNichol and Leachman 2020; Auerbach
et al. 2020 estimated a fiscal year 2021 effect of $167 billion for state and local governments
combined).4
In addition to the employment rebound, several factors contributed to this improvement
in the outlook for states. Employment losses were concentrated in relatively low-wage jobs, and
incomes of the unemployed were supported by supplemental unemployment compensation
payments, which are typically taxable incomes for states. Both of these factors moderated the
income tax revenue effect of the downturn relative to what might have been expected. In
addition, while consumption fell dramatically in the pandemic’s early days, the largest declines
were in services, while more heavily taxed goods consumption was less affected, helping to
stabilize sales tax revenues.5 A final bright spot in the outlook was property taxes, which are the
primary source of own-source local government revenue and which, buoyed by high home price
4
By mid-autumn, unemployment was down to 6.7 percent and it had become clear that the most dire scenario for
the sector was less likely.
5
Bruce and Fox (2000) point out the relatively heavy taxation of goods versus services in state sales tax systems.
6growth, remained strong into 2021.6 Nonetheless, the state and local sector as a whole had shed
more than 1.3 million jobs very early into the pandemic, primarily in local education, and
concerns for state and local governments remained heightened through much of 2020.7 The fact
that so many jobs were lost in local education just as schools were closing for public health
reasons, along with the slow subsequent recovery in the sector in spite of a brightening fiscal
picture, suggest that a shortage of revenues—or even the expectation of a revenue decline in the
near future—was not the key concern. Rather a lack of demand for bus drivers, cafeteria
workers, and school maintenance staff in a “learn from home” environment may explain the
employment losses in spring 2020.
A second major concern was with the need for states, and especially localities, to increase
spending to mitigate the effects of the COVID-19 pandemic. A survey conducted by the National
Association of Counties found that if the pandemic were to last a year, more than 1,100 counties
expected to spend at least 10 percent of their budgets on fighting the virus, and in aggregate
counties expected nearly $30 billion in additional spending, largely for support of county
hospitals and local health agencies.8
A third area of concern was that the policy decision to move the federal income tax filing
deadline from April 15 to July 15 might create a need for new sources of liquidity for many
states. The change in the filing deadline created a substantial budget shortfall for the many states
that depend on income taxes, but it was one that seemed almost certain to be largely made up in
July 2020, given that the receipts that were due with final settlements were based on activity that
took place in 2019 and so would be virtually unaffected by the pandemic.9 As a consequence,
many observers expected a spike in the demand for short-term financing—TANs—to fund the
cash flow needs of these states and localities (yet where localities do not tax incomes but instead
6
“Own-source” revenues are those collected by the entity in question, as opposed to those transferred from other
governments.
7
Indeed, by the end of fiscal year 2021, thanks to an improving economy and aid under the American Rescue Plan,
many states and localities were proposing spending increases and/or tax cuts. See the Urban Institute’s “How the
COVID-19 Pandemic is Transforming State Budgets,” https://www.urban.org/policy-centers/cross-center-
initiatives/state-and-local-finance-initiative/projects/state-fiscal-pages-covid-edition.
8
“Running on Fumes: Impact of COVID-19 on County Finances,” Issue Brief, National Association of Counties, April
2020. https://www.naco.org/sites/default/files/documents/Impact%20on%20County%20Finances-FINAL-v2.pdf.
The Coronavirus Relief Fund component of the CARES Act was intended to help localities fund these expenditures.
9
Dadayan (2020).
7rely on property taxes, this change would not have a direct impact).10 Given the importance of
final income tax settlements in those states where the income tax is a significant revenue source,
the delay itself was consequential, and it became even more of an issue when combined with the
fourth major concern, the “freezing up” of the municipal market, which we describe next.
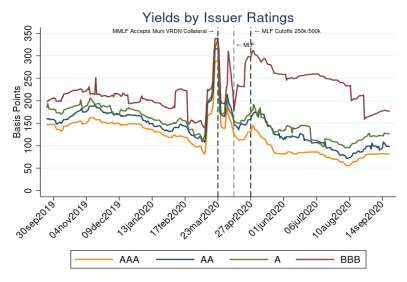
The municipal bond market, like other financial markets, became severely stressed as the
pandemic began to take hold in March 2020. Yields on municipal securities spiked in mid-
March, and issuance dried up almost entirely (see Chart 3). For example, the average yield on a
AAA-rated thirty-year bond rose 180 basis points between March 2 and March 23, and issuance
fell well below its average levels for the prior five years (Cipriani et al. 2020).11 At the moment
when a clear need for short-term liquidity was presenting itself, the market for lending was
drying up. Chart 4 shows this spike, and also the rapid recovery that followed for most but not all
issuers.
An important correlate of the increase in market stresses in the beginning of March was
mutual fund outflows. Open-end mutual funds are the largest institutional investors in municipal
securities, holding about 20 percent of outstanding municipal bonds. Although mutual funds’
municipal holdings are smaller than those of retail investors, the impact of their redemptions on
municipal bond yields was substantial during March 2020. In the first two months of 2020,
mutual funds investing in municipal securities had received inflows totaling $22 billion. This
continued a trend of record inflows experienced throughout 2019, when total inflows were $90
billion. But the direction reversed suddenly in March, resulting in outflows of $43 billion in that
month alone (Cipriani et al. 2020). Li, O’Hara, and Zhou (2021) show that the behavior of issues
held by mutual funds, while similar to that of issues not held by funds before the COVID-19
pandemic, diverges both during and after the crisis. Specifically, the drastic increase in trading
volume during the crisis was entirely driven by the trading of bonds held by mutual funds, and
bonds that suffered larger redemptions experienced larger price deterioration.
10
Alan Cohen and Michael Madowitz, “The Need for Direct Assistance to Local Governments in Response to the
Coronavirus,” Center for American Progress, May 26, 2020.
https://www.americanprogress.org/issues/economy/news/2020/05/26/485396/need-direct-assistance-local-
governments-response-coronavirus/.
11
Cipriani et al. (2020).
8This combination of a sharply deteriorating revenue picture, a pressing need for
additional expenditures, delays in the receipt of substantial taxes owed, and an inability to access
the financial markets was enough to raise serious concerns among many observers about the
ability of state and local governments to continue to meet their public service delivery
responsibilities.
3. The Municipal Liquidity Facility
3.1 Purpose and Size
On April 9, 2020, the Federal Reserve announced the establishment of the MLF to help
state and local governments manage the cash flow challenges that the pandemic produced. MLF
was a direct result of the Coronavirus Aid, Relief, and Economic Security Act (CARES Act),
which, among many other things, directed the U.S. Treasury Department to make loans or
investments in Federal Reserve facilities intended to provide “liquidity to the financial system
that supports lending to eligible business, states or municipalities.”12 Treasury committed to
invest up to $35 billion in the special purpose vehicle that was set up to operate the facility, and
initially funded $17.5 billion, thus sharing any credit risk with the Federal Reserve.13 Treasury’s
investment was drawn from the Exchange Stabilization Fund.
The facility was announced as having a $500 billion lending limit, a figure that far
exceeded the typical issuance in the market for short-term municipal notes, which had been less
than $100 billion in 2019. There were indeed unusually severe strains on liquidity in the sector,
as discussed in Section 2 above, and estimates of the demand for short-term lending were quite
uncertain, so the figure was intended to be large enough to send an important signal to the
market. As Kent Hiteshew, who served as Deputy Associate Director for Financial Stability at
the Federal Reserve Board and was instrumental in the creation and implementation of the MLF,
12
See Section 4003 of the CARES Act. https://www.congress.gov/bill/116th-congress/house-bill/748.
13
The MLF was one component of a very broad suite of programs intended to respond to the pandemic’s effects
on the economy; some of those programs also provided aid to state and local governments. For example, the
CARES Act also established a Coronavirus Relief Fund that provided direct grants to states and large localities. The
breadth of these programs increases the challenge of isolating the effect of the MLF, as we will discuss below.
9stated subsequently, “Rather than an attempt at measuring actual loan demand, the $500 billion
MLF sizing was based more on the goal of making sure the market understood that the Fed and
Treasury were fully committed to using all of our resources to support stabilization and then
restore normalization of the municipal market.”14 Indeed, the $500 billion facility size was
approximately equal to 20 percent of the “own source general and utility revenue” (OSGUR) of
all state and local governments in 2017. The closing date for the facility—the date after which it
would cease purchasing notes—was set at December 31, 2020.
The initial MLF term sheet accompanying the announcement on April 9 was ultimately
amended, as shown in Exhibit 1, which provides a detailed timeline of MLF developments.
Nonetheless, these subsequent changes to the eligibility and terms of the MLF left its purpose
and this $500 billion overall size unchanged.
3.2 Eligible Issuers, Notes, and Borrowing Limits
The April 9 announcement defined “eligible issuers” as all fifty states, the District of
Columbia, cities with a population exceeding one million, and counties with populations
exceeding two million. Population figures were taken from the U.S. Census Bureau’s most recent
complete data: 2018 for cities and 2019 for counties.
Limiting eligibility in this way was intended to ensure that the facility would not face an
unmanageable number of counterparties. If even a relatively small portion of the municipal bond
market’s 50,000 issuers had sought funding from the MLF, the facility would have faced
significant administrative challenges, as noted by Hiteshew in his September 20, 2020,
Congressional Oversight Commission testimony. In addition, the initial language of the term
sheet suggested that eligible issuers might use their borrowing as a mean of supporting their
“political subdivisions and instrumentalities,” suggesting the potential that MLF funding could
be “downstreamed” to cities, towns, and authorities, including those that were not directly
eligible for the facility. The idea was that states, which have significant experience allocating
funding to their subdivisions, in particular might act like a clearinghouse for the provision of
14
Joseph Mysak, Jr., “For Hiteshew, Fed Muni Backstop Sent Crucial Message,” Bloomberg, April 14, 2021.
https://www.bloomberg.com/news/articles/2021-04-14/for-hiteshew-fed-muni-backstop-sent-crucial-message-
joe-mysak.
10liquidity from the Federal Reserve to where it was needed most.15 Even if states were unable or
unwilling to provide liquidity to their smaller municipalities, the provision of liquidity directly to
some of the largest issuers in the market (states and the largest sub-state general purpose
governments, which are responsible for the vast majority of trades in the market), combined with
the facility’s large size, was thought to help ensure that the market would open for all issuers.16
Nonetheless, the relatively small number of issuers eligible under the initial
announcement drew criticism on a variety of grounds.17 On April 27, the Federal Reserve
released a revised term sheet expanding eligibility to cities with population above 250,000 and
counties over 500,000 as well as certain “multi-state entities,” such as the Port Authority of New
York and New Jersey.18 This change constituted a fairly major expansion of eligibility but still
left several states in which the state government was the sole eligible borrower. On June 3,
facility eligibility was expanded further to include at least two cities or counties in each state, as
well as up to two additional municipal issuers “whose revenues are generally derived from
operating government activities,” a reference to transit systems, airports, and other utilities.19 The
later expansions of eligibility opened the door to additional issuers, and specific language was
added to the term sheet to ensure that the issuers held an investment-grade rating as of April 8,
2020. This date allowed for the possibility that “fallen angel” issuers, whose ratings were
reduced as a consequence of the pandemic, could access the facility.
The maximum maturity for eligible notes in the original announcement was twenty-four
months from date of issuance to the facility; this maximum was extended on April 27 to thirty-
15
Over a quarter of local government revenue in fiscal year 2017 was intergovernmental aid from state
governments. This “downstream” funding is also similar in spirit to the support a “proactive” state will give to a
financially distressed municipality under its jurisdiction (Gao, Lee, and Murphy 2019). Other states, however, allow
unconditional access to Chapter 9 bankruptcy procedure, preferring to leave the municipalities to manage their
own affairs in a period of fiscal stress.
16
Testimony of Kent Hiteshew before the Congressional Oversight Commission, September 17, 2020.
https://coc.senate.gov/municipal-liquidity-facility, at 59:30.
17
See, for example, Aaron Klein and Camille Busette, “Improving the Equity Impact of the Fed’s Municipal Lending
Facility,” Brookings Institution report, April 14, 2020. https://www.brookings.edu/research/a-chance-to-improve-
the-equity-impact-of-the-feds-municipal-lending-facility.
18
“Federal Reserve Board Announces an Expansion of the Scope and Duration of the Municipal Liquidity Facility,”
Federal Reserve Board press release, April 27, 2020.
https://www.federalreserve.gov/newsevents/pressreleases/monetary20200427a.htm. Last accessed June 25,
2021.
19
“Federal Reserve Board Announces an Expansion in the Number and Type of Entities Eligible to Directly Use its
Municipal Liquidity Facility,” Federal Reserve Board press release, June 3, 2020.
https://www.federalreserve.gov/newsevents/pressreleases/monetary20200603a.htm. Last accessed June 25,
2021.
11six months. The relatively short maturity was intended to provide assistance that reflected the
realities of municipal issuers’ fiscal institutions and that states and localities would generally be
able to actually use. (Recall that the use of long-term borrowing is typically sharply restricted
under state and local law.) Indeed, many municipalities must repay short-term borrowing within
the fiscal year, but the expectation was that some would be able to relax these tight constraints
somewhat, making a two- or three-year term practicable. In any event, the CARES Act called for
a facility that would support the cash management needs of states and municipalities, and this
was an additional argument for restricting maturities.
Issuance limits were determined by the size of the eligible government, as measured by
own-source general plus utility revenue in fiscal year 2017, as reported by the Census of
Governments. The use of Census of Governments data was intended to avoid complications from
variations in accounting standards. Census of Governments data are self-reported by the
governments in question and are reported in a standard accounting by the Census Bureau. Data
for 2017 were chosen in part because they were already publicly available at the facility’s
inception and were based on a census (a 100 percent sample) rather than the smaller samples
used in years between censuses.
The decision to use the OSGUR revenue concept reflects the complexity of the sector,
which receives revenues from its own activities as well as from other levels of government and
from the operation of insurance trust funds such as those for employee pensions. OSGUR is a
measure of the revenue that governments, including their dependent public utilities like water
districts or transit systems, raise themselves, generally through taxes and fees. The share—
20 percent—was chosen to reflect the potential for a very severe downturn as well as the timing
issues that were expected to arise from the change of the federal tax filing deadline to July 15,
producing a large facility of about $500 billion. The facility size was approximately equal to 20
percent of the OSGUR for all the governments in the sector.
3.3 Pricing
On May 11, the Federal Reserve released the initial pricing schedule for MLF lending.
Prices for tax-exempt issues were expressed as a series of spreads to overnight index swap rates
(OIS), with the spreads ranging from 150 basis points for AAA/Aaa-rated issuers to 380 basis
12points for BBB-/Baa3 issuers.20 Below-investment-grade issuers were assigned a spread of 590
basis points. Taxable issues were priced at the applicable tax-exempt rate divided by 0.65 to
reflect the value of the tax exemption. Each issue to the MLF was also required to pay an
origination fee equal to 10 basis points of the principal amount.
These rates were, as required by the Federal Reserve’s Regulation A for its Section 13(3)
programs, set as “penalty” rates relative to normal market pricing.21 Nonetheless, MLF rates
were criticized by many for being too punitive, especially for higher-rated borrowers after the
market began to normalize. On August 11, as spreads in the market came down, MLF pricing
was reduced by 50 basis points across the board, producing the price schedule shown in Table
1.22 Taxable rates were reduced somewhat more, as the adjustment factor went from 0.65 to 0.70,
thereby narrowing the spread between the tax-exempt and taxable rates.
These revised rates generally remained above the rates that could be found in private
markets for issuers in most credit ratings, although the substantially slower recovery of yields for
issues carrying lower credit ratings meant that MLF participation was attractive for the relatively
small set of issuers in the A and BBB ratings groups. Indeed, only lower-rated issuers actually
issued notes to the facility during its lifetime, providing indirect evidence of the importance of
the pricing. We discuss more fully the impact of the facility across the ratings distribution in the
next section.
3.4 Operations, Issuance, and Wind-Up
Under the MLF, the Federal Reserve Bank of New York (the Reserve Bank administering
the facility) committed to lend to a special purpose vehicle (SPV) on a recourse basis, secured by
all of the assets of the SPV. The New York Fed was the managing member of the SPV, which
was known as Municipal Liquidity Facility LLC. The SPV purchased eligible notes directly from
eligible issuers at the time of issuance. The MLF officially opened on May 11 with the posting of
20
“Federal Reserve Publishes Updates to the Term Sheet for the Municipal Liquidity Facility,” Federal Reserve
Board press release, May 11, 2020.
https://www.federalreserve.gov/newsevents/pressreleases/monetary20200511a.htm. Ratings were at the issuer
level, given as the average of the Nationally Recognized Statistical Rating Organizations.
21
See Code of Federal Regulations, 12 C.F.R. 201.4(d)(7). https://www.ecfr.gov/current/title-12/chapter-
II/subchapter-A/part-201/section-201.4.
22
“Federal Reserve Board Announces Revised Pricing for its Municipal Liquidity Facility,” Federal Reserve Board
press release, August 11, 2020.
https://www.federalreserve.gov/newsevents/pressreleases/monetary20200811a.htm.
13a Notice of Interest and instructions for how eligible issuers could participate in the program.
Eligible issuers were instructed to determine their financial needs and repayment schedule, then
inform the New York Fed of their intention to participate.23 The New York Fed and the SPV
hired several vendors to consult on the MLF’s structure, to evaluate the credits presented, and to
administer the facility.24
Over the MLF’s lifetime, only two issuers actually sold notes to the facility: the state of
Illinois and New York’s Metropolitan Transportation Authority (MTA). Table 2 reports the
details of these transactions. Illinois’s issuance of a total of $3.2 billion represented about one-
third of the state’s maximum eligible borrowing, but the MTA ultimately borrowed its maximum
allowable amount, $3.358 billion.
It is notable that both of these issuers were relatively low-rated by the nationally
recognized statistical rating organizations.25 Illinois’s average rating was BBB- at the time of
both of its issuances to the facility, while the MTA’s original note, secured by an anticipated
Transportation Revenue Bond issue, was priced advantageously given a favorable rating from
Kroll, Inc.26 The MTA’s second, December, note was secured by an anticipated Payroll Mobility
Tax bond issue, which was rated AA+/Aa1. Not surprisingly, issuers appear to have compared
the rates they would be required to pay to the MLF with market pricing and chosen whichever
option offered the lowest rates. The MTA’s initial $450 million issue, for example, received
competitive bids of 2.79 percent, versus the 1.93 percent it received from the MLF.27 The state of
New Jersey considered a $4 billion sale to the MLF but reported that its advisor found market
pricing more advantageous, and the state issued publicly instead.28 For both Illinois and the
23
The facility was officially a special purpose vehicle called Municipal Liquidity Facility LLC and was incorporated in
Delaware. See “Municipal Liquidity Facility Notice of Interest,” May 11, 2020, at
https://www.newyorkfed.org/medialibrary/media/markets/mlf-notice-of-interest.
24
Municipal Liquidity Facility, Federal Reserve Bank of New York. See: Vendors.
https://www.newyorkfed.org/markets/municipal-liquidity-facility.
25
The nationally recognized statistical rating organizations for MLF purposes were S&P Global Ratings, Moody’s
Investor Service, Inc., Fitch Ratings, Inc., and Kroll Bond Rating Agency, Inc.
26
See “New York’s MTA Is Saved Less by Fed and More by Kroll,” Bloomberg, August 19, 2020.
https://www.bloomberg.com/opinion/articles/2020-08-19/new-york-s-mta-saved-less-by-fed-and-more-by-kroll.
27
“New York’s MTA Sells Over $450M in Debt to Fed’s Municipal Liquidity Facility,” S&P Global Market Intelligence
August 18, 2020. https://www.spglobal.com/marketintelligence/en/news-insights/latest-news-headlines/new-
york-s-mta-sells-over-450m-in-debt-to-fed-s-municipal-liquidity-facility-59983543.
28
“New Jersey Picks Muni Market Over Fed for $4 Billion Bond Sale, Reuters, October 22, 2020.
https://www.reuters.com/article/usa-new-jersey-fed-bonds/new-jersey-picks-muni-market-over-fed-for-4-billion-
bond-sale-idUSL1N2HD1ZD.
14MTA, MLF pricing for the financing they sought was the most favorable, or at a minimum
favorable enough to make the utilizing the facility appealing. The fact that both were relatively
low-rated issuers suggests that MLF terms were somewhat more favorable for riskier borrowers,
although take-up of the facility was quite low even among low-rated issuers. We discuss this
subject further below.
On November 19, 2020, then-Treasury Secretary Steven Mnuchin sent a letter to Fed
Chair Jerome Powell requesting that the Federal Reserve return the unused portion of the
Treasury’s initial investment in the various facilities that were supported by Treasury funding,
including the MLF, effectively enforcing the closure of the facility to new purchases, as
scheduled, on December 31.29 As shown in Table 2, the MLF’s two borrowers, Illinois and the
MTA, each completed a transaction shortly before the closure, in mid-December. On June 5,
2021, Illinois completed repayment of its initial $1.2 billion note, having voluntarily prepaid the
debt starting in November 2020.
4. Effects of the Municipal Liquidity Facility
Between mid-March (when the CARES Act was announced and stated that the Treasury
and the Federal Reserve would provide cash management assistance to municipal borrowers) and
the official closure of the MLF at the end of 2021, municipal market conditions improved
significantly. This improvement can be seen in a variety of measures, from secondary market
yields (see Chart 4) to issuance. Indeed, by year-end, municipal issuance in 2020, in the midst of
a pandemic, reached $484 billion—a record total and 14 percent above the 2019 level.30 The
improvement was not even across the board, however, and the recovery for the lowest-rated
segment of the market was considerably slower, as can be seen in the chart. Nonetheless, by late
summer, even BBB yields had retraced most, if not all, of the spikes that occurred in March.
While the overall recovery in the market during the first few months of the MLF’s
existence is dramatic and undeniable, it is challenging to determine what, if any, of this
improvement can be attributed to the facility itself. Both the facility’s announcement and its
29
See letter at https://home.treasury.gov/system/files/136/letter11192020.pdf.
30
SIFMA, U.S. Municipal Bonds Statistics. https://www.sifma.org/resources/research/us-municipal-bonds-
statistics/us-municipal-bonds-statistics-sifma/.
15opening occurred at the same time as other federal interventions. For example, the Federal
Reserve’s Money Market Mutual Fund Liquidity Facility (MMLF) was established on March 18.
Mutual funds are major holders of municipal securities, and they had experienced $43 billion in
outflows during March, a figure equal to almost half the previous year’s inflows. Similarly, the
CARES Act included $150 billion in funding for a new Coronavirus Relief Fund, which
provided support for state and local governments to cover expenses related to COVID-19. In
addition, the Federal Open Market Committee voted to cut the federal funds rate to a range of 0-
0.25 percent by March 16.
To a very small sample of market participants who offered feedback on the facility to the
authors, the MLF was clearly associated with substantially improved market functioning,
although many also attributed a significant role to other elements of the federal government’s
interventions—particularly the MMLF but also CARES Act direct aid and the fact that the state
and local government revenue picture improved dramatically as the year progressed.
The body of research on the effect of all these interventions, collectively and
individually, is relatively small at this early date. Bi and Marsh (2020) study the impact of varied
fiscal and monetary policy interventions on municipal bond market performance in the wake of
COVID-19 by analyzing daily time series effects around the various announcements. They do
not focus explicitly on the MLF, but find that long-term, low-rated bonds remained distressed
beyond the various federal government interventions. Bordo and Duca (2021) further focus on
the time series impact of the MLF announcement on yield spreads, and find that the MLF limited
the growth of spreads by 5 to 8 percentage points. Li and Lu (2020) focus on the effects of
shutdown announcements on offering yields (rather than trade prices) and find that initial
offering yields increased in response to shutdowns and decreased following facility
announcements. Both Bordo and Duca (2021) and Li and Lu (2020) are consistent with a view
that the various facilities (the MLF in particular, according to Bordo and Duca) played a
significant role in calming the municipal market. But as noted, the close timing of many of the
facility and other policy announcements makes separating their effects in the aggregate difficult.
In a novel approach to this problem, Haughwout, Hyman, and Shachar (2021) combine
the time series and cross-sectional variations in availability of MLF funding to identify the effect
of the facility on bond yields, issuance, ratings downgrades, and local public sector employment.
16The facility’s population cutoffs for county and city issuers (500,000 and 250,000, respectively)
were relatively arbitrary figures generally intended to limit the facility’s eligibility to a
manageable number of potential counterparties. After demonstrating that counties and cities just
above and just below these cutoffs are quite similar fiscally prior to the announcement of the
MLF, Haughwout, Hyman, and Shachar (2021) look for differences in outcomes based on
facility access. The headline result is that conditions overall improved after the MLF was
announced, but the improvement was uneven across the credit rating distribution, and for the
lowest-rated city and county issuers, which are here measured as those with ratings of A or BBB,
actual eligibility to borrow at the facility translated into lower secondary market yields. The
authors attribute this eligibility effect to a reduction in downgrade or default risk for these
issuers, as they would be differentially able to remain liquid thanks to the option to borrow from
the MLF. These authors also find a modest effect of MLF eligibility on primary market issuance,
particularly among low-rated municipalities. Their test for effects of eligibility on the probability
of a ratings downgrade also suggests a modest MLF effect, with downgrades rarer for issuers that
had the option to receive funding from the MLF. Between March and November 2020, the
number of bonds by cities and counties just below the population cutoff rose from 100 to 600,
while they went from 100 to about 200 over the same period for issuers just above the cutoff. In
this case, the MLF eligibility effect was not related to the starting level of credit risk but, given
the relative rarity of ratings changes, it is not estimated precisely.
A final contribution of Haughwout, Hyman, and Shachar (2021) is their attempt to
identify the effect of MLF eligibility on local government employment. While the authors are
able to demonstrate clearly that the largest cities and counties reduced employment by less than
their slightly smaller counterparts, they are unable to attribute this difference to the MLF. The
CARES Act’s Coronavirus Relief Fund, which as noted above made $150 billion in grants to
many of the same governments, acts as a confounder here, and the authors conclude after a series
of tests that the fund appears more likely than the MLF to have driven the employment results.
5. Discussion and Conclusion
The rapid healing of the municipal securities market after its sharp deterioration, along
with the overall improvement in the fiscal health of state and local governments, is a clear
17success story of the pandemic policy response. Nonetheless, as of mid-2021, the state and local
government sector had still not recovered to its pre-pandemic employment level. Indeed,
employment as of May 2021 remained more than a million jobs (about 6 percent) below its pre-
pandemic peak of February 2020 and has shown little sign thus far of a substantive recovery
despite a substantial brightening of the fiscal outlook for the sector. It seems probable that some
of this weakness is attributable to caution in a sector that was hit hard in the 2007-09 recession
and its aftermath. Further, as noted above, the fact that many of these job losses have been
concentrated in education suggests that there may be a nonfiscal reason for them, as in-person
schooling was not feasible for most of the 2020-21 school year, leading to greatly reduced need
for nonteaching staff such as bus drivers and cafeteria workers.
Given its focus on the ability of municipal issuers to access capital and liquidity, it is hard
to resist the conclusion that the MLF was successful, if only as a component of a broad portfolio
of policy interventions: record issuance at low interest rates suggests an issuer-friendly
environment for much of 2020 and into 2021. How much credit the MLF deserves for this
outcome is debatable, but market participants and the relevant academic literature provide
evidence that some credit is due. Certainly, the MMLF was an important secondary market
complement to the MLF’s primary market focus. Indeed, some observers asked whether the
Federal Reserve should have designed a secondary market facility for municipal debt, analogous
to the Secondary Market Corporate Credit Facility.31 While the MLF was always focused on the
primary market, the original (April 9) announcement of the MLF stated:
In addition to the actions described above, the Federal Reserve will continue
to closely monitor conditions in the primary and secondary markets for
municipal securities and will evaluate whether additional measures are
31
See, for example, an October 14, 2020, letter to Treasury Secretary Mnuchin and Fed Chair Powell from the
Government Finance Officers Association, International City/County Management Association, National
Association of Counties, National Association of State Auditors, Comptrollers, and Treasurers, National Association
of State Treasurers, National League of Cities, and U.S. Conference of Mayors, at
https://gfoaorg.cdn.prismic.io/gfoaorg/55818178-59da-41f8-ba44-383849bc85ed_MLFCoalitionLetter_FINAL.pdf.
18needed to support the flow of credit and liquidity to state and local
governments.32
Some observers interpreted this sentence to mean that the Federal Reserve would establish a
secondary market facility if needed for liquidity purposes, a need that ultimately did not
materialize in the judgment of policymakers.
Nonetheless, the MLF had very low take-up, especially relative to the size of the market
it was designed to support and relative to the announced size of the facility. This outcome was
the subject of considerable discussion at a Congressional Oversight Commission hearing where
some policymakers criticized the facility’s limited eligibility and penalty pricing as overly
blunting its impact.33
The initial concern was that a facility of this type—directly lending in a market in which
the Federal Reserve had never participated and had little expertise, and which consisted of a very
large number of heterogeneous issuers—could easily be overwhelmed by demands for funds.
This consideration led to strict eligibility limits both in terms of issuers and tenors, limits that
were slowly relaxed over the subsequent revisions to the term sheet. At the same time, the
adoption of a pricing schedule at penalty rates (as required by law) in the face of a stabilizing
market environment made the MLF uneconomic to the vast majority of borrowers who were
eligible. A reasonable conclusion to draw from this set of facts is that, even in a market with
many issuers, penalty pricing acts as a significant deterrent to facility utilization—meaning that
complex eligibility criteria may further complicate the Federal Reserve’s ability to deliver
funding where it is most needed. Further research on this topic is warranted, specifically focused
on the price elasticity of demand for short-term borrowing by municipal issuers in an
environment of fiscal stress. Given the size and heterogeneity of the issuer population in the
municipal market, policymakers would need to know the elasticity on both the extensive margin
(how many new issues would be made at price X?) and the intensive margin (how much would
be borrowed at price X?). Estimates of these elasticities are important inputs into the design of a
32
“Federal Reserve Takes Additional Actions to Provide up to $2.3 Trillion in Loans to Support the Economy,”
Federal Reserve Board press release, April 9, 2020.
https://www.federalreserve.gov/newsevents/pressreleases/monetary20200409a.htm.
33
Congressional Oversight Commission, Hearing on Municipal Liquidity Facility, September 17, 2020.
https://coc.senate.gov/municipal-liquidity-facility.
19future facility like the MLF and could greatly simplify and streamline decisions about eligibility
and borrowing limits by linking them with the setting of the penalty prices.
The challenge, of course, is identifying price shocks exogenous to borrower
characteristics that can allow causal estimation of the effect of prices on issuance. Using their
regression discontinuity design, Haughwout, Hyman, and Shachar (2021) estimate that among
city and county issuers rated A/BBB, MLF eligibility caused a 75 basis point (or about 25
percent) reduction in yields. This exogenous variation in pricing, which is admittedly rare, might
be used to identify the effects of prices on yields. In the paper, Haughwout, Hyman, and Shachar
estimate some issuance response by A/BBB issuers, on both the extensive and intensive margins.
The point estimate suggests elastic demand, but the sample sizes are very small: only five
A/BBB cities or counties issued public debt in the six months following the April 27 expansion
of the facility, four of which were eligible to borrow at the MLF.34 These estimates have the
advantage of being well-identified but suffer from a lack of precision and the fact that they are
drawn from a sample of low-rated issuers, a thin part of the issuer population. Future work could
focus on refining and expanding analysis along these lines.
A second lesson learned from the MLF experience is that investors, perhaps not
surprisingly, appear to have placed a high value on facility eligibility by lower-rated borrowers.
In the end, the MLF lent to just two borrowers: the state of Illinois (the lowest-rated state
government) and the MTA, a relatively low-rated revenue bond issuer. Further, Haughwout,
Hyman, and Shachar’s (2021) results suggest that secondary market investors perceived a lower
default risk for A/BBB cities and counties with facility access than for those without. The notion
that the greatest benefit of access to Federal Reserve lending accrues to riskier borrowers
suggests a potential for credit risk sharing or a change in the “normal” allocation of credit
attributable to such a facility. The welfare implications of public sector risk sharing or credit
allocation are complex, especially when considerations of equity among the constituencies of
various subnational public sector entities are included. Further research is required to understand
these implications, as well as the relationship between access to liquidity and welfare in these
areas.
34
These few issues were about 44 percent larger than the placebo mean.
20A corollary concern is moral hazard. Borrowers might expect the Federal Reserve to
reestablish such a facility if similar market dysfunction were to occur again, inducing borrowers
to take more risk today. Bordo and Duca (2021) review past episodes in the United States and in
other countries where state and local governments have not internalized borrowing risks due to
previous national bailouts, which then resulted in a wave of defaults when such bailouts have
failed to be realized.
Some characteristics of the pandemic context and the facility itself may serve to mitigate
these moral hazard concerns to some degree. First, the pandemic was a unique event, with effects
across the entire spectrum of municipal borrowers and indeed the entire economy. As Chair
Powell testified in December 2020: “These programs serve as a backstop to key credit markets
and have helped restore the flow of credit from private lenders through normal channels. We
have deployed these lending powers to an unprecedented extent.”35 Second, the MLF’s very low
take-up rate appears to have been induced in part by the combination of eligibility restrictions
and penalty pricing, suggesting that for the vast majority of municipal bond issuers it was not an
attractive option compared to private markets. Third, the improvements in overall market
functioning that followed the introduction of the MLF and other federal interventions were
slowest to appear for lower-rated issuers—those in the A and BBB market segments.
Of course, none of these mitigants is completely convincing and there remain reasons for
concern over moral hazard. For example, under exactly what future circumstances the Federal
Reserve might again intervene in the municipal bond market is unknown, and it is possible that
municipal budget officials will be overly optimistic about the probability of a future intervention
of this sort in any number of scenarios. Further, these officials could imagine that a future
version of the facility might be designed to be a more attractive option to individual borrowers,
and/or to provide more immediate support to the bottom of the ratings distribution. Our
conclusion, then, is that once a new kind of backstop lending has been introduced, and the MLF
certainly fits that description, the issue of moral hazard can never be satisfactorily resolved ex
ante but will require further monitoring.
35
See “Fed Chair Calls the Economic Recovery ‘Extraordinarily Uncertain,’” CNN Business, December 1, 2020.
https://lite.cnn.com/en/article/h_56bf6ed733f9c4124446cf991fd94e6e.
21You can also read