WIDER, TALLER, HEAVIER: EVOLUTION OF LIGHT DUTY VEHICLE SIZE OVER GENERATIONS - Working Paper 17 - Global Fuel Economy Initiative
←
→
Page content transcription
If your browser does not render page correctly, please read the page content below
WIDER, TALLER, HEAVIER:
EVOLUTION OF LIGHT DUTY VEHICLE SIZE
OVER GENERATIONS

                                       Working Paper 17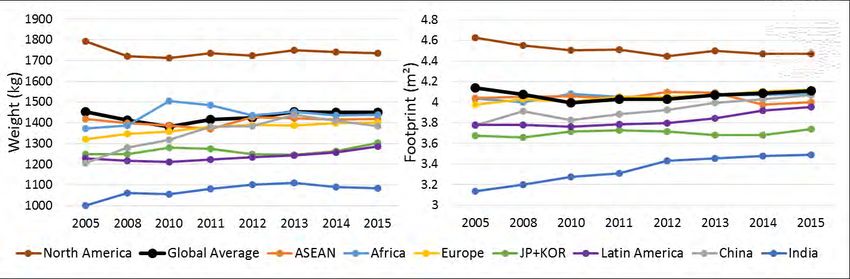
Table of Contents
Wider, taller, heavier: Evolution of light duty vehicle size over generations ........................................ 1
  Acknowledgements ............................................................................................................................. 5
  Key points ............................................................................................................................................ 6
  Policy recommendations ..................................................................................................................... 8
  Introduction: The importance of vehicle size for fuel economy ......................................................... 9
  Vehicle size: Qualitative definition and measurable metrics .............................................................. 9
     How to define, measure and classify vehicle size ........................................................................... 9
  Vehicle size and fuel economy policies ............................................................................................. 17
     Why are weight and footprint the main metrics used as a proxy for vehicle size? ...................... 17
  Macro Analysis: Macroscopic trends in weight and footprint .......................................................... 20
     Methodological approaches .......................................................................................................... 20
     Weight and footprint evolution .................................................................................................... 21
     How OEMs alter fleets depending on region ................................................................................ 23
  Micro analysis: Top sellers’ weight and footprint evolution ............................................................. 27
     Vehicle selection and market representation ............................................................................... 27
     50 years of emblematic models’ size and weight evolution ......................................................... 29
     SUVs: Game changers to size and weight evolution ..................................................................... 32
     Fuel economy tests favor SUVs ..................................................................................................... 33
     Why do models continuously increase in size? ............................................................................. 33
     Is light-weighting a reality? ........................................................................................................... 34
     Battery weight still a barrier to widespread electric vehicle deployment .................................... 37
  Looking ahead: Regulating vehicle size? ........................................................................................... 38
  References ......................................................................................................................................... 40
  Annex I: Average vehicle price by OEM............................................................................................. 43
  Annex II: Weight and Footprint evolution of emblematic models .................................................... 44

                                                                                                                                                         2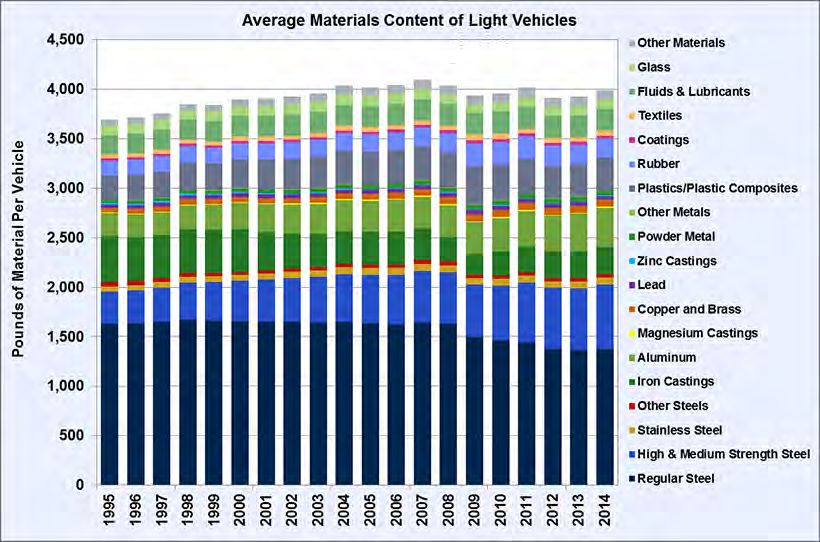
List of figures

Figure 1: Top drivers for vehicle renewal in India (Deloitte, 2014) ......................................................... 9
Figure 2: Sample of interior height dimensions according to SAE J1100 .............................................. 10
Figure 3: Online media using standard set of luggage to compare luggage capacity (Km77.com, 2017)
............................................................................................................................................................... 11
Figure 4: Journalist using himself to highlight and compare rear passenger compartment size (L’argus,
2017)...................................................................................................................................................... 11
Figure 5: Exterior versus interior size comparisons for U.S. models (Consumer Reports, 2017) ......... 16
Figure 6: interior size versus footprint and weight, by segment .......................................................... 19
Figure 7: Exterior size versus footprint and weight, by segment .......................................................... 19
Figure 8: Footprint versus weight for all models sold globally in the last decade ................................ 20
Figure 9: Weight and footprint evolution by region of registration, 2005 to 2015 .............................. 21
Figure 10: Average vehicle weight and footprint by OEM region of origin........................................... 22
Figure 11: Weight and footprint evolution by OEM type...................................................................... 22
Figure 12: Weight and footprint evolution by fuel type ....................................................................... 23
Figure 13: Average weight and footprint by power bin (kW) ............................................................... 23
Figure 14: Weight and footprint evolution by region and OEM country of origin ................................ 25
Figure 15: Power-to-weight and power-to-footprint by OEM origin .................................................... 26
Figure 16: Average power density and engine size, by OEM type ........................................................ 26
Figure 17: Global market share by body style, 2005 to 2015 ............................................................... 27
Figure 18: Weight evolution from market introduction of typical long-lasting model names ............. 29
Figure 19: Medium-sized vehicles weigh evolution over generations .................................................. 30
Figure 20: Example of Large SUV versus average parking space size in the U.K. (Accident Exchange,
2017)...................................................................................................................................................... 30
Figure 21: Longer and taller: side view of 1984 Voyager versus 2017 Pacifica (Car and Driver, 2017) 31
Figure 22: Weight and size evolution of the most popular hybrid vehicle, the Toyota Prius, over four
generations............................................................................................................................................ 31
Figure 23: Ford midsize vehicle weight and size evolution, together with MPV and SUV variants ...... 32
Figure 24: Frontal areas of Opel Corsa and its body variants ............................................................... 33
Figure 25: Size comparison of 1st Generation Golf versus last generation Polo ................................... 34
Figure 26: Average material content of light duty vehicles in the United States (DoE, 2017).............. 35
Figure 27: Sales-weighted average weight of key models that have deployed weight reduction
strategies ............................................................................................................................................... 36
Figure 28: Sales-weighted average weight of VW Golf by powertrain type ......................................... 36
Figure 29: Ford Escort /Focus, C-Max, Kuga weight and size evolution................................................ 44
Figure 30: Volkswagen Golf, Touran, Tiguan weight and size evolution............................................... 44
Figure 31: Toyota Corolla, C-HR weight and size evolution .................................................................. 45
Figure 32: BMW 3-series and X3 weight and size evolution ................................................................. 45
Figure 33: Chevrolet Impala weight and size evolution ........................................................................ 46
Figure 34: Honda Civic, CR-V weight and size evolution ....................................................................... 46
Figure 35: Renault 5, Clio and Captur weight and size evolution.......................................................... 47
Figure 36: Opel Corsa, Meriva and Mokka weight and size evolution .................................................. 47
Figure 37: Chrysler Voyager / Town and Country and Pacifica weight and size evolution ................... 48
Figure 38: Toyota Prius weight and size evolution................................................................................ 48

                                                                                                                                                                3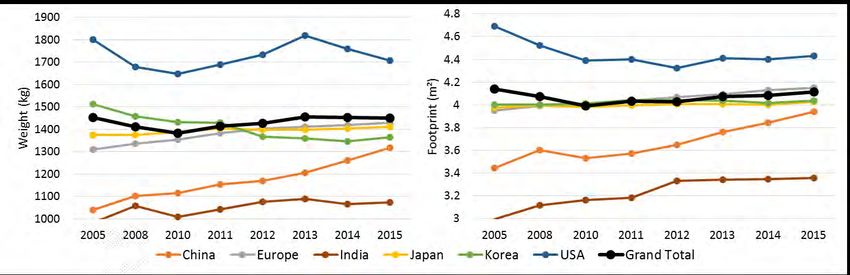
List of tables

Table 1: Size class quantified definition versus market class in search engine of fueleconomy.gov.... 12
Table 2: Example of market segmentation used for GFEI analysis (IEA, 2011 and IEA, 2017) .............. 13
Table 3: ACRISS car codes definitions.................................................................................................... 14
Table 4: Pros and cons of each vehicle size measurement and categorization approach .................... 15
Table 5: Overview of potential index parameters including qualitative assessment (ICCT, 2011) ....... 18
Table 6: Top 10 model registrations in the GFEI database.................................................................... 28
Table 7: Vehicles selected for size and weight comparison over generations...................................... 28
Table 8: BEV powertrain extra weight on popular models ................................................................... 37

                                                                                                                                          4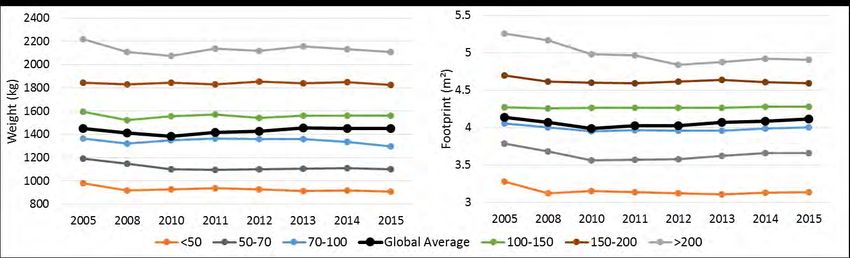
Acknowledgements

This publication was prepared by François Cuenot. The manuscript was shared for review with the
following representatives of the GFEI partner organizations: Peter Mock, John German, and Anup
Bandivadekar of ICCT, and Sheila Watson of the FIA Foundation. The FIA Foundation provided
funding for the development of this work.

                                                                                                  5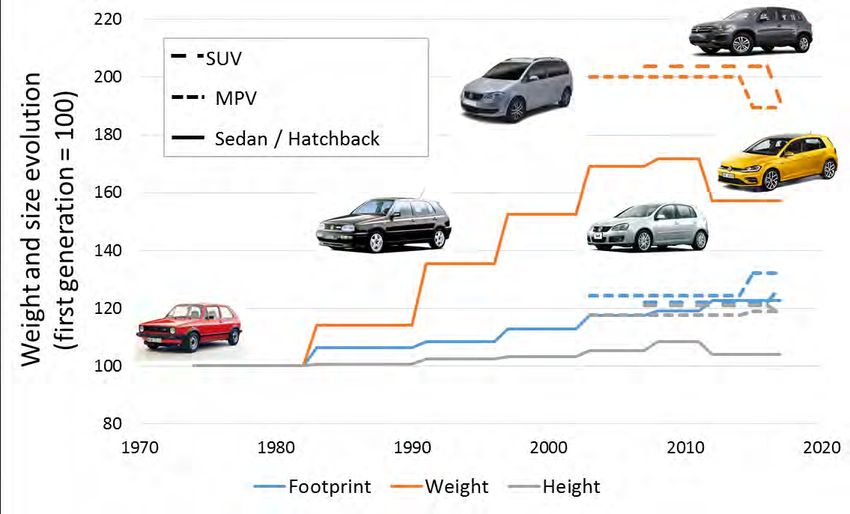
Key points
   •   Vehicle size is a key parameter in car purchase decisions. Most potential buyers know the
       desired vehicle size before considering any other specifications, such as fuel type, engine
       power, or body style.
   •   Measuring vehicle dimensions to classify vehicle sizes can be confusing and does not bring
       robust information to the potential buyer. Interior space, though used by U.S. regulators to
       classify vehicle size, is not a good indicator of vehicle size. The industry has favored a more
       subjective segmentation based on relative comparisons of the model range available and the
       competition model portfolio.
   •   Weight and footprint (wheelbase multiplied by vehicle track) are the two most popular
       proxies used in fuel-economy policies. Footprint offers a more robust metric for corporate
       average fuel economy (CAFE) standards because it emphasizes weight reduction and allows
       for less possibility to game the system.
   •   While footprint is the best metric for representing vehicle size for policy purposes, to analyze
       market evolution, it is also appropriate to look at weight and vehicle segment, especially for
       evaluating the impact of SUVs.
   •   From 2010 to 2015, the average vehicle registered globally increased in weight by more than
       5% and in footprint by more than 3%, based on more than 70 million new vehicles recorded
       annually in the database of the Global Fuel Economy Initiative (GFEI), covering more than
       80% of global vehicle sales.
   •   The Chinese market, now the biggest globally, is quickly increasing the worldwide averages
       for vehicle weight and footprint, driven by local manufacturers now matching the size and
       weight of advanced foreign designs produced in China through joint ventures.
   •   The Indian market has by far the smallest and lowest-powered vehicles while the U.S. market
       has the largest, heaviest, and most over-powered. The average American vehicle in 2015 was
       30% larger, 60% heavier, and 180% more powerful than the average Indian vehicle.
   •   Engine downsizing has been a reality mostly for large and very powerful engines. Low-cost
       brands still increase engine size along with vehicle size. Engine downsizing had no or very
       limited impact on vehicle size, with average engine power still increasing.
   •   There has been a dramatic increase in demand for SUV body styles in the recent years,
       shifting the market toward larger, taller, and heavier autos at a faster pace. Where previous
       model types took more than 20 years and at least three design generations to increase
       weight by 30%, SUVs are doing that in just one generation (see Figure ES1).
   •   SUV footprints are usually similar to those of their sedan variants. The major difference in the
       vehicles is increased weight and height. Footprint-based fuel-economy standards are
       therefore better suited for managing expansion of the SUV market and encouraging better
       SUV fuel economy, as weight-based standards artificially reward manufacturers for the
       additional weight of the SUV.
   •   SUVs have preferential treatment on certification test cycles, which use lower average
       speeds than real drivers do. So the higher aerodynamic load of SUVs, reflecting a bigger
       frontal area because of height, is not fully captured by such tests. This results in better fuel-
       economy readings than the SUVs deliver on the road compared with similar sedans.

                                                                                                      6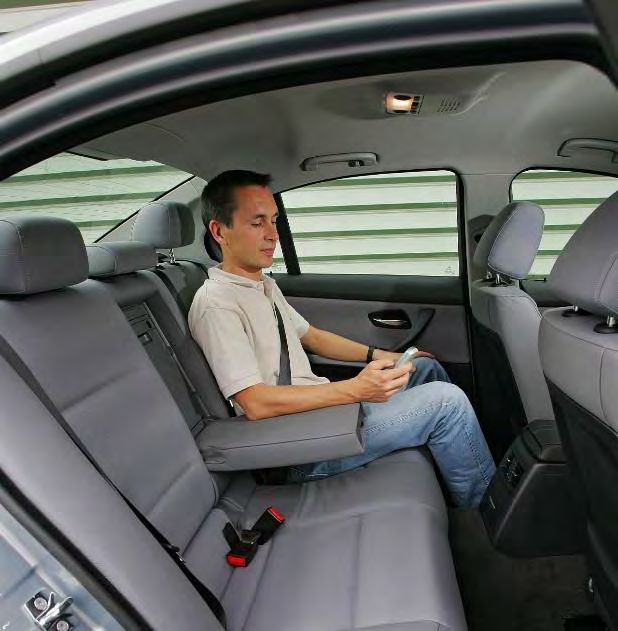
Figure ES1: Example of size and weight evolution for the BMW 3-series, from 1st generation to last sedan and SUV variant

    •    Even though the proportion of advanced, lighter-weight materials used in autos is increasing,
         average vehicle weight is still rising. These materials offset the weight of upscale features or
         simply increases in vehicle size. The market shift toward heavier SUVs adds to the trend.
    •    A review of model evolution from generation to generation shows that vehicle footprint
         increases slowly even as weight has sometimes doubled from initial models in the 1960s or
         1970s. Technical innovations to improve fuel economy have been used primarily to limit
         consumption growth that would otherwise have occurred because of substantial weight
         increases.
    •    Light-weighting is starting to be deployed on a large scale in some models through a wide
         variety of technical approaches depending on the manufacturer. Optimization of existing
         material and manufacturing processes has been used most often, with material substitution
         a rarer option for engine or body parts.
    •    Battery electric vehicles (BEVs) still have a significant weight penalty because of the battery
         pack. Most BEV makers prefer to use significant improvements in power density and specific
         power of the batteries to increase vehicle range rather than to reduce vehicle weight.

                                                                                                                           7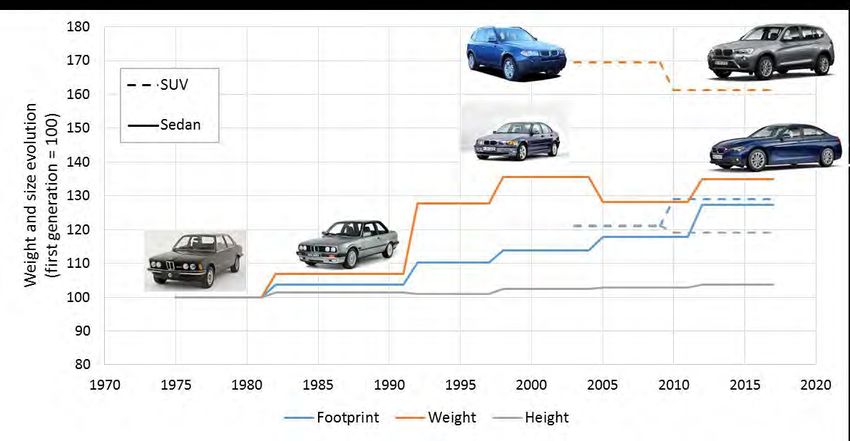
Policy recommendations
   •   Interior size should not be used as a vehicle size metric. Vehicles perceived as large
       sometimes have tight interior spaces that can lead to confusion.
   •   Harmonized worldwide definitions for vehicle segments would reduce confusion and
       improve policies and analyses. Definitions should be developed by an authoritative
       independent body at the global level. A UN framework would be an appropriate arena for
       defining and maintaining such a classification scheme.
   •   Footprint-based fuel-economy standards should be adopted as widely as possible to spur
       more-aggressive weight-reduction strategies and deployment of more fuel-efficient SUVs.
   •   Real-life fuel-economy measurements complementing laboratory tests should be
       implemented to better capture real-life driving conditions, such as higher average speeds
       and a higher share of urban driving, and lower ambient temperatures.
   •   Corporate average weight reduction targets should be considered to strongly encourage
       weight-reduction strategies. This would benefit not only fuel economy but also safety, road
       wear, and road occupation. It would also decrease the need for high engine power, further
       reducing vehicle weight.

                                                                                                     8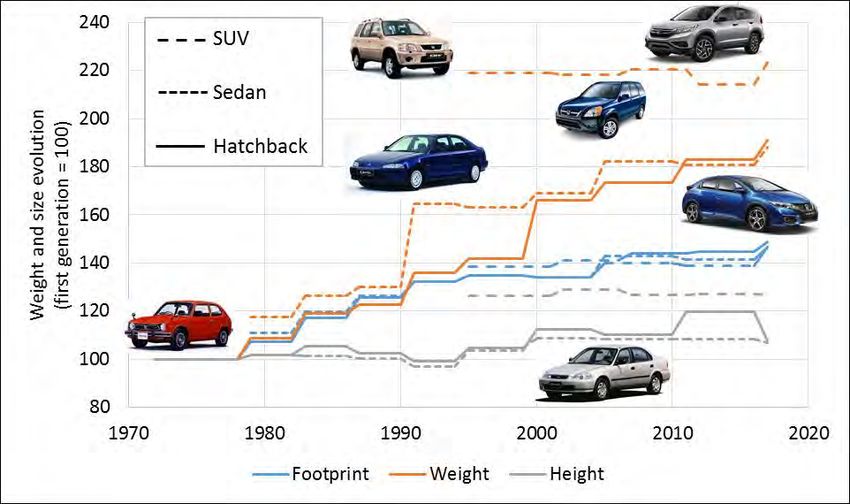
Introduction: The importance of vehicle size for fuel economy
The Global Fuel Economy Initiative (GFEI) started in March 2009 to engage countries, policy makers,
and all stakeholders to dramatically improve vehicle fuel economy by encouraging adoption of fuel
economy technologies and policies around the world. Policies in place are sometimes lacking in
ambition and consistency.

Auto makers, also known as original equipment manufacturers (OEMs), continuously apply new fuel-
economy technologies in search of competitive advantage through more efficient powertrains and
other features. But this doesn’t always result in better vehicle fuel economy. Often, engineers apply
these technologies to offset the negative effects on fuel economy of increased weight, size, or engine
power, resulting in no net fuel-economy gains for the vehicle.

To better understand how the size and weight of vehicles have evolved and have affected fuel
economy, this paper examines how cars have changed in size over time. We also study trends in auto
characteristics and demand as well as changes in markets around the world relative to vehicle size.

Vehicle size: Qualitative definition and measurable metrics
Each car user has a different need for his or her vehicle. Size is one of the top criteria triggering a
decision to purchase or replace a car. In India, for example, vehicle size is the second-most important
reason given for a purchase by first-time and replacement buyers, behind availability of new
technology (see Figure 1).

Figure 1: Top drivers for vehicle renewal in India (Deloitte, 2014)

Vehicle size and meaning are rather subjective. A family with three children is likely to have a
different interpretation of how big is a car compared with a young driver purchasing for the first
time.

How to define, measure and classify vehicle size
Vehicle size has important consequences for an auto’s choice and use. Size affects price, the amount
of interior space for passengers and luggage, and the ease of parking in tight spaces. Each user will
prioritize each criteria differently, making vehicle size hard to standardize and quantify.

                                                                                                      9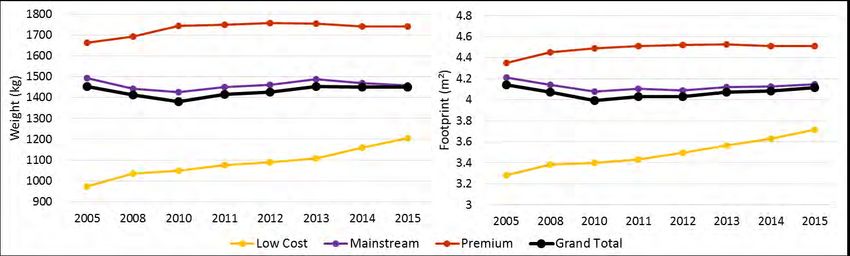
Nevertheless, there is a need to be able to compare vehicles by size as buyers choose from vehicles
made by different OEMs. There are different approaches for quantifying vehicle sizes and classifying
vehicles by size bins:

    •    A standard exists for measuring exterior and interior vehicle size: SAE’s J1100 paper defines
         how to measure vehicle size in a standardized way.
    •    Specialized media often use sets of suitcases to quantify trunk size and humans to assess leg
         and head room, often in the rear seats.
    •    Most car manufacturers, suppliers, and some stakeholders use vehicle segmentation, where
         the market is split into about 10 categories, to group vehicles by size class (e.g. EU, 1999).
    •    Rental agencies have put in place a unique code for organizing vehicle classes, trim and
         refinement levels (ACRISS, 2017).

Standard for measuring vehicle size
In 1984 the U.S. SAE published a detailed paper on how to measure interior and exterior vehicle
sizes. It details the procedures for measuring dimensions, surface areas, and volumes to determine
light and heavy duty vehicle size categories. It is used in U.S. road safety legislation to define
passenger carrying volume (U.S. GPO, 1998).

This guideline paper stipulates more than 160 interior dimensions for characterizing passenger and
luggage compartments and almost 100 exterior dimensions for determining exterior vehicle size. For
example, there are no fewer than 63 dimensions to characterize interior vehicle heights (see Figure
2).

Figure 2: Sample of interior height dimensions according to SAE J1100

                                                                                                     10
The SAE J1100 paper is quite exhaustive, and it is likely that not all measurements would be
necessary to categorize vehicle size and class. This process seems cumbersome, and it is not clear
more than 30 years after they were devised that the definitions would be appropriate for today’s
vehicle and non-U.S. body shapes.
To measure usable luggage capacity, the paper defines dimensions for a standard luggage set that
has to be placed inside the luggage compartment. This luggage set consists of four women’s
suitcases, two men’s suitcases and dimensions of a golf bag. Some motoring media have adopted a
similar approach for comparing cargo capacity.
Specialized media approach for classifying vehicle sizes
To compare vehicle sizes, dimensions are often not enough, with inner and outer shapes being curvy
and not continuous. The motoring press has a long history of vehicle testing for each new model
placed on the market. Loading a standard set of luggage in test vehicles allows a visual comparison of
cargo capacity (see Figure 3).
Figure 3: Online media using standard set of luggage to compare luggage capacity (Km77.com, 2017)
Journalists sometimes use a similar approach for passenger compartment, posing seated to show the
interior space (see Figure 4). This does not provide a robust way to classify vehicle sizes. To be fully
consistent, the same set of luggage and, more challenging, the same person would have to be used in
all the vehicles tested. As soon as the reference changes, all the comparative effort would lose
credibility and consistency.
Figure 4: Journalist using himself to highlight and compare rear passenger compartment size (L’argus, 2017)
11The use of SAE J1100 in fuel-economy related legislation
The U.S. DOE uses some dimensions defined in the SAE J1100 paper to group vehicles by classes
based on interior passenger and cargo volumes for cars (U.S. DOE, 2017). Gross vehicle weight is
used as the metric defining vehicle size bin for pick-ups and vans.
Though the fueleconomy.gov website outlines vehicle classes with a clear definition and metric as
used in the official EPA Fuel Economy Guide, the size classes are not consistent with such
definitions when browsing the “find a car” section of the website (see Table 1). The Oak Ridge
National Laboratory, which maintains the website, chose a different approach for the search
engine to make it easier for the consumer to identify the vehicle desired (ORNL, 2017).
Official EPA classification using interior space can sometimes be misleading and not representative
of what people would expect. For example, a Honda Civic hatchback is classified as a large car and
a Bentley Continental GT, as a sub-compact.1 The fueleconomy.gov search engine mimics the
Consumer Reports approach of vehicle segmentation and adds a price tag to separate premium
autos from mainstream sedans.
Official EPA Fuel Economy
Market classes as used in
Guide size categories
fueleconomy.gov search
based on interior and
engine
cargo size
Two-Seaters
Sedans Sedans
Small Cars
Family Sedans
Minicompact Upscale Sedans
Subcompact Luxury Sedans
Compact Large Sedans
Mid-Size Hatchbacks
Large Coupes
Convertibles
Sports/Sporty Cars
Station Wagons
Small
Station Wagons
Mid-Size
Large
Pickup Trucks
Small Pickup Trucks
Standard
Vans
Passenger Vans
Cargo
Minivans Minivans
SUVs
Small SUVs
Standard
Table 1: Size class quantified definition versus market class in search engine of fueleconomy.gov
12Industry approach for classifying vehicle sizes
The automotive industry, car manufacturers, suppliers, and most related stakeholders around the
world use segmentation to group vehicle by size class. A car segment is a group of car models of
similar size that the potential customer is likely to compare once he or she chose the type of vehicle
he or she is willing to buy.
This approach does not rely on any specific measurement of a vehicle’s size. The criteria for
attributing a vehicle to a given segment are not clearly defined and mainly reflect the direct market
competitors of a specific model. The number and naming of the segments vary and depend on the
use of the segmentation (see Table 2), and on the market share of a specific segment. For example,
the SUV segment can be split into four subcategories in the United States, but until recently it was
just one category in Europe. Once a given segment gets too big, it is usually split into more refined
categories. For example the Japanese Kei cars (microcars with engines smaller than 660 cc) represent
about 25% of the Japanese market, while the category is virtually non-existent in other regions.
Harmonizing definitions across different markets can also be challenging. For example, the Toyota
RAV4 is considered a compact SUV in the United States and a medium SUV in Europe. So market
structure also influences segment definition.
Simplified
Typical vehicle IEA segment
segmentation
Smart fortwo
A
Fiat 500
Small
Opel Corsa
B
Renault Clio
Toyota Corolla
C Medium
VW Golf
Honda Accord
D
Mercedes C Class
BMW 7 series
E Large
Buick Lacrosse
Porsche Carrera
F
Bentley Arnage
Wuling Zhiguang
Micro truck
Maruti / Suzuki Wagon R
Renault Kangoo
Compact truck
Renault Modus
Big
Toyota RAV4
Medium Truck
Suzuki Gran Vitara
Audi Q7
Large Truck
Chevrolet Silverado
Table 2: Example of market segmentation used for GFEI analysis (IEA, 2011 and IEA, 2017)
Even though market segmentation as a proxy for vehicle size seems to be the most widely used
method for classification, it is subjective and limited. This is especially true with the multiplication of
segments and with some manufacturers marketing vehicles as cross-overs straddling two segments.
The first generation Nissan Qashqai, for example, was designed to slot in between a sedan and an
SUV. Classifying such models poses a challenge as there is no quantifiable way to separate one
13segment from the other. Some OEMs even switch segments for similar models. For example, the first
generation of the Peugeot 2008 was marketed as a cross-over, and the only slightly modified second
generation is now marketed as an SUV (AutoNews, 2016).
Rental agencies’ classification system
The Association of Car Rental Industry Systems Standards (ACRISS) provides a standard coding system
to provide harmonized information about the type of vehicle rented, regardless of the brand and
model. The ACRISS code is a sequence of 4 digits that characterize a rental vehicle (see Table 3). The
number of variants has recently been extended to better define vehicle type, class, transmission, and
fuel.
CATEGORY TYPE TRANSMISSION/DRIVE FUEL/AIR COND.
Manual Unspecified Unspecified Fuel/Power
M Mini B 2-3 Door M R
Drive With Air
Unspecified Fuel/Power
N Mini Elite C 2/4 Door N Manual 4WD N
Without Air
E Economy D 4-5 Door C Manual AWD D Diesel Air
Auto Unspecified
H Economy Elite W Wagon/Estate A Q Diesel No Air
Drive
C Compact V Passenger Van B Auto 4WD H Hybrid Air
D Compact Elite L Limousine D Auto AWD I Hybrid No Air
I Intermediate S Sport E Electric Air
Intermediate
J T Convertible C Electric No Air
Elite
S Standard F SUV L LPG/Compressed Gas Air
LPG/Compressed Gas No
R Standard Elite J Open Air All Terrain S
Air
F Full size X Special A Hydrogen Air
G Full-size Elite P Pick up Regular Car B Hydrogen No Air
P Premium Q Pick up Extended Car M Multi Fuel/Power Air
U Premium Elite Z Special Offer Car F Multi fuel/power No Air
L Luxury E Coupe V Petrol Air
W Luxury Elite M Monospace Z Petrol No Air
O Oversize R Recreational Vehicle U Ethanol Air
X Special H Motor Home X Ethanol No Air
Y 2 Wheel Vehicle
N Roadster
G Crossover
K Commercial Van/Truck
Table 3: ACRISS car codes definitions
Note: For example, an ACRISS code CDMV would be a compact 4-5 door gasoline car with manual transmission and air-
conditioning.
14Strengths and weaknesses of approaches for classifying vehicle size
Characterizing quantitatively the size of vehicles is doable, with some standards and guidelines
published for measuring vehicle size in every detail. Choosing the right metric for classifying vehicles
by size is much more challenging, as focusing on interior or exterior size would lead to completely
different outcomes, as shown by the approaches used in the United States by the EPA and
fueleconomy.gov. The segmentation approach seems to be the most consistent, even though it uses
a more qualitative approach with no quantified threshold between segments (see Table 4). The
multiplication of vehicle models that are designed and marketed between segments can also lead to
inconsistent classification.
Vehicle size
measurement Description Pros Cons
approach
- Many dimensions to be
- Accurate
Measuring all measured
SAE J1100 - Robust
vehicle - Which ones to choose to
guidelines - Extensive and
dimensions characterize vehicle size?
comprehensive
- Best metric varies by vehicle
- Choice of luggage and passenger
might impact the size
- Comparability
Specialized Standard luggage appreciation
- Good for photo/media
media and passenger - Same set of luggage and
support
passenger must always be
available
- Subjective approach with no
Based on model - Easily understandable
Industry common metric to split segments
portfolio and - Matches customer
Segmentation - Model multiplications making
competitors expectations
thresholds unclear
- Common approach and
- Parameters specific for the
definition for most
4 digits to rental companies, not ideal to be
Rental rental companies
characterize used for other purposes
agencies - A single institution
vehicle types - Updating codes triggers break in
decides how to classify
series
vehicles
Table 4: Pros and cons of each vehicle size measurement and categorization approach
15Interior versus exterior sizes: Some extreme examples
If all body shapes were similar, then the bigger the exterior size, the bigger the interior size
would be. This is not the case as auto makers sometimes put vehicles on the market that defy
such a principle.
In a sample of more than 250 U.S. models, a proxy for exterior volume (length*width*height)
was charted against a proxy for interior size (front and rear seat room). For the vehicles
analyzed, there was no robust trend correlating bigger exterior size with greater interior size
(see Figure 5).
30
25
Exterior size proxy(m3)
20
15
10
5
0
0 0.1 0.2 0.3 0.4 0.5 0.6 0.7 0.8 0.9
Interior size proxy (m3)
Figure 5: Exterior versus interior size comparisons for U.S. models (Consumer Reports, 2017)
The analysis turned up outliers that can be considered extreme cases. For big interior volumes
with relatively modest exterior sizes, the Ford Transit Connect (derived from a light commercial
vehicle) has by far the highest ratio, followed by the Jeep Renegade. On the other side of the
scale, the Chevrolet Camaro and the Hyundai Veloster have the smallest interior size relative to
exterior size.
16Vehicle size and fuel economy policies
Fuel economy policies are classified in three main categories (IEA, 2012):
• Fiscal measures: To overcome higher upfront costs of more efficient technologies and to
provide incentives to purchase higher performing vehicles.
• Information and labeling: To overcome the information gap and raise awareness about fuel
economy.
• Standards: To overcome market failure where consumers do not value fuel economy.
Such policies are aimed at encouraging drivers to buy and drive more fuel-efficient vehicles to
decrease reliance on fossil fuels and reduce greenhouse gas emissions.
Existing fiscal policies including fuel taxes, registration, and ownership taxes are not based on vehicle
size. The main metrics for setting taxation are vehicle price, CO2 emissions, engine capacity, or
power. In Europe, only Malta uses vehicle length as a criteria for a vehicle purchase tax (ACEA, 2016).
Most fuel-economy labels use either absolute fuel economy or CO2 emissions to classify vehicle
energy efficiency (APEC/ICCT, 2016). Some countries, such as Switzerland and Germany, use weight
to create vehicle categories. Spain uses footprint to make a relative vehicle comparison for the
purpose of fuel-economy labeling (Ricardo, 2016).
All fuel-economy standards use a corporate average approach, combined with the use of a
parameter to take different market strategies among car manufacturers into account. Indeed, some
brands specialize in certain segments, for example selling only large, premium cars or specializing in
small vehicles. Average vehicle size differences among manufacturers has been taken into account
under fuel economy standards adopted globally.
Vehicle weight or footprint is used as a proxy to characterize vehicle size in fuel-economy standards
adopted around the world (TransportPolicy.net, 2017).
Why are weight and footprint the main metrics used as a proxy for vehicle size?
When developing fuel-economy standards, lawmakers have considered several metrics to represent
vehicle size. They include interior volume, weight, footprint, shadow (length*width of the vehicle),
and volume (length*width*height of the vehicle). Qualitative assessments of potential parameters
have already been carried out, highlighting the pros and cons of each option (see Table 5).
17Table 5: Overview of potential index parameters including qualitative assessment (ICCT, 2011)
Two-thirds of the nine markets that have adopted fuel-economy standards use weight as a proxy for
vehicle size. The three that don’t – the NAFTA group of the United States, Canada, and Mexico – use
footprint instead. Although weight doesn’t rank as the most robust parameter, one reason it is
widely used might be that data is usually easily available and practical to collect and manipulate.
18Are vehicle size, vehicle footprint, and weight a close match?
Interior and exterior sizes, though complicated to calculate accurately, are available for a large
sample of U.S. models (Consumer Reports, 2017). To assess whether weight and footprint are
representative of vehicle size, interior and exterior sizes have been plotted against weight and
footprint. Interior size, calculated as the sum of front and rear seat room, cannot easily be linked to
either weight, footprint, or segmentation (see Figure 6). For a similar interior size, many different
vehicles are available covering a broad spectrum of weight, footprint, and segment. So interior size
has no strong link with other proxies for vehicle size.
Figure 6: interior size versus footprint and weight, by segment
Exterior size, calculated as the product of a vehicle’s length, width, and height, is much more closely
correlated with weight and footprint, and the higher average height of big vehicles (SUVs, pick-ups
and vans) show clearly (Figure 7).
Figure 7: Exterior size versus footprint and weight, by segment
Note: Big vehicles include SUVs, MPVs and pick-ups
No evidence has been found in the public domain on whether consumers put more value in
purchasing decisions on interior or exterior size. But the data show that interior space is not a good
proxy for vehicle size as it does not correlate with other proxies such as exterior size, weight, or
footprint.
For policy purposes, weight and footprint do show some linearity (see Figure 8), as the larger the
footprint, the heavier the vehicle. This has been true over a period of years for models sold globally,
based on data from the GFEI database. Global average weight and footprint increased significantly
from 2010 to 2015, with smaller and lighter cars in emerging markets partially offsetting vehicle size
growth in mature markets.
19Figure 8: Footprint versus weight for all models sold globally in the last decade
Note: Only models selling more than 1,000 units a year have been included.
Even though the linearity is acceptable (R² = 0.75), there is ample deviation around the average
values, showing the large discrepancy of weight for a given footprint, or of footprint for a given
weight. The evolution of each parameter in a top-down, holistic approach is worth looking at to
analyze how each has evolved over time.
Macro Analysis: Macroscopic trends in weight and footprint
Methodological approaches
The GFEI database uniquely compiles sales, type-approval fuel economy, and most vehicle attributes
model by model on more than 80% of light-duty vehicles sold worldwide (GFEI, 2017). It is based on
the authoritative IHS Markit sales and registration database (IHS Markit, 2016), upgraded by GFEI
members to include weight, footprint, and fuel economy in countries where the information is
missing. It covers new vehicle registrations and sales for 2005, 2008, and 2010 to 2015. For 2005 and
2008, there is only partial data for weight and footprint. Most of the analysis is based on the 2010 to
2015 period.
To analyze weight and footprint evolution globally, several additional features have been added to
the GFEI database, including:
• OEM origin: OEMs have been classified by region of origin. For example, all Toyota vehicles
are classified as originating in Japan, VW from Europe, and GM from the United States. For
Chinese joint ventures, the country of origin of the foreign partner has been assumed. PSA-
Dongfeng, for example, is classified as originating in Europe, as most models sold by the
venture are usually derived from European models. Purely Chinese OEMs, such as Great Wall
or BYD, are counted as Chinese.
20• OEM type: OEMs have also been classified into three categories: low-cost, mainstream, and
premium. This differentiation is based on the average vehicle price for each OEM taken from
the latest price analysis (GFEI, 2017). The threshold between low-cost and mainstream
manufacturers was set at U.S. $17,000, ensuring that certain OEMs such as Dacia in Europe
are included in the low-cost category. The dividing line between mainstream and premium
OEMs was set at $50,000, placing producers such as Volvo in the premium range. With those
thresholds, mainstream OEMs represent 80% of annual global registrations. Most Chinese
OEMs are in the low-cost category. Annex I shows average vehicle prices by OEM.
All the analysis below is sales-weighted, representing a macroscopic market approach. A more
microscopic analysis, making comparisons at the vehicle level, appears in the following section. The
macro analysis includes all light-duty vehicles, both for passenger and commercial applications,
especially because of the high share of LCVs in the United States and the high use of LCVs, such as
pick-ups, for passenger transport.
Weight and footprint evolution
By region
Average light-duty vehicle weight across different regions globally has not changed significantly over
the past decade. Even though partial data is available in this time frame, this is due to a decrease in
size and weight from 2005 to 2010. From 2010 to 2015, when the weight and footprint data were
collected in a more systematic and robust way, weight increased by 5%. The trend was similar for
average global footprint, with a 3% increase over the five years. In regions where heavier vehicles
were sold, in North America, autos are slowly becoming lighter and smaller, and in regions where
lighter vehicles were sold, such as India and Latin America, autos are getting heavier and bigger. So it
over time vehicle weight and footprint are converging and slowly expanding (see Figure 9).
Figure 9: Weight and footprint evolution by region of registration, 2005 to 2015
China recorded a sharp increase in average weight and footprint over the decade and by 2015
matched Europe on those metrics. This reflects a rising share of sales of vehicles from joint venture
manufacturers mostly from Europe or the United States, which have higher average weights and
footprints (see Figure 14).
By Origin of auto manufacturers
Chinese manufacturers increased the average weight of their vehicles by almost 300 kg (+30% over
the 10-year period) and footprint by 20% over the 10 years (see Figure 10). Vehicles from Indian
21OEMs remain the lightest and smallest. Despite the local market for small vehicles in Japan, Japanese
OEMs are selling cars around the globe that have a weight similar to that of the average vehicle from
European OEMs. Only Korean OEMs continuously decreased the average weight of their vehicles by
about 150 kg, with a stable footprint.
Only Korean OEMs reduced average Chinese OEMs quickly increasing
vehicle weight from 2010 to 2015 weight and footprint
Figure 10: Average vehicle weight and footprint by OEM region of origin
By auto manufacturer type
Low-cost vehicles expanded significantly in weight and footprint over the decade, gaining more than
200 kg, driven by the Chinese OEMs (see Figure 11). There is a significant weight and footprint gap
between the average premium car and the average low-cost vehicle, amounting to more than 500 kg
and almost 1m2. The weight difference between mainstream and premium vehicles is much larger
than the footprint difference. Small luxury cars marketed by premium brands such as the Audi A1
and the Aston Martin Cygnet did not yet represent a significant part of premium OEMs’ market
share.
Huge gap between low-cost
and premium OEMs
Figure 11: Weight and footprint evolution by OEM type
By fuel type
Analyzing vehicle attributes and specifications, the average diesel vehicle was around 200 kg heavier
than its gasoline equivalent in 2015 (see Figure 12). Electric vehicles, including battery electric
vehicles (BEVs) and plug-in hybrid electric vehicles (PHEVs) quickly gained weight as footprints
appeared to stabilize.
22Weight and footprint
increase of PHEVs and BEVs
Figure 12: Weight and footprint evolution by fuel type
By power
Classifying vehicles by power bins shows that the average weight of identically powered vehicles has
been slowly decreasing, compensated by a gradual average power increase so that the global
average weight slowly increases (see Figure 13). Footprint by power bins was remarkably stable
except in the top power category, where the average footprint decreased.
Figure 13: Average weight and footprint by power bin (kW)
How OEMs alter fleets depending on region
The enhanced database shows how OEMs adapt their model ranges by region of sale. The major
exporting OEMs are based in Japan, Korea, Europe, and the United States. India and China
manufacturers are mainly local-market players and did not export a significant share of production
during the study period.
OEMs have different strategies for adapting their vehicles by market. Japanese OEMs have the
smallest, lightest vehicles in their home market but sell the largest, heaviest autos in Africa and Latin
America. U.S. OEMs are always among the top two groups for largest, heaviest vehicles, regardless of
the market – and especially so in North America (see Figure 14).
23Japanese OEMs the biggest
GM taking over Daewoo
Japanese OEMs the smallest
Chinese OEMs on par with
foreign OEMS
24U.S. OEMs the biggest
U.S. OEMs the biggest
Figure 14: Weight and footprint evolution by region and OEM country of origin
To analyze the evolution of vehicle footprint and weight as compared with powertrain specifications,
we developed these indicators:
• kW/t: The ratio of rated engine power to weight. A high power-to-weight ratio enables fast
acceleration, usually for sporty vehicles. A low power-to-weight ratio indicates under-powered
autos that are not capable of fast acceleration.
• kW/m²: The ratio of rated engine power to footprint. It shows the power impact of high SUV
share, as such vehicle have a similar footprint than their traditional equivalent, but much heavier.
Indian OEMs emerged as building vehicles with a much lower power-to-weight ratio than those of
any other region (see Figure 15). This coincides with India’s exhaust emission certification test having
a lower maximum speed than that of any other region (Sharma, 2013). U.S. OEMs sold the highest-
powered vehicles, especially with respect to footprint. This reflects the high proportion of U.S. SUVs,
which are heavier (thus higher power requirements) than other types of vehicles with similar
footprints (see Figure 7).
25U.S. vehicles over-powered
Indian vehicles under-powered
Figure 15: Power-to-weight and power-to-footprint by OEM origin
Engine downsizing: Benefits for vehicle size?
There has been a strong trend toward reducing engine size in recent years with the
implementation of fuel-efficiency technologies such as turbochargers and high-pressure fuel
injection systems. Even though most OEMs in Europe (Frost, 2010), Japan, and the United
States have downsized engine line-ups, sales-weighted average engine size has stagnated
globally since 2010, especially for the OEMs that represent more than 80% of global sales (see
Figure 16).
This is because:
• Average vehicle size has increased, requiring bigger and more powerful engines.
• Engine downsizing is coupled with increased power density, making engines more
powerful.
Engine downsizing has really been effective for premium cars and large engines, with average
engine size of premium cars dropping by almost 500cc from 2005 to 2015 (see Figure 16). On
the other hand, low-cost cars have increased in average engine size, along with the growth of
vehicles, as technologies allowing for engine downsizing have usually not been implemented for
such vehicles.
3500
80
Power density (kW/L)
70 3000
Engine size (cc)
60 2500
50 2000
40
1500
30
1000
20
10 500
0 0
2005 2008 2010 2011 2012 2013 2014 2015 2005 2008 2010 2011 2012 2013 2014 2015
Low Cost Mainstream Premium
Figure 16: Average power density and engine size, by OEM type
So globally, engine downsizing had very little or no impact on vehicle size, and recent news
suggests that the industry is likely to stop engine downsizing in favor or a more resilient “right-
sizing” concept (Honeywell, 2015) for turbocharged engines.
26Tracking sales-weighted averages over time shows how the composition of the global vehicle market
changes slowly, reflecting strong market inertia. Even the fastest-growing emerging markets don’t
help move the needle because these markets usually rely on old or existing vehicle platforms from
mature markets. One notable, quickly unfolding evolution is the global spread of SUVs, which were
limited initially to the U.S. market. The market share of SUVs more than doubled over the 2005-2015
period from 12% to more than 25%. Hatchbacks and van/multi-purpose vehicles (MPVs) lost market
share (see Figure 17).
Figure 17: Global market share by body style, 2005 to 2015
Micro analysis: Top sellers’ weight and footprint evolution
Some manufacturers retain the same model names over multiple generations, making evolution of
weight and footprint easy to track and compare. For this analysis, we selected vehicles based on
availability in several regions and on cumulative global sales over generations. In the GFEI database,
the Ford Focus topped global sales from 2005 to 2015 (see Table 6). The analysis follows not only
vehicle footprint and weight over time but also body variation, showing the impact of body design on
vehicle footprint and weight. For example, BMW in the early 2000s added the X-line SUV design
based on the same platform as a sedan.
Vehicle selection and market representation
Some OEMs produce similar vehicles that could in theory be compared over time but change the
name for each new vehicle generation. For example, Peugeot uses a number that increases for each
vehicle generation, such as the Peugeot 205, 206, 207, and the current 208. In some cases, we have
selected vehicles that have changed names over their lifetime, but tried to choose models that have
long-lasting names.
Other OEMs use the same names for completely different vehicles. Toyota, for example, has long
applied the Corolla brand to separate designs marketed in the United States, European, and Japan.
27Even though designs might differ, we have considered the vehicles to be of equivalent size/segment
and all models with identical name were added together.
2005 – 2015
Average
annual
registrations
Ford Focus 590 000
Toyota Corolla 565 000
Ford Fiesta 536 000
Honda Civic 530 000
Toyota Camry 512 000
Ford F-150 502 000
VW Golf 502 000
Wuling Zhiguang 500 000
Honda CR-V 414 000
VW Polo 375 000
Table 6: Top 10 model registrations in the GFEI database
We selected the models in Table 7 for analysis as a representative sampling covering different OEMs,
OEM origins, brand types, and segments. The comparison covers several decades, starting as early as
1958, and includes as many as 11 generations.
First Number of
OEM Model main Model
Brand Model name introduction vehicle
origin markets segment
(year) generations
Europe/Latin
Ford U.S. Escort / Focus Medium 1968 9
America/U.S.
Volkswagen Europe Golf Europe Medium 1974 7
Japan/
Toyota Japan Corolla Medium 1966 11
ASEAN/Europe
Europe/
BMW Europe 3 Series Medium 1975 6
U.S./China
Chevrolet U.S. Impala/Caprice U.S. Large 1958 11
Honda Japan Civic Global Small 1972 10
Europe/Latin
Renault Europe 5/Clio Small 1990 4
America
Europe/Latin
Opel Europe Corsa Small 1983 5
America
Voyager / Town
Chrysler U.S. U.S./Europe Big 1984 6
and Country
U.S./Europe/
Toyota Japan Prius Medium 1997 4
Japan
Table 7: Vehicles selected for size and weight comparison over generations
Comparing pick-ups over generations (such as the popular Ford F-150 or Toyota HiLux) would have
been interesting given their high sales volumes and growing market shares. But doing so would be
28complex because these vehicle are usually available is many configurations of wheelbase,
transmission type, and other attributives that have a significant impact on footprint and weight. Such
vehicles therefore have not been included in the analysis. SUVs are included, when possible, as a
variant of the conventional sedan model to highlight the footprint and weight increases for vehicles
that are usually aimed at the same customers.
All weight and size evolution charts for each vehicle selected are available in Annex I.
50 years of emblematic models’ size and weight evolution
Over 50 years, the analysis by model shows that weight has been the parameter that increased the
fastest generation after generation. Only the large Chevrolet Impala/Caprice decreased in weight
from the 1960s, especially after the oil crises of the 1970s and the early 2000s. Even though the
vehicle sample is not representative of the trends highlighted in the macro analysis, the larger the
vehicle, the lower the rate of weight increase over 40 to 50 years on the market (see Figure 18). The
Honda Civic is the vehicle that increased the most in weight since its market introduction in 1972, up
by more than 90% for the last generation launched in 2017. The Impala held at almost the same
weight from first to last generation, with some ups and downs in between.
Figure 18: Weight evolution from market introduction of typical long-lasting model names
Most of the models in the analysis increased in weight by more than 50% over about 40 years. For
the medium-sized vehicles, the most-represented category, weight seemed to stabilize in the past
two decades. Premium vehicles initiated this stabilization earlier than mainstream competitors.
Designers of some models, such as the VW Golf, deployed weight-reduction strategies for the last
generation that partly compensated for the more significant weight increases of previous
generations. Indeed, all mainstream models in the analysis – the Golf, Corolla, and Escort/Focus –
have gained weight in similar proportion from first to last vehicle generation (see Figure 19).
29Figure 19: Medium-sized vehicles weigh evolution over generations
Impact of vehicle size increase on parking accidents and crashes
A recent study in the U.K. for insurance companies showed that crashes have dramatically
increased in parking lots (Accident Exchange, 2017). The study attributes this to the rising number
of SUVs with footprints sometimes larger than the parking spaces they occupy. Most local
authorities still follow old parking space guidelines. But rapid market evolution and the growing
popularity of large mean autos are outgrowing these spaces (see Figure 20).
Figure 20: Example of Large SUV versus average parking space size in the U.K. (Accident Exchange, 2017)
Such size increases trigger many crashes in parking lots, costing car insurance companies £1.4
billion in the U.K. in 2015. Accidents in parking lots now account for 30% of all collisions,
following a 35% jump from 2014.
30One of the first popular MPVs, the Chrysler Voyager/Town and Country, had a slightly lower-than-
average increase in footprint and weight over its more than 30 years on the market (see Annex I).
That ended with a significant footprint increase for the latest Pacifica, which replaced the outdated
Voyager (see Figure 21). MPVs have lost market share since the early 2000s and have virtually
disappeared in most markets, being replaced by bigger, heavier, though not roomier SUVs. With the
revived Renault Espace and new Chrysler Pacifica, some OEMs are trying to make MPVs attractive
again.
Figure 21: Longer and taller: side view of 1984 Voyager versus 2017 Pacifica (Car and Driver, 2017)
Environmentally friendly vehicles that are sold and marketed as such are no exception to the trend of
increased weight and footprint over generations. The most popular of this category, the Toyota Prius,
increased in weight by 20% and in footprint by 10% over the first three generations. The fourth and
latest generation reversed that trend with a 10% weight reduction and a smaller footprint increase
(see Figure 22).
Figure 22: Weight and size evolution of the most popular hybrid vehicle, the Toyota Prius, over four generations
31SUVs: Game changers to size and weight evolution
The strong and still-growing demand for SUVs reflects higher seating position and better visibility
together with better handling and driving dynamics that are now close to those of sedans
(AutomotiveNews.com, 2015). The vast majority of OEMs now offer SUV variants to their traditional
sedan/hatchback line-ups. To minimize cost, most OEMs use similar vehicle platforms and diversify
body types to cover a wider portfolio of body options. So for one platform, potential buyers who had
only a sedan or a hatchback as a choice in the past can now choose among sedan/hatchback, MPV,
and SUV options.
Even though the size of the sedan versions has stabilized in the past decade or so, and sometimes
light-weighting strategies have been deployed, the MPV and SUV alternatives are much taller, and as
a consequence heavier. Footprint is usually similar for all body styles within vehicle families as the
vehicle platform is the same. Thus, based only on footprint, the shift to MPVs and SUVs seems almost
invisible.
This is a reason why footprint-based emissions policies may be more effective than weight-based
policies. Under a weight-based policy, the CAFE limit for CO2 goes up with the increase in weight
from sedan to SUV. Under a footprint-based scheme, the CAFÉ target wouldn’t rise, and the heavier
SUV would be held to the same emissions standard as the lighter sedan.
One consequence of MPV and SUV variants is that such vehicles undermine efforts to limit or
decrease the weight of vehicles in the interest of reducing total emissions. Switching from sedan to
MPV and SUV is equivalent to 20 years and three generations of weight evolution (see Figure 23). All
weight reduction efforts recently deployed by some OEMs are offset by the increase in SUV market
shares and the weight they add.
Fuel economy policies should discourage increased market share for SUVs. Today’s weight-based
standards do not accomplish that.
Figure 23: Ford midsize vehicle weight and size evolution, together with MPV and SUV variants
32Fuel economy tests favor SUVs
Fuel-economy measurements show that there is a wider gap for MPVs and SUVs between
certification test findings and real-life results than for traditional sedans and hatchbacks. That is
because average road speeds are significantly higher than those in certification tests (ICCT, 2016,
T&E, PSA, 2017).
Because of their larger frontal areas (see Figure 24), the aerodynamics of MPVs and SUVs are usually
worse than for sedans with comparable footprints. Certification tests do not fully account for this
aerodynamic handicap, which is proportional to velocity squared, because of the lower certification
speeds than on-road averages.
Having real-life tests as part of fuel economy certification tests would make displayed fuel economy
for SUVs more realistic.
2012 Opel Mokka
2011 Opel Meriva
2014 Opel Corsa
1983 Opel Corsa
Figure 24: Frontal areas of Opel Corsa and its body variants
Why do models continuously increase in size?
For nearly all models studied, the footprint, height, and weight have all increased from generation to
generation (see Annex I). The one exception was the U.S. Chevy Impala, whose footprint in 2014 was
15% smaller than that of the 1959 model. Oil crises in the 1970s and early 2000s forced American
OEMs to reduce vehicle size in response to demand for more fuel-efficient vehicles. Nonetheless, the
United States still produces and sells the largest vehicles by far (see Figure 10 and Figure 14).
All other models in the analysis expanded dramatically in footprint and weight, so much so that some
models have changed segment from generation to generation. For example, the original VW Golf
from the mid-1970s is smaller than today’s Polo, though the Polo is marketed in the next-smaller
segment than the current Golf (see Figure 25).
33You can also read