Mobility on Demand (MOD) Sandbox Demonstration: Vermont Agency of Transportation (VTrans) OpenTripPlanner
←
→
Page content transcription
If your browser does not render page correctly, please read the page content below
Mobility on Demand (MOD)
         Sandbox Demonstration:
Vermont Agency of Transportation
        (VTrans) OpenTripPlanner
                   Evaluation Report

                       FEBRUARY 2021

                                FTA Report No. 0185
                        Federal Transit Administration

                                         PREPARED BY

                                    Elliot Martin, Ph.D.
                                     Aqshems Nichols
                                           Adam Cohen
                                  Susan Shaheen, Ph.D.
                          Transportation Sustainability
                                      Research Center
                      University of California, Berkeley

                                            Les Brown
                                                   ICF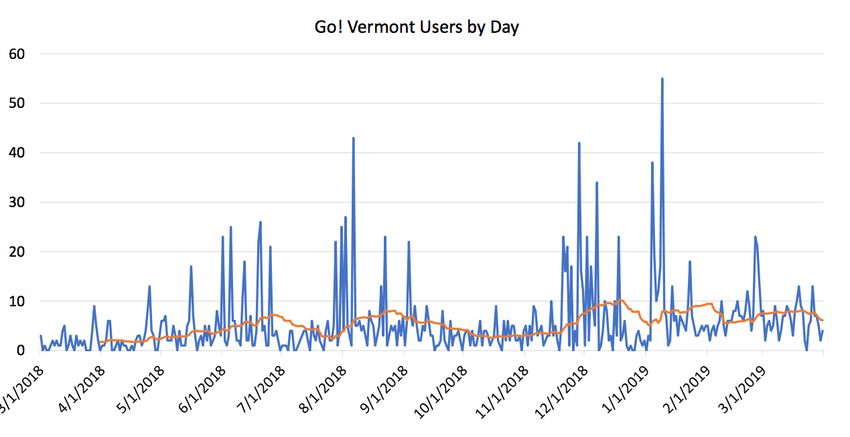
COVER PHOTO
Courtesy of Edwin Adilson Rodriguez, Federal Transit Administration

DISCLAIMER
This document is disseminated under the sponsorship of the U.S. Department of Transportation in the interest of information
exchange. The United States Government assumes no liability for its contents or use thereof. The United States Government
does not endorse products or manufacturers. Trade or manufacturers’ names appear herein solely because they are considered
essential to the objective of this report. The opinions and/or recommendations expressed herein do not necessarily reflect those
of the U.S. Department of Transportation.
Mobility on
Demand (MOD)
Sandbox
Demonstration:
Vermont Agency
of Transportation
(VTrans)
OpenTripPlanner
Evaluation Report

FEBRUARY 2021
FTA Report No. 0185

PREPARED BY

Elliot Martin, Ph.D.
Aqshems Nichols
Adam Cohen
Susan Shaheen, Ph.D.
Transportation Sustainability Research Center
University of California, Berkeley
408 McLaughlin Hall, Berkeley, CA 94720
Les Brown
ICF
9300 Lee Highway, Fairfax, VA 22031

SPONSORED BY

Federal Transit Administration
Office of Research, Demonstration and Innovation
Office of the Assistant Secretary for Research and
Technology, Intelligent Transportation Systems (ITS)
Joint Program Office (JPO)
1200 New Jersey Avenue, SE
Washington, DC 20590

AVAIL ABLE ONLINE

https://www.transit.dot.gov/about/research-innovation
                     FEDERAL TRANSIT ADMINISTRATION     i
           FEDERAL TRANSIT ADMINISTRATION               i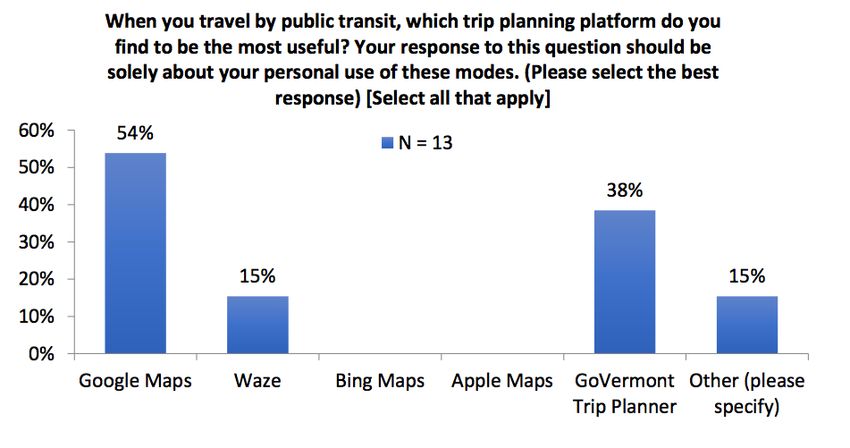
Metric Conversion Table

SYMBOL    WHEN YOU KNOW              MULTIPLY BY              TO FIND              SYMBOL

                                      LENGTH

  in            inches                    25.4                millimeters            mm

  ft              feet                   0.305                  meters                m

  yd             yards                   0.914                  meters                m

  mi             miles                    1.61                kilometers             km

                                      VOLUME

 fl oz        fluid ounces               29.57                 milliliters           mL

 gal            gallons                  3.785                    liter                   L

  ft3          cubic feet                0.028               cubic meters             m3

 yd3          cubic yards                0.765               cubic meters             m3

                NOTE: volumes greater than 1000 L shall be shown in m3

                                        MASS

  oz            ounces                   28.35                  grams                 g

  lb            pounds                   0.454                kilograms               kg

                                                              megagrams
  T       short tons (2000 lb)           0.907                                    Mg (or “t”)
                                                           (or “metric ton”)

                             TEMPERATURE (exact degrees)

  o                                    5 (F-32)/9                                     o
      F       Fahrenheit                                        Celsius                   C
                                      or (F-32)/1.8

                                                                   FEDERAL TRANSIT ADMINISTRATION    i
                                                              FEDERAL TRANSIT ADMINISTRATION        ii
1. Form Approved
REPORT DOCUMENTATION PAGE OMB No. 0704-0188
The public reporting burden for this collection of information is estimated to average 1 hour per response, including the time for reviewing instruc-
tions, searching existing data sources, gathering and maintaining the data needed, and completing and reviewing the collection of information. Send
comments regarding this burden estimate or any other aspect of this collection of information, including suggestions for reducing the burden, to
Department of Defense, Washington Headquarters Services, Directorate for Information Operations and Reports (0704-0188), 1215 Jefferson Davis
Highway, Suite 1204, Arlington, VA 22202-4302. Respondents should be aware that notwithstanding any other provision of law, no person shall be
subject to any penalty for failing to comply with a collection of information if it does not display a currently valid OMB control number.
PLEASE DO NOT RETURN YOUR FORM TO THE ABOVE ADDRESS.
1. REPORT DATE 2. REPORT TYPE 3. DATES COVERED
February 2021 Evaluation Report January 2017–March 2019
4. TITLE AND SUBTITLE 5a. CONTRACT NUMBER
Mobility on Demand (MOD) Sandbox Demonstration: Vermont Agency of Transportation 5b. GRANT NUMBER
(VTrans) OpenTripPlanner, Evaluation Report DTFH61-16-D-00052L
5c. PROGRAM ELEMENT NUMBER
6. AUTHOR(S) 5d. PROGRAM NUMBER
Elliot Martin, Aqshems Nichols, Adam Cohen, Susan Shaheen (UC Berkeley); Les Brown (ICF) 5e. TASK NUMBER
5f. WORK UNIT NUMBER
7. PERFORMING ORGANIZATION NAME(S) AND ADDRESSE(ES) 8. PERFORMING ORGANIZATION REPORT
NUMBER
Transportation Sustainability Research Center (TSRC) ICF
FTA Report No. 0185
University of California, Berkeley 9300 Lee Highway
408 McLaughlin Hall Fairfax, VA 22031
Berkeley, CA 94720
9. SPONSORING/MONITORING AGENCY NAME(S) AND ADDRESS(ES) 10. SPONSOR/MONITOR'S ACRONYM(S)
U.S. Department of Transportation Office of the Assistant Secretary for Research FTA
Federal Transit Administration and Technology,
Office of Research, Demonstration Intelligent Transportation Systems (ITS) 11. SPONSOR/MONITOR'S REPORT NUMBER(S)
and Innovation Joint Program Office (JPO)
1200 New Jersey Avenue, SE U.S. Department of Transportation
Washington, DC 20590 1200 New Jersey Avenue, SE
Washington, DC 20590
12 . DISTRIBUTION/AVAILABILITY STATEMENT
Available from: National Technical Information Service (NTIS), Springfield, VA 22161; (703) 605-6000, Fax (703) 605-6900,
email [orders@ntis.gov]; Distribution Code TRI-30
13. SUPPLEMENTARY NOTES NOTES [www.transit.dot.gov/research-innovation/fta-reports-and-publications] [https://www.transit.dot.gov/about/
research-innovation] [https://doi.org/10.21949/1520671]. Suggested citation: Federal Transit Administration. Mobility on Demand (MOD)
Sandbox Demonstration: Vermont Agency of Transportation (VTrans) OpenTripPlanner, Evaluation Report. Washington, D.C.: United States
Department of Transportation, 2020. https://doi.org/10.21949/1520671].
14. ABSTRACT
This report documents the results of an independent evaluation of the Vermont Agency of Transportation’s (VTrans) OpenTripPlanner (OTP),
called Go! Vermont, part of the Federal Transit Administration (FTA) Mobility on Demand (MOD) Sandbox Demonstration program. The
project intended to serve as an alternative to other trip planners by including flexible transit options such as route deviation, dial-a-ride, and
other demand-responsive alternatives and to analyze web traffic data to determine the level of user activity attracted by Go! Vermont since
its launch. The evaluation compared the trip itineraries of Google Maps and the OTP and explored the inclusion of flexible transit options.
Eight hypotheses were evaluated, and expert (stakeholder/project partner) interviews highlighted VTrans partnerships with employment
services and vocational rehabilitation to leverage the trip planner for improving access to jobs, training, and healthcare for carless and car-
lite house-holds. Interviewees noted how the trip planner improved how telephone dispatchers and case workers provided transportation
information.
15. SUBJECT TERMS Mobility on Demand, MOD, sandbox, shared mobility, independent evaluation, transit trip planner, Open Trip Planner, VTrans,
demand-responsive transit
16. SECURITY CLASSIFICATION OF: 17. LIMITATION OF 18. NUMBER 19a. NAME OF RESPONSIBLE PERSON
ABSTRACT OF PAGES
a. REPORT b. ABSTRACT c. THIS PAGE 59
Unclassified Unclassified Unclassified 19b. TELEPHONE NUMBER
Standard Form 298 (Rev. 8/98)
Prescribed by ANSI Std. Z39.18TABLE OF CONTENTS
1 Executive Summary
5 Section 1: Introduction
8 Section 2: Vermont MOD Sandbox Project Summary
9 Section 3: Evaluation Approach, Planning, and Execution
13 Section 4: Evaluation Results
26 Section 5: Lessons Learned from Program Partners
31 Section 6: Conclusions
33 Appendix A: Additional Survey Results
47 Appendix B: List of Origins and Destinations Input into Trip
Planner for Comparative Testing
FEDERAL TRANSIT ADMINISTRATION ivLIST OF FIGURES
17 Figure 4-1: Transit Operator Survey – Go! Vermont Trip Planning
Comparison to Google Maps
17 Figure 4-2: Transit Operator Survey – Go! Vermont Overall Appearance
Comparison to Google Maps
17 Figure 4-3: Transit Operator Survey – Go! Vermont Display of Information
Comparison to Google Maps
18 Figure 4-4: Transit Operator Survey – Go! Vermont Quality of Travel
Options Comparison to Google Maps
19 Figure 4-5: User Survey – Most Useful Trip Planning Platform
19 Figure 4-6: User Survey – Go! Vermont Trip Planning Comparison to
Google Maps
19 Figure 4-7: User Survey – Go! Vermont Overall Appearance Comparison to
Google Maps
20 Figure 4-8: User Survey – Go! Vermont Display of Information Comparison
to Google Maps
20 Figure 4-9: User Survey – Go! Vermont Quality of Travel Comparison to
Google Maps
20 Figure 4-10: User Survey – Go! Vermont Comparison to Google Maps Based
on Usefulness
21 Figure 4-11: User Survey – Go! Vermont Improvement for Flex-Transit
Planning
21 Figure 4-12: User Survey – Go! Vermont Improvement for Overall Travel
Planning
22 Figure 4-13: Influence of Trip Planner on User Travel To Date
22 Figure 4-14: Potential Influence of Trip Planner on User Travel in the Future
Figure 4-15: Public Transit Ridership in Vermont
Figure 4-16: Users of Go! Vermont by Day
33 Figure A-1: Transit Operator Survey – Modes of Transportation
34 Figure A-2: Transit Operator Survey – Importance of Flexible Transit
Services
34 Figure A-3: Transit Operator Survey – Trip Planning Platforms Used
34 Figure A-4: Transit Operator Survey – Most Useful Trip Planning Platform
35 Figure A-5: Transit Operator Survey – Go! Vermont Use
35 Figure A-6: Transit Operator Survey – Go! Vermont Frequency of Use
35 Figure A-7: Transit Operator Survey – Go! Vermont Impression
36 Figure A-8: Transit Operator Survey – Go! Vermont Use for Flex-Transit
Trips
36 Figure A-9: Transit Operator Survey – Go! Vermont Trip Planning
Usefulness Comparison to Google Maps
FEDERAL TRANSIT ADMINISTRATION v36 Figure A-10: Transit Operator Survey – Importance of Flex-Transit Services
within Agency
37 Figure A-11: Transit Operator Survey – Go! Vermont Improvement for
Flex-Transit Planning
37 Figure A-12: Transit Operator Survey – Go! Vermont Improvement for
Overall Travel Planning
37 Figure A-13: Transit Operator Survey – Go! Vermont Improvement for
Transit Agencies
38 Figure A-14: Transit Operator Survey – Effect of Go! Vermont on
Ridership
38 Figure A-15: Transit Operator Survey – Effect of Go! Vermont on Available
Information
38 Figure A-16: Transit Operator Survey – Effect of Go! Vermont on
Operational Efficiency
39 Figure A-17: User Survey – Household Size
39 Figure A-18: User Survey – Household Relationships
39 Figure A-19: User Survey – Household Expenses
40 Figure A-20: User Survey – Vehicle Ownership
40 Figure A-21: User Survey – Vehicle Miles Driven
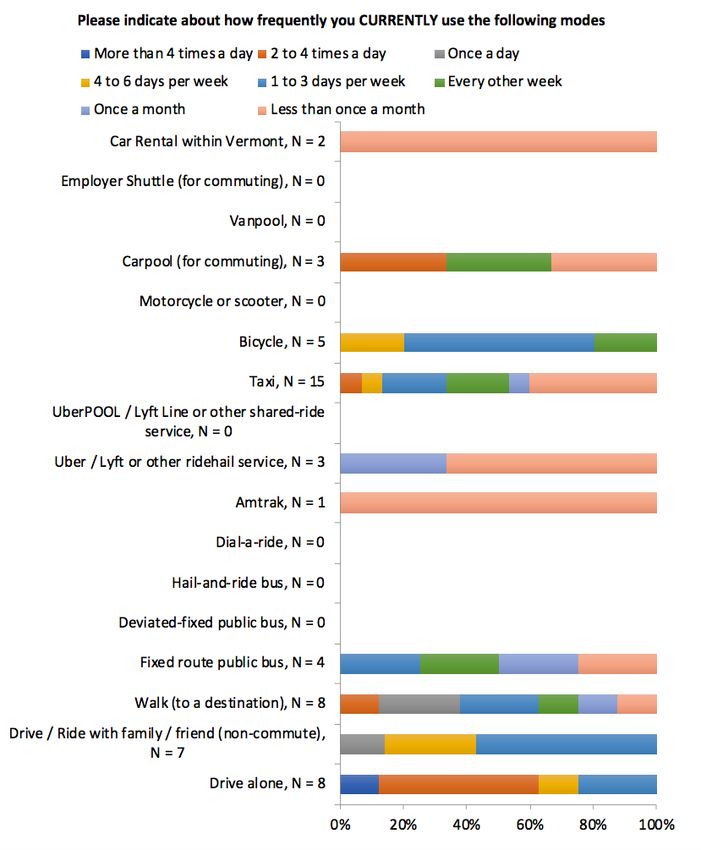
40 Figure A-22: User Survey – Modes of Transportation
41 Figure A-23: User Survey – Frequency of Modes of Transportation
42 Figure A-24: User Survey – Trip Planning Platforms Used
42 Figure A-25: User Survey – Go! Vermont Use
42 Figure A-26: User Survey – Go! Vermont Frequency of Use
43 Figure A-27: User Survey – Go! Vermont Impression
43 Figure A-28: User Survey – Go! Vermont use for Flex-Transit Trips
43 Figure A-29: User Survey – Gender
44 Figure A-30: User Survey – Wheelchair Use
44 Figure A-31: User Survey – Specialized Accommodations for
Transportation
44 Figure A-32: User Survey – Level of Education
45 Figure A-33: User Survey – Race or Ethnicity
45 Figure A-34: User Survey – Housing Type
45 Figure A-35: User Survey – Household Income
46 Figure A-36: User Survey – Present Employment
FEDERAL TRANSIT ADMINISTRATION viLIST OF TABLES
4 Table ES-1: Summary of Findings
6 Table 1-1: Overview of MOD Sandbox Projects
10 Table 3-1: Project Goals, Evaluation Hypotheses, Performance Metrics,
and Data Sources for the VTrans OTP Project
14 Table 4-1: Use Cases for Trip Planner Evaluation
15 Table 4-2: Trip Planner Evaluation Results
47 Table B-1: Comparative Testing – Origins and Destinations
FEDERAL TRANSIT ADMINISTRATION viiACKNOWLEDGMENTS
ICF and the Transportation Sustainability Research Center (TSRC) of the
Institute of Transportation Studies at the University of California, Berkeley would
like to thank the U.S. Department of Transportation for generously funding this
study. The authors also thank the transportation professionals, public agencies,
and service providers that made this research possible.
ABSTRACT
This report documents the results of an independent evaluation of the Vermont
Agency of Transportation’s (VTrans) OpenTripPlanner (OTP), called Go!
Vermont, part of the Federal Transit Administration (FTA) Mobility on Demand
(MOD) Sandbox Demonstration program. The project intended to serve as an
alternative to other trip planners by including flexible transit options such as
route deviation, dial-a-ride, and other demand-responsive alternatives and to
analyze web traffic data to determine the level of user activity attracted by Go!
Vermont since its launch. The evaluation compared the trip itineraries of Google
Maps and the OTP and explored the inclusion of flexible transit options. Eight
hypotheses were evaluated, and expert (stakeholder/project partner) interviews
highlighted VTrans partnerships with employment services and vocational
rehabilitation to leverage the trip planner for improving access to jobs, training,
and healthcare for carless and car-lite households. Interviewees noted how the
trip planner improved how telephone dispatchers and case workers provided
transportation information.
FEDERAL TRANSIT ADMINISTRATION viiiEXECUTIVE The Federal Transit Administration (FTA) is leading an initiative, the MOD
SUMMARY Sandbox Program, to explore how public transit agencies could incorporate
innovative technologies that complement and support the traditional functions
of public transit. A project in the program was the Vermont Agency of
Transportation (VTrans) OpenTripPlanner (OTP), also called Flexible Trip
Planner. VTrans, in conjunction with Cambridge Systematics and Trillium
Solutions, Inc., developed a trip planner that was intended to advance the state
of practice with respect to presenting schedule and trip planning information in
support of flexible transit systems. The new trip planner developed, called Go!
Vermont, uses General Transit Feed Specification (GTFS)-Flex data to display
flexible transit services in trip itineraries for input origins and destinations.
It was implemented exclusively as a website that could thematically adapt to
a mobile platforms. Go! Vermont’s target user audience was all residents of
Vermont, and the trip planner was intended to be of special use to residents
who live in rural areas, residents with disabilities, and older adults.
The VTrans OTP MOD Sandbox Demonstration project aimed to be an example
to other states and local municipalities of the benefit derived from integrating
flexible transit data into publicly- available trip planners. With this project,
VTrans had eight core goals:
1. Develop an online trip planner for both "fixed" and "flexible" services.
2. Improve the data presentation for transit agencies in Vermont.
3. Improve the information for transit riders in Vermont.
4. Improve mobility for Vermont transit riders.
5. Increase public transit use in Vermont.
6. Use of the statewide planner by Vermont transit riders.
7. Cut call/response time on relevant inquiries pertaining to route info and
travel options.
8. Obtain lessons learned about project implementation.
This report includes the results of an independent evaluation of Go! Vermont
web application, and explored eight hypotheses. The methods for addressing
each hypothesis including trip planning analysis, surveys, and expert (stakeholder/
project partner) interviews. Survey samples were limited in size due to the
available collection methods. The results are further discussed below.
Hypothesis 1: The application will allow users to define an origin and
destination within the state and receive transit itineraries including such
flexible options as flag stops, deviated fixed routes, and dial-a-ride.
One of the primary motivations behind the development of Go! Vermont was
that it would be able to better provide trip itineraries that integrate flexible
transit services with the fixed-route options traditionally offered on other trip
FEDERAL TRANSIT ADMINISTRATION 1EXECUTIVE SUMMARY
planners. A set of 61 origin-destination (O-D) pairs were input into both Go!
Vermont and Google Maps to compare results and gauge whether the VTrans
planner was able to provide effective flexible transit information for trips that
would otherwise be comparable to the results of a conventional trip planner.
A performance metric was developed to measure the difference in options
presented by the two planners—the number of transit operators and services
that are presented on Go! Vermont relative to Google Maps for a series of 61
pre-defined searches. The findings of the analysis suggest that more options were
presented in the Go! Vermont trip planner for the 61 randomly-generated O-D
pairs, supporting Hypothesis 1.
Hypothesis 2: Transit agencies will consider the State planner as an
improvement.
The evaluation explored the perceptions of Go! Vermont among transit
operators. An online survey (N = 13) was administered to transit operators
that contained questions asking them to provide their opinions of the tool and
also to compare the tool’s features and functionality to that of Google Maps.
Several questions were asked to gauge how public transit agencies perceived the
Go! Vermont trip planner. Across those questions, about half of respondents
reported that they felt the Go! Vermont trip planner was improvement over
Google Maps, considered to be a leading trip planner. The remaining sample did
not think the trip planner was an improvement. The results of the survey found
that Hypothesis 2 was partially supported.
Hypothesis 3: Riders will consider the new planner to be an
improvement over existing planning tools.
The perceptions of the Go! Vermont trip planner held by users in the general
public were evaluated through a user survey (N = 8), which consisted of
questions exploring product perception pertaining to specific features of the
planner such as appearance, formatting, and display of information. Overall, the
results found mixed perceptions of the platform, suggesting that its comparability
to Google Maps was about the same or weaker in some areas. It is important to
note that the sample size of the user survey was very small (N = 8). Nonetheless,
the findings did not support a confirmation of Hypothesis 3.
Hypothesis 4: The new planner will improve rider mobility among
planner users.
Hypothesis 4 evaluated whether users perceived improved mobility as a result
of the planner. The hypothesis was evaluated through the user survey that asked
questions related to functionality of the Go! Vermont trip planner. A question
was asked of users whether Go! Vermont had improved their mobility, and two
additional questions explored how the tool influenced their travel. Seven of
FEDERAL TRANSIT ADMINISTRATION 2EXECUTIVE SUMMARY
eight survey respondents reported that the trip planner had not influenced their
travel to date, and six of eight respondents reported that they thought it could
influence their travel (at some point in the future). The user survey sample size
was small (N=8), so the results could not be generalized to a broader population.
The results suggested an inconclusive finding for Hypothesis 4.
Hypothesis 5: Due to improved information, the new planner will
increase transit ridership among users in Vermont.
The survey was also designed to evaluate whether the use of Go! Vermont would
enable greater ridership of public transit. The survey asked users whether they
had changed their public transit use due to the trip planner. All respondents to
the question reported that their use of public transit was about the same due to
the trip planner, suggesting that transit ridership was not influenced by the trip
planner. The findings suggest that Hypothesis 5 was not supported.
Hypothesis 6: Web traffic to the State planner will see, on average,
at least 10 queries per day that constitute actual users searching the
platform.
Web traffic is an important level of use indicator of the trip planner. Data were
evaluated to measure the level of use that Go! Vermont experienced during the
evaluation period. This spanned site activity from March 1, 2018 to March 31,
2019. Analysis of the data showed that the average users per day was 5.3, with a
minimum of 0 and maximum of 55. Use of the trip planner was relatively steady
during most of the evaluation period, with occasional surges in use observed. It
also increased slightly during latter part of the period, although the averages still
did not exceed during the final months. Overall, the average level of users per day
was less than 10; thus, the data did not support Hypothesis 6.
Hypothesis 7: The new planner will lead to a reduced call/response
time on relevant inquiries pertaining to route info and travel options.
The intent of this hypothesis was to examine the performance of the customer
support infrastructure, particularly the Call Center, behind Go! Vermont in
terms of answering user questions concerning the tool’s outputs. Because of
data limitations, this hypothesis was not answerable, leading Hypothesis 7 to be
inconclusive.
Hypothesis 8: Lessons from project implementation can inform future
project and system designs and implementation.
Several insights were drawn from the series of expert interviews that were made
with project stakeholders. Key recommendations emerging from these interviews
were for the FTA to 1) invest in transit technology in rural communities to
bridge the technological gap between those areas and urban centers, 2) take a
FEDERAL TRANSIT ADMINISTRATION 3EXECUTIVE SUMMARY
leadership role in integrated trip planning across public transit agencies, and 3)
develop strategic methodologies that focus on the longer-term performance and
success of projects. Building on these insights and lessons learned, Hypothesis 8
was found to be supported.
The report that follows presents the detailed findings of the evaluation of the
VTrans project, with lessons learned that can potentially help advance similar
initiatives with other transit systems
Table ES-1
Summary of Findings
Hypothesis Status Key Findings
1. The application will allow users to define
The VTrans trip planner was found
an origin and destination within the state
to provide more flexible trip options
and receive transit itineraries including such Supported
for comparative trips planned within
flexible options as flag stops, deviated fixed
Vermont.
routes, and dial-a-ride.
A small sample of transit operators
2. Transit agencies will see the State planner as
Partially Supported considered the trip planner to be an
an improvement.
improvement
3. Riders will consider the new planner to
A small sample of riders did not consider
be an improvement over existing planning Not Supported
the trip planner to be an improvement.
tools.
A small sample of riders reported that
4. The new planner will improve rider mobility the planner had not improved their
Inconclusive
among planner users. mobility, but it could potentially influence
their ways of travel.
5. Due to improved information, the new A small sample of respondents reported
planner will increase transit ridership among Not supported that they used transit about the same as a
users in Vermont. result of the trip planner
6. Web traffic to the State planner will see, Web traffic increased during the
on average, at least 10 queries per day evaluation period, but neither the average
Not supported
that constitute actual users searching the nor moving average exceeded 10 users
platform. per day.
7. The new planner will lead to a reduced
Data were not available to sufficiently
call/response time on relevant inquiries Inconclusive
evaluate this hypothesis.
pertaining to route info and travel options.
8. Lessons from project implementation can A number of challenges were evaluated
inform future project and system designs Supported by the team that produced several key
and implementation. lessons learned.
FEDERAL TRANSIT ADMINISTRATION 4SECTION
Introduction
1 Overview of MOD Sandbox
Demonstrations
The Federal Transit Administration (FTA)’s Mobility on Demand (MOD) effort
developed around a vision of a multimodal, integrated, automated, accessible,
and connected transportation system in which personalized mobility is a key
feature. FTA selected 11 MOD Sandbox Demonstration projects that are
testing strategies that advance the MOD vision. In partnership with public
transportation agencies, the MOD Sandbox is demonstrating the potential for
emerging innovations to support and enhance public transportation services
by allowing agencies to explore partnerships, develop new business models,
integrate transit with MOD strategies, and investigate new, enabling technical
capabilities.
Ultimately, the evaluation of each project’s benefits and impacts will guide
the future implementation of innovations throughout the U.S. Broadly, MOD
Sandbox projects take several approaches, including the development of new
or improved trip planners, integration of new mobility services with traditional
public transportation functions, and implementation of new integrated
payment and incentive structures for travel using public transportation.
Several Sandbox projects focus on improving first/last-mile access to public
transportation through collaboration with private sector operators, including
bikesharing, carsharing, transportation network companies (TNCs, also known
as ride-sourcing and ride-hailing), and other shared mobility operators.
More information about the MOD Sandbox Program can be found at
https://www.transit.dot.gov/research-innovation/mobility-demand-mod-
sandbox-program.
Table 1-1 provides a summary of all projects in the MOD Sandbox Program.
FEDERAL TRANSIT ADMINISTRATION 5SECTION 1: INTRODUCTION
Table 1-1
Overview of MOD Sandbox Projects
Region Project Description
Chicago Incorporation of Bikesharing Releases updated version of Chicago Transit Authority’s (CTA)
Company Divvy existing trip planning app. New version incorporates Divvy, a
bikesharing service, and allows users to reserve and pay for bikes
within the app.
Dallas Integration of Shared- Releases updated version of Dallas Area Rapid Transit’s (DART)
Ride Services into GoPass existing trip planning app. Updated version incorporates shared-
Ticketing Application ride services to provide first/last-mile connections to public
transportation stations and allows users to pay for services within
the app.
Los Angeles Two-Region Mobility on Establishes partnership between Via and LA Metro. Via provides
and Puget Demand first/last-mile connections for passengers going to or leaving from
Sound transit stations. There is a companion project in Seattle, WA.
Phoenix Smart Phone Mobility Releases updated version of Valley Metro’s existing trip planning
Platform app. New version updates trip planning features and enables
payments.
Pinellas Paratransit Mobility on Improves paratransit service by combining services from taxi,
County Demand ridesourcing/TNCs, and traditional paratransit companies.
(Florida)
Portland OpenTripPlanner Share Use Releases updated version of TriMet’s existing multimodal app. New
Mobility version provides more sophisticated functionality and features,
including options for shared mobility.
San Francisco Bay Area Fair Value Reduces SOV use within Bay Area through commuter trip
Bay Area Commuting (Palo Alto) reduction software, a multimodal app, workplace parking rebates,
and first/last-mile connections in areas with poor access to public
transportation.
Integrated Carpool to Establishes partnership between Scoop and Bay Area Rapid Transit
Transit (BART System) (BART). Scoop matches carpoolers and facilitates carpooling
trips for passengers going to or leaving from BART stations with
guaranteed parking.
Tacoma Limited Access Connections Establishes partnerships between local ridesourcing companies/
TNCs and Pierce Transit. Ridesourcing companies provide first/
last-mile connections to public transportation stations and park-
and-ride lots with guaranteed rides home.
Tucson Adaptive Mobility with Built integrated data platform that incorporates ridesourcing/TNC
Reliability and Efficiency and carpooling services to support first/last-mile connections and
reduce congestion.
Vermont Statewide Transit Trip Releases new multimodal app for VTrans that employs fixed and
Planner flexible (non-fixed) transportation modes to route trips in cities
and rural areas.
An independent evaluation (IE) is required by Federal Public Transportation
Law (49 U.S.C. § 5312(e)(4)) for demonstration projects receiving FTA
Public Transportation Innovation funding. The IE for the MOD Sandbox
Demonstration projects was sponsored by the USDOT Intelligent
Transportation Systems Joint Program Office (ITS JPO) and FTA.
FEDERAL TRANSIT ADMINISTRATION 6SECTION 1: INTRODUCTION
This report focuses on the independent evaluation of the project with the
Vermont Agency of Transportation’s (VTrans) OpenTripPlanner (OTP), also
called Flexible Trip Planner, as implemented in the state. The VTrans OTP
was intended to serve as an alternative to other trip planners such as Google
Maps by including flexible transit options such as route deviation, dial-a-ride,
and other demand-responsive alternatives. The evaluation compared the trip
itineraries of Google Maps and the OTP, called Go! Vermont, and explored
the inclusion of flexible transit options. To evaluate user response to the trip
planner, a survey was implemented of users and transit operators on their
experience with the Go! Vermont trip planner. Finally, a series of expert
(stakeholder/project partner) interviews was conducted to learn best practices
and gather recommendations for improving the transit planner in the future.
Following a more detailed overview of the project, these hypotheses are
explored in the sections that follow.
Evaluation Framework
For each of the 11 MOD Sandbox projects, the IE team developed an
evaluation framework in coordination with the project team. The framework is
a project-specific logic model that contains the following entries:
1. MOD Sandbox Project – denotes the specific MOD Sandbox project.
2. Project Goals – denotes each project goal for the specific MOD Sandbox
project and captures what each MOD Sandbox project is trying to achieve.
3. Evaluation Hypothesis – denotes each evaluation hypothesis for the
specific MOD Sandbox project. The evaluation hypotheses flow from the
project-specific goals.
4. Performance Metric – denotes the performance metrics used to measure
impact in line with the evaluation hypotheses for the specific MOD Sandbox
project.
5. Data Types and Sources – denotes each data source used for the
identified performance metrics.
6. Method of Evaluation – denotes quantitative and qualitative evaluation
methods used.
FEDERAL TRANSIT ADMINISTRATION 7SECTION
Vermont MOD Sandbox
2 Project Summary
Vermont is one of the smallest states in the U.S., ranking 49th in population size.
It is characterized by a geography that is sparsely populated and mostly rural in
nature. Because of its rural environment, travel is primarily auto-dependent, and
transit coverage is very limited. In response to its land use, many transit services
in Vermont are implemented through flexible scheduling and routing. This is done
through deviated fixed routes, which can make door-to-door stops within a short
distance of a schedule fixed route. The problem with deviated fixed routes is
that traditional transit trip planners do not handle them very well. For example,
traditional General Transit Feed Specification (GTFS) formats were designed for
conventional fixed-route transit, with well- defined scheduled stops and routes.
However, flexible transit service that deviates from a fixed route to appropriately
serve rural environments cannot be easily represented by the conventional GTFS
data formats. Hence, a major goal was to provide an advanced statewide trip
planner that could present more of these flexible transit services. In February
2018, VTrans introduced the Go! Vermont Flexible Trip Planner, developed as an
integration of two existing platforms—GTFS-Flex specification and the OTP. Key
project partners included VTrans, Cambridge Systematics, Trillium Solutions, the
Vermont Center for Independent Living, Creative Workforce Solutions, and Go!
Vermont.
This report focuses on the evaluation of the VTrans OTP MOD Sandbox
Demonstration, specifically perceptions of the service and performance of the
tool.
Project Timeline
The main project milestones were as follows:
• January 30, 2017– Cooperative Agreement execution date
• February 2018 – Application public launch and demonstration start
• September 2018 – Marketing campaign start (Video/TV, web, and
print ads)
• March 2019 – Demonstration completion and final report
Data relevant to this MOD Sandbox Demonstration (as outlined in the Evaluation
Plan) were during 2018 and 2019.
FEDERAL TRANSIT ADMINISTRATION 8SECTION
Evaluation Approach,
3 Planning, and Execution
The evaluation of each MOD Sandbox project was guided by an evaluation plan
developed at the outset of the project. The evaluation plan was built primarily
on a logic model constructed by the IE team. The logic model had five basic
components:
1. Project Goal – The stated goal of the project; project goals were defined
from the proposal, project summary, and discussion with project team
members.
2. Evaluation Hypothesis – Each project goal had a corresponding
hypothesis, a stated question that could be answered with a “Yes” or a “No”
that was related to measuring the achievement of the associated project goal.
3. Performance Metric – Described the measurement that was proposed to
be used to evaluate the hypothesis.
4. Data Sources – Data sources that followed from the performance metric
and described the data type and source necessary to compute or evaluate the
performance metric.
5. Method of Evaluation – Defined how the hypothesis would be evaluated;
with the logic model, this was very general, declaring whether the evaluation
would be completed via survey analysis, activity data analysis, time series
analysis, or other methods.
The logic model was presented as a table, with one row containing five cells, each
populated with the components described above. The content of the logic model
was populated in advance of project implementation, where knowledge of the
project trajectory and exact data collected were uncertain. The components of
the logic model constructed for the evaluation of the Go! Vermont project are
presented in Table 3-1.
FEDERAL TRANSIT ADMINISTRATION 9SECTION 3: EVALUATION APPROACH, PLANNING, AND EXECUTION
Table 3-1
Project Goals, Evaluation Hypotheses, Performance Metrics, and Data Sources for the VTrans OTP Project
Performance
Project Goals Evaluation Hypothesis Data Elements Data Sources
Metric
1. Develop an online 1. The application will For a series of pre- O-D trip data VTrans OTP;
trip planner for both allow users to define an defined searches opensource or
“fixed” and “flexible” origin and destination that number 30 or external (e.g.,
services. within the state more, number of Google Maps)
and receive transit transit operators and
itineraries including such services reported
flexible options as flag on planner that are
stops, deviated fixed not presentable on
routes, and dial-a-ride Google Maps with
standard GTFS data
2. Improve the data 2. Transit agencies Transit operator Survey data VTrans (surveyed
presentation for will consider the survey responses public transit
transit agencies in State planner as an providers)
Vermont. improvement.
3. Improve information 3. Riders will consider User survey Survey data VTrans (surveyed
for transit riders the new planner to be responses to users)
in Vermont; an improvement over product perception
improvements to existing planning tools. questions
Pass2Go Pilot.
4. Improve mobility 4. The new planner will User survey Survey data VTrans (surveyed
for Vermont transit improve rider mobility responses to users)
riders. among planner users. mobility perception
questions
5. Increase public transit 5. Due to improved User survey Survey data; transit Transit ridership
use in Vermont. information, the new responses to ridership data data from VTrans
planner will increase mobility perception (surveyed users,
transit ridership among questions; number ridership from
users in Vermont. of general public Vermont transit
trips arranged using providers)
scheduled demand
response trips
6. The statewide 6. Web traffic to the Web traffic data Web traffic data VTrans (web
planner is used by State planner will see, (e.g., count of analytics)
Vermont transit on average, at least 10 IP addresses
riders. queries per day that in Vermont,
constitute actual users distribution at local
searching the platform. level, basic query
count data)
7. Cut call/ response 7. The new planner will Call/response time Call Center VTrans (Call
time on relevant lead to a reduced on relevant inquiries inquiries data Center)
inquiries pertaining to call/response time pertaining to route
route info and travel on relevant inquiries info and travel
options. pertaining to route info options, before
and travel options. and after planner
implementation
8. Obtain lessons 8. Obtain lessons Qualitative Stakeholder VTrans
learned about project learned about project documentation interview data (interviewees)
implementation. implementation. from stakeholder
interviews
FEDERAL TRANSIT ADMINISTRATION 10SECTION 3: EVALUATION APPROACH, PLANNING, AND EXECUTION
The quantitative and qualitative evaluation methods used in the VTrans IE
included the following:
• Comparative testing of Go! Vermont trip planner and Google Maps
• Data verification
• Survey analysis
• Summary of expert interviews
The content of the logic model was translated into a data collection plan, which
was incorporated into a broader evaluation plan. The evaluation plan contains
further details on the proposed data structures and analytical approaches
to address each hypothesis. The evaluation plan was reviewed by project
stakeholders and finalized toward the inception of the project. The project
team then executed the project, working with the evaluation team to collect
and transfer data at key junctures of the project. In the sections that follow, the
report presents background on the data collected in support of the evaluation
and presentation and discussion of the results from the evaluation.
Data Collected
A variety of datasets was used to conduct the evaluation. VTrans and the IE team
collaborated on survey development and deployment. VTrans supplied transit
operator survey data, using the design proposed in the evaluation plan, which also
supported the evaluation of specific hypotheses. The remainder of the project
components could be evaluated and tested independently. Descriptions of the
available datasets are as follows:
• Trip Planner Input Simulation Data – In total, 61 O-D pairs were
generated and input into both Google Maps and Go! Vermont. The number
of options including flexible transit services was measured and recorded for
each pair in each respective planner.
• Survey Data – Two surveys were administered to collect opinions on the
features of the Go! Vermont trip planner. The first survey was administered
to transit operators; the second was administered to the general public.
Dissemination of the surveys was passive and somewhat challenging. In the
case of users, VTrans did not have a way to contact users of the system to
invite them to take a survey; as a result, the sample sizes of both surveys were
relatively small but still could provide useful insights. The user survey sample
size was N = 8, and the transit operator survey sample size was N = 13.
• Transit Agency Data – The IE team was provided access to historical
ridership and web traffic data through the analytics platform of the Go!
Vermont trip planner to analyze web traffic activity. Call Center data were
requested but not available in a disaggregate form that was usable for the
analysis planned.
FEDERAL TRANSIT ADMINISTRATION 11SECTION 3: EVALUATION APPROACH, PLANNING, AND EXECUTION
• Stakeholder Interview Data – The IE team conducted six expert
interviews with people directly connected to the project team and who
had deep knowledge of the project. These interviews were conducted in
August 2019 and covered lessons learned, challenges and barriers, and key
institutional findings.
These datasets were applied to evaluate the hypotheses defined in the evaluation
plan. In the sections that follow, these hypotheses are explored and evaluated
using the data available.
FEDERAL TRANSIT ADMINISTRATION 12SECTION
Evaluation Results
4 This section presents the results of the evaluation of hypotheses as defined
in the project evaluation plan. The hypotheses evaluated explored the system
from several angles, including technical function and performance as well as
user perception and impact on behavior. The report presents figures with data
supporting the findings of the evaluation. (Note: Data labels in the figures are
rounded to the nearest whole percent, and equal values may differ slightly in
graphical presentation due to differences in tenths of a percent.) The discussion
that follows introduces each hypothesis and describes the analysis supporting the
findings and conclusions of the IE team.
Hypothesis 1: The application will allow users to define an origin and
destination within the state and receive transit itineraries including
such flexible options as flag stops, deviated fixed routes, and dial-a-ride
Performance Metric Key Finding
For a series of pre-defined searches that
number 30 or more, number of transit The VTrans trip planner was found to
operators and services reported on the planner provide more flexible trip options for
that are not presentable on Google Maps with comparative trips planned within Vermont.
standard GTFS data.
The first hypothesis of the evaluation sought to evaluate the function of the
system. To implement the test, 61 O-D pairs were input manually into both
Google Maps and Go! Vermont. These exact pairs tested are presented
in Appendix B, List of Origins and Destinations Input into Trip Planner for
Comparative Testing of the report. In total, 20 O-D pairs were trips that both
began and terminated within the most populated metropolitan areas in Vermont.
Next, over 40 O-D pairs were selected that started and ended in different cities.
These pairs varied in geographic distance, and care was placed on ensuring that
the selected pairs were inclusive of all regions in Vermont, including rural and
low-density environments. Results varied across the selected O-D pairs. Selected
cases where Google appeared to perform better included pairs where the origins
and destinations were both located in populated areas. In cases where either
the origin or destination appeared to exist in a more rural environment, the
Go! Vermont planner appeared to produce outputs that were more effective,
accurate, or favorable to the traveler (e.g., presenting shorter travel times). These
results did not yield consistent generalizations across all location pairs but, in
general, these distinctions in performance were observed.
The metric of consideration was the number of itineraries presented by each
planner. Other features of the planners such as total travel time, total time on
public transit, time spent walking, travel distance, walking distance, trip cost,
FEDERAL TRANSIT ADMINISTRATION 13SECTION 4: EVALUATION RESULTS
etc., also were collected and evaluated. Many of these features were more useful
for explaining the strength of fixed and flexible public transit options in Vermont
rather than the ability, or lack thereof, of Go! Vermont to display flexible transit
options. For example, the number of trips containing flexible transit options was
considered when examining trip itineraries.
Considerable thought was given to the configuration of the settings for each trip
planner. As with many contemporary trip planners, several customizable options
can impact how itineraries are displayed, including but not limited to time of day,
day of week, and other features specific to either of the trip planners. The IE
team decided to run the 61 O-D pairs into both planners with the same pre-
defined preferences and at the same pre-specified time and date to minimize the
impact that time could have on the team’s ability to compare the ability of the
two planners to display flexible transit options. All pairs were tested with the
same time and date to ensure comparability across trip search results. Times
were within typical travel and transit operating hours.
Some features specific to Google Maps or Go! Vermont ultimately led to two
particular cases being devised. For Go! Vermont, the trip planner has three
unique options that will impact display features—1) the maximum walking
distance that any displayed itinerary will include, 2) including trips that require
making a reservation in advance, and 3) including trips that have eligibility
requirements. For transit directions provided by Google Maps, two features
will impact which trip options are displayed—modal preference, which allows
users to select one or more bus, subway, train, or train and light rail, and route
preference, which allows the user to select from the options of best route, fewer
transfers, less walking, and wheelchair accessible. Two use cases were developed
that are intended to best capture how users of each system would likely use the
respective trip planners, as described in Table 4-1.
Table 4-1 • Go! Vermont: Maximum walk distance set to five miles
Use Cases for Trip • Go! Vermont: “Show services requiring reservation” selected
Planner Evaluation Use Case 1 • Go! Vermont: “Show services with eligibility requirements” not selected
• Google Maps: No modal preference given
• Google Maps: “Best route” selected
• Go! Vermont: Maximum walk distance set to five miles
• Go! Vermont: “Show services requiring reservation” selected
Use Case 2 • Go! Vermont: “Show services with eligibility requirements” selected
• Google Maps: No modal preference given
• Google Maps: “Wheelchair accessible” selected
Case 1 was intended to simulate use of the planners by persons who do not
have accessibility requirements, and Case 2 is the opposite. In both cases, the
maximum walking distance was set to five miles, which was the maximum
permitted. A five-mile walk to catch transit would be a long distance for anyone
FEDERAL TRANSIT ADMINISTRATION 14SECTION 4: EVALUATION RESULTS
to travel; the point was not to suggest that this was a common or acceptable way
to access public transit, particularly for persons with disabilities, but to ensure
that the VTrans trip planner would capture all transit trips possibly available to
users. Google Maps was observed to tolerate varying walking distances, up to
about an hour. Such a tolerance would amount to an estimated four miles of
walking given an assumed walking speed of four miles per hour. Drawing an exact
match across these platforms in terms of walking tolerances was not possible due
to the differences in interface design and input. The approach taken was intended
to maximize the catchment area from any given location and thus capture the
maximum presentable transit options available to users by each platform.
Results of the simulation are summarized below in Table 4-2, which shows the
number of trip options returned containing flexible transit options for each O-D pair.
Table 4-2
Trip Planner Evaluation Results
Pair # 1 2 3 4 5 6 7 8 9 # Pair # 1 2 3 4 5 6 7 8 9 #
Google Maps 0 0 0 0 0 0 0 0 0 0 Google Maps 0 0 0 0 0 0 0 0 0 0
Go! Vermont 0 0 0 0 1 2 2 3 2 1 Go! Vermont 0 0 1 0 1 2 3 3 2 1
Pair # 11 # # # # # # # # # Pair # 11 12 # # # # # # # #
Google Maps 0 0 0 0 1 0 0 0 0 0 Google Maps 0 0 0 0 4 0 0 0 0 0
Go! Vermont 1 0 0 0 2 0 3 3 3 3 Go! Vermont 1 0 0 0 2 0 3 3 3 3
Pair # 21 # # # # # # # # # Pair # 21 22 # # # # # # # #
Google Maps 0 0 0 0 0 0 0 0 0 0 Google Maps 0 0 0 0 0 0 0 0 0 0
Go! Vermont 3 2 0 0 2 1 0 3 3 3 Go! Vermont 3 3 0 0 2 1 0 3 3 0
Pair # 31 # # # # # # # # # Pair # 31 32 # # # # # # # #
Google Maps 0 0 0 0 3 0 0 0 4 0 Google Maps 0 0 0 0 2 0 0 0 3 0
Go! Vermont 3 3 3 1 0 0 3 1 0 0 Go! Vermont 3 3 3 2 0 0 3 1 0 0
Pair # 41 # # # # # # # # # Pair # 41 42 # # # # # # # #
Google Maps 0 0 0 0 0 0 0 0 0 0 Google Maps 0 0 0 0 0 0 0 0 0 0
Go! Vermont 0 3 3 0 1 0 0 1 0 1 Go! Vermont 0 3 3 0 1 0 0 1 0 1
Pair # 51 # # # # # # # # # Pair # 51 52 # # # # # # # #
Google Maps 0 0 0 0 0 0 0 0 0 0 Google Maps 0 0 0 0 0 0 0 0 0 0
Go! Vermont 2 0 1 2 0 0 0 0 0 0 Go! Vermont 2 0 1 2 0 0 0 0 0 1
Google Go! Google Go!
Pair # 61 CASE1 Pair # 61 CASE 2
Maps Vermont Maps Vermont
Google Maps 0 Average 0.13 1.20 Google Maps 0 Average 0.15 1.23
Go! Vermont 2 S.D. 0.64 1.25 Go! Vermont 2 S.D. 0.68 1.26
S.D. = standard deviation
FEDERAL TRANSIT ADMINISTRATION 15SECTION 4: EVALUATION RESULTS
As seen in Table 4-2, the average number of trips displayed for Case 1 that
contained flexible transit options was 1.20 for Go! Vermont vs. 0.13 for Google
Maps. The metrics were very similar for Case 2. The sign test was employed to
gauge statistical significance. The null hypothesis was that the mean difference
in number of flexible transit options displayed is equal to zero. The alternative
hypothesis was that the mean difference is greater than zero, i.e., the number of
flexible transit options displayed by Go! Vermont is greater than that displayed by
Google Maps. Employing a binomial distribution calculator, the calculated p-value
was 6.17E-08 for both Case 1 and Case 2. The null hypothesis was rejected in
favor of the alternative hypothesis for both cases, which holds for an alpha of 0.01
(1% level) and confirms that Hypothesis 1 was supported.
Hypothesis 2: Transit agencies will consider the State planner as an
improvement,
Performance Metric Key Finding
A small sample of transit operators
Transit operator survey responses considered the trip planner to be an
improvement
To evaluate the perspectives of Vermont transit operators on the Go! Vermont
trip planner, a survey was administered that asked several questions to gauge
whether they believed the Go! Vermont trip planner was an improvement. This
hypothesis was informed by data from the operator survey. Several additional
questions were asked to gauge how transit agencies perceived the Go! Vermont
trip planner. As shown in Figure 4-1, 6 of 13 (46%) respondents reported that
Go! Vermont was better or much better for trip planning than Google Maps,
while about a third (31%) considered it to be about the same; the remaining
23% felt it was worse. With respect to appearance (shown in Figure 4-2), 5 of
12 (42%) respondents reported that the Go! Vermont trip planner had a better
or much better aesthetic appearance, and 6 of 12 (50%) felt it had a comparable
or equivalently appealing appearance. Figure 4-3 and Figure 4-4 show that two-
thirds of 12 respondents reported that the two trip planners were comparable
in terms of format and display of information as well as quality of travel options
presented.
FEDERAL TRANSIT ADMINISTRATION 16SECTION 4: EVALUATION RESULTS
Figure 4-1
Transit Operator Survey –
Go! Vermont Trip Planning
Comparison to
Google Maps
*Data labels in charts have been rounded to the nearest whole number for display purposes.
Figure 4-2
Transit Operator Survey –
Go! Vermont Overall
Appearance Comparison
to Google Maps
Figure 4-3
Transit Operator Survey –
Go! Vermont Display of
Information Comparison
to Google Maps
FEDERAL TRANSIT ADMINISTRATION 17SECTION 4: EVALUATION RESULTS
Figure 4-4
Transit Operator Survey –
Go! Vermont Quality
of Travel Options
Comparison to
Google Maps
The sample size collected was relatively small; therefore, it was difficult to draw
definitive conclusions from these results. Overall, the results across the survey
responses suggested that, on balance, the respondents felt that the Go! Vermont
trip planner was generally at least not worse than Google Maps in several
regards. However, the small sample size and distribution of results suggest that
Hypothesis 2 is, at best, partially supported.
Hypothesis 3: Riders will consider the new planner to be an
improvement over existing planning tools.
Performance Metric Key Finding
User survey responses to product perception A small sample of riders did not consider
questions the trip planner to be an improvement.
A survey was developed to measure user assessments of the Go! Vermont
trip planner. Several questions were asked that required respondents to make
direct comparisons between the State-developed tool and Google Maps. The
most relevant questions are presented in Figures 4-5 through 4-12. Overall, the
results did not present an immediately clear trend. Interestingly, half of the eight
respondents answered that Go! Vermont was “about the same” as Google Maps
when used for trip planning. Similarly, half of the eight respondents said that Go!
Vermont was “about as useful” as Google Maps. However, when asked about the
utility of Go! Vermont relative to alternative trip planning platforms including
Google Maps, only a single respondent out of five indicated that Go! Vermont
was most useful. The sample size of the survey was very small, and the data
available do not support Hypothesis 3.
FEDERAL TRANSIT ADMINISTRATION 18SECTION 4: EVALUATION RESULTS
Figure 4-5
User Survey –
Most Useful Trip
Planning Platform
Figure 4-6
User Survey –
Go! Vermont Trip
Planning Comparison to
Google Maps
Figure 4-7
User Survey –
Go! Vermont
Overall Appearance
Comparison to
Google Maps
FEDERAL TRANSIT ADMINISTRATION 19SECTION 4: EVALUATION RESULTS
Figure 4-8
User Survey –
Go! Vermont Display of
Information Comparison
to Google Maps
Figure 4-9
User Survey –
Go! Vermont Quality of
Travel Comparison to
Google Maps
Figure 4-10
User Survey –
Go! Vermont Comparison
to Google Maps Based on
Usefulness
FEDERAL TRANSIT ADMINISTRATION 20SECTION 4: EVALUATION RESULTS
Figure 4-11
User Survey –
Go! Vermont
Improvement for
Flex-Transit Planning
Figure 4-12
User Survey –
Go! Vermont
Improvement for Overall
Travel Planning
Hypothesis 4: The new planner will improve rider mobility among
planner users.
Performance Metric Key Finding
A small sample of riders reported that the
User survey responses to mobility perception planner had not improved their mobility but
questions it could potentially influence their ways of
travel.
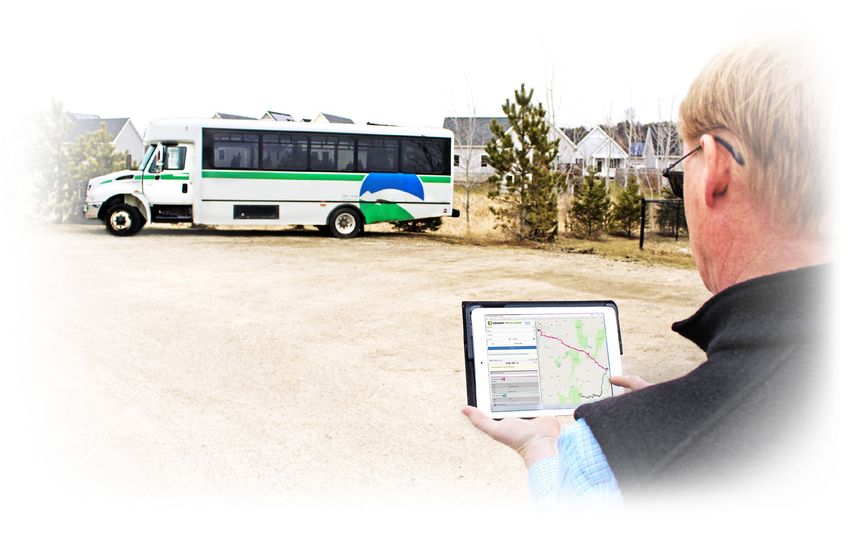
Several questions were asked to assess the impact of the Go! Vermont planner
on rider mobility. Most respondents felt that it was possible that the trip planner
could have some influence on their travel; however, only eight respondents
addressed this question. Figure 4-13 shows that seven of the eight reported
that the trip planner had not influenced how they had traveled to date, and one
respondent reported that the trip planner had slightly influenced their travel.
Overall, the limited responses suggest that at the time of the evaluation, the trip
planner was not having a significant impact on rider mobility. However, the results
also suggest that it could in the future.
FEDERAL TRANSIT ADMINISTRATION 21SECTION 4: EVALUATION RESULTS
Figure 4-13
Influence of Trip Planner
on User Travel to Date
Figure 4-14 shows that six of eight respondents felt that Go! Vermont could
slightly or significantly influence their travel, even though the vast majority said
it had not done so yet. In addition, to probe how the trip planner influenced
their mobility, respondents were asked if, as a result of the information in Go!
Vermont trip planner, they had much worse mobility, worse mobility, better
mobility, much better mobility, or that their mobility had not changed. All seven
respondents reported that their mobility had not changed. As a result of these
mixed findings, Hypothesis 4 was found to be inconclusive.
Figure 4-14
Potential Influence of Trip
Planner on User Travel in
the Future
Hypothesis 5: Due to improved information, the new planner will
increase transit ridership among users in Vermont.
Performance Metric Key Finding
A small sample of respondents reported that
User survey responses to mobility perception
they used transit about the same as a result
questions
of the trip planner
FEDERAL TRANSIT ADMINISTRATION 22You can also read