BLUE CORRIDOR PROJECT - UNITED NATIONS - ECONOMIC COMMISSION FOR EUROPE - UNECE
←
→
Page content transcription
If your browser does not render page correctly, please read the page content below
ECONOMIC COMMISSION FOR EUROPE

BLUE CORRIDOR PROJECT

          UNITED NATIONS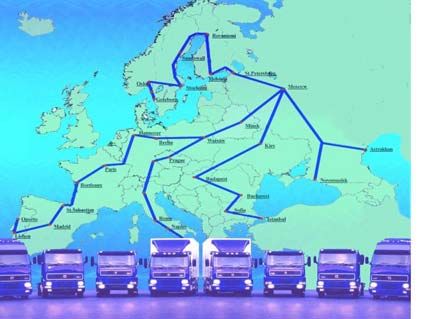
ECONOMIC COMMISSION FOR EUROPE

                    Working Party on Gas
                 Inland Transport Committee

     BLUE CORRIDOR PROJECT
on the use of natural gas as a motor fuel in international
              freight and passenger traffic

       Final Report of the Task Force

                    UNITED NATIONS

                     New York and Geneva
                            2003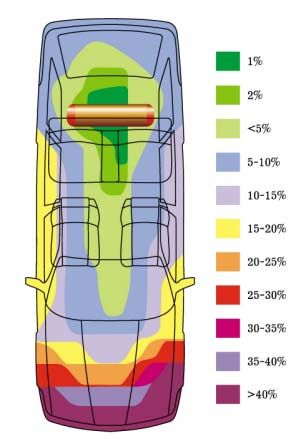
NOTE

The designations employed and the presentation of the material in this publication do not
imply the expression of any opinion whatsoever on the part of the secretariat of the United
Nations concerning the legal status of any country, territory, city or area, or of its authorities,
or concerning the delimitation of its frontiers or boundaries.

The views expressed in this paper are those of the authors and do not necessarily reflect the
views of the United Nations Secretariat.

                                        ENERGY/2003/8

                                Copyright © United Nations, 2003

                                         All rights reserved
                          Printed at United Nations, Geneva (Switzerland)
FOREWORD
The recent structural changes in east European countries and their transition to a market
economy and the integration of some of these into the European Union have significantly
increased the volume of motor vehicle traffic throughout the European continent. The volume
of international freight and passenger traffic will continue to increase in line with the
substantial growth and expansion of transnational corporations as well as the fitting-out of
vehicle fleets with modern tractor-trailer units and coaches designed for international travel
which offer enhanced carrying capacity and operational features.
The rapid increase in vehicle numbers has resulted in unacceptable levels of atmospheric
pollution. In large cities, the transport share of air pollution represents up to 60-80% of all
toxic atmospheric emissions, and with modern technologies it is quite difficult to achieve
further substantial reductions in emissions from petrol and diesel engines. The substitution of
alternative forms of fuel (especially gas) for petrol and diesel could play a significant role in
cutting emissions.
From the social point of view the implementation of the Blue Corridor project could not only
lead to enhanced development of infrastructure along the corridors, but could also expand the
gas market, improve the health and living conditions of populations and create new jobs.
The proposed Blue Corridor Project has been conceived to meet the above challenges and the
necessary preconditions for its implementation already exist. Many countries in the world
have their own ambitious programmes for the development of transport powered by
alternative fuels and especially by natural gas. The European Union has also put forward a
proposal to promote the wide use of alternative fuels in motor transport by replacing
petroleum fuel use in the transport sector by 20% alternative fuels by the year 2020.
This report is the result of collective work done by the Task Force, composed of experts from
both the gas and transport sectors of UNECE member countries, as well as from a number of
international and non-governmental organizations.
The ECE secretariat wishes to express its gratitude to all experts, companies and
organizations who support the Blue Corridor project and have contributed to the preparation
of this report.
Brigita Schmögnerová
Executive Secretary and
United Nations Under-Secretary General
iiiContents
EXECUTIVE SUMMARY.......................................................................................................................................1
ACKNOWLEDGEMENTS......................................................................................................................................2
1. BACKGROUND....................................................................................................................................................4
2. NATURAL GAS VEHICLES (NGV) DEVELOPMENT IN EUROPE AND WORLDWIDE ...................6
3. BENEFITS OF NGVS IN COMPARISON WITH VEHICLES USING TRADITIONAL FUELS ...........8
3.1 ENVIRONMENT, HEALTH AND GLOBAL WARMING...........................................................................................8
3.2 ECONOMICS, MARKETING AND NEW TECHNOLOGIES ....................................................................................12
3.3 LIQUFIED NATURAL GAS (LNG) FUEL ..........................................................................................................13
3.4 SUSTAINABLE ENERGY ..................................................................................................................................14
4. ANALYSIS OF TRANSPORT CORRIDORS ...............................................................................................18
4.1 TRANSPORT CORRIDOR MOSCOW – MINSK – WARSAW – BERLIN ...............................................................19
4.2 TRANSPORT CORRIDOR BERLIN – ROME .......................................................................................................21
4.3 TRANSPORT CORRIDOR HELSINKI – MOSCOW AND AGGREGATE DATA FOR THE THREE PILOT
CORRIDORS ...................................................................................................................................................25
5. PROJECT ECONOMICS - INVESTMENTS AND RETURNS...................................................................28
6. CONCLUSIONS..................................................................................................................................................28
6.1 BENEFITS AND EXISTING PREREQUISITES ......................................................................................................28
6.2 POTENTIAL STAKEHOLDERS OF THE PROJECT................................................................................................29
6.3 REPLICABILITY ..............................................................................................................................................29
6.4 CHALLENGES .................................................................................................................................................30
6.5 FUTURE STEPS................................................................................................................................................30
ANNEXES ................................................................................................................................................................32
ANNEX 1. DYNAMICS OF NGV DEVELOPMENT IN EUROPE .................................................................................32
ANNEX 2. PILOT BLUE CORRIDORS. ESTIMATED INVESTMENT AND RETURNS ...................................................33
ANNEX 3. THE BLUE CORRIDOR – ECONOMIC AND ENVIRONMENTAL MODEL ..................................................34
ANNEX 4. ROUTE OF THE CORRIDOR MOSCOW – MINSK – WARSAW - BERLIN ..................................................35
ANNEX 5. ROUTE OF THE CORRIDOR BERLIN – ROME .........................................................................................36
ANNEX 6. ROUTE OF THE CORRIDOR HELSINKI – ST.PETERSBURG - MOSCOW ...................................................37
LIST OF TABLES.......................................................................................................................................................
TABLE 1. NGV LEADERS ........................................................................................................................................6
TABLE 2. ADDITIONAL CASES OF DISEASE OR DAYS OFF WORK DUE TO AIR POLLUTION .......................................9
TABLE 3. COSTS ATTRIBUTABLE TO POLLUTION ..................................................................................................10
TABLE 4. СО REDUCTION COEFFICIENTS..............................................................................................................11
TABLE 5. SPECIFIC AND REDUCED TO CO EXHAUST EMISSIONS (MRED), KG PER TONNE OF FUEL USED ............11
TABLE 6. MOTOR-FUEL PRICES IN DIFFERENT EUROPEAN COUNTRIES ................................................................13
TABLE 7. REDUCED TO CO HARMFUL EXHAUST EMISSIONS FOR HEAVY-DUTY VEHICLES .................................19
TABLE 8. EXHAUST HARMFUL EMISSIONS BY HEAVY-DUTY DIESEL AND CNG VEHICLES ..................................19
TABLE 9. MOSCOW – BERLIN. AGGREGATE DATA. FORECAST FOR 2010. ..........................................................20
TABLE 10. CNG FUELLING STATIONS ALONG THE CORRIDOR MOSCOW - BERLIN .............................................21
TABLE 11. CZECH REPUBLIC – EMISSIONS FROM TRANSPORT.............................................................................24
TABLE 12. EXPECTED FUEL COST SAVINGS ..........................................................................................................26
TABLE 13. AGGREGATE REDUCTION OF HARMFUL EMISSIONS (CO EQUIVALENT) .............................................27
TABLE 14. DIESEL FUEL TO BE REPLACED BY NATURAL GAS ...............................................................................27
TABLE 15. REQUIRED INVESTMENTS ....................................................................................................................28
vLIST OF FIGURES.....................................................................................................................................................
FIGURE 1. COMPARATIVE FIGURES FOR EXHAUST EMISSIONS, KG PER TONNE OF FUEL USED .............................11
FIGURE 2. FUEL COST ...........................................................................................................................................13
FIGURE 3. FORECAST OF OIL AND GAS EXPLORED RESERVES DEPLETION IN MAJOR PRODUCING COUNTRIES .....15
FIGURE 4. IGNITION TEMPERATURE OF VARIOUS KINDS OF FUEL ( ОС ) ..............................................................16
FIGURE 5. DESTRUCTION PROBABILITY OF THE CAR BODY ..................................................................................17
FIGURE 6. ITALIAN MOTORWAY SYSTEM .............................................................................................................22
FIGURE 7. EXHAUST EMISSIONS REDUCTION, TONNES OF CO EQUIVALENT PER 1 ROUND TRIP OF
1 TRUCK, HEAVY DUTY DEDICATED CNG/LNG ENGINES COMPARED TO EURO-2
DIESEL ENGINES………………………………………………………………………………….…26
LIST OF ABBREVIATIONS.................................................................................................................................38
vi. Blue Corridor Project 1
Executive Summary
The idea of the Blue Corridor Project was launched in the year 2000 by the non-governmental
Vernadsky Ecological Foundation (Moscow). The objective of the project is to establish
transport corridors for heavy duty transport vehicles using compressed natural gas (CNG) as
fuel instead of diesel, both because of its economic and environmental advantages.
Natural gas has a number of important advantages over petroleum fuels. Natural gas is the
cleanest burning alternative transportation fuel available today. It is safe, lighter than air and
does not pool on the ground like liquid fuels. Natural gas is also economic, on average 40%
cheaper than gasoline and it is more sustainable from the point of view of security of supply.
Natural gas is a natural bridge to hydrogen transportation systems of the future.
The Blue Corridor Project is included in the programmes of work of the United Nations
Economic Commission for Europe (UNECE) Working Party on Gas and Inland Transport
Committee. These two intergovernmental bodies set up a Task Force in 2002 with experts
from the gas and transport sectors to assess the technical and economic viability of the
Project.
The Task Force held three working meetings: in June 2002 in Warsaw, at the invitation of the
Clean Air Foundation and Energoproekt, in November 2002 in Hoofddorp, near Amsterdam
at the invitation of the European Natural Gas Vehicle Association (ENGVA) and in March
2003 in Berlin, at the invitation of the European Business Congress (EBC). The Task Force
consists of representatives from both Governments and private sector of the following
UNECE member countries: Belarus, Bulgaria, Czech Republic, Finland, Germany, Hungary,
Italy, Netherlands, Norway, Poland, Republic of Moldova, Romania, Russian Federation,
Slovakia, Turkey and the United Kingdom, as well as non-governmental organizations such
as the Vernadsky Foundation, the International Road Transport Union, the European Natural
Gas Vehicle Association, the Russian Natural Gas Vehicle Association (NGVRUS) and the
Clean Air Foundation. Representatives of the secretariat of the United Nations Economic
Commission for Europe served as coordinators of the Project.
The Task Force selected three pilot Blue Corridors: 1. Moscow – Minsk – Warsaw – Berlin
(along the international road E 30); 2. Berlin – Czech Republic – Austria – Rome (along the
international roads E 55 and E 45); 3. Helsinki – St. Petersburg – Moscow (along the
international roads E 18 and E 105).
Feasibility studies were conducted for the three pilot corridors based on traffic volumes,
savings in fuel costs, reductions in emissions and number of existing CNG fuelling stations.
For example, on the Moscow – Berlin corridor, with projected daily traffic of 16,000 lorries in
2010, fuel savings would amount to more than 300 million Euros per year and harmful
exhaust emissions would be reduced up to 60% (based on 100% conversion to CNG). For
optimal fuelling potential, 25 new CNG stations would be required, at an average cost of
250,000 Euros each.
Aggregate data for the three pilot corridors based on a projection of 2500 vehicles for
Helsinki – Moscow, 4000 vehicles for Moscow – Berlin, and 4000 vehicles for Berlin – Rome
show fuel savings of the order of 37 million Euros per year and reductions in harmful exhaust.
2 Blue Corridor Project .
emissions of 272,400 tonnes per year. The total implementation cost of the Blue Corridor
Project is estimated at 63.4 million Euros for the conversion of the 10,500 vehicles and 15.9
million Euros for developing the necessary refuelling infrastructure.
Today there are about 2.2 million natural gas vehicles (NGVs) worldwide. In Europe, Italy
with 400,000 vehicles and Russia with 36,000 have the largest fleets and in Germany the fleet
is developing rapidly, with over 12,000 vehicles today. Since 1995, the number of NGVs in
Europe has grown by more than 100,000 or 30% and the number of fuelling stations has
doubled. There are currently over 12,000 natural gas fuelling stations in Europe. The EU has
set a target of replacing petroleum fuel use in the transport sector by 20% alternative fuels by
the year 2020 and will issue a Directive on the use of alternative fuels. This could mean 10%
of the market for natural gas and the potential of 23 million NGVs by 2020.
Acknowledgements
The present paper is the result of the collective work of experts-members of the UNECE Task
Force, set up in early 2002. The active and highly professional participation of members of
the group enabled the completion of the work on the Final Report in a relatively short period
of time.
Thanks go to the following experts for their contributions to the preparation of the present
document: Mr. Vasili YELISEYENKAU (BELTRANSGAS, Belarus), Mr. Martin
BOYADZHIEV (Overgas Inc., Bulgaria), Mr. Jaroslav TOMANEK (Ceska plynarenska unie,
Czech Republic), Mr. Jan ZAKOVEC (Prazska plynarenska AS, Czech Repuplic), Mr. Martin
KLOZ (Ministry of Environment, Czech Republic), Mr. Jouko ALALUUSUA (Ministry of
Transport and Communications, Finland), Mr. Friedhelm WANNAGAT (Ruhrgas A.G.,
Germany), Mr. Bernd BARTUNEK (Westport Gmbh, Germany), Mr. Tamas KOROSI
(Ministry of Economic Affairs, Hungary), Mr. Istvan GUBA (MOL, Hungary), Mr. Flavio
MARIANI (ENI Spa, Italy), Mr. Roar STOKHOLM (Statoil, Norway), Mr. Andrzej
HOSCILOWICZ (Polish Oil and Gas Company, Poland), Mr. Jerzy ROSZKOWSKI
(Energoprojekt-Warszawa S.A., Poland), Mr. Mihael GORECHENKOV (Moldovagaz,
Republic of Moldova), Mrs. Ligia MEDREA and Mrs. Gabriela ANGHELESCU (ANRGN,
Romania), Mr. Radovan ILLITH (Slovak Gas Industry, Slovakia), Mr. Victor STATIVKO
and Mr. Evgeny PRONIN (Gazprom, Russian NGV Association, Russian Federation), Mr.
Sakir ARIKAN (BOTAS, Turkey), Mr. Bruce CHISHOLM (Sealweld International Co. Ltd.,
United Kingdom), Mr. Jeffrey SEISLER (ENGVA, the Netherlands), Ms. Ludmila van der
MAREL (Clean Air Foundation, Poland), Mr. Soren RASMUSSEN (International Road
Transport Union, Switzerland), Mr. Kirill STEPANOV (Vernadsky Foundation, Russian
Federation), Mr. Andrey ANDREEVSKY (Vernadsky Foundation, Chairman of the Task
Force, Russian Federation).
Special thanks should be addressed to the hosts of the three meetings held by the Task Force:
Mr. Andrzej PATRYCY (Energoprojekt-Warszawa S.A., Poland), Ms. Ludmila van der
MAREL (Clean Air Foundation, Poland), Mr. Jeffrey M. SEISLER (ENGVA), Ms. Nadejda
DONIY (EBC, Berlin), Mr. Dmitry KUROCHKIN (EBC, Berlin).
The efficient and successful working of the Task Force was to a large extent due to the
professional and competent management of work by members of the UNECE Secretariat, Mr.
Alexandre CHACHINE (Working Party on Gas) and Mr. Christopher SMITH (Inland
Transport Committee).. Blue Corridor Project 3
Because of space constraints, it has not been possible to include in the Final Report all the
detailed national contributions from countries involved in the Blue Corridor Project. This
information can, however, be obtained from the Vernadsky Foundation or the UNECE
Secretariat..
4 Blue Corridor Project .
1. BACKGROUND
The Blue Corridor Project was initiated by the Vernadsky Foundation (Russian Federation) in
early 2000 with the main objective of establishing European transport infrastructure corridors
for vehicles using natural gas as a fuel in the transboundary transport of goods and
international passenger traffic. The project is based on the environmental and economic
benefits of the use of gaseous fuels.
The recent structural changes in east European countries and their transition to a market
economy and integration into the EU have significantly increased the volume of motor vehicle
traffic throughout the European continent.
The volume of international freight and passenger traffic will increase annually in line with
the substantial development of transnational corporations and the fitting-out of vehicle fleets
with modern tractor-trailer units and coaches designed for international travel which offer
enhanced carrying capacity and operational features.
However, the projected growth in international transport may be constrained by a shortage of
liquid motor fuel. According to various forecasts on the development of the energy sector,
natural gas is on course to become the world’s number-one energy source in the twenty–first
century. The environmental and economic advantages of gas in relation to other fuels augur
well for its extensive use in various sectors of industry, agriculture, public utilities and
transport. Road transport is a particularly promising area.
The rapid increase in the number of vehicles has resulted in unacceptable levels of
atmospheric pollution. Exhaust gases from motor vehicles account for approximately 60-80%
of all toxic atmospheric emissions in major cities. It is becoming increasingly difficult to
achieve substantial reductions in petrol or diesel emissions. The substitution of alternative
forms of fuel (especially gas) for petrol or diesel could play a significant role in cutting
emissions.
The proposed Blue Corridor Project has been conceived to meet the above challenges and the
necessary preconditions for its implementation already exist. Many countries in the world
have their own ambitious programmes for the development of transport powered by
alternative fuels and especially by natural gas: Argentina, Italy, Brazil, United States of
America, Russian Federation, Sweden, China, Pakistan, Islamic Republic of Iran etc.
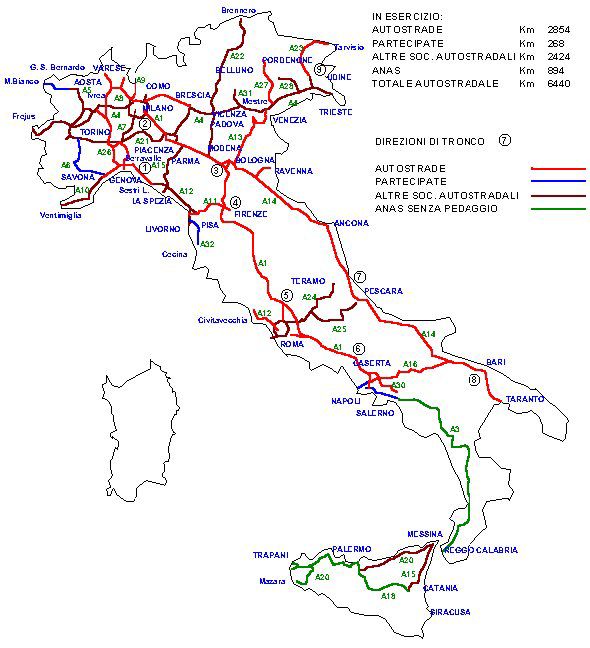
Experience in a number of countries demonstrates strikingly the desirability of establishing a
Europe-wide international freight transport system using compressed and liquefied natural gas
(CNG and LNG) in heavy–duty natural gas trucks and buses. Such a system could make a
significant contribution to overcoming Europe’s environmental problems in the foreseeable
future.
The main features of the project may be summarised as follows:
Economic benefits of gaseous motor fuel (reduced operating costs);
Gradual reduction of environmental and noise pollution;
Huge resource potential of natural gas;
Sustained increase in the volume of transboundary vehicle traffic;
Significant technical progress in the field of gaseous fuel and gas-cylinder equipment for
motor vehicles;. Blue Corridor Project 5
Expansion and improvement of the gas fuelling station network;
The geopolitical dimension – integration, enhanced international humanitarian and
commercial exchanges.
The project is designed to address issues connected with, inter alia, the plotting of routes
across the continent of Europe, harmonisation and standardisation of technical and
communication equipment, elaboration and coordination of laws and regulations and securing
of gas supplies to areas along transport corridors. Participants in the project are:
Governmental bodies (e.g. Ministries of Foreign Affairs, Transport, Energy, Resource
Management and Environmental Protection, etc);
Gas companies and gas sector enterprises;
Transport companies;
Vehicle and equipment manufacturers.
The project was presented at the annual sessions of the UNECE Committee on Sustainable
Energy, Inland Transport Committee and Working Party on Gas. Following consideration at
the fifty-sixth session of the United Nations Commission for Europe (UNECE) in May 2001
interest was expressed in the Blue Corridor Project "as a way to promote environmentally
friendly transport of goods in a major East-West pan-European corridor and because of
its potential replication for other main arteries in Europe". The Commission requested
the Committee on Sustainable Energy (Working Party on Gas) and the Inland Transport
Committee to consider the feasibility of the project and to report back to the Commission on
the results.
In accordance with the decision of the Inland Transport Committee and the Working Party on
Gas, a special Task Force representing experts from both gas and transport sectors was set up
at the beginning of 2002 with a view to assessing the technical and economic viability of the
Blue Corridor Project and modalities for its implementation.
The outcome of the meetings can be summarised as follows:
officers of the TFBCP were elected;
participants made presentations on the current state and future development of NGVs in
their respective countries and expressed their views regarding the proposed project and
made proposals concerning its evaluation;
three pilot transport corridors were identified for the assessment of the project: Moscow –
Minsk – Warsaw – Berlin (along the route E 30); Berlin – Rome (along the routes E 55
and E 45); and Moscow – St. Petersburg – Helsinki (along the routes E 105 and E 18), the
latter with potential for the use of liquefied natural gas (LNG);
eco-efficiency analyses on the selected pilot corridors were presented;
proposals on building pan-European co-operation for the Project were made;
the structure of the Final Report was adopted;
general consensus on the importance and attractiveness of the Project was expressed;
the decision to develop a website page for the Project was taken;
the draft Final Report was discussed and adopted..
6 Blue Corridor Project .
2. NGV DEVELOPMENT IN EUROPE AND WORLDWIDE
Today there are about 2.2 million natural gas vehicles (NGVs) in the world (almost 500,000
in Europe) and about 4,000 natural gas fuelling stations in the world (over 1200 in Europe).
The world leaders in the field are Argentina, Italy, Brazil, Pakistan and the United States; in
Europe Italy, Russian Federation, Ukraine, Germany and Belarus.
Table 1. NGV leaders
NGV leaders
World Europe
Country Number of Fuelling Country Number of Fuelling
NGVs stations NGVs stations
Argentina 879587 1050 Italy 434000 405
Italy 434000 405 Russia 36000 218
Brazil 391468 516 Ukraine 35000 87
Pakistan 200000 200 Germany 12000 268
USA 111769 1250 Belarus 5500 24
India 100800 120 France 4550 105
Venezuela 44146 147 Sweden 1550 25
Egypt 42000 72 UK 835 37
China 36000 70 Netherlands 300 11
Ukraine 35000 87 Belgium 300 5
Russia 31000 215 Czech Rep. 300 9
Canada 20505 222 Switzerland 279 27
Source: Gas Vehicle Report, March 2003.
In Europe, since 1995, the number of NGVs has grown by more than 100,000 (30%) and the
number of fuelling stations has doubled. In the European Union region the EU target to
replace 10% of traditional fuels with methane by 2020 finds the industrial sector, various
national and international associations all working towards the same goal. A similar situation
prevails in many non-EU European countries. For the dynamics of NGV development see
Annex 1.
Italy continues to top the statistics for the number of vehicles converted, the number of
fuelling stations and the highest sales figures for new gas model vehicles. In Italy, diesel,
whose low price and superior fuelling station infrastructure continues to draw consumers, is a
threat to the sustained period of 10 years’ growth in methane, but the current trend is about to
change with the launching of new NGV models by several manufacturers.
Germany, also one of the main drivers of NGVs, is expected to have 300 fuelling stations
(mainly dedicated to passenger and light duty vehicles) by the end of 2003 with 15 000 NGVs
and there is an ambitious target to build up an infrastructure of 1000 fuelling stations by 2006.
At the same time, Ruhrgas AG, in cooperation with leading car manufacturers, is engaged in
developing a new steel type CNG storage tank for NGVs. This project is aimed at increasing
the maximum range of existing NGVs by at least 30 per cent.
Both Russia and Ukraine have registered an increase in gas vehicle sales. In Russia, the
Governmental Commission on gaseous motor fuel adopted in 2002 a Concept for the use of
natural gas for transport. The Concept stipulates three stages. The first (2003 – 2005)
envisages increasing the NGV fleet up to 65,000-70,000 vehicles and the construction of 10 -. Blue Corridor Project 7
12 new fuelling stations. The second stage (2006 - 2010) – 120,000-140,000 NGVs and 200-
210 additional fuelling stations. The third stage (2011 – 2020) – increasing the NGV fleet up
to 1 million vehicles. As of the 1 June 1 2003 there are 218 operational fuelling stations in
Russia (with an aggregate capacity of 2 billion cubic meters per year), including 182 fuelling
stations belonging to Gazprom.
In France, 1000 buses now run on natural gas, more than 1500 are on order and half of the
country’s cities of more than 200,000 inhabitants have fuelling stations. Some French
automobile manufacturers now offer a range of buses and garbage trucks; the range of
commercial vehicles available is also on the increase. This development will certainly
continue, but the new challenge is to provide unrestricted use for drivers of private vehicles. A
similar situation prevails in Spain, and also in Portugal.
Switzerland has just launched an ambitious pro-NGV publicity campaign aimed at lowering
the price of its natural gas, the most expensive in Europe.
Turkey has a highly promising market for NGV development. The implementation of the new
natural gas law should animate market activities including the CNG business. Currently, 132
buses and more than 250 taxis run on natural gas and many taxis have been converted to
natural gas.
The European Natural Gas Vehicle Association (ENGVA), for its part, is carrying out
continued efforts with the European Union to promote the “Target 2020 Working Group” and
“NGV Pathways to 2020”, which include promoting the use of NGVs in Europe’s airports, an
undertaking that involves the conversion of large fleets of all kinds of vehicles; building
fuelling stations and devising the best publicity, as well as forging ahead with the Clean Cities
plan to incorporate gas vehicles into municipal fleets, beginning with public authorities. These
efforts include also the promotion of the Blue Corridor concept.
As mentioned above, in December 2001 the European Union put forward a proposal to
promote the wide use of alternative fuels in motor transport by 2020: biofuels, hydrogen and
natural gas. The share of biogas in the total balance of motor fuels should reach about 8 %,
that of hydrogen – 5 % and that of natural gas - 10%.
If these proposals are translated into reality, by 2020 the European fleet of NGVs will amount
to 23.5 million vehicles, with annual consumption of natural gas of almost 47 billion cubic
meters.
The European NGV fleet will have the following make-up
Type of vehicle Number of units (thousand)
Regional buses 69.9
City buses 22.8
Special trucks 149.79
Taxis 451.6
Vans 7600
Passenger cars 15200
Source: ENGVA..
8 Blue Corridor Project .
In addition, the work on harmonising international regulations and standards with distributors,
and car manufacturers continues to provide for the progressive development of the NGV
infrastructure.
3. BENEFITS OF NGVS IN COMPARISON WITH VEHICLES USING
TRADITIONAL FUELS
The use of natural gas as a vehicle fuel is beneficial for many reasons, which can be
summarized in the basic advantages in the following fields:
- environment and health
- economics
- security of supply
3.1 Environment, health and global warming
Geopolitical changes in Europe over the last 10-12 years have caused freight and passenger
traffic on the continent to increase at a rapid pace. According to analysis and forecasts of the
UNECE Inland Transport Committee (TRANS/2002/7, 14 February 2002) "Road transport
across Europe seemed to perform better than railways… In Europe as a whole, international
transport of goods performed better than domestic transport, thus continuing a major trend
observed in the UNECE region for decades… Further opening of CEE countries, resumption
of economic growth in the EU and the Russian Federation could further contribute to a
stronger demand for international transport in the next years".
This trend could result in an increased harmful effect on the environment. Not by accident the
same document considers the improvement of the environmental performance of the transport
sector as an important area of transport regulation.
Indeed, as estimates show, automobile transport accounts for up to 60-80% of overall
pollution caused by human activities and in large cities its share in air pollution can be even
higher.
The components of internal-combustion engine exhaust gases contribute to such negative
phenomena as smog, acid rain and the greenhouse effect. The negative environmental impact
of these phenomena is characterised by different geographic scopes: local – in the case of
smog; regional (trans-border) – in the case of acid rain; global – in the case of the greenhouse
effect.
Why natural gas is the solution
Premium Fuel. Natural gas vehicles are inherently cleaner burning than comparable gasoline
and diesel vehicles. Diesel fuel is highly complex, and its exhaust contains over 40
compounds classified as known or possible carcinogens, mutanogens or endocrine disruptors.
Natural gas engines produce little or none of these compounds.
Particulate Matter (PM) Emissions. Health officials have linked particulate matter emissions
to a range of serious health problems, including increased hospital visits, respiratory disease,
and decreased lung function. Diesel PM has been classified as a toxic air contaminant and as a
probable carcinogen. Recent studies that measured in-use emissions indicate that natural gas. Blue Corridor Project 9
vehicles produce nearly 90 percent less emissions of particulate matter than their gasoline and
diesel counterparts.
Ozone. Ozone is caused by the photochemical reaction of nitrogen oxide and hydrocarbons. It
causes harmful health effects ranging from eye irritation, sore throats and coughing, to lung
damage, cancer, and premature death. Children tend to be more affected because their lungs
and immune system are more susceptible to pollution and because they are exposed to higher
levels of pollution when playing outdoors. Recent studies that looked at in-use emissions
indicate that NGVs produce 40 percent less nitrogen oxide emissions.
Health problems are closely connected to economic ones. A recent three-country study
conducted for the World Health Organization (WHO) estimated the health impact of air
pollutants from traffic and their related costs (see tables below).
Table 2. Additional cases of disease or days off work due to air pollution
Cases of disease or days off work Cases of disease or days off work
attributable to total air pollution attributable to road traffic
Austria France Switzerland Austria France Switzerland
Long term 5,600 31,700 3,300 2,400 17,600 1,800
mortality
(adults > 30 years)
Respiratory 3,400 13,800 1,300 1,500 7,700 700
hospital
admissions
(all ages)
Cardiovascular 6,700 19,800 3,000 2,900 11,000 1,600
hospital admissions
(all ages)
Chronic bronchitis 6,200 36,700 4,200 2,700 20,400 2,200
incidence (adults >
25 years)
Bronchitis (children 47,700 450,000 45,400 20,600 250,000 24,100
< 15 years)
Restricted activity 3,100,00 24,600,0 2,800,000 1,300,000 13,700,00 1,500,000
days (adults > 20 0 00 0
years)
Asthma attacks 34,700 243,000 23,600 15,000 135,000 12,500
(children < 15 years)
Days with asthma 94,000 577,000 63,000 40,000 321,000 33,000
attacks (adults >15
years)
Population (millions) 8.06 58.26 7.08
Source: “Health Costs due to Road Traffic–related Air Pollution”, OMS/Swiss ETEC/Austrian MOE 1999,
rounded figures.
Air Toxic Emissions. Diesel engines are a major source of air toxic emissions, many of which
have been classified as carcinogenic. Scientists and health officials are just beginning to
understand the health dangers of air toxics. For instance, in California, health officials10 .Blue Corridor Project .
determined that 90 percent of the cancer risk from air toxics is from mobile sources and that
diesel engines are responsible for 70 percent of mobile source air toxic emissions. A study
estimates that natural gas vehicles produce between 70 - 85 percent fewer overall air toxic
emissions than gasoline and diesel vehicles.
Table 3. Costs attributable to pollution
In Austria France Switzerland
millions
of Euros
Costs Costs Costs Costs Costs Costs
attributable attributable attributable attributable attributable attributable
to total air to road to total air to road to total air to road
pollution traffic pollution traffic pollution traffic
Costs of 5,000 2,200 28,500 15,900 3,000 1,600
mortality
Costs of 1,700 700 10,300 5,700 1,200 600
morbidity
Total 6,700 2,900 38,800 21,600 4,200 2,200
costs
Source: “Health Costs due to Road Traffic–related Air Pollution”, OMS/Swiss ETEC/Austrian MOE 1999,
rounded figures.
Greenhouse Gases
Per unit of energy, natural gas contains less carbon than any other fossil fuel, and thus
produces lower CO2 emissions per vehicle mile travelled. While NGVs do emit methane,
another principal greenhouse gas, any slight increase in methane emissions would be more
than offset by a substantial reduction in CO2 emissions compared to other fuels.
NGVs also emit very low levels of carbon monoxide (approximately 70 percent lower than a
comparable gasoline vehicle) and volatile organic compounds. Although these two pollutants
are not themselves greenhouse gases, they play an important role in helping to break down
methane and some other greenhouse gases in the atmosphere, and thus increase the global rate
of methane decomposition. This more rapid breakdown could more than offset the small
increase in direct methane emissions from NGVs.
According to the analysis of Global Warming Impact (GWI), published by ENGVA (editor P.
Verstegen), "The contribution made by road traffic to increasing emissions of greenhouse
gases is expected to grow in the coming decades... For a complete picture the full fuel cycle
from "well to wheel" has to be considered. In that case the so-called 'indirect emissions' from
well exploration, transport, refining, storage and distribution have to be included. Literature
on full fuel cycle emissions tends to be conflicting. Still, a majority conclude that, from a
global warming point of view, natural gas is preferable to diesel and liquefied petroleum gas
(LPG)".
In conformity with methods existing in several countries and especially in the Russian
Federation, an assessment of exhaust emissions by motor vehicles, economic damage caused
by atmospheric air pollution and ecological cleanness of motor vehicles is made on the basis
of the so-called "reduced pollutant emission index".
When calculating this index, exhaust emissions are "reduced" (or recalculated) to the harmful
impact of carbon monoxide equivalent (СО) with the help of appropriate coefficients.. Blue Corridor Project 11
Table 4. СО reduction coefficients
Polluting substance СО СН NOX C
Reduction coefficients 1.0 2.0 70.0 60.0
Source: “Decree of the Council of Ministers of the Russian Federation”, No. 13 of 9 January 1991.
Magnitudes of emissions were calculated for different long-distance heavy-duty vehicles
(HDV) with a load-carrying capacity from 12 to 20 tonnes and for international buses driven
by diesel and natural gas engines. The model used in this study is based on Euro-II
recalculated for the European Transient Cycle (ETC).
Table 5. Specific and reduced to CO exhaust emissions (Mred), kg per tonne of fuel used
Polluting substance
Type of fuel
СО СН NOX C Mred
Heavy-duty vehicles
Diesel 54.64 6.84 36.84 1.26 2723.1
Natural Gas 24.15 11.34 14.25 0.07 1038.2
Long-distance buses
Diesel 54.64 5.26 24.56 1.1 1850.4
Natural Gas 24.15 9.59 9.5 0.06 702.3
Source: NGVRUS.
The figure below compares the environmental impact of diesel and natural gas long-distance
HDVs and international buses.
Figure 1. Comparative figures of exhaust emissions, kg per tonne of fuel used
3 000
2 723
2 000
1 850
1 000
1 038
702
-
Diesel truck Natural gas Diesel bus Natural gas
truck bus
Source: NGVRUS.
The conversion of each cross-border motor vehicle to natural gas would allow an almost two-
fold reduction of exhaust emissions, "reduced" to СО. Thus, the use of natural gas by long-
distance HDVs and international buses would have a positive impact upon the environmental
situation in Europe.12 .Blue Corridor Project . 3.2 Economics, marketing and new technologies The last decades have shown that, in order to secure a promising market introduction, alternative fuel technology not only has to offer significant environmental benefits, but also needs to compete with conventional technologies, such as gasoline and diesel engines, on the basis of investment and operating costs. Tax incentives or other promotional efforts may be appropriate to support the initial introduction, but only competitive operating costs will persuade customers to adopt new technologies. The market for future commercial vehicles, such as heavy-duty trucks and city buses, is driven by three key aspects: compliance with future emissions standards, high power for driveability and fuel economy for cost reasons. As a result, the cost of each transportation technology (diesel or alternative fuels) for complying with market requirements will become a strong argument. The vehicle procurement cost and operating expenses, such as fuelling and maintenance, are the key factors for assessment of market potential. Under these circumstances, engine systems which offer cost advantages with low overall exhaust emissions at diesel-like power and fuel economy will have an excellent chance to obtain a share of the commercial vehicle market. For compliance with future emissions standards in Europe, such as Euro IV/V and EEV (Environmentally Enhanced Vehicles), diesel engine technologies will become more costly because of the necessary consideration of exhaust gas after-treatment systems. Since low- sulphur diesel fuel, additives for SCR (Selective Catalytic Reactor) catalyst systems and particulate trap maintenance will have to be introduced into the existing diesel vehicle fleet structure, vehicle fuelling as well as maintenance costs will increase considerably. However, today’s lean-burn natural gas engines, which are based on a homogeneous charge, otto cycle combustion system approach, do not result in an overall fuel economy comparable to their diesel counterpart. State-of-the-art lean-burn CNG engines show a deterioration in energy consumption of 20 to 35%, depending on the duty cycle of the vehicle. To overcome this disadvantage, natural gas engine concepts relying on the direct induction of natural gas (DING), feature the benefit of achieving diesel-like fuel consumption at torque characteristics equivalent to diesel. Especially under transient operating conditions, such as in the operation, for example, of city buses and garbage collection trucks, the utilisation of DING engines offer the full advantage of natural gas as a clean and low cost fuel, while maintaining the advantages of the diesel powertrain regarding power density and overall engine efficiency. As a result, natural gas based commercial vehicle powertrain systems will become more attractive, since natural gas is less expensive than diesel fuel in most regions of the world. Fuel cost constitutes one of the most significant items of constant expenditure for international road transport. Nowadays, the fuel factor in transport costs may amount to 48%. In its turn, the share of haulage in product/service costs at the final seller’s place (retail) accounts for 28% to 38%. Fuel costs may amount to 20% of the cost of any product or service. In this context, the fuel cost in itself is an important factor when calculating the economics of road transport.
.                                                                           Blue Corridor Project 13

    The data on real hauls of Russian transportation carriers to European countries made it
    possible to work out a design model for the fixed charges and their relation to the type/cost of
    fuel. This estimate takes into account: 1. volumes of fuel filled en route in different countries,
    2. difference in the cost of diesel fuel and natural gas in Russia, Belarus, Poland and
    Germany.

    Figure 2. Fuel cost

              100

               80

               60
          %
               40

               20

                0
                       Diesel              NG-diesel            NG

       Source: NGVRUS.

     By using natural gas as motor fuel, international transport companies will enhance their
    competitiveness either through reduced tariffs for their services or cost savings.
    In practically all potential Blue Corridor countries the relation between the cost of diesel fuel
    and natural gas is favourable for the conversion of long-distance vehicles to gas fuel. For
    instance, the cost of one cubic metre of natural gas in Norway is 27% of the cost of one litre
    of diesel fuel, 41% in Poland, 46% in Russia, 49% in Belarus, 50% in Italy, 63% in Austria,
    and 65% in Germany.
    Table 6. Motor-fuel prices in different European countries (as of the end of 2002)

                          Petrol, Euro/l    Diesel, Euro/l   CNG, Euro/m3         Blue Corridor
    Russia                      0.36              0.24             0.11         Moscow – Minsk –
    Belarus                     0.54              0.37             0.18          Warsaw - Berlin
    Poland                      0.81              0.64             0.26
    Germany                     0.91              0.84             0.55
    Austria                     0.93              0.78             0.49           Berlin - Rome
    Italy                       1.07              0.88             0.44
    Norway                      1.22              1.11             0.30
    Source: Data provided by TFBCP members.
    3.3    LNG – liquefied natural gas fuel
    Liquefied natural gas as a vehicle fuel is technically very interesting and, at the same time,
    very challenging from a market development standpoint. The technical problems are fairly
    well resolved. For the industry, an implementation period is now emerging.
14 .Blue Corridor Project . In small fuel tank sizes, which are suitable for small vehicles, CNG is generally more appropriate because space and weight are not critical criteria and the cost per vehicle system is less. For large vehicles, particularly fleet vehicles, LNG becomes attractive because of reduced on-board weight and space requirements. In addition, the large vehicle system costs are less for LNG. Transport. LNG can be transported by ship, barge, rail or by highway trailer. For vehicle applications, the most common transportation method is the highway trailer. These trailers carry approximately 45,000 litres of LNG depending on the weight limitations for the area. The transportation cost is not a significant deterrent with more widely distributed LNG sources but if the LNG source is remote, transportation is an additional cost and can be a competitive disadvantage. Fuelling Facility. The fuelling facility cost is higher than conventional fuels in terms of equipment as the LNG must be stored, handled and dispensed at cryogenic temperatures. The components for the LNG facility include the LNG storage tank, LNG pump and fuel dispenser. For the LCNG facility, the system includes the storage tank, pump and dispenser but also includes the vaporiser and CNG storage. The economic key to the fuelling facility cost is to achieve high throughput volumes soh that the unit cost - price per litre - is attractive. Safety. Historically, LNG has received more scrutiny from a safety and regulatory standpoint than other fuels. This has led to a higher level of safety analysis and risk management. The record shows that the LNG industry has a superior safety record. 3.4 Sustainable Energy Humanity consumes a lot of energy to satisfy its needs. Energy consumption over the twentieth century increased more than 15-fold. Nowadays, hydrocarbon fossil fuels, first of all oil, natural gas and coal, are the primary source of power supply for the world economy. These fuels account for about 85% of total primary energy. Estimates forecast that the share of oil in the world’s energy balance will remain at 40% in the following 30 years. The share of natural gas may grow from 23% up to 27%. The capacity of non-traditional sources is still insignificant and they are far from large-scale commercial use. Scientists predict that the zenith of alternative power generation may be attained not earlier than the middle of the 21st century. By 2020, the share of primary energy generated from renewable sources will account for only 6 %. According to Oil & Gas magazine, world explored reserves of oil are evaluated at about 140 billion tonnes and those of natural gas at 150 trillion cubic meters. Meanwhile, 67% of explored oil reserves (93 billion tonnes) and 35% (52.5 trillion cubic meters) of gas are located in the Middle East countries. The share of east European countries including the States of the former USSR accounts for approximately 6% of explored oil reserves (8 billion tonnes) and 38% (56.6 trillion cubic meters) of natural gas. As for western Europe, the situation is as follows: 1.7% (2.3 billion tonnes) of oil and 3.1% (4.5 trillion cubic meters) of gas. The Commersant – Dengi magazine (Russian Federation) in a reference to the Organization of Petroleum Exporting Countries (OPEC) cites data concerning the possible physical depletion of oil and gas explored reserves in main producing countries if the current level of recovery and consumption remains unchanged. According to the magazine's sources, oil and gas reserves in some countries will have been depleted already in the near future.
.                                                                            Blue Corridor Project 15

    Figure 3. Forecast of oil and gas explored reserves depletion in major producing
    countries

             Algeria               2051
                                                                                   Oil   Gas
          Indonesia              2041

         Uzbekistan              2036

        Netherlands          2031

            Canada        2010

                Iraq                             2116

       Saudi Arabia                       2082

                Iran
                                        2071                                             2383
          Venezuela                     2070

             Mexico         2026

             Russia                       2083
                            2021
              China        2020

            Norway         2024
                        2011
               USA      2009
                        2010
                       2007
                UK
                       2006

                   2000                   2100          2200               2300                 2400

       Source: Commersant – Dengi magazine with reference to OPEC.

    It is possible that this scenario is too pessimistic, but geographic inequality of oil and gas
    production and the use as well as the depletion of presently producing fields provide grounds
    for serious concern.
    The International Energy Agency estimates that transport as the most rapidly developing
    sector of the world’s economy consumes approximately 26% of primary energy sources.
    Meanwhile, oil products still account for 99% of transport's energy requirements. The share of
    transport in energy consumption will increase by 2% – 2.5% per annum and may amount to
    29 % by 2030.
    Today the world car fleet amounts to some 800 million vehicles. The average increase is
    estimated at 2 – 3% a year. With an annual increase of 2, 2.5 and 3%, the world car fleet may
    surmount the one billion barrier in 2013, 2015 and 2019, respectively. Satisfying the energy
    demands of the world's car fleet using only petroleum derivatives is deemed to be unfeasible
    in the next 20 years.
    Hence, the wider use of non-oil fuels (first of all, natural gas) is one of the key imperatives for
    the human race.
16 .Blue Corridor Project .
The President of the Washington DC-based Natural Gas Vehicle Coalition, Mr. Richard
Kolodziej, stated: "For the United States, the energy security arguments in favour of natural
gas vehicles have never been greater" (NGV Worldwide, November 2002). The same
arguments are fully valid for Europe.
Safety
Natural gas is the most non-hazardous motor fuel in terms of risk of fire and explosion.
Gasoline pools on the ground create a fire hazard. Natural gas is almost two times lighter than
air and, unlike gasoline, dissipates into the atmosphere in the event of an accident. That is
why many countries allow the construction of automotive gas-filling compressor stations in
close proximity to residential and office buildings in cities. Moreover, some countries have
allowed filling for NGVs in underground garages.
Natural gas has a high ignition temperature, about 650 degrees Celsius, compared with about
300 degrees Celsius for gasoline. It also has a narrow range of flammability. In concentrations
in air below about 5 percent and above about 15 percent, it will not burn. The high ignition
temperature and limited flammability range make accidental ignition or combustion of natural
gas unlikely.
Figure 4. Ignition temperature of various kinds of fuel ( оС )
650
700
550
600
500
400 300 315
300
200
100
0
Petrol Diesel LPG Methane
Source: ENGVA.
The fuel storage cylinders used in NGVs are much stronger than gasoline fuel tanks. The
design of NGV cylinders are subjected to a number of "severe abuse" tests, such as heat and
pressure extremes, gunfire, collisions and fires.
As a rule, gas cylinders are mounted in the least vulnerable and statistically least damageable
parts of the motor vehicle. The BMW Company has calculated the destruction probability of
the car body. The analysis displayed in the illustration below suggests that the destruction
probability of the car body in the cylinders area is as low as 1-5%.. Blue Corridor Project 17
Figure 5. Destruction probability of the car body
Source: BMW Co.
Statistics gathered by the American Gas Association are instructive. 2400 motor vehicles
running on gas fuel during 10 years of operation had an aggregate distance run of 280 million
kilometres. They had 1360 road traffic accidents over that period. In 180 cases the impact was
on the area of the gas cylinders but none of the cylinders was damaged. Gasoline
inflammation was registered in five cases.
Pathway to a Hydrogen Future
Natural gas is likely to be a primary source of hydrogen for fuel cell vehicles of the future.
Reforming hydrogen at local stations from natural gas and storing hydrogen on-board vehicles
is the most energy, environmental and cost effective option. In addition, because of the many
synergies between NGVs and hydrogen fuel cell vehicles, a growing NGV market today will
facilitate the growth of the hydrogen vehicle industry of tomorrow.
Also there is the question of public acceptability. Before hydrogen vehicles are generally
accepted, there needs to be a major behavioural shift in our society. The public is very
familiar and comfortable with liquid transportation fuels, but generally unfamiliar with
gaseous transportation fuels. As NGV use continues to grow, the public is becoming more
familiar with and accepting of gaseous-fuelled vehicles. The NGV industry is setting the stage
for the more rapid acceptance of hydrogen.18 .Blue Corridor Project .
For these reasons, many industry sources believe that NGVs will be an important pathway to
a hydrogen transportation future.
4. ANALYSIS OF TRANSPORT CORRIDORS
The Task Force has accomplished a study on the expected effects of the implementation of the
Blue Corridor Project. Three pilot corridors were selected for analysis:
Moscow – Minsk – Warsaw – Berlin (along the route E 30, Pan-European corridor No. 2);
Berlin – Rome (along the routes E 55 and E 45);
Helsinki – St. Petersburg – Moscow (along the routes E 105 and E 18, pan-European
corridor No. 9) considered with potential for the use of LNG.
The following basic criteria were developed and used for the selection of the pilot corridors
(with an important contribution by Task Force member Mr. Sakir Arikan, BOTAS, Turkey):
a) Legislative framework: legislation, existing incentives, readiness of participating
countries and Governments to support the Project;
b) Environmental and technical parameters:
- traffic intensity and corresponding load on the environment;
- NGV infrastructure development along the roads in the respective countries;
c) Commercial parameters: volume and potential for transboundary trade, capabilities of
fleet companies etc.
d) Geopolitical importance of the roads, i.e. connection between northern and southern seas,
between western and eastern Europe with the prospect of reaching Asia and Siberia
(connection with the Trans-Siberian railway).
The present analysis is the result of independent economic and environmental estimations by
Task Force members. Some differences in methodologies used in the analysis of the different
corridors may be explained in part by the availability or unavailability of official basic data.
However, the independent character of the estimations makes the conclusions more impartial
and reliable.
The selection of the three pilot corridors does not mean that the practical implementation of
the project will concern only and exclusively the above corridors. In particular, the Task
Force expressed the opinion that another pilot corridor could be Paris-Zurich-Vienna-
Budapest-Bucharest-Haskovo-Istanbul-Ankara given the potential for transboundary trade
along this mid-West-East route in Europe. The goal of this analysis is to present an estimation
of the potential economic and environmental effects of implementation of the project along
some pilot corridors. At a further stage the conclusions of the Task Force may serve as a basis
for setting up a network of international NGV transport links in Europe.. Blue Corridor Project 19
4.1 Transport corridor Moscow – Minsk – Warsaw – Berlin (along the route E 30, pan-
European corridor No. 2, 1855 km)
According to the data presented by the UNECE Inland Transport Committee
(TRANS/WP.5/2002/4), every day 24,000 motor vehicles travel along international transport
corridor No. 2, one third of them (8,000) being diesel trucks. According to forecasts, by 2010
these figures may double and reach 48,000 and 16,000 respectively.
The Vernadsky Foundation conducted an environmental and economic analysis of the
corridor. The emissions analysis is based on the data contained in Figure No. 1 on specific
exhaust emissions and harmful emissions reduced to CO using special coefficients (see Figure
No.1).
Also the calculations were made using the following basic data:
Diesel Natural Gas
3
Use of fuel (l, m /100 km) 33 37.8
Fuel price (Є/l, m3)* 0.85 0.49
Source: NGVRUS.
* Average prices in Europe as of the end of 2002, according to data presented by Task Force members.
Table 7. Specific and “reduced” to CO harmful exhaust emissions (Mred) for heavy-duty
vehicles (12 – 20 tonnes) g/km
CO CH NOx C M(red)
Reduction 1 2 70 60
coefficient
Diesel 18.0 2.2 12.1 0.4 893.4
CNG 9.1 4.3 5.4 0.03 397.5
Source: Vernadsky Foundation.
The above-mentioned 16,000 heavy-duty vehicles will make on average 9 million vehicle
kilometres a day. The analysis showed the following results concerning exhaust emissions on
the corridor.
Table 8. Harmful exhaust emissions by heavy-duty diesel and CNG vehicles (tonnes per
day)
CO CH NOx C
Diesel 162 19.8 108.9 3.6
CNG 81.9 38.7 48.6 0.3
Source: Vernadsky Foundation.You can also read