Quarterly Gas Review: Short and Medium Term Outlook for Gas Markets - Oxford Institute for Energy Studies
←
→
Page content transcription
If your browser does not render page correctly, please read the page content below
July 2020

                        Quarterly Gas Review:
Short and Medium Term Outlook for Gas Markets

  Introduction
  In this latest OIES Gas Quarterly our objective is to continue our review of the impact of COVID 19 on
  global gas markets by examining various key indicators and also by updating our global gas model and
  extending the range of our forecasts to 2025. We start, as usual, with a look at various price indicators
  which demonstrate what we believe are some key market trends. Our LNG Tightness Indicator, which
  shows the margin for US LNG exporters, has improved slightly since last quarter but the cash margin
  remains negative through 2020. We have introduced a new chart which compares changes in storage
  utilisation and changes in the TTF gas price, which suggests that the forward curve is anticipating either
  a very significant surge in Asian gas demand in 2021 or another round of LNG shut-ins to support the
  gas price. Meanwhile, activity on Gazprom’s ESP underlines the continued competitiveness of Russian
  gas in Europe and the increasing importance of the ESP as part of Gazprom’s export strategy. In Asia
  the gap between oil-linked LNG prices and the JKM spot price is starting to close, but nevertheless
  remains wide enough to provide an incentive for customers to demand changes in pricing formulae.
  Finally, the domestic wholesale price in China has been falling, but also remains significantly above the
  level of the JKM price, underlining a key motivation for further price reform.
  In addition to the price analysis we have four key-note articles this quarter. The first updates our analysis
  of the storage situation in Europe and the impact of LNG flows. It notes that storage injections have
  slowed recently and LNG imports in June have also declined sharply, and concludes that these
  outcomes relate to some extent to more robust gas demand in Europe than had been expected but has
  mainly been caused by LNG shut-ins that have reduced supply. Despite this, European storage
  utilisation remains at record levels for the time of year, and although the crunch point at which storage
  might actually become full has been pushed back by a few weeks, August and September remain
  critical months.
  While LNG shut-ins are already playing a role in balancing the global market, the impact of Russian
  flows is also crucial, and our second article reviews physical flows via various transit routes in the first
  half of 2020. It notes the overall decline in Russian exports which occurred in January and then
  discusses the changing balance of export routes following the new transit agreement with Ukraine and
  the ending of the long-term arrangement with Poland. The article also notes the growing importance of
  volumes sold on the ESP, which have accounted for 17.5 per cent of total sales in 2020 to date.
  The third article updates our forecasts for global gas supply and demand, with a focus on the LNG
  market, in the wake of the COVID 19 crisis and extends the analysis to 2025. Its overall conclusion is
  that global gas demand can rebound to 2019 levels in 2021, but that it will be 2025 before the full impact
  of the COVID 19 crisis has unwound as it will take five years before our previous pre-COVID base case
  forecasts can be met. In addition, our expectation is that although prices are set to recover gradually
  over the next few years as the global supply and demand balance tightens, they will struggle to exceed
  $6/mmbtu and may well go into decline again from 2025 as a new wave of LNG supply emerges.

         The contents of this paper are the authors’ sole responsibility. They do not necessarily represent the views of
                                 the Oxford Institute for Energy Studies or any of its Members.
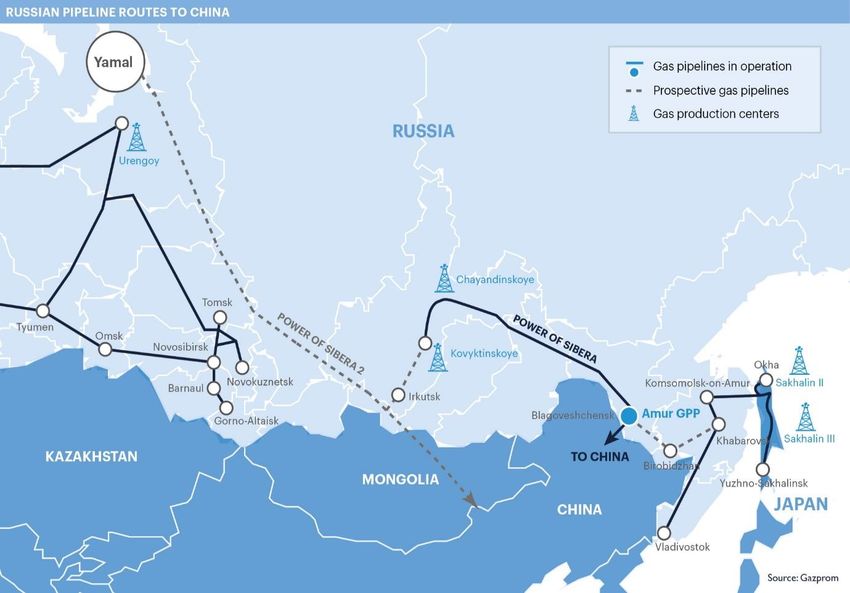
Finally, we return to the theme of Russian gas exports and look at Gazprom’s developing Asian plans,
which were the focus of the company’s recent AGM. The Power of Siberia pipeline is now up and
running and will gradually work towards full capacity of 38bcma over the next 4-5 years, with the
possibility of expansion to 44bcma if current negotiations are successful. In addition, plans for a second
export route from West Siberia via Mongolia are also being discussed which could add a further 50bcma
of capacity, while a third pipeline option would run from Sakhalin Island to the Chinese border near
Vladivostok. Expectations for both these new routes must be tempered by the knowledge that
negotiations over price, in particular, will take some time, but Gazprom CEO Alexei Miller has been
keen to underline that Russia’s plans to reduce its dependence on the European market are set to
accelerate.
James Henderson (james.henderson@oxfordenergy.org)

   The contents of this paper are the authors’ sole responsibility. They do not necessarily represent the views of the Oxford
                                      Institute for Energy Studies or any of its Members.
                                                                                                                                2
1. Price Analysis
Before taking a look at our topics for the quarterly, we include below our regular review of some key
pricing trends for global LNG, Europe and Asia, as well as introducing a look at price volatility for the
first time.
1.1 LNG Tightness – cash margins have gone negative
Firstly, we consider our “LNG Tightness” analysis as an indicator of how profitable existing export
projects are and whether there is a need for new FIDs in an already oversupplied global market. The
graph below is based on data from Argus Media and shows the prices for TTF in the Netherlands, the
ANEA spot price in Asia and the Henry Hub price1 in the US. It then calculates the highest netback from
Europe or Asia to the Gulf of Mexico based on the relevant transport costs. The LNG Tightness
calculation is then shown on a historical basis and also based on futures prices, and provides an
indication of whether developers in the US can expect to recover the cost of liquefaction on the Gulf
Coast (which is generally estimated at around $3/mmbtu based on the traditional Cheniere contract). A
margin in excess of $3 – as it was in 2018 - would provide an obvious incentive for new projects while
a margin well below this suggests a more oversupplied market.
Figure 1.1: An Assessment of “LNG Tightness”2
12
11
10
9
8
7
$/MMBtu
6
5
4
3
2
1
-
(1)
Jan-16 Jul-16 Jan-17 Jul-17 Jan-18 Jul-18 Jan-19 Jul-19 Jan-20 Jul-20 Jan-21 Jul-21 Jan-22 Jul-22 Jan-23 Jul-23
LNG Margin LNG Margin (Forward) HH+15% TTF
ANEA HH+15% (Forward) TTF (Forward) ANEA (Forward)
Source: OIES, based on data from Argus Media
It will be no surprise to readers that the margin is currently reflecting a heavily oversupplied market, and
indeed is negative for the remaining months of 2020. This means that an average US LNG cargo would
not cover its short-run marginal cash costs delivering to Europe or Asia at current prices. As a result, a
number of customers with contracts to purchase US LNG have taken the option to turn down delivery,
leading to the effective shut-in of capacity. This reaction has started to have an impact on the futures
curve for TTF and ANEA as traders anticipate that supply side curtailment may start to tighten the
market in 2021. The LNG tightness margin turns slightly positive in 2021 (an improvement on our most
1
115 per cent of Henry Hub
2
Forward curve as at July 10 2020
The contents of this paper are the authors’ sole responsibility. They do not necessarily represent the views of the Oxford
Institute for Energy Studies or any of its Members.
3recent analysis when it was negative through the first half of 2021), but it remains to be seen whether
this will in turn just encourage a much smaller turndown in supply and bring prices back down again.
Over the longer term the margin does improve, but it does not reach the $3/mmbtu level that would
encourage new investment before the end of 2023. It is therefore clearly relevant to ask whether we
should expect to see any new US LNG investment decisions being taken in the foreseeable future,
especially with buyers not rushing to sign new long-term contracts.
1.2 Movements in European storage utilisation and gas prices
As another measure of the state of the gas market we have developed a methodology to compare the
futures curve for TTF and the implications for storage levels in Europe. Figure 1.2 shows the historical
correlation between the year-on-year change in storage utilisation and the year-on-year change in the
TTF gas price in Europe. As we identified in a recent paper 3 there appears to be a relatively strong
correlation between the two measures, and while any statistician knows that correlation does not imply
causality it would seem that the two are both driven by the same supply and demand factors. As a
result, if one can estimate the outcome for one of the measures, then one can make a reasonable
prediction for the other.
The outlook for storage utilisation is generally easier to predict than that for prices, since changes in
the former tend to move relatively slowly. However, we can reverse this as the futures curve provides
a market-based outlook for prices from which one can infer an implied outcome for storage utilisation.
One can then assess what the implications of this implied outcome are and therefore whether they are
credible. By a process of reverse logic one can then provide an opinion on the underlying market
conditions that must underpin the forward curve.
Figure 1.2: YoY change in storage utilisation and TTF gas price
80% -30%
Yr on Yr Change in Storage Utilisation (Inverted)
60%
-20%
%age Yr on Yr Change in TTF
40%
-10%
20%
0% 0%
-20%
10%
-40%
20%
-60%
-80% 30%
Jan-2018
Jan-2012
Jan-2013
Jan-2014
Jan-2015
Jan-2016
Jan-2017
Jan-2019
Jan-2020
Jan-2021
Jan-2022
Jan-2023
Jul-2012
Jul-2013
Jul-2014
Jul-2015
Jul-2016
Jul-2017
Jul-2018
Jul-2019
Jul-2020
Jul-2021
Jul-2022
Jul-2023
Storage (RHS) Forward Storage (RHS) TTF (LHS) Forward TTF (LHS)
Source: OIES, with data from Argus Media
The graph above plots the YoY change of the forward curve through to 2023 and also plots the implied
change in storage utilisation (inverted) that should implicitly accompany this price movement based on
the historical relationship. With the forward curve currently showing a sharp increase in the TTF price
3
Fulwood M. & Sharples J. (2020) “$2 gas in Europe (Part III): Down, down, deeper and down”, Oxford Energy Comment,
Oxford Institute for Energy Studies
The contents of this paper are the authors’ sole responsibility. They do not necessarily represent the views of the Oxford
Institute for Energy Studies or any of its Members.
4to just over $4/mmbtu in Q2/Q3 2021, compared to $2/mmbtu this year, the implication for storage
levels in Europe is that they must be set to fall very significantly compared to 2020. Our calculations
suggest that storage utilisation would need to fall by around 25 percentage points in summer 2021
compared with this year to justify such a sharp rise in the gas price, implying a utilisation rate of around
66 per cent, or 68bcm of gas in storage. While this is not without precedent, as similar levels were seen
in 2017 and 2018, market conditions in 2021 are likely to be very different. European demand is
expected to recover, somewhat, from its collapse in 2020, and overall global demand may reach the
levels seen in 2019, but supply will also have continued to rise sharply as existing projects continue to
ramp up and new projects come online. As a result, it would seem that only two occurrences could
result in storage levels falling to this level next year. Either a significant amount of LNG supply would
need to be shut in (we would tentatively suggest around 20 to 30 bcm) or else Asian demand, which
has been very resilient in 2020, will need to grow much more rapidly than most forecasters expect. If
neither of these outcomes transpire, and especially if European storage fills again in 2021, as it did in
2019 and is doing again this year, then it would seem that the futures price for TTF could prove
somewhat optimistic. We leave it for readers to draw their own conclusions.
1.3 The Price at Gazprom’s Electronic Sales Platform
One other source of flexibility in Europe is pipeline supply, and a key component of that is Russian gas
exports. We therefore believe it is important to monitor key indicators of Gazprom’s sales strategy in
Europe, one of which can be found by examining the activity on the company’s Electronic Sales
Platform. The ESP, as it is known, is used to sell extra Russian gas to fill pipeline export capacity and
to top-up long-term contract sales. Indeed, for some time now the ESP Index (the average of ESP
prices across a number of delivery points) has shown a price lower than Gazprom’s LTC price, and this
has continued in 2020. However, while January and February showed a dramatic increase in volumes
of short-term gas on the Platform, indicating that Gazprom was offering very competitive gas to make
up for a decline in long-term contract sales (as buyers had been nominating down to take-or-pay levels
due to lower demand and the availability of cheap gas on European hubs) the rest of H1 has shown a
marked change in strategy. Although the ESP price has remained very competitive, as shown in the
graph below, the majority of sales are now for month, quarter, season or even year ahead, indicating
that Gazprom has no intention of actively engaging in a short-term price war but is now trying to lock in
longer-term sales in a very difficult market. As a result, although Russian gas remains very price
competitive and is certainly a threat to LNG arriving in Europe, it would at least seem that Gazprom is
not keen to see the short-term price in Europe go any lower.
As far as the medium term is concerned, though, Gazprom has been expanding sales in an attempt to
secure market share and bolster overall sales as its long-term contracts have come under pressure
(see later article). In June 2020, for example, there were no sales for prompt delivery at all, with sales
for Q3 accounting for 41 per cent of total trades on the ESP and with sales for calendar year 2021
accounting for the next largest share at 29 per cent. The conclusion to be reached is that Gazprom is
using the ESP to remain price competitive and also to generate sales over a range of time periods in
order to provide an important alternative source of revenue.
The contents of this paper are the authors’ sole responsibility. They do not necessarily represent the views of the Oxford
Institute for Energy Studies or any of its Members.
5Figure 1.3: The Price at Gazprom’s Electronic Sales Platform versus European Hubs
ESP vs Average of Day-Ahead and Month-1 European Hub Prices
(EUR/MWh)
30.00 28.77
27.45
25.46
27.00 23.63
21.11
24.00 18.01
16.09 15.56
21.00 14.86 15.52
12.02
13.54
18.00 11.52
11.76
11.71
15.00
11.98
11.17
12.00 10.04
8.64
9.00
7.80
7.25
6.00
3.00
ESP Index TTF-Gaspool NCG-Czech Austria-Slovakia Gazprom LTC
Source: GazpromExport, Argus Media, OIES
1.4 JKM spot price versus LNG contract price in Asia
The relationship between contract and spot prices in Asia continues to be of significant interest. As we
have noted at various times, customers tend to demand change in the formation of prices when their
impact causes them to suffer very substantial financial losses. This certainly occurred in Europe when
spot and contract prices diverged and customers began to demand a move from oil-linked pricing to
hub-based prices, catalysed by new EU rules on market liberalisation. The trend away from oil-linked
pricing in Asia has been much more gradual, and indeed some might argue that it has barely started,
but as Figure 1.4 shows, a significant divergence between spot and contract prices emerged in 2019
and then widened in the first five months of 2020, creating a significant incentive for customers to act
at a time when buyers clearly have significant bargaining power. The instance of arbitration cases has
started to increase, albeit from a low base, and rumblings of discontent from those tied into higher-
priced oil-linked contracts has grown. Although Covid-19 issues remain more important at present, there
seems little doubt that if this trend persists we could see a real challenge to oil-linked pricing of LNG in
Asia, with the JKM marker already becoming an increasingly important price benchmark.
As we noted in the previous quarterly, low oil prices at the start of the year will feed through into contract
prices in the second half of 2020, and evidence of this is already emerging in June, as can be seen
from the graph below. However, the spot price remains more than $3.50/mmbtu below the contract
price, and it remains to be seen whether the oil-linked price will reach parity with JKM given the likely
rebound in the JCC price from its April/May lows. It will certainly be important to monitor this going
forward, and it may be the case that the momentum for change in pricing methodology has already
become unstoppable.
The contents of this paper are the authors’ sole responsibility. They do not necessarily represent the views of the Oxford
Institute for Energy Studies or any of its Members.
6Figure 1.4: JKM spot price versus Japan LNG contract price (US$/mmbtu)
25.00
20.00
US$/mmbtu
15.00
10.00
5.00
-
Nov-13
May-10
Jul-11
Jul-18
Apr-13
Jun-14
Jan-15
May-17
Apr-20
Mar-09
Dec-10
Mar-16
Feb-12
Sep-12
Dec-17
Aug-15
Feb-19
Sep-19
Oct-16
Oct-09
JKM Japan Contract
Source: Platts data, OIES analysis
1.5 Chinese domestic price versus LNG import price
An increasingly important indicator in Asia will be the Chinese domestic gas price versus the LNG import
price level, and we are now monitoring this on a quarterly basis. The market continues to expect that
low spot JKM prices will filter through to domestic prices, leading to an uptick in China’s gas demand.
But as the chart below highlights, domestic city gate prices (taking Shanghai as an example) remain
well above JKM (and other international prices for that matter), although the average domestic
wholesale price is at least trending in the same direction. This price, which is assessed by the National
Bureau of Statistics every ten days, has been falling steadily over H1 2020 (in no small part thanks to
changes in the RMB/US$ exchange rate) and is now more than $4/mmbtu lower than its 2018-19
average. However, it has not fallen as fast as JKM and at $6.78/mmbtu it still represents a hefty burden
for industrial and commercial users. Going forward, the government has mandated cuts to city-gate
prices, and with oil-linked contract prices also expected to decline in the second half of the year as the
impact of lower oil prices kicks in, the differential to JKM should start to narrow.
As a result, the impetus for changing the domestic pricing mechanism is increasing. While the
government is unlikely to liberalise prices altogether, it will want to see domestic prices reflect
international movements more regularly. Yet while Beijing wants lower prices to encourage end-user
demand, it would also like to maintain sufficient incentives for the majors to keep producing domestic
gas, suggesting that some level of administrative intervention will remain. Nevertheless, reform efforts
do seem to be continuing despite the overwhelming impact of the Covid-19 pandemic and we will
continue to monitor this price trend through 2020.
The contents of this paper are the authors’ sole responsibility. They do not necessarily represent the views of the Oxford
Institute for Energy Studies or any of its Members.
7Figure 1.5: Chinese gas prices compared to JKM (US$/mmbtu)
25 Average dom wholesale Shanghai citygate
Shanghai industrial JKM
20
15
10
5
0
Jun 17 Dec 17 Jun 18 Dec 18 Jun 19 Dec 19 Jun 20
Source: Platts
2. Slower than expected European storage injections in June push back
potential ‘crunch point’
In the May 2020 issue of the Gas Quarterly, we noted that Europe (EU plus UK) began the year with a
record amount of gas in storage. Storage withdrawals that followed in Q1 (35.5 bcm) were higher than
withdrawals in Q1 2019 (29.5 bcm), but slightly below the average for 2015-2020 (37.9 bcm). As a
result, Europe ended Q1 2020 with record storage stocks for that time of year (56.0 bcm). That was
significantly higher than both storage stocks at the end of Q1 2019 (41.6 bcm) and the average for the
end of Q1 in the period 2015-2020 (33.8 bcm).
In the first part of Q2 2020, we noted the quicker-than average storage injections, and concluded that
if storage injections in the remainder of Q2 continued at the same rate as 2019, European storage could
be effectively full by early August. This, in turn, would limit the capacity of the European market to
absorb LNG from the (currently supply-long) global market.
With data now available for the whole of Q2 (Figure 2.1 below), we can see that net storage injections
in April 2020 (8.6 bcm) were indeed higher than April 2019 (7.9 bcm) and the average for 2015-2020
(5.9 bcm). Storage injections increased to 10.5 bcm in May, which placed them slightly below the 2015-
2020 average (10.9 bcm) and injections in May 2019 (11.3 bcm). Finally, net storage injections in June
(7.8 bcm) fell well below the 2015-2020 average (10.9 bcm) and showed a significant decline on net
injections in June 2019 (13.4 bcm).
The contents of this paper are the authors’ sole responsibility. They do not necessarily represent the views of the Oxford
Institute for Energy Studies or any of its Members.
8Figure 2.1 European net storage injections by month (bcm)
16.0
14.0
12.0
10.0
bcm
8.0
6.0
4.0
2.0
0.0
Apr May Jun
2015 2016 2017 2018 2019 2020
Data source: Gas Infrastructure Europe (GIE) Aggregated Gas Storage Inventory (AGSI)
As a result of the lower-than-average injections in June, the total net storage injections in Q2 2020 (27
bcm) were 16-18 per cent lower than in 2018 and 2019 (32-33 bcm), and back closer to the levels of
2016 and 2017 (26-27 bcm). As a result, the gap between the absolute volume held in storage in June
2020 compared with June 2019 began to narrow (see Figure 2.2, below). Despite this, by July 1 2020,
the amount held in storage (83.3 bcm) was still 12 per cent higher than the amount held in storage on
the same date in 2019 (74.7 bcm).
The relative slowdown in storage injections may be attributed to the fact that some storage facilities
themselves are heading toward full capacity. For gas storage across Europe as a whole, stocks were
at 80.5 per cent of capacity at the end of Q2. This level was reached three weeks later in 2019, and not
until mid-September in both 2017 and 2018.
There are some interesting differences across the continent, however. In central Europe, the situation
is more pressing. Austria, the Czech Republic, Germany, Hungary, and Slovakia account for 42.5 per
cent of European storage capacity, and their stocks equalled 86 per cent of capacity on July 1, up from
81 per cent on June 1. At the June injection rate, storage stocks will pass 90 per cent of capacity by
early August and 95 per cent by early September. The storage capacity available on July 1 equated to
around 6 bcm.
By contrast in the LNG-importing countries of north-west Europe (UK, France, Belgium, and the
Netherlands), storage utilisation rates are slightly lower but absolute storage capacity is smaller. The
storage capacities of these four countries combined accounts for 26.2 per cent of the European total.
On July 1, their combined stocks equated to 77 per cent of combined storage capacity, up from 66 per
cent on June 1. At the June injection rate, storage stocks will pass 90 per cent of capacity by mid-
August, and 95 per cent by the end of that month. As in central Europe, available storage capacity in
north-western Europe equated to 6 bcm on July 1.
In the main LNG-importing countries of southern Europe (Spain, Portugal, and Italy), combined storage
stocks were 79 per cent of capacity on July 1, up from 70 per cent on June 1. The storage capacity
available on July 1 equated to 4.5 bcm, with total storage capacity in these three countries combined
accounting for 21.2 per cent of the European total. At the June injection rate, storage stocks will pass
90 per cent of capacity by mid-August and 95 per cent by early September.
Finally, given that total European storage stocks reached 95 per cent of capacity in mid-September
2019, if storage injections in Q3 2020 match those of Q3 2019, Europe will reach effective full capacity
The contents of this paper are the authors’ sole responsibility. They do not necessarily represent the views of the Oxford
Institute for Energy Studies or any of its Members.
9three weeks earlier this year, that is, by late August. However, if the injections continue to be lower
year-on-year, as in June, the ‘crunch point’ of full capacity will be pushed back into September.
Crucially, this is closer to the start of the storage withdrawal season, thus lessening (but certainly not
obviating) the potential effect of full storage limiting Europe’s ability to absorb imports.
Figure 2.2 European Q2 net storage injections by year (bcm)
Bcm
Q1 Net Withdrawals (bcm)
105 2017: 38.5 2018: 47.8 2019: 29.6 2020: 35.5
95
Q2 Net Injections (bcm)
85 2017: 25.8 2018: 31.9 2019: 32.7 2020: 26.9
75
65
55
45
35
25
15
2020 2019 2018 2017
Data source: GIE AGSI. Note: Total European storage capacity (103 bcm) is indicated by the dotted line.
This slight change in the trajectory of storage utilisation is not just driven by the fact that storage tanks
are approaching capacity, though. Another clear reason would seem to be that supply arriving into
Europe has been falling consistently over the second quarter of 2020. The latest data suggests that
total European imports (LNG and pipeline supplies combined) have fallen continuously since March
(see Figure 2.3), as the COVID-related lockdowns impacted demand. During that period, LNG imports
initially held steady at around 350 mmcm/d, while pipeline imports absorbed the impact, falling from
748 mmcm/d in March to 666 mmcm/d in May. However, in June, that trend was reversed: LNG imports
fell by 34 per cent month-on-month, from 349 mmcm/d to 229 mmcm/d (-120 mmcm/d), while pipeline
imports rose by 6.5 per cent, from 666 mmcm/d to 709 mmcm/d (+43 mmcm/d). This meant that
between May and June, total imports (pipeline and LNG combined) fell by 7.6 per cent (-77 mmcm/d),
from 1,015 mmcm/d to 938 mmcm/d.
A further reason may be that gas demand in Europe has held up rather better than expected in Q2.
Naturally there has been a seasonal fall, and the initial impact of the economic shutdown caused by the
COVID 19 lockdown in March and April was dramatic, but more recently the demand decline has slowed
and indeed the sum of total supply (production plus imports, minus net storage injections) fell by just 5
per cent between May and June compared to a more “normal” seasonal decline of 15 per cent in the
same period in 2019. This would seem to indicate that the gradual re-opening of some European
economies is having an impact on gas demand, together with the competitiveness of gas v coal and
lignite in the power sector.
However, the slowing of injection into storage in Europe would also seem to reflect an overall reduction
in LNG supply. At a global level, LNG production fell by 8 per cent between May and June, from 1,290
mmcm/d to 1,187 mmcm/d (-103 mmcm/d). The fact that it did so serves to highlight the extent to which
the global market is oversupplied, leading to widely reported shut-ins as off-takers react to low prices
and diminished demand. Another possible explanation for lower LNG supply to Europe could be higher
demand in Asia, which would drag LNG supply away from the Atlantic Basin. However, this did not
materialise in the second quarter. Asian LNG demand has been remarkably robust in the face of the
The contents of this paper are the authors’ sole responsibility. They do not necessarily represent the views of the Oxford
Institute for Energy Studies or any of its Members.
10pandemic, mainly thanks to the continued growth of the Chinese gas market, but overall demand in
Asia was essentially flat in Q2, with some growth in the “Big 5” demand centres (Japan, Korea, Taiwan,
China and India), offsetting declines in the emerging Asian markets. There was some evidence of Qatari
and Nigerian volumes being re-directed to India and away from Europe in June, but overall there has
been no dramatic demand pull from the East. It can therefore be concluded that the reduction of LNG
deliveries to Europe is mainly a reflection of LNG supply being shut in, as reflected in cargoes from the
US being cancelled, for April and May liftings, and therefore not being delivered in June.
Figure 2.3 European gas imports: Pipeline, LNG, and the combined total (monthly average
mmcm/d)
1,200 1,033 1,084 1,100 1,074 1,015 938
1,000
334 352 349
311
349 229
800
600
400
722 750 748 725 709
666
200
0
Jan-2020 Feb-2020 Mar-2020 Apr-2020 May-2020 Jun-2020
Data source: Platts, ENTSOG Transparency Platform and National Grid (UK)
Looking forward, it would seem that the global LNG oversupply is set to persist for the foreseeable
short-term future, with pipeline suppliers to Europe retaining substantial upside potential should
European demand show signs of recovery. Despite the slowdown in European storage injections,
Europe remains on course for storage stocks to reach full capacity earlier than in 2019, albeit several
weeks later than we anticipated in our previous analysis. The ‘moment of truth’ will arrive when storage
is no longer available to absorb excess imports, and winter seasonal demand has not yet made itself
felt. If this coincides with a potential ‘second wave’ of COVID infections and related lockdowns in late
summer, the effect will be markedly more dramatic. Meanwhile, although the absence of a second
wave, combined with a relatively brisk economic rebound and the possibility of a cooler-than-average
weather in September could lessen this impact, it is very likely that any signs of a tightening market and
higher prices would catalyse an increase in the availability of LNG and pipeline gas in Europe, thus
tempering the beneficial impact of even the most favourable scenario.
Jack Sharples (jack.sharples@oxfordenergy.org)
The contents of this paper are the authors’ sole responsibility. They do not necessarily represent the views of the Oxford
Institute for Energy Studies or any of its Members.
113. Russian Gas Export Flows
Given the size and flexibility of its production and exports, Russian gas flows to Europe are a crucial
balancing factor in the European gas market, and by proxy the global LNG market. In the prices section
above we have discussed the latest trends in prices on Gazprom’s Electronic Sales Platform (ESP)
which acts as a key indicator of Russian strategy with regard to export sales, and in this article we
assess the flows of pipeline gas to Europe both in total and by various routes. We discuss the decline
in exports in 2020 and the changing balance of transit routes following the conclusion of the transit
agreement with Ukraine in December 2019 and the end of the long-term transit agreement with Poland
in 2020. We also review the growing importance of the ESP as a vehicle to enhance Russian gas
exports to Europe.
Total flows
Total Russian pipeline exports to Europe (EU plus UK, Switzerland and non-EU Balkans, minus Finland,
Estonia, Latvia, and Lithuania) dropped sharply between December 2019 (15.3 bcm) and January 2020
(9.7 bcm), but have since recovered to a stable level of 10.6-11.7 bcm per month since February. Most
recently in June, pipeline supplies to Europe grew by 5.2 per cent from 10.91 bcm in May to 11.47 bcm
last month. This is the equivalent of a daily rate of 352 mmcm/d in May rising to 382 mmcm/d in June.
Figure 3.1 Total Russian gas pipeline flows to Europe (mmcm/d)
600
500
400
mmcm/d
300
200
100
0
Data source: ENTSOG Transparency Platform. Note: Dotted line represents 350 mmcm/d.
The main entry points for Russian gas entering the European market are Greifswald (Nord Stream),
Kondratki on the Belarus-Poland border (the Yamal-Europe pipeline), and Uzhgorod-Velké Kapušany
on the Ukraine-Slovakia border. Until January 2020, substantial volumes for delivery to Romania,
Bulgaria, Greece, and Turkey were also seen at Isaccea on the Ukraine-Romania border. However, the
launch of TurkStream as a means of supplying the Turkish, Bulgarian, and Greek markets has reduced
the role of Isaccea to supplying residual flows to the Romanian market. Flows from Bulgaria to Turkey
at the Malkoclar interconnection point on their border have been displaced by gas flowing in the
opposition direction at the Strandzha-2 interconnection point. The ‘total flows’ in the graph above
discounts supplies to the Turkish market, by subtracting flows at Malkoclar from flows at Isaccea, but
includes supplies to the European market via Turkey by including flows at Strandzha-2.
Focusing on recent developments, the graph above illustrates that since the beginning of February,
total flows have largely been between 350 mmcm/d and 400 mmcm/d, with the exception of the last ten
days of May, when they fell to around 300 mmcm/d. In June in particular, those flows were 370-400
mmcm/d. In this context, it is interesting to consider how Gazprom is managing those flows, given the
The contents of this paper are the authors’ sole responsibility. They do not necessarily represent the views of the Oxford
Institute for Energy Studies or any of its Members.
12ongoing discussions around the potential completion of Nord Stream 2, the expiry of Gazprom’s long-
term transit contract with Poland, the impact of the Russia-Ukraine transit agreement of December
2019, and the ongoing development of pipelines in SE Europe that will, if all goes to plan, connect
Hungary with TurkStream by October 2021.
NW Europe: Nord Stream and the Yamal-Europe pipeline
Given that the Nord Stream and Yamal-Europe pipelines terminate in NW Germany, and so effectively
serve the same market (Gaspool), it is interesting to note the substantial difference in utilisation rates.
As the two graphs below illustrate, Nord Stream has been fully utilised throughout H1 2020. By contrast,
the Yamal-Europe pipeline has seen flows in H1 2020 generally around 20 mmcm (20 per cent) lower
than in the same periods in 2018 and 2019, when it was generally used at its full capacity of 97 mmcm/d.
Figure 3.2 Daily gas flows via Nord Stream at Greifswald (mmcm/d)
200
180
160
140
120
mmcm/d
100
80
60
40 2018
2019
20
2020
0
Data source: ENTSOG Transparency Platform
Figure 3.3 Daily gas flows via the Yamal-Europe pipeline at Kondratki (mmcm/d)
120
100
80
mmcm/d
60
40
2018
20 2019
2020
0
Data source: ENTSOG Transparency Platform
The contents of this paper are the authors’ sole responsibility. They do not necessarily represent the views of the Oxford
Institute for Energy Studies or any of its Members.
13The generally lower year-on-year utilisation of the Yamal-Europe pipeline reflects a lower European call
on Russian gas throughout the whole of H1 2020, which has also impacted Gazprom’s export flows via
Ukraine. More recently, fluctuations in the utilisation of the Yamal-Europe pipeline have been linked to
the Russia-Poland gas transit agreement, which expired on May 17. Indeed, it would seem that following
the end of this contract, Gazprom has adopted a new strategy for use of the Yamal-Europe route.
On May 5 and 18, two capacity auctions were held, for the periods July 1 to October 1 and June 1 to
July 1, respectively. In both cases, Gazprom booked 80 per cent of the capacity, indicating that it
expected lower flows than in previous years. Furthermore, between May 17-31 Gazprom was able to
book daily capacity under EU rules, and during this period it exercised its right to book (and pay) for
only capacity that it needed. As a result, after several days of fluctuation, flows fell to very low levels
between May 24-31. At the western end of the pipeline, exit flows on the Polish-German border fell to
zero, while limited entry flows at Kondratki served the Polish market. Flows then recovered and
stabilised in June, and it appeared that ‘normal service had been resumed’, albeit at a lower level than
in previous years.
This new strategy was confirmed by the outcome of an auction held by the Polish TSO, Gaz-System,
on July 6, when entry capacity at Kondratki totalling 817 GWh/d, which equates to 76 mmcm/d, or 78
per cent of Yamal-Europe’s 97 mmcm/d technical capacity, was offered for the period October 1 2020
to October 1 2021. At the auction, 99.997 per cent of the capacity on offer was purchased, one must
assume by Gazprom, given that it is the monopoly supplier of gas to Belarus, and the only entity capable
of physically delivering gas from Belarus to Poland at Kondratki. As a result it seems that around 80 per
cent of Yamal-Europe will be filled with Russian gas in the short to medium term. Gazprom of course
also retains the flexibility to bid for the additional 20 per cent of capacity that remains free on a short-
term basis, in case demand for its gas surges, but for the time being it would appear to have settled on
a lower figure as being adequate to balance its needs through 2021.
Indeed, in the very short term, with Nord Stream due to shut down for maintenance from July 14-16,
the Yamal-Europe pipeline will likely see a rise in physical flows. The new transit arrangement means
that Gazprom will be able to utilise its existing pre-booked capacity and bid for additional daily capacity
to meet any increased demand due to the unavailability of Nord Stream. As a precursor to the Nord
Stream maintenance, scheduled maintenance work was carried out at Mallnow on the Polish-German
border, which temporarily reduced Yamal-Europe flows to zero from July 6-10. However, with Nord
Stream already operating at full capacity, Gazprom compensating by drawing on storage stocks in the
region.
As a result, although Gazprom has committed to a five-year transit contract with the Ukrainian TSO,
GTSOU (Gas Transmission System Operator of Ukraine), the company would seem to have a clear
plan to take advantage of the flexibility offered by the capacity booking platform that has superseded
its previous long-term transit contract with Gaz-System in Poland.
Velké Kapušany (Uzhgorod)
The new, five-year transit contract agreed between Gazprom and GTSOU includes a ship-or-pay
commitment of 178 mmcm/d in 2020 and 110 mmcm/d in 2021-24. While that impacts several
interconnections on Ukraine’s western and southern borders – including Drozdovichi to Poland,
Beregovo to Hungary, and Isaccea to Romania – the interconnection with the largest (historic and
current) flows is Velké Kapušany (Uzhgorod) on the Ukraine-Slovakia border.
The interconnection at Velké Kapušany saw dramatic fluctuations in January-February, but since the
beginning of March flows have stabilised at around 105 mmcm/d. This is clearly well below the
contracted capacity for 2020, but is close to the committed level for 2021-24, perhaps indicating that
once the exceptional circumstances of 2020 are over Gazprom is committed to using the Ukraine
system as originally planned. In the longer-term, though, flows at Velké Kapušany are likely to be
influenced by the launch of Nord Stream 2. Specifically, if Nord Stream 2 is completed, and volumes
delivered via Nord Stream 2 are delivered via the EUGAL pipeline to the German-Czech border, and
onwards to Slovakia and Austria, this could potentially displace volumes destined for Slovakia, Austria,
The contents of this paper are the authors’ sole responsibility. They do not necessarily represent the views of the Oxford
Institute for Energy Studies or any of its Members.
14and Italy that are currently delivered via Velké Kapušany. Such a scenario would replicate the ‘two
pipeline flexibility option’ that Gazprom has for delivering gas to the Gaspool market area using Nord
Stream and Yamal-Europe
Figure 3.4 Daily gas flows from Ukraine to Slovakia at Velké Kapušany (mmcm/d)
250
200
150
mmcm/d
100
2018
50
2019
2020
0
Data source: ENTSOG Transparency Platform
TurkStream
January 2020 saw the launch of the TurkStream pipeline from Russia to Turkey, and the Strandzha-2
interconnection to bring TurkStream gas across the border from Turkey to Bulgaria. Previously, the
Trans-Balkan Line brought Russian gas from Isaccea on the Ukraine-Romania border to Malkoclar on
the Bulgaria-Turkey border. The mid-point of the Trans-Balkan line is Negru Voda, on the Romania-
Bulgaria border.
Figure 3.5 Daily gas flows to Romania and Bulgaria via Ukraine and via Turkey (mmcm/d)
60
Isaccea Negru Voda
50 Malkoclar Strandzha-2
40
mmcm/d
30
20
10
0
Data source: ENTSOG Transparency Platform
The contents of this paper are the authors’ sole responsibility. They do not necessarily represent the views of the Oxford
Institute for Energy Studies or any of its Members.
15The fact that flows at Negru Voda dropped to zero in January shows that Bulgaria no longer receives
gas via the Trans-Balkan Line; that line now only supplies Romania. The knock-on effect is that flows
further down the line, at Malkoclar, also dropped to zero. The flows to Bulgaria via TurkStream and
Strandzha-2 have fluctuated between 10 and 20 mmcm/d, which is similar to the range of flows to
Bulgaria via the Trans-Balkan Line in 2019 (that is, flows at Negru Voda minus flows at Malkoclar). The
drop to zero from June 24-28 was due to scheduled maintenance on the TurkStream pipeline.
There is substantial available capacity at Strandzha-2, which will be used by volumes destined for
Serbia and Hungary, once the onward pipelines in Bulgaria and Serbia are complete, and the new
interconnection on the Serbia-Hungary border is also complete. The construction contract for the
Bulgaria section has a deadline of May 2021, while the Bulgarian and Serbian governments have
publicly stated that they expect their sections to be complete by the end of 2020. In June, the Hungarian
regulator, MEKH, approved the latest 10-year development plan by the Hungarian TSO, FGSZ, which
states that the interconnection on the Serbia-Hungary border is scheduled to be launched by October
1 2021 with 6 bcma of capacity, rising to 8.5 bcm by October 1 2022.
Gazprom’s Electronic Sales Platform
Beyond the discussion on the flow of physical supply via various pipeline routes, it is also interesting to
note the increasing role of the ESP as part of Gazprom’s export strategy. The ESP was launched in
September 2018, and its sales volumes have grown steadily along with the variety of product types.
For four consecutive months from February to May 2020, total sales volumes were between 2,400
mmcm and 2,700 mmcm. Sales then surged to 4,912 mmcm in June, helped by 1,095 mmcm of sales
to Hungary as part of their new, flexible, sales arrangement that partially replaces the previous long-
term contracts. Even without the sales to Hungary, ESP sales in June were up by 1,256 (+49 per cent)
from 2,560 mmcm in May.
Figure 3.6 Gazprom’s daily average ESP sales and deliveries by month (mmcm/d)
250
Sales (mmcm)
200 Deliveries (mmcm)
150
mmcm/d
100
50
Data from Argus / Gazprom Export
0
Source: Data from Argus and Gazprom Export
What is particularly noteworthy is that while Gazprom’s pipeline deliveries to Europe in H1 2020 were
substantially lower than in H1 2019, Gazprom’s sales via its ESP were substantially higher. In H1 2019,
Gazprom’s ESP sales averaged 950 mmcm per month, while in H1 2020 that average was 3,160 mmcm
per month. However, it must also be noted that Gazprom Export is selling increasing volumes for
delivery further into the future from the transaction date. While sales in the first year of the ESP’s
operation were generally no more than up to month+3, volumes were recently sold for delivery as far
out as summer 2022.
The contents of this paper are the authors’ sole responsibility. They do not necessarily represent the views of the Oxford
Institute for Energy Studies or any of its Members.
16Indeed, in every month between October 2018 and February 2020, sales for prompt, balance-of-month,
and month+1 accounted for between 74 and 100 per cent of total sales, at an average of 89 per cent
of the total. In Q4 2019, such sales accounted for 99 per cent of the total, falling to 89 per cent in
January 2020 and 79 per cent in February. However, that figure collapsed to 24 per cent in March,
recovered to 53 per cent in April, and fell again to 31 per cent in May, a month in which just under half
of total sales were for more flexible delivery in Q3 2020. Then, in June, for the first time, there were
zero sales for prompt or balance-of-month delivery. Instead, sales for delivery in Q3 2020 accounted
for 41 per cent of the total, along with sales for delivery in Q4 2020 (10 per cent), winter 2020/21 (8 per
cent), and sales for delivery in the calendar year 2021 (29 per cent).
When set against a background of lower year-on-year pipeline delivery volumes in H1 2020, the general
year-on-year increase in ESP sales suggests that Gazprom’s LTC counterparties may have been
nominating down their take-or-pay volumes in favour of low-priced purchases on the ESP, where the
weighted average sales price (the ESP index) has tracked European hub prices on their downward
trend. However, the decline in transactions for prompt or near-term delivery since March reflects the
short-term decline in European demand. Gazprom has compensated by offering more flexible products,
and in doing so has locked in sales for delivery further into the future.
Indeed, it can be argued that Gazprom’s use of the ESP provides an excellent support to a pipeline
export strategy which focuses on ‘control and flexibility’ – that is, ownership of gas transmission
infrastructure outside the EU and optionality through excess capacity. To compliment this Gazprom
now also has its own sales platform which it can use as an alternative to placing volumes on European
hubs and is thus maintaining sales volumes through the offer of greater flexibility to its counterparties.
Of course, Gazprom needs export pipeline capacity to be able to ship ESP sales to the delivery points,
and in the short-term this has been provided by the reduction in the call on Russian pipeline gas in
Europe. In the medium-term, such spare capacity may be provided by Nord Stream 2 and the
completion of the onward sections of TurkStream, and so the rising share of ESP sales within
Gazprom’s export portfolio, shown in Figure 3.7 and up from 8.8 per cent in 2019 to 17.5 per cent in H1
2020, may well be set to continue.
Figure 3.7 Share of ESP sales in total physical deliveries
600 30%
500 25% ESP % share of Total
400 Physical Flows (Left) 20%
mmcm/d
ESP Deliveries (Left)
300 15%
Share of ESP (Right)
200 10%
100 5%
0 0%
Source: Data from Argus and Gazprom Export
Jack Sharples (jack.sharples@oxfordenergy.org)
The contents of this paper are the authors’ sole responsibility. They do not necessarily represent the views of the Oxford
Institute for Energy Studies or any of its Members.
174. Medium term impact of COVID 19 on gas markets
The April Quarterly Gas Review was largely devoted to the impact of COVID-19 on the global gas
market and the possible differences between various countries and regions. The focus was purely on
2020 and the immediate impact of a short sharp hit to demand and then a sharp recovery, all over a
period of 6 months. The IMF, in their April World Economic Outlook4, had projected a 3 per cent decline
in global GDP for a V-shaped decline and recovery – a base case. There were significant differences
between countries and regions in the IMF outlook and, at OIES, we looked at the major countries and
regions, especially those involved in the international trade in gas, to assess the potential impact on
gas demand by country, the impact on gas trade and an overall assessment.
Based on the V-shaped decline and recovery, with everything largely returning to normal by the end of
2020, a fall of some 3 per cent in global gas consumption was projected in 2020 compared to 2019,
which was over 4 per cent below the pre-COVID-19 case. The largest volume declines were in North
America, Europe, and Russia. Consumption in China was expected to be up by just under 5 per cent
in 2020 but that is some 5 per cent less than the pre-COVID-19 case. Consumption in all other regions
was seen as either flat or declining in 2020 over 2019. There were significant production declines in
Russia, Europe, North America, Caspian region and the ASEAN countries. LNG trade was still expected
to grow year-on-year by some 5 per cent but this was well below the pre-COVID-19 case. Pipeline
imports into Europe were also expected to be significantly lower, especially imports from Russia.
The analysis of the impact of COVID-19 has now been further reviewed and also extended into the
medium term – the period up to 2025. The likelihood of a V-shaped decline and recovery limited to 2020
has all but disappeared and the effects seem likely to be much longer lasting. The IMF have produced
another World Economic Outlook 5 , which is much less optimistic regarding global GDP growth,
projecting a 4.9 percent decline in 2020, 1.9 percentage points below the April 2020 World Economic
Outlook (WEO) forecast. The IMF also noted that the COVID-19 pandemic has had a more negative
impact on activity in the first half of 2020 than anticipated, and the recovery is projected to be more
gradual than previously forecast. In 2021 global growth is projected at 5.4 percent – which broadly
returns global GDP to the 2019 level, although there are significant country and regional differences.
The analysis will focus on an overall review of global consumption, Europe, China, the LNG market and
gas prices. The projections through to 2025 have been generated using Nexant’s World Gas Model,
based on analysis of the expected levels of gas demand, with the outputs focussed on how this demand
is supplied and the implications for gas prices. Comparisons will also be made with the recently
published IEA Gas 2020 report6, based on the text and the charts in the report.
Global Gas Demand
According to our model, global gas demand is projected to be lower by some 140 bcm in 2020 compared
to 2019 – a decline of some 3.5 per cent. This is somewhat less than the projected decline in global
GDP by the IMF. Gas demand in power in some countries is holding up better than expected, notably
in the US and some European countries, as coal takes a bigger hit from COVID-19 than gas, in part
because of very low gas prices. Gas demand is also still growing in China and showing signs of recovery
in other Asian countries.
In 2021, gas demand rebounds by 3.7 per cent, returning to 2019 levels. However, this is still over 3
per cent lower than our forecast in the Pre-COVID-19 case. Thereafter, annual gas demand growth is
over 2.5 per cent, with demand just about returning to pre-COVID-19 levels by 2025. While overall
global GDP may still be lower by 2025 than a baseline pre-COVID-19 scenario, gas demand in some
countries may be supported by continued low gas prices, especially in some of the faster growing Asian
markets.
4
IMF World Economic Outlook, April 2020, at https://www.imf.org/en/Publications/WEO/Issues/2020/04/14/weo-april-2020
5
IMF World Economic Outlook, June 2020, at
https://www.imf.org/en/Publications/WEO/Issues/2020/06/24/WEOUpdateJune2020
6
IEA Gas 2020, June 2020, at https://www.iea.org/reports/gas-2020
The contents of this paper are the authors’ sole responsibility. They do not necessarily represent the views of the Oxford
Institute for Energy Studies or any of its Members.
18Figure 4.1: Global Gas Demand to 2025
4,600 100.0%
4,500
99.0%
4,400
4,300
98.0%
4,200
BSCM
4,100 97.0%
4,000
96.0%
3,900
3,800
95.0%
3,700
3,600 94.0%
2018 2019 2020 2021 2022 2023 2024 2025
Pre COVID-19 Post COVID-19 Post as %age of Pre (RHS)
Source: IEA, Nexant World Gas Model, OIES Analysis
Based on the latest IMF GDP outlook, the largest falls in gas demand in 2020, both in percentage and
volume terms, will be in Europe, North America and Russia. Europe declines by some 8.5 per cent –
almost 50 bcm. Gas demand in China, on the other hand continues to grow by 5.5 per cent or 17 bcm,
more than offsetting declines in the rest of Asia. In 2021, China demand growth soars by some 35 bcm
(14 per cent), while demand in the rest of Asia Pacific also rebounds, including in Japan. Growth in the
Middle East also resumes, but demand remains weak in North America, as gas in power stalls.
Meanwhile in Europe the rebound in 2021 will recover less than half the loss expected in 2020.
Post 2021, China, the Middle East and North America drive the growth in volume terms, followed by
the rest of Asia Pacific. Europe just about returns to the 2019 level of gas demand by 2025 – around
550 bcm. China in the meantime has grown by almost 150 bcm between 2019 and 2025, the rest of
Asia Pacific by over 50 bcm and the Middle East by 180 bcm.
The contents of this paper are the authors’ sole responsibility. They do not necessarily represent the views of the Oxford
Institute for Energy Studies or any of its Members.
19Figure 4.2: Regional Breakdown of Changes in Demand to 2025
500
Africa
400
Middle East
300
Other Asia Pacific
200
China
BSCM
100
Eurasia
- Central & South America
Europe
(100)
North America
(200)
2019-25 2019-20 2020-21 2021-25
Source: IEA, Nexant World Gas Model, OIES Analysis
The IEA, in Gas 2020, which was published before the latest IMF scenarios, also shows gas demand
in 2021 recovering the demand lost in 2020, returning to 2019 levels. However, thereafter, gas demand
growth is slightly slower than our projection and gas demand does not return to the pre-COVID-19
projected demand by 2025. Demand growth between 2019 and 2025, according to the IEA, is just under
400 bcm, whereas our projection suggests growth of 450 bcm. The key difference would appear to be
the growth in the Middle East, where we are more bullish. Excluding the Middle East, we have growth
of 275 bcm between 2019 and 2025, while the IEA, from its charts in Gas 2020, would look to be around
260 bcm.
Europe7 Balances
Europe demand is forecast to decline to some 505 bcm in 2020 – down from 550 bcm in 2019 – before
recovering to 525 bcm in 2021, reaching 550 bcm again in 2025. The 2020 decline in demand squeezes
all sources of supply, including LNG imports, while our previous projection back in April had shown LNG
imports possibly even increasing in 2020 over 2019. This change reflects the fact that total European
demand this year is lower than previously estimated. While demand rebounds somewhat in 2021, on
the supply side it is expected that pipe imports from Russia increase significantly, with Nordstream 2
coming online, and also Azeri volumes picking up, as the Trans-Adriatic pipeline comes on stream.
Norway production also recovers somewhat. This suggests that LNG imports could fall quite sharply in
2021, but that may depend on demand for LNG in Asia and also the extent to which storage utilisation
in Europe declines. Europe could still accommodate a lot more LNG in 2021 than the 88 bcm suggested
in our projection but that would imply storage again largely filling in the summer months – this is
discussed further in the LNG Trade section.
Post 2020, Norway production grows, as do pipe imports, especially from Russia in 2024 and 2025.
LNG imports are maintained between 80 and 90 bcm. By the time 2023 and 2024 is reached, LNG is
being pulled away from Europe as global LNG demand outstrips supply and Asia’s requirements need
to be met.
7
EU27 plus UK, Norway, Switzerland, Serbia, Bosnia-Herzegovina, North Macedonia, Albania and Turkey
The contents of this paper are the authors’ sole responsibility. They do not necessarily represent the views of the Oxford
Institute for Energy Studies or any of its Members.
20Figure 4.3: European Natural Gas Supply to 2025
600
112 84 80
500 94 88
105 97 Production - Other
118 126
125 126
400 121
109 115 Production - Norway
45 61
60
BSCM
36 47 57 60
300
Pipe Imports - Other
196
200 180 221
194 194 198 210 Pipe Imports - Russia
100
LNG Imports
117 108 88 87 87 83 84
-
2019 2020 2021 2022 2023 2024 2025
Source: IEA, Nexant World Gas Model, OIES Analysis
The IEA’s Gas 2020 suggests that Europe gas demand recovers very little from the 2020 dip and is
below 2019 levels even in 2025. However, its import requirement seems to rise more than in our
projection, reflecting both weaker Norway production and lower output from the rest of Europe as well.
The IEA suggests somewhat lower pipe imports from Russia and higher LNG imports, from 2021
onwards, of around 90 bcm a year through to 2025 – some 10 bcm or so higher than our projection.
China Balances
Gas demand has held up well in China, and it will be one of the few countries to experience actual
demand growth in 2020. Apparent demand was some 7 per cent higher in January to May 2020 over
the same period in 20198. However, this seems to overstate the robustness of gas demand, since it is
thought that some of this apparent demand ended up in gas storage. Nevertheless, overall growth for
2020 is expected to be some 6 per cent, with demand rising to 320 bcm in total compared to 303 bcm
in 2019. Strong growth is expected in 2021, with demand reaching some 355 bcm – an increase of 11
per cent, principally driven by growth in the industrial sector, which is the largest gas consumer in China,
as the economy recovers. Growth is expected to continue apace through to 2025 with total demand
reaching just under 450 bcm – an increase of almost 150 bcm over 2019 levels (7 per cent per annum
growth).
Growth in China’s gas production has also been strong this year, and this is expected to continue for a
couple of years before slowing. Overall production grows by some 75 bcm between 2019 and 2025,
which leaves almost another 75 bcm to be filled by imports. LNG should benefit from this, but regas
terminal additions will need to continue as planned in order to allow new supply to arrive. At the same
time the ramp up of volumes from Russia along the Power of Siberia pipe slows the growth of LNG
imports, especially in 2022 and 2023. Total pipeline imports reach 83 bcm in 2025, against 50 bcm in
2019. LNG imports reach 118 bcm in 2025 against 80 bcm in 2019.
8
Source: Argus Direct
The contents of this paper are the authors’ sole responsibility. They do not necessarily represent the views of the Oxford
Institute for Energy Studies or any of its Members.
21You can also read