E-Skills & Digital Leadership Skills Labour Market in Europe 2015 2020 - Empirica
←
→
Page content transcription
If your browser does not render page correctly, please read the page content below

e-Skills & Digital Leadership Skills Labour
Market in Europe 2015 - 2020
Trends and Forecasts for the European ICT Professional and Digital
Leadership Labour Market (2015-2020)

Tobias Hüsing, Werner B. Korte, Eriona Dashja

                           empirica Schriftenreihe Nr. 2 / 2016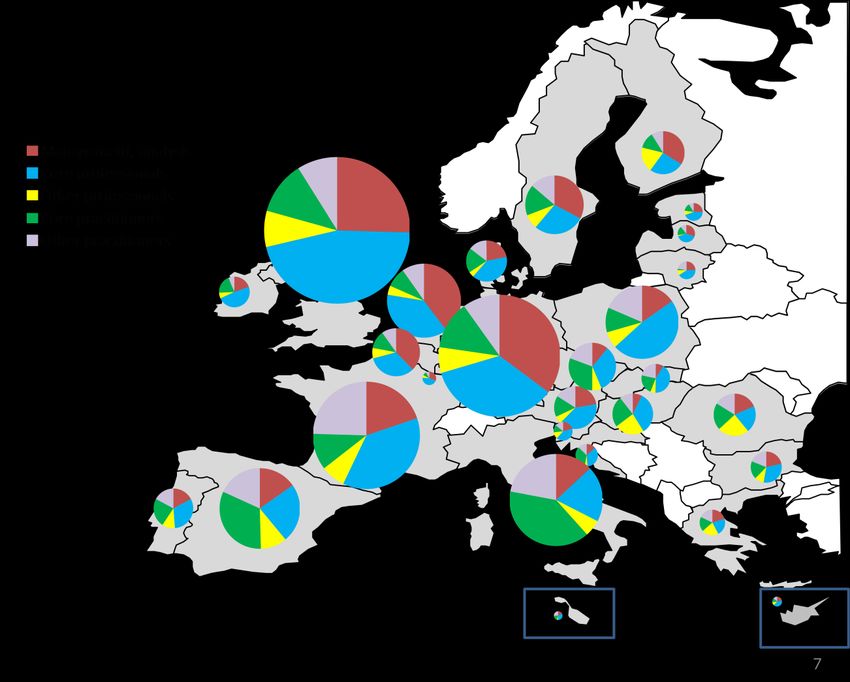
e-Skills & Digital Leadership Skills Labour Market in Europe 2015 - 2020

ABSTRACT
The ability of economies to remain innovative and competitive relies on the availability of competences of
skilled workers in line with rapidly evolving market trends. Arising technologies driving the digital
transformation reshape the way of doing business and impact the speed of change of the e-skills and
competences needed.

Amending the mismatch between the skills available and those demanded for digital transformation of the
economy has been a key priority since the European Commission developed a long term e-skills strategy.
While the number of ICT students is now increasing and Member States are stepping up their efforts, the
changing e-skills needs that face employers and the ICT workforce have clearly left their marks.

We describe the development of e-skills in Europe, both for ICT practitioners and for e-leadership skills,
look at changes in numbers of ICT students and graduates as a major source of talent entering this
workforce, and elaborate trends of e-skills and e-leadership skills demand and supply to update a foresight
scenario and forecast until 2020.

Please cite this article as: Hüsing, T., Korte W. B., Dashja E. (2016) e-Skills & Digital Leadership Skills Labour
Market in Europe 2015 - 2020. empirica Schriftenreihe Nr 2 / 2016. ISSN 2509-954X.

                                                            2 / 43
e-Skills & Digital Leadership Skills Labour Market in Europe 2015 - 2020
empirica GmbH
empirica ist ein privates, international tätiges Forschungs- und Beratungsunternehmen mit diesen thematischen Schwerpunkten:
eHealth
eCare & Ageing
eSkills & Work
Inclusive Society
Research & Innovation
Energy
empirica verfügt über langjährige Erfahrung mit quantitativen und qualitativen Forschungsmethoden. Unsere Kunden und
Auftraggeber sind private Unternehmen und öffentliche Einrichtungen: große und mittelständische Unternehmen aus der
Versicherungs-, Pharma- und Automobilbranche sowie Software- und Hardwarehersteller, des weiteren Telekommunikations-
Dienstleister und -Netzbetreiber, soziale Dienstleister und medizinischen Einrichtungen, Bundes- und Landesministerien sowie die
Europäische Kommission.
Unsere interdisziplinären Projektteams befassen sich u.a. mit Markt- und Begleitforschung, Politik- und Strategieberatung sowie
Technikfolgenabschätzung. Wir beraten Kunden bei der Produktentwicklung und –einführung, der Konzeption und Umsetzung von
Pilotprojekten und der Durchführung von Wirtschaftlichkeitsanalysen und Benchmarkingstudien.
Autoren
Senior Research Consultant, Huesing.Tobias@empirica.com
Director, Werner.Korte@empirica.com,
Research Consultant, Eriona.Dashja@empirica.com
Haftungsausschluss / Disclaimer
Der Autor übernimmt keinerlei Gewähr für die Aktualität, Korrektheit, Vollständigkeit oder Qualität der bereitgestellten
Informationen. Haftungsansprüche gegen den Autor, welche sich auf Schäden materieller oder ideeller Art beziehen, die durch die
Nutzung oder Nichtnutzung der dargebotenen Informationen bzw. durch die Nutzung fehlerhafter und unvollständiger
Informationen verursacht wurden, sind grundsätzlich ausgeschlossen, sofern seitens des Autors kein nachweislich vorsätzliches
oder grob fahrlässiges Verschulden vorliegt.
Impressum
empirica Gesellschaft für Kommunikations- und Technologieforschung mbH
empirica Schriftenreihe
Oxfordstr. 2
D-53111 Bonn
Tel. (+49) (228) 98530-0
Fax (+49) (228) 98530-12
E-Mail: info@empirica.com
Internet: http://www.empirica.com
Redaktion: Werner B. Korte
ISSN 2509-954X
Die Wiedergabe von Informationen aus diesem Bericht ist mit entsprechender Quellenangabe vorbehaltlich anderslautender
Bestimmungen gestattet.
© empirica GmbH, Bonn, 01.01.2016
3 / 43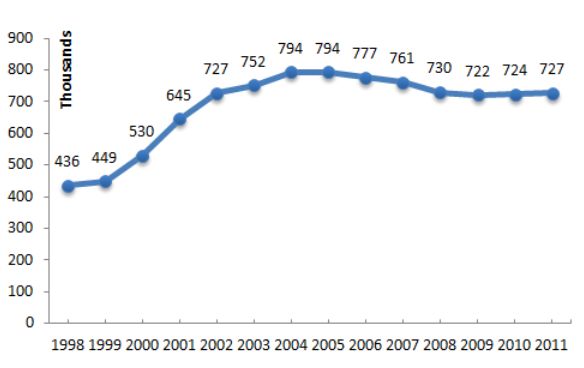
e-Skills & Digital Leadership Skills Labour Market in Europe 2015 - 2020

                                                             Table of Contents

1 Introduction ................................................................................................................................. 5
2 e-Skills supply and demand in Europe ........................................................................................... 8
  2.1 ICT workforce .................................................................................................................................. 8
  2.2 Developments................................................................................................................................ 13
  2.3 ICT Graduates ................................................................................................................................ 15
  2.4 eSkills demand ............................................................................................................................... 18
  2.5 ICT professional workforce forecasts ............................................................................................ 19
  2.6 Outlook .......................................................................................................................................... 27
3 Quantification of the e-leadership workforce .............................................................................. 27
  3.1 Addressing innovative opportunities ............................................................................................ 29
  3.2 e-Leadership roles in innovation ................................................................................................... 30
  3.3 e-Leadership Quantification 2015 and forecast ............................................................................ 32
  3.4 Summary and Outlook ................................................................................................................... 34
Annex ............................................................................................................................................. 36

                                                                      4 / 43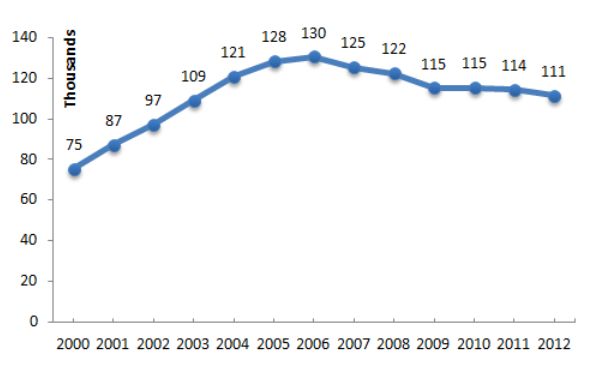
e-Skills & Digital Leadership Skills Labour Market in Europe 2015 - 2020

1         Introduction
ICT has been one of if not the most dynamic labour market in Europe and globally, both in terms of number
of digital workers and in terms of occupational tasks and requirements. Digital skills and e-leadership are a
major policy concern in Europe in order to become more innovative and competitive. Apart from digital
skills as the primary domain of expertise of ICT practitioners, there is an urgent need for workers with a
portfolio of skills that includes but is not restricted to digital – in ICT as well as in non-ICT occupations that
evolve into digital jobs, and in leadership positions which more and more require e-leadership skilled
experts who have a T-shaped portfolio of skills, expertise in new technologies and in the development of
successful and efficient organisations.
The gap between the demands for digital transformation of the economy on the one hand and the
knowledge, skills and competences of the workforce on the other is widely reported and agreed upon in
the public and academic realm but notions of its actual size remain vague. In the current economic
situation, there is also hope that a successful policy to foster the skills needed for this digital transformation
can regain Europe’s technological edge and resilience in global competition.
But what digital skills exactly will Europe need to teach to its current and future digital workforce in order
to be as sustainable as possible in a fast changing tech environment? From mining into the Labour Force
statistics of the past years, it emerges that there have been strong patterns in very recent years that give
hints as to the actually massive structural changes that are ongoing within the ICT workforce.
Looking at such patterns alone, however, will certainly not suffice to calibrate forecast scenarios, but
stakeholder reports need to be taken into account as much if not more than analysing quantitative trends
in the statistics. Therefore, we build on large scale stakeholder engagement for our analytics, having been
involved in many invaluable interactions with CIOs, ICT professional bodies and industry associations,
Higher Education, policy makers and social partners over the past years, and we would like to express our
gratitude to everyone involved in these discussions and fact finding exercises.
There is an urgent need to quantify and forecast the demand and supply for e-skilled work phenomena in
order for policy action to be grounded in empirical evidence1. While the concept of an ICT practitioner is
relatively well captured in official statistics and can rely on an established language to describe and
communicate phenomena, for concepts like e-leadership skills and digital jobs, which genuinely are about
how ICTs are becoming a more and more important part of non-ICT jobs, this is not yet the case . Therefore
the forecast of ICT practitioners can rely on established statistical taxonomies and shared notions, on a
comparably better developed common language between employers, educators and policy makers than
the e-leadership forecast. The efforts of establishing the notion of e-leadership skills in business, both SME
and corporate, policy and academia are ongoing and progress is visible, but measurement remains difficult.
The results of the e-leadership forecasting are therefore less elaborate and should be understood as order-
of-magnitude estimations rather than exact measurements.
Excursus: OECD measuring of ICT skills at work
The OECD has recently published a paper on “measuring the demand for ICT skills at work”2. They
operationalise ICT specialist occupations through the PIAAC indicator “use programming languages” broken
down by occupation and country. By counting the number of countries in which an occupation appears
among the top-20 programming intensive and ranking the result they identify ICT specialist occupations.
The 20 occupations mentioned in the table below account for 28.7 million workers in the EU-28 in 2014.

1   For the European e-Skills conference 2014 in Brussels (http://eskills2014conference.eu/), we have prepared an analysis of e-skills trends that become visible in
    official statistics and reported on an experimental pilot survey we had carried out earlier as a proof of concept of e-leadership measurement. These efforts were
    carried out in relation to two ongoing service contract work assignments for the European Commission (”New curricula for e-leadership (GUIDE)”, www.eskills-
    guide.eu, and ”e-Leadership skills for SMEs (LEAD)”, www.eskills-lead.eu), but they were not part of the contractual obligations and hence not reported in detail
    in project deliverables. We received many requests for the figures reported at the conference and would hence like to present them in this working paper.
2   OECD Working Party on Measurement and Analysis of the Digital Economy: NEW SKILLS FOR THE DIGITAL ECONOMY: MEASURING THE DEMAND FOR
    ICT SKILLS AT WORK. DSTI/ICCP/IIS(2015)4. Paris 2015.

                                                                             5 / 43
e-Skills & Digital Leadership Skills Labour Market in Europe 2015 - 2020
Table 1: Top-20 ICT specialist-intensive occupations across countries (adapted from OECD 2015)
Proportion of countries where the occupation is among the top-20
Rank Occupation ISCO-08 Frequency Workforce
EU28 (2014)3
1 Information and communications technology operations 351 100% 1,282,000
and user support
2 Engineering professionals (excluding electrotechnology) 214 95% 3,037,000
3 Software and applications developers and analysts 251 95% 2,965,000
4 Information and communications technology service 133 89% 423,000
managers
5 Database and network professionals 252 89% 466,000
6 Physical and earth science professionals 211 79% 346,000
7 Electrotechnology engineers 215 79% 831,000
8 University and higher education teachers 231 74% 1,196,000
9 Mathematicians, actuaries and statisticians 212 63% 106,000
10 Architects, planners, surveyors and designers 216 63% 1,597,000
11 Vocational education teachers 232 58% 868,000
12 Telecommunications and broadcasting technicians 352 58% 408,000
13 Physical and engineering science technicians 311 53% 4,358,000
14 Electronics and telecommunications installers and 742 53% 802,000
repairers
15 Blacksmiths, toolmakers and related trades workers 722 42% 2,506,000
16 Life science professionals 213 37% 626,000
17 Metal processing and finishing plant operators 812 37% 567,000
18 Administration professionals 242 32% 3,146,000
19 Sales, marketing and public relations professionals 243 32% 2,487,000
20 Process control technicians 313 32% 652,000
Total 28,669,000
Source: OECD, based on PIAAC.
3 Source: Eurostat Labour Force Survey (EU-LFS)
6 / 43e-Skills & Digital Leadership Skills Labour Market in Europe 2015 - 2020
An excess demand for ICT specialists would usually be apparent through published vacancies and wage
pressure. “If firms face difficulties to fill vacancies for ICT specialists, such a shortage should result in at
least one of the following: i) an upward trend in the job vacancy rates for ICT specialists; ii) a longer
duration of these vacancies; and iii) an increase in wages for ICT specialists.”4
Job vacancy and wage data for occupations (not sectors) are not easily available and comparable across EU
Member States. The OECD compares vacancy rates in the ICT services sector (accounting for almost half of
all ICT employment according to the definition that we suggest in this paper). Vacancy rates have increased
in most countries for which data is available between 2009 and 2014. However, this is notably not the case
in the UK which is the only “big” market for which data is available. Still, ICT vacancy rates exceed 1,
meaning there are relatively more vacancies in the ICT sector than in the rest of the economy. Wages in ICT
have grown slightly more than in the total business economy.
4 OECD 2015: p.7
7 / 43e-Skills & Digital Leadership Skills Labour Market in Europe 2015 - 2020
2 e-Skills supply and demand in Europe
2.1 ICT workforce
The definition5 of e-skills through occupation statistics took as starting point a close reading of ISCO
descriptions of occupations and has been validated in expert workshops during the past years. The ICT
workforce, according to our definition, in Europe in 2014, comprises 7.5 million workers, or 3.5% of the
European workforce. Broadening up the definition further, including ICT mechanics and manual workers
skills would add 1.4 million ICT workers, to a European Labour Force of 8.9 million ICT workers.
Figure 1: ICT professional workforce in Europe 2014 by ISCO-08 skills clusters
EU 28 - 2014 - Total 7,535,000
Management, architecture
and analysis
1,823,000
Other ICT practitioners -
associate/ technician level
1,095,000
Core ICT practitioners -
associate/ technician level
1,293,000
Other ICT practitioners -
professional level
615,000
Core ICT practitioners -
professional level
2,710,000
Source: empirica calculations based on LFS retrieval by Eurostat. Some further estimates apply.
Data source:
The Labour Force Survey (EU LFS) is conducted in the 28 Member States of the European Union, 2 candidate countries and 3 countries
of the European Free Trade Association (EFTA) in accordance with Council Regulation (EEC) No. 577/98 of 9 March 1998. The EU LFS is
a large household sample survey providing quarterly results on labour participation of people aged 15 and over as well as on persons
outside the labour force. (http://ec.europa.eu/eurostat/web/microdata/european-union-labour-force-survey)
Occupations are defined here according to the International Standard Classification of Occupations (ISCO). The current version, ISCO-
08, was published in 2008 and has been used to deliver data since 2011. Therefore there is a break in series between 2010 (ISCO-88,
which had significantly fewer ICT related occupations) and 2011.
Data have been kindly made available in several aggregated formats from Eurostat. Aggregation delivers data points as an estimation
of workforce totals in a cell, i.e. a combination of categories (country, industry, and ISCO-08 2-digit (sub-major), 3-digit (minor) and 4-
digit (unit) groups, and other categories, which have not been used here, such as age and sex). For estimating the ICT workforce totals
data are preferably used and represented at ISCO-08 4 digit level. In some cases (some occupations in some countries, less than 10%
of all country-occupation cells), only 3-digit data are available. In these cases the relative distribution of the higher level totals across
lower level categories was estimated using the distribution from all other countries. Another (very rare) case for estimation appears
where higher level aggregate sums do not equal the sum of lower level cells. In these cases the known lower level relative distribution
is applied to the higher level total, i.e. the residual is distributed according to relative weight of cells.
5 The definition of the ICT workforce used has been elaborated before the publication of the OECD work and therefore has not been informed by it. Naturally, we
are open to refining the definition taking account of the PIAAC results and discussing new approaches with stakeholders.
8 / 43e-Skills & Digital Leadership Skills Labour Market in Europe 2015 - 2020
The ICT workforce is here defined according to occupational categories from the ISCO – International
Standard Classification of Occupations 2008 and quantifications are made using data from the Labour Force
Surveys (LFS) of the EU-28 Member States provided by Eurostat.
Table 2: ICT practitioner workforce in Europe 2014
ISCO-08 Worker totals (EU28)
code
ICT practitioner workforce
7,535,000
of which
Management, architecture and analysis 1,823,000
Information and communications technology service managers 1330 416,000
Management and organization analysts 2421* 661,000
Systems analysts 2511 746,000
Core ICT practitioners - professional level 2,710,000
Software developers 2512 821,000
Web and multimedia developers 2513 151,000
Applications programmers 2514 785,000
Software and applications developers and analysts n.e.c. 2519 342,000
Database designers and administrators 2521 85,000
Systems administrators 2522 380,000
Computer network professionals 2523 105,000
Database and network professionals n.e.c. 2529 42,000
Other ICT practitioners - professional level 615,000
Electronics engineers 2152 238,000
Telecommunications engineers 2153 235,000
Information technology trainers 2356 25,000
Information and communications technology sales professionals 2434 117,000
Core ICT practitioners - associate/technician level 1,293,000
Information and communications technology operations technicians 3511 396,000
Information and communications technology user support technicians 3512 658,000
Computer network and systems technicians 3513 181,000
Web technicians 3514 57,000
Other ICT practitioners - associate/technician level 1,095,000
Electronics engineering technicians 3114 208,000
Process control technicians n.e.c. 3139 208,000
Air traffic safety electronics technicians 3155 7,000
Medical imaging and therapeutic equipment technicians 3211 242,000
Medical records and health information technicians 3252 18,000
Broadcasting and audio-visual technicians 3521 212,000
Telecommunications engineering technicians 3522 200,000
ICT mechanics and assemblers
1,393,000
(not part of the ICT practitioner workforce)
Electronics mechanics and servicers 7421 309,000
Information and communications technology installers and servicers 7422 461,000
Electrical and electronic equipment assemblers 8212 623,000
Source: empirica calculations based on LFS retrieval by Eurostat. Some further estimates apply. * Note that ISCO group 2421 was
multiplied by 50% in order to allow only for ICT (related) consulting.
9 / 43e-Skills & Digital Leadership Skills Labour Market in Europe 2015 - 2020
ICT practitioners are working in almost all industries of the economy and not just in the ICT industry sector.
Figure 2: ICT professional workforce in Europe 2013 by ICT and Non-ICT industry
Finance
Trade & Logistics Media
6%
8% 5% Hi Tec
Manufacturing
Public 4%
Administration Low Tec
9% Manufacturing
4%
Professional and
Business Services
9% Other
8%
ICT
sector
48%
Based on ISCO-08 minor groups 133, 251, 252 and 351
ICT sector Professional Public Trade & Finance Media Hi Tec Low Tec Other
and Business Administration Logistics Manufacturing Manufacturing
Services
NACE 26;61-63 68-74;77;78;82 84;85 45-53 64-66 58-60 20;21;27-30 10-19;22- 1-9;35-
rev. 2 25;31-33 43;55;56;75;
79-81;86-99
Source: empirica calculations based on LFS retrieval by Eurostat.
Looking at the European ICT professional workforce as a whole, it becomes apparent that three countries
already account for half of today’s jobs, namely the United Kingdom, Germany and France. Adding Italy,
Spain, Poland and the Netherlands already this group of seven would reflect already three quarters of the
European ICT professional workforce.
10 / 43e-Skills & Digital Leadership Skills Labour Market in Europe 2015 - 2020
Figure 3: ICT professional workforce in Europe 2014
UK DE
FR IT
UK
22% ES NL
PL SE
BE CZ
FI AT
SE
3% RO DK
PL HU PT
5% DE BG IE
16% SK GR
NL
6% HR SI
LT EE
ES
7% FR LV LU
IT
12% CY MT
9%
Source: empirica calculations based on LFS retrieval by Eurostat.
The share of the ICT professional workforce within the total workforce is 3.4% in Europe and varies
significantly across the European countries. Sixteen EU Member States show shares below the EU-27
average with Greece, Lithuania, Romania and Cyprus below 2.5%. The other extreme includes the
Netherlands, the United Kingdom, Sweden, Finland and Luxembourg with shares of above 5%.
There is a slightly positive correlation between the share of management levels skills among professionals
and the share of ICT professionals in the workforce (r=0.52). While on average one in four ICT-professional
jobs (24%) is in ICT management, architecture and analysis, countries with an overall large ICT workforce
tend to have seen a trend towards higher-level skills in the ICT workforce, although some exceptions to this
rule appear. In the Netherlands which features the largest share of management, architecture and analysis
jobs, their share is 40%, followed by Belgium (38%), Germany (35%), Finland (34%), Sweden (33%),
Luxembourg (31%), and Latvia (30%). Countries with a share below 15% are, in ascending order, the
Hungary, Slovakia, Czech Republic, Italy and Croatia.
11 / 43e-Skills & Digital Leadership Skills Labour Market in Europe 2015 - 2020
Figure 4: The Structure of the ICT Workforce in European Countries (EU27) in 2014
Source: empirica calculations based on LFS retrieval by Eurostat.
The size of the workforce is represented by the diameter of the country pie charts across job families.
The structure of the ICT workforce can be read from the segments of the pie charts. The largest share of
management, architecture and analysis jobs can e.g. be found in the Netherlands, as mentioned before.
The largest shares in the workforce as percent of the total workforce can be found in Luxemburg, Finland,
Sweden and the UK.
Between countries one can see significant differences in the workforce structure. As for the seven largest
ICT employing nations, there is an especially large share of top ICT jobs in the Netherlands and in Germany.
The UK has the largest workforce, with a huge professional segment as well as management. France and
Poland have a similar structure with many professional level workers. Spain and Italy on the other hand
have far more associate level ICT workers and less highly skilled employees.
12 / 43e-Skills & Digital Leadership Skills Labour Market in Europe 2015 - 2020
Figure 5: ICT professional workforce as share of employed Labour Force in Europe 2014
8.0%
Other ICT practitioners - associate / technician level 7.0%
Core ICT practitioners - associate / technician level
7.0%
6.6%
Other ICT practitioners - professional level
Core ICT practitioners - professional level 6.0%
5.9%
Management, architecture and analysis
6.0%
5.5%
5.4%
5.0%
5.1%
4.8%
5.0%
4.0%
3.9%
3.9%
3.9%
3.5%
4.0%
3.4%
3.5%
3.4%
3.4%
3.0%
3.1%
3.0%
3.0%
2.9%
2.9%
2.7%
2.7%
2.7%
2.6%
2.5%
2.5%
3.0%
2.0%
2.1%
1.9%
1.6%
1.5%
2.0%
1.0%
1.0% 0.0%
0.0% -1.0%
LV
PT
CY
SI
BE
FI
IT
MT
FR
CZ
BG
IE
LT
LU
HR
PL
AT
GR
SK
DK
DE
SE
UK
HU
EE
ES
RO
NL
EU28
Source: empirica calculations based on LFS retrieval by Eurostat.
2.2 Developments
The development of the ICT workforce in Europe between 2000 and 2014 has been very dynamic. The size
of “ICT workforce” naturally depends on the definition used. If using a minimum definition, that only
includes a core set of practitioners, in the first decade of the millennium, from 2000-2010, we have seen an
average compound growth rate of 4.3% and of 3.2% between 2011 and 2014 (with a break in series
2010/11).
13 / 43e-Skills & Digital Leadership Skills Labour Market in Europe 2015 - 2020
Figure 6: Development of ICT employment and average annual growth rates in Europe 2000 – 2013
8
7.4 7.5
million
7.3 7.3
7
6
5 4.6 4.7
4.3 4.5
4.0 4.1
3.8 3.9
4
3.5 3.7
3.2 3.2 3.2 3.3
3
8.5%
5.0%
2
4.5%
4.0%
3.2% 2.9%
2.4% 2.7% 2.6% 2.7%
1 1.4%
1.0%
0.3%
0
2001 2002 2003 2004 2005 2006 2007 2008 2009 2010 2011 2012 2013 2014
* 2010-2011
Broad definition (EU28, 2011-2013) Core definition (EU27) break in series
Source: Eurostat LFS. Narrow definition: 2000-2010 ISCO-88 groups 213, 312: “Computing professionals“ and “Computer associate
professionals“. Break in series 2011: ISCO-08 groups 25 “ICT professionals”, 35 “Information and communications technicians“.
Broad definition: see elsewhere in this document.
In a broader definition, today’s ICT workforce in Europe amounts to 7.5 million workers6, the growth of
workforce according to this broader definition has however been on average 1.2% between 2011 and
20147.
It is notable that between 2008 and 2010, that is when the crisis hit most other labour markets, ICT
employment increased by on average 2.65% per year. From 2011 on, when statistical institutes switched to
a new taxonomy, we were able to produce a broader statistic of the ICT workforce, including many more
ICT jobs, as is depicted by the „Broad Definition”. In the broader definition there is more variance and less
growth for the four years of measurement available.
In a more detailed breakdown of the data, one sees that massive changes in the structure of the workforce
are happening right now. There is a surge in ”Management” and ”Plan/Design” positions: IS management
and governance, architecture, analysis. Europe has added 459,000 jobs in this category in only three years.
There is also obviously a high demand for “core ICT jobs”, such as Software and Application developers,
Web and Multimedia experts, Database designers and administrators, system administrators and network
and operations practitioners.
The open vacancy data that is available from different sources for several countries shows that there is also
a severe excess demand for these core jobs. In vacancy data the most sought after IT positions currently are
software engineering and web development jobs, and application administrators. These jobs are in high
demand with many unfilled vacancies reported.
6 See definitions in the previous chapter.
7 There are no data available before 2011 for the broader definition.
14 / 43e-Skills & Digital Leadership Skills Labour Market in Europe 2015 - 2020
At the same time we see a decrease in the number of jobs for some other jobs, such as peripheral, enabling
and maintenance occupations, including telecoms and electronics engineers, sales and training
professionals and technology specific maintenance and operation technicians.
Figure 7: Growth of ICT professional workforce (EU27) 2014 compared to 2011
Management, ICT managers
architecture Management and organization analysts (partly)
and analysis Systems analysts
Software developers
, 34% Web and multimedia developers
and analysis Applications programmers
Core ICT
practitioners - Other software and applications developers and analysts
titioners - professional Database designers and administrators
9% level
evel Systems administrators
Computer network professionals
ctitioners - Other database and network professionals
-21%
evel Electronics engineers
Other ICT
practitioners - Telecommunications engineers
titioners - professional IT trainers
7% level
hnician level ICT sales professionals
Core ICT ICT operations technicians
practitioners - ICT user support technicians
ctitioners -
-23% associate/
Computer network and systems technicians
hnician level technician
level Web technicians
Electronics engineering technicians
3.5% Process control technicians not elsewhere classified
Other ICT
practitioners - Air traffic safety electronics technicians
associate/ Medical imaging and therapeutic equipment technicians
technician Medical records and health information technicians
level
Broadcasting and audio-visual technicians
Telecommunications engineering technicians
Source: empirica
2.3 ICT Graduates
The major inflows into the ICT workforce would obviously come from the ICT graduates from Higher, and in
some countries Vocational, Education. The e-skills supply in Europe in 2012 from ICT graduates from Higher
Education can be estimated to sum up to 111,000 ICT graduates8. A closer look at the developments over
the past 10 years shows a trend indicating decreasing numbers throughout Europe for the past years, but
especially in the United Kingdom and Sweden. After a continuous increase and a peak of 129,000 ICT
graduates leaving universities in 2006 the figures went down.
8 This figure represents a count of first degrees in ISCED 5A and first qualifications in 5B. The number of students entering the labour force in a given year does
not equal but is approximated by this number of graduates, as many will go on to second or further degrees (master, PhD). However, also counting second
degrees would mean that every student is counted more than once, even if in different years.
By counting only first degrees/qualifications, every graduate will be counted only once (except the supposedly very rare cases of doing both a 5A and 5B
degree), even if labour market entry may be at a later point in time. However, there may be an issue of double counting with initial vocational degrees (ISCED 3
and 4), to which individual learners may later add an ISCED level-5 degree.
Another issue with this method lies in a poor representation of those graduates who earn a second (master’s) degree but switch subjects. On the one hand, ICT
related bachelors may switch to other subjects and not enter the workforce as ICT professionals, while on the other hand there are numerous ICT related
masters that are addressed to non-ICT bachelors.
15 / 43e-Skills & Digital Leadership Skills Labour Market in Europe 2015 - 2020
Figure 8: Enrolment in and Graduates from Computer Science studies (ISCED 5A and 5B) in Europe (EU28)
Computer Science graduates Enrolment in Computer Science
(first degrees / qualifications in ISCED 5A and 5B) (in ISCED 5A and 5B)
Source: Eurostat, some imputations and assumptions apply
The interest in pursuing ICT careers seems to have been diminishing since the middle of the last decade,
when the number of graduates had reached a peak. The number of computer science graduates grew even
after the dot com bubble burst, but has been in decline in Europe since 2006.
The effect of the decrease in the number of graduate entrants to the ICT workforce is intensified in Europe
by an increasing number of retirements and exits, as ICT practitioners leave the workforce. The most
dramatic decrease of graduate numbers can be observed in the UK, where the number of graduates today
is down to just 63% of the number it used to be in 2003. Decreases can also be observed in the other
countries except Germany and France.
France has meanwhile overtaken the United Kingdom in terms of ICT graduates from university and now
contributes 18% of all European graduates. The UK comes in second with 17%, and Germany third (15%) of
the European computer science graduates to the labour market. The shares have changed dramatically, if
compared to ten years earlier when the UK produced almost a third of Europe’s Computer Scientists (30%)
and Germany just 7%.
Enrolment has also reached a peak in 2004 and 2005, but figures have stabilised recently and a slight
increase is visible since 2009.
16 / 43e-Skills & Digital Leadership Skills Labour Market in Europe 2015 - 2020
Figure 9: ICT graduates (first degrees in ISCED 5A and first qualifications in 5B) in Europe 2012
19,900
France United Kingdom
Germany Spain
Poland Netherlands
20,000 Czech Republic Greece
16,800 Italy Hungary
Sweden Romania
Denmark Austria
410
610 Croatia Belgium
690
700
840
1,100 Slovakia Ireland
1,200
1,200 Bulgaria Finland
11,900
1,300
1,400 Lithuania Portugal
1,500
1,500 Slovenia Latvia
1,500
1,600
Estonia Cyprus
1,700
1,700 10,900
2,200 Malta Luxembourg
2,700
2,900 4,000
Source: empirica, based on Eurostat educ_grad5
Figure 10: Tertiary level computer science graduates in EU28 countries in 2003 – 2012
130,000
128,000 125,000
121,000 122,000
109,000 115,000 115,000 114,000
111,000
EU22
Netherlands
Poland
Germany
France
Spain
United
Kingdom
2003 2004 2005 2006 2007 2008 2009 2010 2011 2012
Source: empirica, based on Eurostat educ_grad5
17 / 43e-Skills & Digital Leadership Skills Labour Market in Europe 2015 - 2020
2.4 eSkills demand
What’s new?
2.4.1 ICT skills shortage Number of vacancies (2015)
extrapolated from analysis of online
Today, like in almost all recent years except for the aftermath job postings in five countries.
of the dotcom-bubble bursting, the demand for ICT workers is
Backcasting to 2014 to fit baseline
outstripping supply. We have analysed online vacancy data
(Eurostat figures are not yet
provided through jobfeed (www.jobfeed.com) to estimate the
available for 2015)
number of open posts for ICT professionals. Jobfeed has been
Previously, this estimation was
developed by Textkernel BV (www.textkernel.com/) as a Big
survey based: survey of CIOs / HR in
Data tool for jobs and provides a database of real time and
three countries (2012) and
historical online job data. Together with Jobfeed we analysed
extrapolation (2013)
the online job postings that mapped to the definition of ICT
Online vacancy based estimation
jobs presented in this paper. Jobfeed currently covers 5 EU
2015: 373,000 (EU28)
Member States, but has plans for expansion so that future
Compare: survey based estimation
monitoring activities may well include further countries.
2012: 274,000 (EU27)
The table below provides the numbers of deduplicated job
postings which are active on one specific day in October 2015 (i.e. they had to be not older than 8 weeks
and be still online and not depublished or marked as expired).
For the five countries covered to a sufficiently mature degree for our research purposes, we can identify
205,000 ICT job vacancies. As a percentage of the most recent ICT job data (spring 20149), there are on
average 4.8 vacancies per 100 ICT jobs, or 3.2 per 100 management jobs and 5.4% per 100 practitioner
jobs.
Table 3: ICT practitioner online vacancies in October 2015
Vacancies Oct 2015 (jobfeed) Jobs spring 2014 (LFS, Eurostat) Percentage
Management Practitioners Total Management Practitioners Total
AT 931 4,521 5,452 31,116 108,270 139,386 3.0% 4.2% 3.9%
DE 13,355 59,891 73,246 420,881 776,218 1,197,099 3.2% 7.7% 6.1%
FR 10,791 39,593 50,384 174,859 707,240 882,099 6.2% 5.6% 5.7%
NL 3,455 23,146 26,601 166,889 252,652 419,541 2.1% 9.2% 6.3%
UK 10,048 39,632 49,680 417,083 1,220,450 1,637,532 2.4% 3.2% 3.0%
Total (5) 38,580 166,783 205,363 1,210,828 3,064,831 4,275,658 3.2% 5.4% 4.8%
Source: jobfeed
How representative can these countries be for the rest of Europe? The five countries account for almost
60% of the European workforce. In terms of GDP growth over the last two years, which is a major predictor
of ICT job growth, the five countries come in at ranks 8, 14, 18, 19 and 21 among the EU28. We decided
therefore that it is not out of the range of possibilities that vacancy rates in the rest of Europe average at
the 5 country average of 4.8% as well. Applying this figure, we estimate that there are currently 373,000
open positions for ICT professionals in Europe.
Among these, 16% (58,000) are vacancies for highly qualified positions in ICT management, architecture
and analysis and 84% (315,000) are vacancies for all other ICT professionals. This is a rather surprising
finding, given the dynamics of the number of highly qualified positions and deserves some further research
in the future.
9 It would be correct to use the current number of jobs as denominator, but this data is not available. We are aware that the actual number of ICT jobs is quite
probably higher in October 2015 and therefore the actual percentage of vacancies slightly lower. On the other hand, we might have used historical jobfeed data
of 2014 to estimate the ratio, but we weighted higher the importance to have most recent vacancy data. Given the number of uncertainties in such a model, this
inaccuracy is probably only a minor issue.
18 / 43e-Skills & Digital Leadership Skills Labour Market in Europe 2015 - 2020
This is an increase compared to the survey-based estimate of 2013. The results of a representative empirica
survey of CIO‘s and HR managers in eight European countries in 2012 showed a demand for e-skills at
around 274,000 in 2012. This was then based on the numbers given by CIOs and HR managers in European
organisations for the number of vacancies in ICT-related occupations. Among these, we estimated a
demand of about 73,000 vacancies for ICT management, business architecture and analysis skills and about
201,000 for “Core ICT practitioners” and “Other ICT technicians” jobs.
While we estimate that the number of vacancies has increased by 99,000 between 2012 and 2015, at the
same time we estimate that the number of ICT jobs has increased by 272,000 to a total of 7,674,000.
2.5 ICT professional workforce forecasts What’s new?
Supply forecast increased, for several
The main forecast scenario represents the most likely future as
reasons:
we foresee it for the time horizon of 2014 to 2020. The
forecasting models differentiate between stocks and flows, or Model assumptions about new
between a baseline market and dynamic entries and exits. The talent available have increased – we
baseline basically consists of a number of existing jobs, number of learned that in the past more jobs
vacancies and number of unemployed ICT practitioners. Flows are were created (and filled) than we
modelled as entries of graduates and exits of professionals. foresaw based on graduate figures,
i.e. more lateral entries must have
Supply side model and assumptions made taken place.
The availability of individuals with the different types of e-skills Higher share of STEM graduates go
who are either gainfully employed or seeking employment is into ICT jobs
termed e-skills supply to the labour market. As mentioned above, More “outsiders” or lateral entries
the e-skills supply stock includes individuals in ICT practitioner go into ICT jobs.
positions and unemployed ICT practitioners. The scope of e-skills More cross-border mobility
supply depends on the scope of the e-skills definition used and is The result is an increased absolute
obviously not static. supply figure
The supply total for 2014 is estimated at 7.75 million, of which
7.54 million are in employment and 210,000 unemployed.
E-skills inflows and outflows to/from the labour market need to be identified and statistically measured
and future developments modelled to gain a comprehensive and complete picture of e-skills supply in the
market. To capture market dynamics, i.e. the inflows and outflows of individuals in the pertinent e-skills
categories, specific approaches need to be developed.
New market entrants typically are computer science graduates of tertiary education entering the labour
market. In many countries (Germany and Poland in particular) also (post-) secondary vocational training
plays a major role as supply pool. Computer science graduates are modelled to flow into the ICT workforce
entirely.
Anecdotal evidence supports the observation that the share of computer science graduates has increased
in ICT recruitment over the last decade10, yet other graduates, from mathematics, natural sciences,
engineering or social sciences who possess the IT skills demanded still today fill ICT positions that would
otherwise remain vacant. The number of non-ICT graduates to flow into the ICT workforce is modelled to
follow demand but the number is capped at 10% of the number of STEM graduates (Italy 20%). There are
about 640,000 STEM graduates per year in Europe.
10 A UK study of 2001 still found that „the majority of graduates working in ICT jobs do not hold a degree in an ICT related subject. While the most common degree
subject is maths or computing (40 per cent), others include engineering and technology (21 per cent), physical sciences (11 per cent) and business studies (nine
per cent). Graduates employed as computer analysts/programmers display the greatest range of degree subjects. Also, female graduates working in ICT
occupations are more likely to have degrees in non-ICT or non-technical subjects (e.g. social sciences). (THE INSTITUTE FOR EMPLOYMENT STUDIES
(2001): An Assessment of Skill Needs in Information and Communication Technology.)
http://dera.ioe.ac.uk/15250/1/An%20assessment%20of%20skill%20needs%20in%20ICT.pdf)
19 / 43e-Skills & Digital Leadership Skills Labour Market in Europe 2015 - 2020
While it is relatively easy to approximate an adequately accurate annual supply of university leavers and
vocational school leavers with a major in ICT, any attempt to estimate the supply pool from the official
statistics about natural science, maths, or social sciences graduates has to rely on evidence based
assumptions and auxiliary hypotheses about the share of outsiders entering the ICT workforce.
Also career changers originally coming from a non-ICT background may take on ICT positions, furthermore
re-entrants who had been out of the labour market previously. While recent research (e-skills QUALITY
study: www.eskills-quality.eu) shows that certification has become crucial for ICT practitioners across all
backgrounds, it can be assumed that especially for “educational outsiders” certification and re-skilling
programmes play a crucial role in adapting the workforce skills to the demand side requirements.
Certifications and re-skilling programmes play a crucial role in adapting the workforce skills to the demand
side requirements.
As we have recently underestimated the ability to recruit outsiders from the labour market, the number of
outsiders entering the workforce through qualification and up-skilling measures was set to 0.5% of the
2014 workforce, or 28,500 annually.
The pool for ICT Management recruitment11 (ICT managers, enterprise architects, ICT consultants) was
specified as a percentage of individuals from the ICT practitioner pool getting promoted to management
level and as a percentage those coming from the business side (line management etc.) i.e. external entries.
Finally, immigration is a source of additional supply to the market. We have for the time being not included
immigration from outside the EU into our model, as anecdotal evidence has shown that the absolute
figures of immigration directly into the labour market (i.e. not through the national education systems)
remain to be proven significant. This may change in the near future as recent new immigration from
outside the EU begins to gain access to the ICT labour market.
Supply side exits may be due to retirement, temporary leave (e.g. parental leave) and emigration of ICT
workers as well as promotion or other career change to non-ICT jobs (or jobs at least not statistically
captured as ICT jobs). Replacement demand figures (subsumed under the supply side model here because
in the model it lowers the supply) have been estimated at 2.5% for practitioners and 3.3% for management
positions with some delay built in to allow for the fast growth of the workforce (which tends to lower the
average worker age).
The necessary statistical data regarding university graduations is available from Eurostat (see annex and
chapter Fehler! Verweisquelle konnte nicht gefunden werden.). Further inflow indicators of relevance -
which could be considered subject to availability of the necessary data - include data from immigration and
career changers or market re-entrants.
Outflow data would mainly include statistics on retirements, emigration, career changers or re-entrants.
This kind of data is hardly available across countries and estimates have to be based on analogies.
11 Advanced positions, especially ICT managers, can be recruited from the pool of ICT practitioners or through side entries of non-ICT practitioners (e.g. managers
from other departments). In both cases, there are no statistical concepts of the pools of suitable candidates available, as is the case with university or vocational
graduates for practitioner labour market entries. Seasoned practitioners are an obvious source for management jobs, but both working experience and life-long
learning credentials have to match with the position. While bottlenecks are reported to exist by employers who claim to have a hard time finding good e-leaders, it
is hard to model exact evidence-based parameters for these bottlenecks into our labour market model. We finally resorted to assuming external side entries to be
33% of new demand for management positions (with an unlimited pool), and 67% to be tried to recruited from the existing practitioner pool. For practitioners, a
bottleneck of no more than 2.0% of existing practitioner workforce annually was introduced into the model. The breakdown of total number of vacancies into
management and practitioner positions therefore has to be taken with a pinch of salt, as may underreport or overreport management vacancies and vice versa
for practitioner vacancies.
20 / 43e-Skills & Digital Leadership Skills Labour Market in Europe 2015 - 2020
Demand side model
Conceptually, demand given as a specific figure, i.e. not as a What’s new?
function of wage (as in textbook economics), is the size of the Total skills demand extrapolation
workforce that the market would absorb shortly given that the (2016-2020) uses the same year-on-
current wage level prevailed. Markets tend to adjust via the price year growth rates as in previous
or quantity offered of the commodity. However, certain forecast, but is based on an updated
limitations apply in the labour market in the short term as baseline (new Eurostat figures)
regards the availability of skills, and obviously also with regards Due to composition effects, the
to the wages employers are willing to pay. total demand growth rates are
While a short-term demand can be computed by adding existing slightly lower
and open posts, future demand will be highly path dependent. A Together with the new and more
planned demand that cannot be satisfied today and over a longer reliable vacancy data, the result is
period and where prospects of filling it are meagre will eventually an increased absolute demand
lead to evasion on the demand side, i.e. changes in the figure.
production structure. Therefore it is crucial to understand the
concept of future “demand potential” which will be a demand given the supply available is not actually too
distant from the plans of the enterprises. It should therefore be noted that an extremely high projected
number of vacancies in a distant future will probably not actually be realised, but derives from a demand
potential for potential jobs which could be created if Europe manages to produce the skills needed for
these jobs.
Demand potential up until 2020 is calculated and estimated using the following observations:
The long term trend of ICT workforce growth over the past decade
Annual growth of ICT employment has remained very robust throughout the crisis
The correlations between the ICT workforce growth rates, GDP growth rates and IT investment
growth rates have been disappearing somewhat during recent years
There seems to be less influence of economic cycles and a stronger indication of a “mega-
trend”
Consequence for foresight: Heavier weighting of “trend” in favour of “economic situation”.
The approach contains the following inputs:
Market insight data on enterprise IT spending
Market insight data on hardware, software, services: IT Budgets
Market insight data on Consulting Budgets
(Semi-) Official Statistics on IT spending / IT investment (EITO, Eurostat)
An evidence based estimate on the split of IT budgets into hardware, software, services
Estimation of Labour costs, internal and external
Correlation with GDP growth, IT investment and IT labour market
Scenario outputs on the assumptions of GDP growth, IT investment which leads to estimations
of IT labour demand (costs)
Assumptions on wage developments and IT labour costs result in an estimation of IT labour
headcount.
Technological trends are included to take effect from 2015 on, together with a beginning maturity of some
markets in terms of outsourcing and off-shoring. Other major markets yet are still catching up through this
period.
21 / 43e-Skills & Digital Leadership Skills Labour Market in Europe 2015 - 2020
Scenarios furthermore deliver assumptions on the distribution of IT labour costs into a) management /
business architecture level, b) core ICT practitioners and c) ICT technicians. Technological trends mainly put
pressure on lower skilled ICT practitioner demand, while lifting demand for management / business
architecture type of skills. As is inherent in the concept of demand potential, adjustments to supply
shortage need to be made in the scenario.
The main scenario features an economic growth scenario based on a slow recovery for the time horizon
2015-2020. GDP growth across Europe from 2015 to 2020 is assumed at an average of 1.7 % annually. We
expect moderate IT investment growth up to 3 % per year in the period of 2015 to 2020. In the education
domain we assume a slight increase in the number of ICT graduates (1% increase per year on average). We
also assume labour mobility of ICT workers within the EU to increase from countries of low demand to
countries with excess demand.
Table 4: ‘Main forecast scenario’: Real GDP growth
2015 2016 2017 2018 2019 2020
France 1.4% 1.6% 1.2% 1.3% 1.5% 1.7%
Germany 1.5% 1.6% 1.3% 1.4% 1.6% 1.8%
Italy 1.0% 0.8% 0.8% 0.9% 1.1% 1.3%
Poland 3.8% 3.6% 3.5% 3.6% 3.8% 4.0%
Spain 1.5% 1.9% 1.2% 1.3% 1.5% 1.7%
UK 1.9% 1.5% 1.3% 1.4% 1.6% 1.8%
EU22 2.0% 2.1% 1.8% 1.9% 2.1% 2.3%
EU28 1.7% 1.7% 1.4% 1.5% 1.7% 1.9%
Source: IDC Europe
Table 5: ‘Main forecast scenario’: IT spending growth
2015 2016 2017 2018 2019 2020
France 2.8% 3.0% 3.4% 3.8% 4.2% 3.8%
Germany 2.7% 2.8% 3.3% 3.6% 3.7% 3.7%
Italy 1.7% 2.2% 2.1% 2.8% 5.1% 5.1%
Poland 4.7% 4.9% 5.1% 5.2% 5.3% 4.6%
Spain 1.5% 1.9% 2.7% 4.3% 4.1% 3.1%
UK 2.3% 2.7% 2.5% 2.1% 1.7% 1.2%
EU22 4.4% 3.4% 2.9% 2.3% 2.3% 2.1%
Total 3.0% 2.9% 3.0% 2.9% 3.1% 2.9%
Source: IDC Europe
22 / 43e-Skills & Digital Leadership Skills Labour Market in Europe 2015 - 2020
Results – the forecast
In the ‘Main Forecast Scenario’, the ICT workforce in Europe will grow from 7.5 million in 2014 to 8.2
million in 2020, of which 6.1 million will be ICT practitioners and 2.1 million ICT management and analysis
level employees.
Table 6: e-Skills Jobs – ‘Main forecast scenario’:
Development ICT Professional e-skills Jobs in Europe 2014 – 2020
EU28 (millions) 2014 2015 2016 2017 2018 2019 2020
ICT Management 1,823,000 1,840,000 1,852,000 1,912,000 1,986,000 2,065,000 2,149,000
ICT Practitioners 5,712,000 5,836,000 5,915,000 5,956,000 5,987,000 6,025,000 6,060,000
Total 7,535,000 7,676,000 7,767,000 7,868,000 7,973,000 8,090,000 8,209,000
% Growth +2.9% +1.9% +1.2% +1.3% +1.3% +1.5% +1.5%
Source: empirica model forecast.
Demand is increasing despite the modest economic circumstances, to over 8 million in 2015 and 8.9 million
in 2020.
Table 7: e-Skills Demand Potential - ‘Main forecast scenario’:
Development of ICT Professional e-skills Demand Potential in Europe 2014 – 2020
EU28 (millions) 2014 2015 2016 2017 2018 2019 2020
ICT Management 1,880,000 1,898,000 1,994,000 2,092,000 2,189,000 2,284,000 2,375,000
ICT Practitioners 6,020,000 6,152,000 6,244,000 6,352,000 6,452,000 6,529,000 6,589,000
Total 7,900,000 8,049,000 8,239,000 8,444,000 8,641,000 8,812,000 8,964,000
% Growth +4.0% +1.9% +2.4% +2.5% +2.3% +2.0% +1.7%
Source: IDC Europe
The excess demand or shortage (calculated as the number of open posts)12 amounts to 365,000 in 2015
and 756,000 in 2020. This figure can best be described as ‘demand potential’ or ‘job potential’ for ICT jobs.
It should be seen as a (theoretical) figure describing the demand potential for new ICT jobs which – under
the above assumptions – could theoretically and additionally be created in Europe due to an e-skills
demand likely to occur especially in the years closer to 2020.
Recalling the definition of demand potential, by 2020 the labour market would be able to absorb 756,000
additional workers, if demand is not hampered by supply bottlenecks. Of these 756,000 there are 530,000
potential additional jobs in ICT practitioner occupations and around 226,000 at ICT management level.
12 This model simply adds up the national balances of supply and demand, but only where they reveal an excess demand. It should be noted that this is still a very
conservative estimate, as within countries a perfect geographical match is assumed. Mismatches thus only occur between countries. Migration, which alleviates
the geographical mismatch, is already built into the model, as described in the assumptions section. Apart from geographical mismatches, skills mismatches only
exist between management and practitioner level skills, but the assumptions on management level recruitment out of the pool of practitioners are also
conservatively estimated, rather overestimating the mobility between these categories.
23 / 43e-Skills & Digital Leadership Skills Labour Market in Europe 2015 - 2020
Table 8: e-Skills Vacancies Estimate- ‘Main forecast scenario’:
Summing-up of National ICT Professional Excess Demand in Europe 2014 – 2020
EU27 2014 2015 2016 2017 2018 2019 2020
ICT Management 57,000 58,000 143,000 180,000 203,000 218,000 226,000
ICT Practitioners 307,000 315,000 329,000 396,000 465,000 504,000 530,000
Total 365,000 373,000 472,000 576,000 668,000 722,000 756,000
% Growth +35.2%* +2.2% +26.5% +22.0% +16.0% +8.1% +4.7%
Source: empirica model forecast. Note: this is a summing up of national excess demand figures, not balanced with oversupply in
other countries, but after migration. *: Interpolation
Figure 11: Main Forecast Scenario: ICT Professional Jobs and Demand in Europe (EU-27) 2014 – 2020
EU28 - M ain Forecast Scenario
9,500,000
Demand Pot ent ial Tot al
Jobs Tot al
8,964,000
9,000,000
8,812,000
Jobs and demand potential
8,641,000
756,000
jobs potential
8,500,000 8,444,000
722,000
8,239,000
668,000
8,049,000
576,000 8,209,000
8,000,000 7,900,000 8,090,000
472,000 7,973,000
373,000
365,000 7,767,000
7,868,000
674,000
jobs added
7,676,000
7,500,000
7,535,000
7,000,000
2014 2015 2016 2017 2018 2019 2020
While currently a relative majority of vacancies exists in Germany, the comparably lower graduate figures in
the United Kingdom and in Italy suggest that the problem of skills shortages will severely aggravate in these
countries. While in absolute figures increasing from 73,000 (2015) to 150,000, the share of German
vacancies in the European will remain at 20%. By contrast, the number of vacancies grows immensely in the
UK from 50,000 to 161,000 (13% to 21%). In Italy, the number of vacancies is expected to rise from 33,000
to 135,000 (9% to 18%).
This figure of course strongly depends (of course among other factors) on the cross border mobility of IT
workers into countries of highest demand.
24 / 43You can also read