Shale Gas, Competitiveness, and New US Chemical Industry Investment: An Analysis Based on Announced Projects - Economics & Statistics Department ...
←
→
Page content transcription
If your browser does not render page correctly, please read the page content below
Shale  Gas,  Competitiveness,  and
New  US  Chemical  Industry
Investment:  An  Analysis  Based
on  Announced  Projects

Economics  &  Statistics  Department
American  Chemistry  Council
May  2013
Contents Executive Summary ....................................................................................................................................................5 Introduction ................................................................................................................................................................8 A New Competitive Advantage for US Chemical Manufacturers ...............................................................................8 The Development of Shale Gas ............................................................................................................................... 10 Energy Use and the Chemical Industry .................................................................................................................... 16 US Chemical Industry Capital Spending to 2020 ..................................................................................................... 22 Added US Chemical Industry Output to 2020 ......................................................................................................... 26 Added US Chemical Industry Job Creation by 2020 ................................................................................................ 31 Tax Revenues ........................................................................................................................................................... 33 Post-‐2020 US Chemical Industry Capital Spending and Output .............................................................................. 34 Conclusion ............................................................................................................................................................... 35 ACC Economics & Statistics ..................................................................................................................................... 36 Appendix 1: Methodology and Assumptions .......................................................................................................... 37 Appendix 2: List of Companies that have Announced Shale-‐Related ..................................................................... 41 Chemical Industry Investments ............................................................................................................................... 41 Appendix 3: Detailed Results from IMPLAN Modeling of Increased Chemical Industry Output in 2020 ............... 42 Appendix 4: Simplified Chemical Value Chains ....................................................................................................... 43 Appendix 5: Alternative High Case .......................................................................................................................... 46
Executive Summary
ŚĞŵŝƐƚƌLJƚƌĂŶƐĨŽƌŵƐƌĂǁŵĂƚĞƌŝĂůƐŝŶƚŽƚŚĞƉƌŽĚƵĐƚƐĂŶĚƉƌŽĐĞƐƐĞƐƚŚĂƚŵĂŬĞŵŽĚĞƌŶůŝĨĞƉŽƐƐŝďůĞ͘ŵĞƌŝĐĂ͛Ɛ
chemical industry relies on energy derived from natural gas not only to heat and power our facilities, but also as
ĂƌĂǁŵĂƚĞƌŝĂů͕Žƌ͞ĨĞĞĚƐƚŽĐŬ͕͟to develop the thousands of products that make American lives better, healthier,
and safer.
Shale Gas ʹ A Game Changer for US Competitiveness
Access to vast, new supplies of natural gas from previously untapped shale deposits is one of the most exciting
domestic energy developments of the past 50 years. After years of high, volatile natural gas prices, the new
economics of shale gas are creating a competitive advantage for US manufacturers, leading to greater
investment, industry growth, and jobs.
ŵĞƌŝĐĂ͛Ɛ ĐŚĞŵŝĐĂů ĐŽŵƉĂŶŝĞƐ ƵƐĞ ĞƚŚĂŶĞ͕ Ă ŶĂƚƵƌĂů ŐĂƐ ůŝƋƵŝĚ ĚĞƌŝǀĞĚ ĨƌŽŵ ƐŚĂůĞ ŐĂƐ͕ ĂƐ Ă ĨĞĞĚƐƚŽĐŬ ŝŶ
numerous applications. Its relatively low price gives US manufacturers an advantage over many competitors
around the world that rely on naphtha, a more expensive, oil-‐based feedstock. Growth in domestic shale gas
production is helping to reduce US natural gas prices and create a more stable supply of natural gas and ethane.
As economic theory teaches and history shows, a reduction in the cost of factor inputs such as natural gas and
ethane leads to enhanced competitiveness and a positive supply response. In other words, the supply curve
shifts to the right and a higher quantity of output is produced at a lower cost. Economic theory also shows that
the lower the cost of a good, the higher the demand by consuming industries. This new competitiveness
dynamic has made the United States a cost-‐advantaged location for investment, which fosters overall economic
growth and job creation.
Chemical companies from around the world have announced plans for a significant number of new projects to
build and expand their shale-‐advantaged capacity in the United States. Through the end of March 2013, nearly
100 chemical industry investments valued at $71.7 billion had been announced. The majority are being made to
expand production capacity for ethylene, ethylene derivatives (i.e., polyethylene, polyvinyl chloride, etc.),
ammonia, methanol, propylene, and chlorine. Much of the investment is geared toward export markets, which
can help improve the US trade deficit.
Roughly half of the announced investments to date are from firms based outside the U.S. The fact that such
large numbers of foreign-‐owned companies are choosing to source their chemistry in the United States is
ƵŶƉƌĞĐĞĚĞŶƚĞĚ ŝŶ ƌĞĐĞŶƚ ŚŝƐƚŽƌLJ͕ ĂŶĚ Ă ƚĞƐƚĂŵĞŶƚ ƚŽ ƚŚĞ ǀĂůƵĞ ĂŶĚ ĂĨĨŽƌĚĂďŝůŝƚLJ ŽĨ ŵĞƌŝĐĂ͛Ɛ ƐŚĂůĞ ŐĂƐ ĂŶĚ
ethane supplies. The U.S. is poised to capture market share from the rest of the world, and no other country or
continent has as bright an outlook when it comes to natural gas.
New Report Adds Chapter to Shale Gas Story
This report is the third in a series examining the potential economic and employment benefits of natural gas
development from shale. The first report, released in March 2011, presented the results of an analysis of the
potential economic effects of increased petrochemicals production to the US economy. That report, Shale Gas
and New Petrochemicals Investment: Benefits for the Economy, Jobs, and US Manufacturing, discussed the
impact of a hypothetical 25 percent increase in ethane supply on growth in U.S. petrochemicals. ACC found that
the increase would generate new capital investment and production in the chemical industry, job growth in the
chemical industry and in its supplier sectors, expanded output throughout the U.S. economy and increases in
federal, state and local tax revenues.
In May 2012, ACC extended the analysis to consider the impact of lower natural gas prices on a wider segment
of the US manufacturing base. The report analyzed the effects of renewed competitiveness and the supply
response among eight key manufacturing industries: paper, chemicals, plastic and rubber products, glass, iron
5
and steel, aluminum, foundries, and fabricated metal products industries. In that report -‐-‐ Shale Gas,
Competitiveness and New Investment: Benefits for the Economy, Jobs, and US Manufacturing -‐-‐ ACC found a
tremendous opportunity for shale gas to strengthen US manufacturing, boost economic output and create jobs.
This third report -‐-‐ Shale Gas, Competitiveness and New US Chemical Industry Investment: An Analysis Based on
Announced Projects -‐-‐ returns once again to the chemical industry. The report is based on a detailed
examination of the 97 chemical industry projects that have been announced as of March 2013 and their
potential for job creation, increased output, and additional tax revenue at the state, local and federal levels. The
analysis was broken into two parts: 1) Economic impacts that occur during the ten-‐year initial capital investment
phase, when new plant and equipment are purchased and plants constructed; and 2) Economic impacts as a
result of ongoing increased chemical output, made possible by lower natural gas prices and increased availability
of ethane. The two tables that follow ƐƵŵŵĂƌŝnjĞƚŚĞƌĞƉŽƌƚ͛ƐŬĞLJĨŝŶĚŝŶŐƐ͗
Economic Impacts During the Investment Phase (Temporary)
(2010-‐2020)
Chemical Industry Direct Jobs* Indirect Jobs* Payroll-‐Induced Jobs* Total Jobs* Federal,
Investment (Projects State and
announced through Local Tax
March 2013) Collections
$71.7 billion in 485,000 jobs in 258,000 jobs in firms Workers in direct + 1.2 million $20 billion
chemical industry construction and along the supply indirect industries will
investments (97 capital goods chain, i.e., firms that earn payrolls totaling
projects) to build manufacturing, i.e., supply materials, $47.1 billion. Their
and/or expand in the process equipment, equipment, and household spending in
h͘^͘ǁŝůůŐĞŶĞƌĂƚĞ͙ tanks, pipes, valves, services to their communities will
etc. contractors involved support 442,000
in the build-‐out. payroll-‐induced jobs
*Because the investment occurs over a multi-‐year period, jobs should be interpreted as work-‐year jobs. This is done to avoid
double-‐counting the same job in multiple years.
Economic Impacts From Increased Chemical Industry Output (Permanent)
(By 2020)
Increased Chemical Direct Jobs Indirect Jobs Payroll-‐Induced Jobs Total Federal,
Industry Output Jobs State and
Local Tax
Collection
The $71.7 billion in The $66.8 billion The $66.8 billion in new The 310,000 direct + 537,000 $14 billion
announced chemical in new chemical chemical industry output will indirect jobs will earn
industry investments industry output generate purchases of raw payrolls totaling
will lead to $66.8 will require more materials, equipment, and $23.8 billion.
billion in increased chemical industry services in the supply chain, Household spending
chemical industry workers, creating creating 264,000 indirect by these workers in
output. This is a 9% more than 46,000 jobs. Added output of these their communities
gain above what direct chemical supplier sectors will lead to will support an
output would industry jobs. an additional $100 billion in additional 226,000
otherwise be in 2020. indirect economic output. payroll-‐induced jobs.
6
Government Policies Key to Realizing the Shale Gas Opportunity
Shale gas offers the United States an enormous opportunity to become more competitive internationally, grow
our economy, and create jobs. To capitalize on it, policymakers must develop balanced legislative and
regulatory policies that reflect the importance of natural gas as an energy source and manufacturing feedstock,
while protecting our water supplies and environment. ACC supports state-‐level oversight of hydraulic fracturing,
as state governments have the knowledge and experience to oversee hydraulic fracturing in their jurisdictions.
Furthermore, ACC is committed to transparency regarding the disclosure of the chemical ingredients of
hydraulic fracturing solutions, subject to the protection of proprietary information.
A whole host of policies will influence whether domestic natural gas supplies remain robust and affordable and,
ŝŶƚƵƌŶ͕ǁŚĞƚŚĞƌŵĞƌŝĐĂ͛ƐŵĂŶƵĨĂĐƚƵƌŝŶŐƌĞŶĂŝƐƐĂŶĐĞŝƐƐƵƐƚĂŝŶĞĚ͘dŚĞLJŝŶĐůƵĚĞ͗
x Access to oil and gas reserves on federal, state and private lands;
x Continuing state-‐based regulation of unconventional oil and gas production;
x Improving the ability to site, permit, and build infrastructure that links oil and gas production to
chemical manufacturing facilities;
x WƌĞƐĞƌǀŝŶŐĐŽĂů͛Ɛŝŵportant role as an energy source for baseload power generation;
x Maintaining accelerated depreciation schedules for chemical industry investments in new plant and
equipment;
x Expanding access to foreign markets for US goods
Right now, the chemistry industry has the confidence needed to drive new U. investment. Policymakers can
help ensure that confidence continues for decades to come.
7
Introduction
American manufacturers use natural gas to fuel and power a wide variety of processes to produce a broad
portfolio of manufactured goods. Growth in domestic shale gas production is helping to reduce US natural gas
prices and create a more stable supply of natural gas for fuel and power. In addition, it is also leading to more
affordable supplies of ethane, a natural gas liquid and key feedstock, or raw material, used in the chemical
industry. As economic theory teaches and history shows, a reduction in the cost of a factor input such as natural
gas leads to enhanced competitiveness and a positive supply response. In other words, the supply curve shifts to
the right and a higher quantity of output is produced at a lower cost. Economic theory also shows that the lower
the cost of a good, the higher the demand by consuming industries. This new competitiveness dynamic has
made the United States a cost-‐advantaged location for private sector investment, which fosters job creation.
This report is the third in a series presenting the potential economic and employment benefits of natural gas
development from shale. The first report, released in March 2011, presented the results of an analysis of the
potential economic effects of increased petrochemicals production to the US economy. That report, Shale Gas
and New Petrochemicals Investment: Benefits for the Economy, Jobs, and US Manufacturing, discussed the
impact of a 25 percent increase in ethane supply on growth in US petrochemicals. ACC found that the increase
would generate new capital investment and production in the chemical industry, job growth in the chemical
industry and in its supplier sectors, expanded output throughout the US economy and increases in federal, state
and local tax revenues.
In May 2012, ACC extended the analysis to consider the impact of lower natural gas prices on a wider segment
of the US manufacturing base. The report analyzed the effects of renewed competitiveness and the supply
response among eight key manufacturing industries: paper, chemicals, plastic and rubber products, glass, iron
and steel, aluminum, foundries, and fabricated metal products industries. In this report -‐-‐ Shale Gas,
Competitiveness and New Investment: Benefits for the Economy, Jobs, and US Manufacturing -‐-‐ ACC found a
tremendous opportunity for shale gas to strengthen US manufacturing, boost economic output and create jobs.
This third report -‐-‐ Shale Gas, Competitiveness and New U.S. Chemical Industry Investment -‐-‐ returns once
again to the chemical industry. Chemical companies from around the world have announced new investments in
US capacity to benefit from available resources and grow their businesses. We have reviewed nearly 100 project
announcements. This report is based on a detailed examination of these projects and the potential effects from
the wave of investment on job creation, new output, and tax implications for state, local and the Federal
government. Some of these investments are being made in areas of the country that have been hardest-‐hit by
declines in manufacturing. These investments improve the outlook in these economically depressed areas of the
ĐŽƵŶƚƌLJ͘ &ƵƌƚŚĞƌ ĚĞǀĞůŽƉŵĞŶƚ ŽĨ ƚŚĞ ŶĂƚŝŽŶ͛Ɛ ƐŚĂůĞ ŐĂƐ ĂŶĚ ĞƚŚĂŶĞ ĐĂŶ ĚƌŝǀĞ ĂŶ ĞǀĞŶ ŐƌĞĂƚĞƌ ĞdžƉĂŶƐŝŽŶ ŝŶ
domestic manufacturing capacity, provided that policymakers develop balanced regulatory policies and
permitting practices.
A New Competitive Advantage for US Chemical Manufacturers
A new competitive advantage has emerged for chemical manufacturing in the United States as vast new
supplies of natural gas from largely untapped shale gas resources, including the Marcellus along the Appalachian
mountain chain, are leading to massive capital investment and expansion of the US chemical industry. With the
development of new shale gas resources, US industry is announcing expansions of capacity, reversing a decade-‐
long decline and providing opportunities for new jobs at a time when the United States is facing persistent high
unemployment. This report presents the results of an analysis that was conducted by ACC to quantify the
economic impact of the significant investment and additional production in the US chemical industry stimulated
by the increased availability of low cost natural gas and the resulting gain in competitiveness.
8
The US chemical industry is the largest industrial consumer of natural gas for fuel and power and also for
feedstock. The economic impact of the additional production in the US chemical industry invigorated by
improved competitiveness resulting from an increase in the availability of low cost natural gas is game changing.
Based on actual project announcements through March 2013, the US chemical industry is expected to spend at
least $71.7 billion in private capital investment on new plant and equipment by 2020, to capitalize on the
renewed competitiveness brought about by the shale gas revolution. Further, we expect that additional
unannounced investment in chemical capacity is likely to occur. As much as $82.4 billion may be invested in new
chemical industry capacity by 2020.
The $71.7 billion in capacity-‐expansion investments announced to date will engender an additional $66.8
billion in chemical industry output, providing a 9% gain above what output would be otherwise in 2020. In turn,
this will create new chemical industry jobs and additional output in supplier (or indirect) industries. Combined,
the added output of these supplier sectors of the economy will lead to an additional $100 billion in indirect
economic output. On top of the direct and indirect effects, household spending as a result of the new jobs
created (i.e., payroll-‐induced effects) will lead to an additional gains of $34 billion gain elsewhere in the
economy. Looking at employment, the supply response from shale gas will directly create 46,000 jobs in the US
chemical industry due to expanded chemical production. These are high-‐paying jobs, the type of manufacturing
jobs that policy-‐makers would welcome in this economy. In addition to the jobs created in the US chemical
industry, another 264,000 indirect jobs would be created in supplier industries, and another 226,000 payroll-‐
induced jobs would be created elsewhere in the economy through household spending of wages, leading to a
total of 537,000 new jobs. The jobs created and expanded output from the increase in chemical industry
production would lead to a gain in federal, state and local tax collections, totaling nearly $14 billion in 2020.
The build-‐out of new chemical industry capacity actually began in 2010. During the investment phase through
2020, $71.7 billion in investments made by the US chemical industry will directly create 485,000 jobs1 over ten
years, largely in construction and capital goods industries. The ten-‐year investment wave will also lead to an
additional $122 billion in added output via indirect and induced effects. Thus, the total economic impact during
the investment phase will be $193 billion in additional output. This added output will create an additional
700,000 indirect and payroll-‐induced jobs, leading to a total of 1.2 million jobs during the ten-‐year investment
wave. The jobs created and increased output resulting from the investment period will lead to a gain in federal,
state and local tax collections, totaling $20 billion over the ten-‐year investment phase.
These estimates of job creation in the chemical industry, however, are understated. The focus of this analysis
is on the supply side response arising from lower natural gas prices. On the demand side, increasing oil and gas
development will have a favorable effect on the demand for oilfield chemicals. Supply-‐side responses in other
industries such as plastic products and tire and rubber products, moreover, will respectively positively impact
the demand for plastic resins, plastic additives and compounding services and the demand for synthetic rubber
and rubber processing chemicals. These effects are outside the scope of and would be in addition to the
estimates in this present analysis.
Thus, based on a large private investment initiative driven by newly abundant domestic supplies of natural
gas, a significant strengthening of the vital US manufacturing is possible. A reasonable regulatory regime will
facilitate this development, while the wrong policy initiatives could derail this recovery and expansion and the
associated job creation.
1
Because the investment occurs over a multi-‐year period, total jobs should be interpreted as work-‐year jobs. This is done to
avoid double counting the same job in multiple years.
9
The Development of Shale Gas
One of the more interesting developments in the last five years has been the dynamic shift in natural gas
markets. Between the mid-‐1960s and the mid-‐2000s, proved natural gas reserves in the United States fell by
one-‐third, the result of restrictions on drilling and other supply constraints. Starting in the 1990s, government
promoted the use of natural gas as a clean fuel, and with fixed supply and rising demand from electric utilities, a
natural gas supply shortage occurred, causing prices to rise from an average of $1.92 per thousand cubic feet in
the 1990s to $7.33 in 2005. The rising trend in prices were exacerbated by the effects of hurricanes Katrina and
Rita in 2005, which sent prices over $12.00 per thousand cubic feet for several months due to damage to gas
production facilities.
Shale and other non-‐conventional gas were always present geologically in the United States. Figure 1
illustrates where shale gas resources are located in the United States. These geological formations have been
known for decades to contain significant amounts of natural gas, but it was not economically feasible to develop
given the technology available. However, uneconomic resources often become marketable assets as a result of
technological innovation, and shale gas is a prime example.
Over the last five years, several factors have combined to stimulate the development of shale gas resources.
First was a new way of gathering natural gas from tight-‐rock deposits of organic shale through horizontal drilling
combined with hydraulic fracturing. Horizontal drilling allows producers to drill vertically several thousand feet
and then turn 90 degrees and drill horizontally, expanding the amount of shale exposed for extraction. With the
ability to drill horizontally, multiple wells from one drilling pad (much likes spokes on a wheel) are possible,
resulting in a dramatic expansion of shale available for extraction, which significantly boosts productivity. A
typical well might drill 1½ miles beneath the surface and then laterally 2,000-‐9,000 feet.
10
FIGURE 1: SHALE GAS RESOURCES
The second innovation entailed improvements to hydraulic fracturing (or fracking). This involves fracturing the
low-‐permeability shale rock by using water pressure. Although these well stimulation techniques have been
around for nearly 50 years, the technology has significantly improved. A water solution injected under high
pressure cracks the shale formation. Small particles, usually sand, in the solution hold the cracks open, greatly
increasing the amount of natural gas that can be extracted. Fracturing the rock using water pressure is often
aided by chemistry (polymers, gelling agents, foaming agents, etc.). A typical well requires two to three million
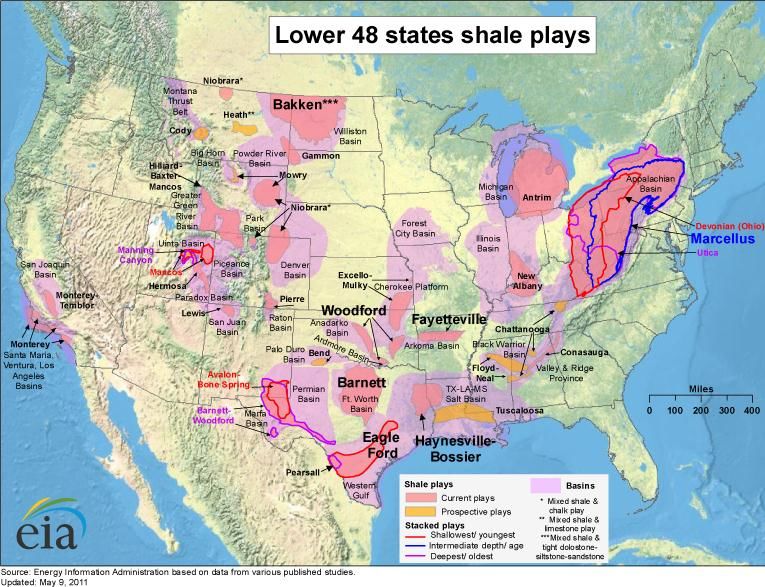
gallons of water and 1.5 million pounds of sand. About 99.5% of the mixture is sand and water. Figure 2 provides
a simple illustration of these technologies. Another important technology is multi-‐seismology that allows a more
accurate view of potential shale gas deposits.
11
FIGURE 2: GEOLOGY OF SHALE GAS AND CONVENTIONAL NATURAL GAS
With these innovations in natural gas drilling and production, the productivity and profitability of extracting
natural gas from shale deposits became possible. Further, unlike traditional associated and non-‐associated gas
deposits that are discrete in nature, shale gas often occurs in continuous formations. While shale gas production
is complex and subject to steep production declines, shale gas supply is potentially less volatile because of the
continuous nature of shale formations. Many industry observers suggest that the current state of shale gas
operations is more closely analogous to manufacturing operations than traditional oil and gas exploration,
development and production.
These new technical discoveries have vastly expanded estimates of natural gas resources and will offset
expected declines in conventional associated-‐gas production. Estimates of technically recoverable shale gas
were first assessed by the National Petroleum Council (NPC) at 38 trillion cubic feet (TCF) in 2003. More recently,
the Potential Gas Committee (PGC) estimated US shale gas resources of 1,073 TCF at the end of 2012. The
United States is now estimated to possess nearly 2,700 TCF of potential (or future) natural gas supply, 40% of
which is shale gas that could not be extracted economically as recently as eight years ago. This translates into an
additional supply of 47 years at current rates of consumption of about 23 TCF per year. Total US natural gas
resources are estimated to be large enough to meet over 115 years of demand. Due to the emergence of new
shale gas supplies, the US sharply reduced gas imports from Canada and liquefied natural gas (LNG) receipts,
over the past several years.
Higher prices for natural gas in the last decade (especially after hurricanes Katrina and Rita) and the advances
in horizontal drilling and hydraulic fracturing (i.e., chemistry in action) changed the dynamics for economic shale
gas extraction. These technologies allowed extraction of shale gas at about $7.00 per thousand cubic feet, which
was well below the historical trend. With new economic viability, natural gas producers have responded by
ĚƌŝůůŝŶŐ͕ƐĞƚƚŝŶŐŽĨĨĂ͞ƐŚĂůĞŐĂƐƌƵƐŚ͟. As learning curve effects took hold, the cost to extract shale gas (including
return on capital) fell, making even more supply (and demand) available at lower cost. Moreover, natural gas
liquids have become paramount in changing the economics of shale gas production. It is the sales of ethane and
other liquids that have enabled producers to extract and sell natural gas at less than $3.50 per thousand cubic
feet. Although the path was irregular, average daily consumption of natural gas rose from 60.3 billion cubic feet
12
(BCF) per day in 2005 to 62.0 BCF per day in 2009. Moreover, since the mid-‐2000s, US-‐proved natural gas
reserves have risen by one-‐ƚŚŝƌĚ͘ /Ŷ ĞĐŽŶŽŵŝƐƚƐ͛ ƚĞƌŵƐ͕ ƚŚĞ ƐƵƉƉůLJ ĐƵƌǀĞ has shifted to the right, resulting in
lower prices and greater availability. As a result, average natural gas prices fell from $7.33 per thousand cubic
feet in 2005 to $3.65 per thousand cubic feet in 2009. In 2010 and 2011, a recovery of gas-‐consuming industries
and prices occurred. Average daily consumption rose to 66.9 BCF and prices strengthened to $4.12 per thousand
cubic feet. But the mild winter of 2011-‐12 resulted in a record level of stocks and pushed prices even lower to
$2.79 per thousand cubic feet. Figure 3 ŝůůƵƐƚƌĂƚĞƐŚŽǁƚŚŝƐŶĞǁƚĞĐŚŶŽůŽŐLJ͛ƐĞŶƚƌĂŶĐĞŝŶƚŽƚŚĞŵĂƌŬĞƚexpanded
supply and pushed prices lower.
FIGURE 3
THE ADVENT OF SHALE GAS RESULTED IN MORE, LESS COSTLY SUPPLY OF US NATURAL GAS
Before the development of shale gas, the US was a gas importing nation. The US is now a gas surplus nation
and has become the leading global producer. ^ŚĂůĞ ŐĂƐ ŝƐ ƚŚƵƐ Ă ͞ŐĂŵĞ ĐŚĂŶŐĞƌ͘͟ /Ŷ ƚŚĞ ĚĞĐĂĚĞƐ to come,
unconventional gas could provide half of US natural gas needs, compared to only 8% in 2008. dŚĞh^͛ƐĨĂǀŽƌĂďůĞ
position is illustrated in Figure 4. As natural gas prices have fallen in the US in wake of the emerging shale gas
revolution, prices in other major nations have risen.
13
FIGURE  4
TRENDS  IN  NATURAL  GAS  PRICES  ACROSS  THE  WORLD

        $  per  million  BTUs
         $18.00
         $16.00
         $14.00
         $12.00
         $10.00
           $8.00
           $6.00
           $4.00
           $2.00
           $0.00
                    02         03         04         05        06         07         08          09        10     11     12

                            United  States          Belgium         Germany           Japan           Brazil    China   India

       Sources:  EIA,  Petrobas,  IMF,  World  Bank,  various  national  statistical  agencies


   By   2012,  North  America  featured  some  of  the  lowest  cost   natural  gas  in  the  world.  Figure  5  illustrates  this.
Prices   in   Russia   and   Iran   have   appreciated   beyond  that   of   the   United   States.  Prices   in   Saudi   Arabia  are  set   at
$0.75   per   million   BTUs   by  government   decree.   These   prices   were   originally   due   for   adjustment   in   2012   but   a
decision   on   this   has   been   delayed.   Prices   at   this   level   are   artificial   and   would   actually   be   around   $3.00   per
million  BTUs  if  a  free  market  existed.


                                                                           14
You can also read