2021 ACCESS TO SERVICES IN RURAL SPAIN - Documentos Ocasionales N.º 2122
←
→
Page content transcription
If your browser does not render page correctly, please read the page content below
ACCESS TO SERVICES
IN RURAL SPAIN                                    2021

Documentos Ocasionales
N.º 2122

Mario Alloza, Víctor González-Díez,
Enrique Moral-Benito and Patrocinio Tello-Casas
ACCESS TO SERVICES IN RURAL SPAIN
ACCESS TO SERVICES IN RURAL SPAIN (*)

Mario Alloza
BANCO DE ESPAÑA

Víctor González-Díez
BANCO DE ESPAÑA

Enrique Moral-Benito
BANCO DE ESPAÑA

Patrocinio Tello-Casas
BANCO DE ESPAÑA

(*) The authors thank Mert Kompil and Kiko Llaneras for sharing their data on accessibility to services,
and Francisco Goerlich and Ángel Gavilán for their suggestions.

Documentos Ocasionales. N.º 2122
September 2021
The Occasional Paper Series seeks to disseminate work conducted at the Banco de España, in the
performance of its functions, that may be of general interest.

The opinions and analyses in the Occasional Paper Series are the responsibility of the authors and, therefore,
do not necessarily coincide with those of the Banco de España or the Eurosystem.

The Banco de España disseminates its main reports and most of its publications via the Internet on its
website at: http://www.bde.es.

Reproduction for educational and non-commercial purposes is permitted provided that the source is
acknowledged.

© BANCO DE ESPAÑA, Madrid, 2021

ISSN: 1696-2230 (on-line edition)
Abstract

This paper explores the differences in accessibility to services between rural and urban areas
in EU countries. According to our analysis, rural areas in Spain have worse accessibility to
services than their European counterparts, while the differences are not significant in the
case of urban areas. The availability of information at the municipal level in Spain means
a deficit in the accessibility to services of rural as opposed to urban municipalities may be
documented within each region. There are also some idiosyncrasies in the remoteness and
fiscal structures of rural municipalities that might partly explain this deficit.

Keywords: services accessibility, rural areas, urban areas, Spain.

JEL classification: R10, I31, J11.
Resumen

Este documento analiza las diferencias que existen en la accesibilidad a servicios entre
las zonas rurales y las urbanas en los países de la Unión Europea. Los resultados indican
que, en España, las áreas rurales presentan una peor accesibilidad a servicios que sus
homólogas europeas, mientras que las diferencias no son significativas en el caso de las
áreas urbanas. La disponibilidad de información a nivel municipal para el caso español
permite documentar un déficit en la accesibilidad a servicios de los municipios rurales
frente a los urbanos dentro de cada comunidad autónoma. Asimismo, se observan algunas
idiosincrasias en la geografía y en la fiscalidad de los municipios rurales que podrían explicar,
al menos en parte, dicho déficit.

Palabras clave: accesibilidad, servicios, áreas rurales y urbanas.

Códigos JEL: R10, I31, J11.
Contents
Abstract 5
Resumen 6
1 Introduction 8
2 Accessibility to services in the European Union regions 10
3 The rural-urban divide at the municipal level in Spain 15
3.1 Differences in access to services 15
3.2 Differences in geographical factors 16
3.3. Differences in taxation and the budgets of rural and urban municipalities 17
4 The deficit in services accessibility in Spain’s rural municipalities and the role
of the geographical and fiscal situation 22
5
Some significant additional dimensions to the provision of services in rural areas 27
6 Conclusions 29
References 30
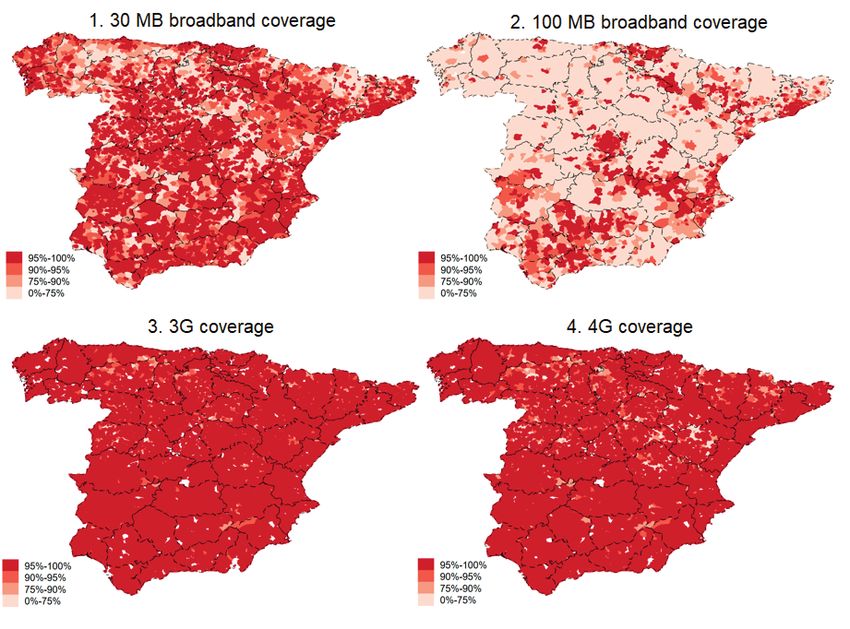
Box 1 Digital services accessibility in Spanish municipalities 31
Annex 1 Services accessibility indicators: Kompil et al. (2019) database 35
Annex 2 Analysis of the differences in the budgetary structure of rural and urban
municipalities 391 Introduction
The economic literature has identified various economic reasons that may help explain why
population and activity are concentrated in a relatively limited portion of the territory. Thus,
for instance, greater physical proximity makes for easier interaction between companies and
employees and allows, moreover, for the provision of services at a lower cost per person.
These are the so-called “economies of agglomeration” (see Duranton and Puga (2020)).
However, the demographic and economic dynamics these concentration-geared centripetal
forces entail have very different implications for specific territorial areas which, in turn, may
trigger some social unrest (see Rodríguez-Pose (2018)). Indeed, the increase in the rate of
urbanisation of the Spanish economy over recent years has been accompanied by a new
episode of rural depopulation in Spain (see Gutiérrez et al. (2020a)). Against this background,
the discussion on inequality between rural and urban areas in terms of access to services
has moved up the public debate agenda, at both the national and European level (see Banco
de España (2021)).
This paper offers a detailed analysis of accessibility to different types of services
in the EU countries, with a particular emphasis on the differences between rural and urban
areas. Specifically, the services accessibility indicators compiled by Kompil et al. (2019) for
the EU countries allow for research into whether there are significant differences in access
to specific services between the EU regions – defined following the NUTS3 classification,
which in Spain encompasses the provinces – and between different municipalities in Spain.
The analysis particularly highlights what are called “local services” under the Kompil et al.
(2019) taxonomy, which are those services whose scope or coverage is concentrated in
small geographical areas, and which include, for example, a library, a primary school or a
primary healthcare centre (see Annex 1 for a more detailed description of these services).
Moreover, the availability of additional information at the municipal level in the Spanish case
enables the factors at least partly behind the differences observed between rural and urban
municipalities to be explored in greater detail.1
As to the situation of Spanish provinces from the European perspective, the
results indicate that services accessibility in Spain is in line with its European counterparts.
Specifically, the average Spanish citizen is 3.5 km away from the nearest local service,
compared with 4 km for the average citizen in the rest of the EU. However, the differences in
services accessibility between rural and urban areas are more marked in Spain. Predominantly
rural provinces in Spain thus show a lesser availability of local services than their European
counterparts in terms of distance to the closest service for the average citizen. In particular,
the average citizen in Spanish rural provinces2 is 12.4 km away from the closest local
service, compared with 4.8 km, 7.6 km and 4.7 km for average citizens in the rural regions of
1 he data set out in Gutiérrez et al. (2020b) are used for the analysis of geographical variables at the municipal level, and
T
the Spanish Ministry of Finance data presented in Alloza and Burriel (2019) for the analysis of fiscal variables.
2 ccording to Eurostat’s taxonomy, any province in which over 50% of its population does not reside in urban areas
A
and which, moreover, has no urban area with over 200,000 inhabitants is considered to be rural. For further details,
see the second section.
BANCO DE ESPAÑA 8 DOCUMENTO OCASIONAL N.º 2122Germany, France and Italy, respectively. Conversely, this difference between Spain and the
other EU countries is not seen in the case of urban areas.
With regard to the differences between municipalities in Spain, a significant deficit
can be observed in the services accessibility of rural as opposed to urban municipalities. For
example, on average, citizens of rural municipalities in Spain are around 20 km further away
than their urban counterparts from the closest local service.3 Significant differences are also
documented between rural and urban municipalities in Spain in terms of their geographical
and local public finance characteristics. On one hand, rural municipalities tend to be more
geographically isolated, which usually entails greater difficulty and a higher cost in the provision
of specific services. On the other, lower public debt and a lower tax burden is observed in
rural as opposed to urban municipalities. Finally, given their significance in numerous areas,
accessibility to digital services is analysed in greater detail in a box at the end of the paper.
In light of the above-mentioned descriptive evidence, the paper offers some public
policy-related considerations that illustrate the possible constraints on local authorities to
improve services accessibility for their citizens. In particular, the evidence available suggests
that the uncertainty associated with high dependence on transfers from other tiers of
government in respect of the revenues of small municipalities, as is the case with those in
rural areas, may play a key role in rural citizens’ access to local services. Compounding this
are other factors, including the higher fixed cost per inhabitant that the provision of these
services in smaller and, especially, geographically remote municipalities usually entails, and
various regulatory aspects that the delegation of the provision of certain services to local
governments involves. Overall, these factors might explain part of the differences in the
access to local services of rural municipalities compared with their urban counterparts in
Spain. However, there are other factors, such as the economic situation or population age
structure, to which these differences might also be attributed (see Fassman et al. (2014)).
The rest of the paper is organised as follows. Following this introduction, the second
section analyses services accessibility at the European level, with the aim of identifying differences
in access by an average EU citizen to the same services on the basis of country of residence
and bearing in mind how rural the region which the citizen inhabits is. The third section examines
the differences in access to local services in Spain’s rural and urban municipalities, along with
other potential idiosyncrasies in terms of geography and fiscal matters. The fourth section uses
a regression analysis to assess the role that geography and fiscal arrangements may play in
explaining the difference in local services accessibility between both types of municipalities in
Spain. The fifth section offers some considerations on which local fiscal aspects might be most
significant in the provision of services. The final section draws the main conclusions.
3 ote that this difference of 20 km is calculated comparing distances from the average rural municipality with the average
N
urban municipality, while the average distance of 12.4 km to the closest service in Spanish rural provinces mentioned in
the previous paragraph refers to the average distance from all rural province municipalities. This latter figure, therefore,
masks much of the heterogeneity at the municipal level within each province once it has been classified as rural or
urban according to Eurostat. Unfortunately, we only have the services accessibility indicators at the municipal level for
Spain, while for the other countries we have solely the aggregate information at the NUTS3 regional level, equivalent
to the Spanish provinces.
BANCO DE ESPAÑA 9 DOCUMENTO OCASIONAL N.º 21222 Accessibility to services in the European Union regions
Services play an important role in a territory’s economic and social development. In this
connection, 33% of the EU budget goes to economic, social and territorial cohesion policies,
with the aim of catalysing the convergence of the most disadvantaged – typically rural – regions.
It is therefore essential to accurately diagnose the differences in accessibility to services
between the various European and Spanish rural and urban areas.
Despite its unquestionable interest, the absence of comprehensive and comparable
information about services accessibility indicators for a broad set of countries explains the lack
of studies researching into whether there are differences in the provision of services within the
EU.4 Against this backdrop, Kompil et.al. (2019) construct a harmonised services accessibility
indicator for each municipality in the various EU countries to assess whether there is inequality
in European citizens’ access to services. Specifically, Kompil et al. (2019) define accessibility as
the distance in kilometres that an average citizen resident in a municipality (region or country)
has to travel – by road – to access the nearest service.5 In the case of local services, the
indicator refers to primary or basic services, such as primary healthcare or a supermarket,
which are used daily or regularly by citizens and are usually provided in the locality where they
reside. Although access to local services is the main focus of interest in this study, Kompil et
al. (2019) also construct an indicator of accessibility to what are known as “regional services”,
such as those offered by specialised healthcare centres, which are required occasionally and
are located in large cities. Annex 1 describes in detail the methodology applied by Kompil et al.
(2019) to construct the services accessibility indicators we have used in this study.
Accessibility to local services is more uniform among EU citizens than accessibility
to regional services (see Chart 1). This result is in line with what might be expected, since the
provision of regional services, which is costlier than that of local services, requires a greater
critical mass of population. In the case of local services, the difference between the indicator’s
lowest and highest values (Malta and Finland, respectively) is 7.6 km, compared with 103.3 km
in the case of the regional services accessibility indicator. The Benelux countries, Malta, the
United Kingdom and Spain generally present more favourable indicators of access to regional
services, while citizens in the Nordic and Baltic countries have to cover greater distances to
access such services. At aggregate level, there is greater accessibility in Spain than in the EU
countries on average to both local services (3.5 km in Spain versus 4 km in the EU) and regional
services (27.2 km versus 30 km).
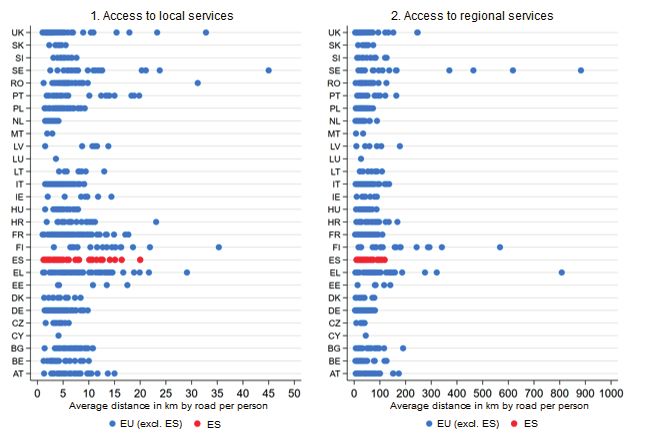
This heterogeneity in services accessibility between countries is also seen between
the different EU regions. Chart 2 depicts the indicators of accessibility to local and regional
4 he various projects developed by the EU include the PROCECY project, which aims to identify those territories at provincial
T
level (NUTS 3) where it is more complicated, in terms of the travel time required, to access basic services. Information on
some of the indicators constructed within the framework of this project are available in the EPSON database (https://
database.espon.eu/).
5 ee Páez et al. (2012) and Gutiérrez and García-Palomares (2020) for a discussion about the measurement of
S
accessibility, and Goerlich et al. (2021) for an alternative service access indicator in the Spanish case.
BANCO DE ESPAÑA 10 DOCUMENTO OCASIONAL N.º 2122Chart 1
ACCESSIBILITY TO LOCAL AND REGIONAL SERVICES
AVERAGE DISTANCE PER PERSON TO THE CLOSEST SERVICE
km
120
100
80
60
40
20
0
MT NL UK BE IT DE ES LU CZ UE CY SK HU PL DK FR AT PT SI RO BG EL HR LT SE IE LV EE FI
REGIONAL SERVICES LOCAL SERVICES
SOURCES: Kompil et al. (2019) and own data.
services for EU regions at NUTS 3 level, which are equivalent to Spanish provinces. The
indicator measures the average distance by road that a citizen in a given region must travel
to access the nearest service.6
In line with that observed at country level, local services accessibility is distributed
more uniformly than regional services accessibility, both between the different EU countries’
regions and between regions within each country. In the case of local services, the average
distance ranges from a minimum of 1 km in Paris to 45 km in the Jämtlands län Swedish
region. The Spanish province with the best accessibility – excluding Ceuta and Melilla – is
Madrid, with an average distance of 1.5 km, followed by Barcelona (1.6 km). At the tail of
the distribution are the Teruel, Zamora and Cuenca provinces (20 km, 16.4 km and 15 km,
respectively), all of which are predominantly rural. Their inhabitants must travel much longer
distances than the EU average (4 km) to access a local service.
Cross-regional heterogeneity in the EU is considerably higher in the case of regional
services accessibility. Three German regions and Paris rank first in terms of ease of access
of their residents to regional services (around 3.5 km). In contrast, residents in certain
regions in Finland and Sweden have to travel a distance nearly 200 times greater to access
such services. In Spain, once again, the residents of predominantly rural provinces – such
as Teruel, Cuenca, Cáceres, Soria and Lugo – have greater difficulty in accessing regional
services (between 89.6 km and 118.4 km).
Previous evidence suggests that the degree of urbanisation affects individuals’
accessibility to the provision of services. Indeed, Chart 3 shows accessibility to local
6 he distance to the nearest service is calculated at the 1 km2 spatial grid level. Subsequent aggregations (at municipal,
T
regional or country level) are made starting from this minimum level of disaggregation. See Annex 1 for further details.
BANCO DE ESPAÑA 11 DOCUMENTO OCASIONAL N.º 2122Chart 2
ACCESSIBILITY TO LOCAL AND REGIONAL SERVICES, BY REGION
SOURCES: Kompil et al. (2019) and own data.
and regional services by the degree of urbanisation of regions (provinces in Spain) in EU
countries.7 On average, a person resident in a predominantly urban region would have a
local service within an area of 2.1 km (7.1 km in the case of predominantly rural regions). The
gap widens considerably in the case of access to regional services: 14.8 km in urban regions
and 57.4 km in rural ones.
The relative position of Spanish rural and urban provinces from a European
perspective is particularly interesting. Residents in Spanish urban provinces are about as far
from local services as residents in the other urban regions of the EU (2 km, compared with
2.1 km on average in the EU). However, this indicator worsens considerably in the case of
rural provinces (12.4 km, compared with 7.1 km in the EU). There are hardly any differences
in accessibility to regional services between Spain’s rural provinces and those of the rest of
the EU.
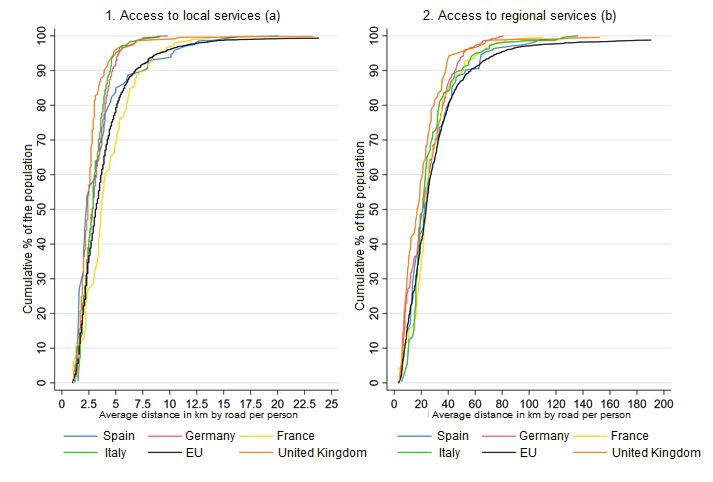
The percentage of inhabitants who have access to a service within a specific radius
of kilometres confirms that access to services in each country is uneven (see Chart 4). For
7 urostat classifies the EU NUTS level 3 regions (Spanish provinces) into predominantly urban (where at least 80% of the
E
population lives in urban clusters), intermediate urbanisation (where more than 50% but less than 80% of the population
lives in urban clusters) and predominantly rural (where at least 50% of the population lives in rural or low-density areas).
Certain adjustments are applied to this classification. For instance, if a region is initially classified as predominantly rural
(intermediate) but has a city with more than 200,000 (500,000) inhabitants where at least 25% of the region’s total
population lives, it will be reclassified as intermediate urbanisation (predominantly urban). Chart 3 only considers urban
and rural regions, excluding intermediate ones. For a more detailed description of this taxonomy, see https://ec.europa.
eu/eurostat/web/rural-development/methodology.
BANCO DE ESPAÑA 12 DOCUMENTO OCASIONAL N.º 2122Chart 3
ACCESSIBILITY TO LOCAL AND REGIONAL SERVICES, BY DEGREE OF URBANISATION
1 ACCESS TO LOCAL SERVICES 2 ACCESS TO REGIONAL SERVICES
km km
20 250
200
15
150
10
100
5 50
0
0
SI LT EE LV SE FI CZ SK BE FR IT UK DE NL AT IE ES PT EL PL HR DK HU RO BG SI LT SE AT FI LV CZ ES IT SK NL UK FR EE DE PT PL BE IE EL HR HU RO DK BG
URBAN REGIONS RURAL REGIONS
SOURCES: Kompil et al. (2019) and own data.
Chart 4
CUMULATIVE DISTRIBUTION OF ACCESSIBILITY TO LOCAL AND REGIONAL SERVICES, BY PERCENTAGE OF POPULATION
SOURCES: Kompil et al. (2019) and own data.
a In the United Kingdom (EU), 100% of the population is not reached until a distance of 33 km (45 km) has been covered.
b In the United Kingdom (EU), 100% of the population is not reached until a distance of 247 km (nearly 900 km) is covered.
example, 50% of the Spanish population is less than 2.2 km away from a local service
(3.2 km in the case of the EU as a whole) and less than 22.2 km from regional services
(23.6 km in the EU). This 50% of the population lives in approximately 10% of the total 8,116
BANCO DE ESPAÑA 13 DOCUMENTO OCASIONAL N.º 2122Spanish municipalities, according to the 2011 Census.8 The distance to a local and regional
service rises to 4 km and 36 km, respectively, for 75% of the population (4.7 km and 36 km,
in each case, in the EU) and to 7 km and 53 km, respectively (6.9 km and 56.8 km in the EU),
for 90%.
In summary, analysis of the Kompil et al. (2019) indicators evidences that
heterogeneity across countries and regions in the EU is high in accessibility to services.
Specifically, it is more difficult for rural regions to access the provision of both local and
regional services than it is for predominantly urban regions. As regards Spain’s relative
position from a European perspective, although Spain compares favourably with other
European countries on average, Spanish rural provinces generally have significantly worse
access to local services than other European countries’ rural regions (a deficit not observed
in Spanish urban areas). Thus, the rural-urban difference in local services accessibility in
Spain is more pronounced than in the other European countries.
8 he number of municipalities in Spain in 2011, the reference year for calculating the services accessibility indicators
T
compiled by Kompil et al. (2019).
BANCO DE ESPAÑA 14 DOCUMENTO OCASIONAL N.º 21223 The rural-urban divide at the municipal level in Spain
This section provides a more granular analysis at the municipal level of the differences in
access to services in rural and urban areas in Spain. It also conducts an initial analysis
of the characteristics that could explain these disparities. Specifically, the differences
between rural and urban municipalities are explored in two important respects: geographical
aspects, and fiscal and budgetary organisation. The former play a relevant role in the cost of
providing the service and the latter in financing it. The definition of rurality that was used in
the previous section, i.e. the official Eurostat definition, which defines a rural municipality as
any municipality with a population of less than 5,000 and/or a population density below 300
inhabitants per square kilometre, is also used here.9
3.1 Differences in access to services
The differences in access to local and regional services between urban and rural regions
across EU countries have been pointed out in the previous section. Here we will analyse
the differences in access to local services across Spanish municipalities. We are focusing
on local services because it was there that a significant difference between Spain and the
EU was identified in terms of the accessibility gap between rural and urban areas. The
municipal analysis is conducted only for Spain,10 as no information is available with this
degree of disaggregation for the other European countries.
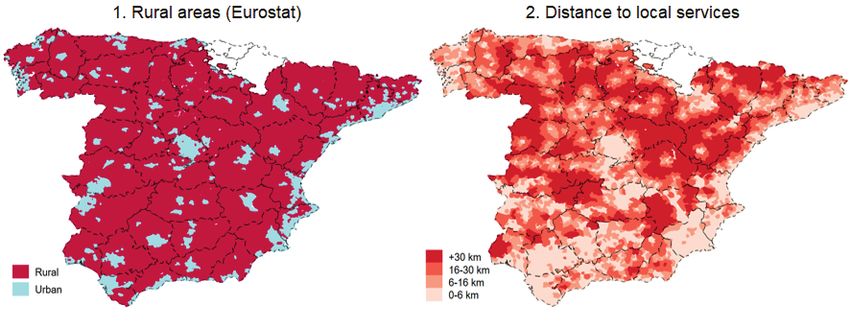
Chart 5.1 shows a map with all rural municipalities in red and all urban
municipalities in blue.11 Chart 5.2 shows the distance that the average citizen in each
municipality has to travel to access the nearest local service. As can be seen, there is a
certain overlap between the rural areas in the left-hand map and the areas characterised
by a greater distance to services in the right-hand map.
Table 1 shows the differences in access to local services according to the degree
of urbanisation of municipalities. In the average rural municipality, inhabitants have to
travel almost 23 km to access local services such as a library, a nursery school or a
supermarket.12 In the case of urban municipalities, this distance decreases to 2 km,
meaning that the difference in accessibility between rural and urban municipalities is just
over 20 km.
9 urostat classifies territorial units at the LAU2 level (i.e. municipalities) into three groups according to their degree of
E
urbanisation (DEGURBA): cities (densely populated urban areas); towns and suburbs (intermediate density areas); and
rural areas (thinly populated areas). In this paper, municipalities falling into the third category (thinly populated areas)
are considered rural and those included in the first two categories are considered urban. See https://ec.europa.eu/
eurostat/web/products-manuals-and-guidelines/-/KS-GQ-18-008.
10 t the domestic level, Goerlich et al. (2021) provide an alternative indicator for accessibility to services, such as primary
A
healthcare centres or non-university educational establishments, based on travel times to the nearest facility.
11 ur analysis excludes the regions of Navarre and the Basque Country to enable comparison between regions with
O
the same tax regime.
12 he increase in the average distance when the calculation is made using municipal-level data compared with that
T
obtained using regional-level data illustrates the high degree of heterogeneity within each region.
BANCO DE ESPAÑA 15 DOCUMENTO OCASIONAL N.º 2122Chart 5
DISTRIBUTION OF RURAL MUNICIPALITIES AND DISTANCE TO LOCAL SERVICES
SOURCES: Gutiérrez et al. (2020b) and own data.
It should also be noted that this difference is considerably heterogeneous at the
regional level. Thus, in regions such as the Balearic Islands or Murcia the difference between
urban and rural municipalities is smaller (around 3 km). However, it is approximately ten
times greater in the case of regions such as Castile-La Mancha or Aragon.
3.2 Differences in geographical factors
Access to local services may be influenced by geographical characteristics, such as a
difficult-to-access location, the distance to other larger municipalities or proximity to the
coast. Thus, the provision of certain local services may be costlier in municipalities located,
for instance, in mountainous and inaccessible areas which are far from urban centres.
To measure these geographical factors, we use the altitude of each municipality
(measured in metres above sea level), the distance to the provincial capital and the distance
to the coast (both measured in kilometres) (see Gutiérrez et al. (2020b) for further details on
the construction of these indicators at the municipal level). Table 2 presents the differences
in the average values of these variables for rural and urban municipalities.
First, rural municipalities are located, on average, at an altitude more than 400 m
higher than urban municipalities. Second, urban municipalities tend to be almost 20 km
closer to the provincial capital than rural municipalities. Furthermore, there is a significant
difference in the location of both types of municipalities: the average rural municipality is 140
km from the coast, almost 60 km further than the average urban municipality.
In addition, these differences in average terms can also be extended to rural and
urban municipalities as a whole. Chart 6 shows that rural municipalities are predominantly
located at higher altitudes and significantly further from the provincial capital and the coast.
BANCO DE ESPAÑA 16 DOCUMENTO OCASIONAL N.º 2122Table 1
DIFFERENCES IN THE DISTANCE TO LOCAL SERVICES (2011)
(1) (2) (3)
Rural Urban Difference
National total 22.69 2.16 -20.53***
Andalusia 12.71 1.96 -10.75***
Aragon 29.94 1.64 -28.30***
Asturias 17.09 2.16 -14.93***
Balearic Islands 5.78 2.41 -3.37**
Canary Islands 16.64 2.37 -14.27***
Cantabria 19.5 2.91 -16.60***
Catalonia 12.85 2.12 -10.73***
Castile-La Mancha 34.33 1.69 -32.64***
Castile-Leon 26.57 1.98 -24.59***
Extremadura 21.51 1.56 -19.95***
Galicia 14.68 2.42 -12.27***
Madrid 11.41 2.02 -9.38***
Murcia 4.81 1.97 -2.84**
Rioja 16.57 1.53 -15.05***
Valencia 14.91 2.09 -12.82***
Total number of observations 6,743 767
SOURCES: Gutiérrez et al. (2020b) and own data.
NOTE: Columns (1) and (2) refer to the average values of the distance to local services for all the municipalities classified as rural or urban,
respectively. Column (3) is the difference between columns (2) and (1). *, ** and *** denote significance at the 10%, 5% and 1% levels, respectively.
Table 2
DIFFERENCES IN GEOGRAPHICAL ASPECTS
(1) (2) (3)
Rural Urban Difference
Altitude (m) 733.63 310.19 -423.43***
Distance to capital (km) 47.08 29.65 -17.43***
Distance to the coast (km) 140.47 57.93 -82.54***
Total number of observations 6,743 767
SOURCES: Gutiérrez et al. (2020b) and own data.
NOTE: Columns (1) and (2) refer to the average values of the variables for all the municipalities classified as rural or urban, respectively. Column (3) is
the difference between columns (2) and (1). *, ** and *** denote significance at the 10%, 5% and 1% levels, respectively.
3.3 Differences in taxation and the budgets of rural and urban municipalities
This section highlights the differences in taxation and budgetary performance between
rural and urban municipalities in Spain.13 In particular, we analysed each municipality’s tax
13 he local government sector encompasses over 8,000 municipalities and 52 provincial governments, together with
T
any public units controlled by them. Owing to differences in their remit, we have excluded from this analysis provincial
governments (including ordinary-regime provincial governments, the specific status provincial governments of Álava,
Gipuzkoa, Bizcaya and Navarre and island authorities) and municipalities in the Basque Country and Navarre.
BANCO DE ESPAÑA 17 DOCUMENTO OCASIONAL N.º 2122Chart 6
DISTRIBUTION OF ALTITUDE AND DISTANCE TO CAPITAL, BY TYPE OF MUNICIPALITY
1 ALTITUDE (m) 2 DISTANCE TO CAPITAL (km)
Density Density
0.14
0.14
0.12
0.12
0.10
0.10
0.08
0.08
0.06 0.06
0.04 0.04
0.02 0.02
0.00 0.00
0 500 1000 1500 2000 2500 0 50 100 150 200 250
RURAL URBAN
SOURCES: Gutiérrez et al. (2020b) and own data.
burden, as measured by the use of locally-legislated taxes, bearing in mind their propensity
to indebtedness and the level of compliance with budget rules at the municipal level.14 These
municipal differences in fiscal matters, in addition to the geographical factors discussed
above, could also be affecting the existing gap in accessibility to local services between rural
and urban municipalities. Specifically, as explained in Section 5, municipalities with greater
revenue-raising capacity could have more leeway to provide certain local services.
First, we analysed the possible differences in the use of locally-regulated taxes.
These include property tax, tax on business activity, road tax, tax on constructions,
installations and works, and tax on increase in urban land value. Table 3 shows the average
values of these taxes in the period 2003-2018 for all rural and urban municipalities. Column
(3) shows the differences between the two types of municipalities. Thus, for instance, the
property tax tax rate for urban properties is almost 0.1 pp higher, on average, in urban
municipalities than in rural ones (although this gap has narrowed in recent years).
This is also evidenced in Chart 7.1, which shows the distribution of the average
property tax rates over the period 2003-2018 for rural and urban municipalities. Although tax
rates are highly heterogeneous across both groups, there is a higher concentration of urban
municipalities in the higher levels of this tax. These differences can also be extrapolated
to other taxes. Thus, road tax on a car with between 12 and 16 fiscal horsepower is, on
average, €30 higher in an urban municipality than in a rural municipality. This difference is
especially visible in Chart 7.2, which shows that road tax amounts are concentrated at the
14 ee Alloza and Burriel (2019) for an analysis of recent local government budget dynamics and a detailed description
S
of the data used in this section.
BANCO DE ESPAÑA 18 DOCUMENTO OCASIONAL N.º 2122Chart 7
TAX RATE DISTRIBUTION FOR URBAN PROPERTY TAX AND ROAD TAX (a)
1 URBAN PROPERTY TAX (tax rate %) 2 ROAD TAX (€) (b)
Density Density
0.10 0.45
0.40
0.08 0.35
0.30
0.06
0.25
0.20
0.04
0.15
0.02 0.10
0.05
0.00 0.00
0.3 0.5 0.7 0.9 1.1 60 75 90 105 120 135 150
RURAL URBAN
SOURCES: Ministerio de Hacienda and own data.
a Average for the period 2003-2018.
b The right-hand panel shows the total road tax in euro for a vehicle of between 12 and 15.99 fiscal horsepower.
lower end of the distribution (at around €80) for rural municipalities, as opposed to urban
municipalities, for which road tax is more concentrated at amounts above €100.15
Second, we analysed the performance of municipalities in terms of financial liability
accumulation, budget balances and compliance with the expenditure rule.16 Table 4 shows
the results of this analysis. Notably, rural municipalities present a lower level of debt. This is
true both when it is analysed in per capita terms and as a share of its current revenue. Both
variables show that the level of indebtedness of urban municipalities is more than twice that
of rural municipalities. Thus, for instance, the average debt stock of urban municipalities
between 2008 and 2018 amounted to almost half of current revenue, whereas for rural
municipalities, this figure stood at 21%.17 Chart 8 depicts the distribution of this debt/current
revenue ratio for the two types of municipalities. As can be seen, the values of this ratio for
rural municipalities tend to be concentrated at around 0, in contrast to urban municipalities.
Moreover, rural municipalities are also more prone than urban municipalities to having a non-
15 hese differences are also observed when possible tax base reductions and tax relief on the total amount of the taxes
T
considered are taken into account.
16 he current budget rule framework, implemented by Organic Law 2/2012 of Budgetary Stability and Financial
T
Sustainability of 27 April 2012 (LOEPSF by its Spanish abbreviation) sets restrictions on the conduct of general
government, overall and by subsector, in three areas: deficit, expenditure and debt. As regards local governments, the
deficit rule requires them to maintain a balanced budget, the expenditure rule establishes that the change in eligible
expenditure cannot exceed the medium-term Spanish benchmark GDP growth rate and the debt rule limits total local
government indebtedness to a maximum of 3% of national GDP (or, individually, to 110% of their current revenue).
In the case of the expenditure rule, eligible expenditure is defined as the non-financial expenditure, excluding interest
expenses, the non-discretional part of unemployment benefits, funds for specific purposes from the EU or other tiers
of general government and transfers to the regional and local governments linked to the Spanish financing system.
17 o analyse debt and expenditure compliance, shorter periods are used (2008-2018 and 2016-2017, respectively)
T
owing to these data being available.
BANCO DE ESPAÑA 19 DOCUMENTO OCASIONAL N.º 2122Table 3
DIFFERENCES IN LOCAL TAXES (2003-2018 AVERAGE)
(1) (2) (3)
Rural Urban Difference
Urban property tax (tax rate) 0.58 0.67 0.09***
Rural property tax (tax rate) 0.6 0.65 0.05***
Tax on business activity (max. situation coefficient) 1.15 1.97 0.82***
Tax on business activity (min. situation coefficient) 1.04 1.43 0.39***
Road tax on cars (8 fiscal horsepower) (€) 14.6 19.8 5.16***
Road tax on cars (8-11.99 fiscal horsepower) (€) 39.4 53.6 14.2***
Road tax on cars (12-15.99 fiscal horsepower) (€) 82.9 113 30.4***
Road tax on cars (16-19.99 fiscal horsepower) (€) 104 143 39.4***
Road tax on cars (>20 fiscal horsepower) (€) 129 179 50.2***
Road tax on tractors (25 fiscal horsepower) (€) 94.3 130 35.8***
Tax on increase in urban land value (rate up to 5 years) 8.7 25.4 16.7***
Tax on increase in urban land value (rate up to 10 years) 8.59 25.2 16.6***
Tax on increase in urban land value (rate up to 15 years) 8.48 25 16.5***
Tax on increase in urban land value (rate up to 20 years) 8.4 24.8 16.4***
Tax on constructions, installations and works (tax rate) 2.08 3.24 1.17***
Total number of observations 6,800 805
SOURCES: Ministerio de Hacienda and own data.
NOTE: Columns (1) and (2) refer to the average values for the period 2003-2018 for all the municipalities classified as rural or urban, respectively.
Column (3) is the difference between columns (2) and (1). *, ** and *** denote significance at the 10%, 5% and 1% levels, respectively.
financial balance that is in equilibrium or positive and to complying to a greater extent with
the expenditure rule (which limits changes in local governments’ non-financial expenditure).
This evidence suggests that rural municipalities, on average, tend to post lower budget
and financial imbalances. It should be highlighted that, overall, the budget rule framework
applicable to local governments has influenced their financial performance, contributing to
the sector’s budget surplus from 2012 onwards and to their financial deleveraging process.18
Lastly, Annex 2 analyses the differences in the budget structure of urban and rural
municipalities. The evidence shows that rural municipalities have a different budget structure
than urban municipalities: the former have higher revenues and non-financial expenditure per
person, while urban municipalities allocate a higher share of their budget to the provision of
public services (for example, educational, health, cultural and sports facilities and services).
In short, the analysis included in this section highlights the differences in financial
and budgetary performance between rural and urban municipalities. On average, the former
18 mong other legal restrictions, Article 32 of the LOEPSF (along with the sixth provision) determines how the surplus
A
can be used. In particular, the LOEPSF stipulates that the surplus is to be used for reducing net debt (provided that
the municipality has a positive cash surplus for general and administrative expenses). For further details, see Alloza
and Burriel (2019).
BANCO DE ESPAÑA 20 DOCUMENTO OCASIONAL N.º 2122Table 4
DIFFERENCES IN FINANCIAL AND BUDGETARY PERFORMANCE
(1) (2) (3)
Rural Urban Difference
Public debt (€ per person) 199 431 232***
Public debt/current receipts 0.21 0.48 0.27***
Change in debt 2008-2018 (%) 15.9 45.7 29.8
% of municipalities not complying with
the expenditure rule 18.4 21.9 0.04***
% of muncipalities with non-financial balance4 The deficit in services accessibility in Spain’s rural municipalities
and the role of the geographical and fiscal situation
As set out in the second section, the average distance to local services in Spain is in line with
that observed in other European countries for the case of urban areas. However, this distance
is significantly greater in Spain than in our EU peers for rural areas. Specifically, the distance
separating average inhabitants of Spanish rural areas from local services is similar to those
in countries such as Finland, Sweden and Greece, where geo-climatic conditions might
account for the difficulty of providing services in certain rural areas (e.g. the Greek islands or
the Scandinavian taiga). In the third section we have further noted that rural municipalities in
Spain show significant differences from urban municipalities, not only in terms of geography,
but also fiscal arrangements, both of which factors may be considered fundamental in the
provision of local services. In this respect, Chart 9 shows the simple correlations between
the local services accessibility indicator and certain geographical (altitude and distance from
the capital) and fiscal (tax burden and debt) variables at the municipal level. As can be seen,
there is a strong association between these variables: remote municipalities, with a lower
tax burden and less debt, are further away from local services. In this section we explore
whether this apparent relationship holds in a more systematic econometric analysis, in which
other possible conditioning factors are taken into account.
As Chart 5 suggested, Table 5 shows that the average distance from local
services is significantly greater in rural than in urban municipalities. Specifically, we
consider a regression of the distance from local services in each municipality based on a
dummy variable that takes the value 1 if the municipality is rural and 0 if it is urban. The
coefficient associated with this dummy thus reflects the difference in the distance from
local services between urban and rural municipalities. Column (1) of Table 5 indicates that
rural municipalities are, on average, around 20.5 km further away from local services than
urban municipalities (a gap that matches the difference in averages in Table 1). Yet as
Section 3.1 has shown, rural municipalities are generally characterised by their location
in more remote areas of the territory, with worse accessibility. This would, at least partly,
justify the greater difficulty of providing services in these areas. Accordingly, orographic
indicators are included in the original regression of column (1) to take into account how
the differences in the geographical location of municipalities can be associated with
disparities in the provision of services. Indeed, column (2) of Table 5 shows that greater
altitude and a greater distance from the provincial capital are associated with less
accessibility to local services. Hence, once these geographical differences are controlled
for, the rural status of a municipality, per se, would only involve a distance of 8.5 km
more (than in urban municipalities) to access the local services, instead of the 20.5 km
identified in column (1).19 That is to say, the fact that rural municipalities are located in
more remote areas of Spanish territory would account for part of their worse access to
19 he inclusion of geographical controls means that the rurality coefficient estimated in column (2) captures the rural-
T
urban difference in distance from services for rural and urban municipalities with the same orographic characteristics.
For example, by including altitude above sea level as a control variable, the estimated coefficient for the rurality dummy
is based on comparing rural and urban municipalities with the same altitude above sea level.
BANCO DE ESPAÑA 22 DOCUMENTO OCASIONAL N.º 2122Chart 9
CORRELATIONS BETWEEN SERVICES ACCESS AND GEOGRAPHICAL AND FISCAL VARIABLES (a)
SOURCE: Own data.
a The chart shows the correlation at municipal level between distance to local services and possible explanatory factors. To make viewing easier, each
point represents a data grouping. The red lines depict an estimation of the linear relationship between the two variables shown in the axes.
services. However, there would still be a significant difference of 8.5 km that cannot be
attributed to these orographic factors.20
Differences in municipal fiscal arrangements might also account for some of the rural-
urban gap in access to services. In this respect, Section 3.2 shows that rural municipalities
in Spain have a lower tax burden in terms of different taxes (inter alia, road tax, property tax,
tax on business activity and tax on constructions, installations and works) and a lower level
of debt per euro of current revenue. Thus, we include in the regression analysis in Table 5
both a tax burden indicator21 and a measure of municipal debt. Column (3) shows the results
20 These results are in line with those found by Goerlich et al. (2021). According to their work, small municipalities,
normally in poorly connected mountain areas characterised by an older population, are those that evidence worse
accessibility to basic healthcare, education and financial services.
21 his tax burden indicator is obtained through a principal components analysis in which the first principal component
T
(factor) explains the change in the selective municipal tax rates explored in Section 3.2. In particular, this factor
explains approximately 50% of this change.
BANCO DE ESPAÑA 23 DOCUMENTO OCASIONAL N.º 2122Table 5
DETERMINANTS OF ACCESS TO LOCAL SERVICES
Variables (1) (2) (3) (4)
Rurality dummy 20.53*** 8.53*** 2.34 1.48
(2.74) (2.2) (1.84) (1.36)
Altitude 0.021*** 0.01*** 0.02***
(0.00) (0.00) (0.00)
Distance from capital 0.14*** 0.14*** 0.13***
(0.04) (0.04) (0.03)
Distance from the coast 0.01 0 -0.04**
(0.01) (0.01) (0.01)
Tax burden -0.98*** -0.84***
(0.2) (0.22)
(log) Debt/CR -1.09*** -0.91***
(0.23) (0.23)
Observations 7,490 7,486 6,260 6,260
R2 0.12 0.37 0.41 0.77
Region fixed effects No No No Yes
Controls No Yes Yes Yes
SOURCE: Own data.
NOTE: *, ** and *** denote significance at the 10%, 5% and 1% levels, respectively. Standard errors in brackets clustered at regional level. The
Debt/CR variable refers to each municipality's stock of debt/current revenue ratio.
of this exercise, which suggest that those municipalities with a lower tax burden and a lower
level of debt per euro of revenue are characterised by a greater average distance from the
closest local service. Therefore, once we control for these fiscal aspects, the rural-urban
difference in average distance from local services falls markedly to 2.3 km, and it is no longer
statistically significant.22
In any event, the explanatory power (measured by R2) of the econometric model set
out in column (3), which includes geographical and fiscal factors, stands at around 41%.
This suggests that there is still a high percentage of variability between municipalities in
access to local services which neither rurality nor the geographical/fiscal factors envisaged
can explain. In this respect, column (4) adds region fixed effects to the foregoing model.
These enable cross-regional systematic differences in the provision of services – which
might derive from the regions’ heterogeneity in the exercise of their competencies in
healthcare and education, for instance23 – to be taken into account. By including these
fixed effects, the model’s R2 increases to almost 80%, suggesting that these systematic
22 ote that this reduction in the rural-urban difference is likewise observed if we restrict the sample of column (2) and
N
make it the same as column (3), given that some observations in column (3) are lost owing to the non-availability of
fiscal information for some municipalities.
23 he 1978 Spanish constitution set in place a decentralised State model that distributes the exercise of education and
T
healthcare competencies among all tiers of government. For example, in the case of education, central government
is entrusted with the broad regulation of the education system, while regional government responsibilities cover the
executive-administrative competencies for managing the education system in their own territory.
BANCO DE ESPAÑA 24 DOCUMENTO OCASIONAL N.º 2122Table 6
DETERMINANTS OF ACCESS TO SERVICES. ALTERNATIVE INDICATOR
Variables (1) (2) (3) (4)
Rurality dummy 11.35*** 5.22*** 1.33 1.22
(1.65) (1.2) (0.92) (0.74)
Altitude 0.01*** 0.01*** 0.01***
(0.00) (0.00) (0.00)
Distance from capital 0.07** 0.07** 0.07**
(0.03) (0.03) (0.02)
Distance from the coast 0.01 0.01 -0.02***
(0.01) (0.01) (0.01)
Tax burden -0.75*** -0.47***
(0.18) (0.11)
(log) Debt/CR -0.61*** -0.48***
(0.1) (0.11)
Observations 7,508 7,500 6,272 6,272
R2 0.16 0.43 0.51 0.87
Region fixed effects No No No Yes
Controls No Yes Yes Yes
SOURCE: Own data.
NOTE: *, ** and *** denote significance at the 10%, 5% and 1% levels, respectively. The dependent variable refers to an alternative services access
indicator to that considered in the rest of the paper. Specifically, this indicator has been constructed using precise data on the location in Spain of
hospitals, nurseries, automated teller machines and petrol stations. Standard errors in brackets clustered at regional level. The variable Debt/CR refers
to each municipality's stock of debt/current revenue ratio.
differences between regions account for much of the heterogeneity between municipalities
in services accessibility. Indeed, on comparing municipalities in a single region, the rural-
urban difference in accessibility to local services diminishes to 1.5 km, which is statistically
non-significant. The contributions to the R2 of each of the explanatory variables included in
column (4) indicate that it is the geographical characteristics of municipalities that explain a
greater proportion of the variability in services accessibility (42%), followed by region fixed
effects (25%), fiscal arrangements (24%) and rurality (9%).24
Finally, to corroborate the robustness of the foregoing results, an alternative
indicator of services accessibility has been used. This indicator has been constructed using
precise data on the location in Spain of hospitals, nurseries, automated teller machines
and petrol stations.25 In Table 6, the dependent variable proxies the minimum distance that
average citizens have to cover from their municipality of residence to gain access to the
four basic services mentioned. According to this indicator, average citizens from rural areas
would have to travel 11.3 km further than average citizens from urban areas to have access
24 Contributions calculated using the methodology of Huettner and Sunder (2012).
25 he annex describes in greater detail how this indicator has been constructed. The authors thank Kiko Llaneras for
T
sharing the data (see https://elpais.com/politica/2019/10/25/actualidad/1572027354_718725.html).
BANCO DE ESPAÑA 25 DOCUMENTO OCASIONAL N.º 2122to these services (column (1)). As in the case of the local services accessibility indicator used
in this paper, much of this difference is on account of orographic factors. In particular, when
these factors are controlled for in the regression, the rural-urban gap – as regards access
to the four services this alternative indicator includes – diminishes to 5.2 km (column (2)).
The inclusion of fiscal and fixed-effects variables at the regional level reduces this difference
even further, to scarcely 1.2 km, which is not statistically significant (column (4)).
The services accessibility indicators analysed in this section draw together, in
a single indicator, accessibility to a varied set of presence-based services. This study is
complemented by an itemised analysis of online services. Technological progress has
allowed some of the traditionally presence-based services to now be provided remotely
via internet. In this connection, a box is included that analyses access to online services in
Spain in detail, on the basis of the rural-urban typology of the municipality.
BANCO DE ESPAÑA 26 DOCUMENTO OCASIONAL N.º 21225 Some significant additional dimensions to the provision of services
in rural areas
The results of the previous section suggest that the heterogeneity of municipal public
finances might explain many of the differences observed in access to local services in rural
municipalities. This section sets out some useful theoretical arguments for interpreting these
results, and for illustrating other possible dimensions that affect how the different tiers of
government offer their services.
One possible aspect that would restrict the provision of local services in rural
municipalities is their lesser financial capacity. As Table 3 illustrates, rural municipalities
evidence a lower tax burden insofar as they set lower tax rates on those taxes over which
they have powers. This, along with a lower tax revenue base (owing to the lower value of
property and other taxable events in rural municipalities), diminishes the tax take in these
municipalities, resulting in less financial autonomy and, therefore, a greater dependence
on transfers from other levels of government. In this respect, numerous studies link lower
financial autonomy, understood as a high dependence on financing unrelated to all budgetary
policy decisions, to a lower amount of and lower quality in the provision of local public
services (see, for example, Oates (1972), Musgrave and Musgrave (1973), and Blöchliger
and King (2006)). It should further be noted that the system of transfers to local government
authorities, known as the “share in State revenue”, tends to induce some uncertainty and
volatility in the transfers received (Cordero-Ferrera et al. (2013)).26
Another constraint on the provision of services by small municipalities is the
presence of economies of scale in the provision of public services (Bel (2011)). Hence,
rural and low-population-density municipalities would face higher costs in providing
public services, compared with other municipalities (Solé-Ollé and Bosch (2005); Hortas-
Rico and Solé-Ollé (2010)). Compounding this difficulty is the high fixed cost in relative
terms that the functioning of local government for a small-sized municipality entails (see
Annex 2). In this connection, associations of municipalities can play a key role in alleviating
the difficulties rural municipalities face in the provision of services. The founding of
such associations formalises a legal association between several municipalities to offer
services and execute works jointly, promoting the harnessing of potential synergies and
economies of scale.
Finally, there are regulatory factors that might constrain the provision of certain
public services. Thus, although local government competencies are regulated by law 7/1985
of 2 April 1985, in practice there is a lack of clarity about the distribution of some of these
26 ransfers to municipalities with fewer than 75,000 inhabitants, that are not provincial or regional capitals, are
T
determined on the basis of the “variables model”, which will weight the size of the population, the tax burden and the
tax-raising capacity of each municipality. In the case of the calculation of the tax burden, for example, this variable is
determined on the basis of aspects that might be affected by changes in the tax rates that the municipality imposes,
thereby altering the transfer received. See Suárez Pandiello and Fernández Llera (2008).
BANCO DE ESPAÑA 27 DOCUMENTO OCASIONAL N.º 2122competencies across the tiers of government involved.27 The fact that local government is
advantageously positioned to provide local services has led some municipalities to assume
competencies initially envisaged for other government levels, incurring so-called “replacement
spending attributable to competencies not their own” (derived from the provision of services
assumed by local governments that the regulations attribute to other levels of government).
This might be a significant factor for small-size – such as rural – municipalities, given that
their lesser financial autonomy and higher costs in providing services hamper taking on
expenses that are not their own and the provision of local services that lie outside their
remit. Compounding these factors would be greater difficulty in access to external financing
compared with larger municipalities, which will give rise to less incurrence of debt and a
greater containment of expenditure (in line with the results in Table 4).
In short, the evidence available suggests that the limited leeway for the financial
autonomy of smaller-sized municipalities, such as rural ones, the higher fixed costs they
have to bear in the provision of such services and regulatory constraints might account for
some of the difficulties rural municipalities face in offering specific local services.
27 ee Muñoz-Merino and Suárez Pandiello (2018). The lack of definition characterising competencies (e.g. in the case
S
of spending on culture, sports and festivities) led to the approval of Law 27/2013 of 27 December 2013 on Local
Government rationalisation and sustainability, aimed at avoid overlapping between different levels of government.
However, its effective application has been restricted by the approval of differing regional regulations and the filing of
appeals claiming the legislation is unconstitutional.
BANCO DE ESPAÑA 28 DOCUMENTO OCASIONAL N.º 2122You can also read