Biennial Report on Substance Abuse Services Per Code of Virginia 37.2-310
←
→
Page content transcription
If your browser does not render page correctly, please read the page content below
Biennial Report on Substance Abuse Services
       Per Code of Virginia § 37.2-310

            to the Governor and
   Members of the Virginia General Assembly

                          January 10, 2014

         1220 Bank Street • P.O. Box 1797 • Richmond, Virginia 23218-1797
    Phone: (804) 786-3921 • Fax: (804) 371-6638 • Web site: www.dbhds.virginia.gov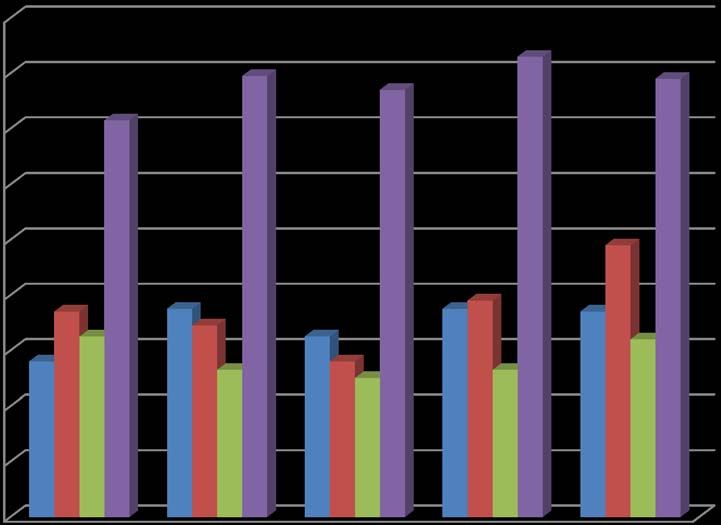
This page intentionally left blank.
COMMONWEALTH of VIRGINIA
                                             DEPARTMENT OF
JAMES W. STEWART, III         BEHAVIORAL HEALTH AND DEVELOPMENTAL SERVICES                        Telephone (804) 786-3921
   COMMISSIONER                                                                                      Fax (804) 371-6638
                                                  Post Office Box 1797
                                                                                                   www.dbhds.virginia.gov
                                             Richmond, Virginia 23218-1797

                                                January 10, 2014

        To:       The Honorable Robert F. McDonnell

                  and

                  Members, Virginia General Assembly

        I am pleased to present to you the Biennial Report on Substance Abuse Services, required by
        the Code of Virginia § 37.2-310 Subsection 4.

        This report provides information on the public funds allocated to the department for the
        treatment and prevention of substance abuse and epidemiological information about the
        incidence and prevalence of substance use disorders in the Commonwealth, the resources
        available to address these needs, and highlights of the activities undertaken by this department
        in the past two years to provide services for prevention and treatment.

        Substance use disorders, a group of disabling illnesses characterized by continued use of
        alcohol, drugs, and other substances in the face of known harm, affect all residents of Virginia,
        even those who do not imbibe or use any drugs, with widespread consequences for public
        health, safety, and economic loss. However, with appropriate help and support, recovery is
        possible. Persons in recovery can lead full lives as contributing tax-paying citizens who are
        fully engaged in the communities in which they live.

        This report describes the major initiatives of this department in the last two years. I hope you
        will find it useful.

                                              Sincerely,

                                              James W. Stewart, III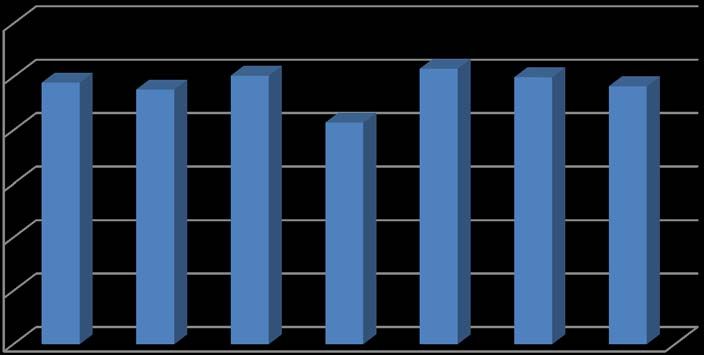
Biennial Report on Substance Abuse Services
                                         Per Code of Virginia § 37.2-310
                                                 to the Governor
                                  and Members of the Virginia General Assembly

                                               Table of Contents
Executive Summary ........................................................................................................................ i

Overview ........................................................................................................................................ 1

Nature, Scope and Degree of Substance Use Disorders in Virginia .............................................. 2

Major Substance Abuse Activities at the Department of Behavioral Health
    and Developmental Services ................................................................................................ 25

Appendices
      A. Code of Virginia ........................................................................................................ 37
      B. Virginia Localities Sorted by National Survey of Drug Use and Health (NSDUH)
         Region ........................................................................................................................ 38
      C. Diagnostic Criteria for Substance Use Disorders ...................................................... 39
      D. List of Cities and Counties Sorted by Regions used by the Virginia Department of
         Health – Office of the Chief Medical Examiner ........................................................ 40
      E. Services Definitions ................................................................................................... 41

List of Figures
    Figure 1: Map of Virginia Displaying Five NSDUH Regions ............................................... 2
    Figure 2: Binge Alcohol Use in Past Month – Percent of Population Age 12+ ..................... 4
    Figure 3: Binge Alcohol Use in Past Month – Population Age 12+........................................ 4
    Figure 4: Binge Alcohol Use in Past Month – Percent by Age Groups .................................. 5
    Figure 5: Alcohol Dependence or Abuse in Past Year - Percent of Population Age 12+ ....... 6
    Figure 6: Alcohol Dependence or Abuse in Past Year - Population Age 12+......................... 6
    Figure 7: Alcohol Dependence or Abuse in Past Year– Percent by Age Groups .................... 7
    Figure 8: Needing But Not Receiving Treatment for Alcohol Use in Past Year
                                          -Percent of Population Age 12+ ................................. 8
    Figure 9: Needing But Not Receiving Treatment for Alcohol Use in Past Year
                                          -Population Age 12+ .................................................. 8
    Figure 10: Needing But Not Receiving Treatment for Alcohol Use in Past Year
                                          Percent by Age Groups............................................... 9
    Figure 11: Illicit Drug Use in Past Month - Percent of Population Age 12+ ....................... 10
    Figure 12: Illicit Drug Use in Past Month -Population Age 12+ ........................................... 10
    Figure 13: Illicit Drug Use in Past Month - Percent by Age Group ...................................... 11
    Figure 14: Marijuana Use in Past Year- Percent of Population Age 12+ .............................. 12
    Figure 15: Marijuana Use in Past Year - Population Age 12+ .............................................. 12
    Figure 16: Marijuana Use in Past Year - Percent by Age Group........................................... 12
                                                                                             Continued …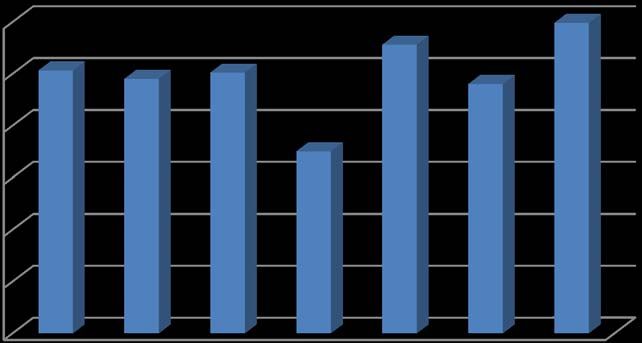
Figure 17: Nonmedical use of Pain Relievers in Past Year
                                     – Percent of Population Age 12+ ............................. 12
Figure 18: Nonmedical use of Pain Relievers in Past Year
                                     - Population Age 12+ ............................................... 13
Figure 19: Nonmedical use of Pain Relievers in Past Year
                                     - Percent by Age Group ............................................ 14
Figure 20: Needing But Not Receiving Treatment for Illicit Drug Use in Past Year
       – Percent of Population Age 12+ ............................................................................... 15
Figure 21: Needing But Not Receiving Treatment for Illicit Drug Use in Past Year
                                     - Population Age 12+ ............................................... 16
Figure 22: Needing But Not Receiving Treatment for Illicit Drug Use in Past Year
                                     - Percent of Population by Age Group ..................... 17
Figure 23: Drug Deaths by OCME Region 2006-11 ............................................................. 18
Figure 24: FMHO Deaths by District, 2006-11 ..................................................................... 19
Figure 25: Individuals Receiving CSB Substance Abuse Services SFY 2012 by Gender .... 21
Figure 26: Individuals Receiving CSB Substance Abuse Services SFY 2012
                                     by Age Group ........................................................... 21
Figure 27: Individuals Receiving CSB Substance Abuse Services, SFY 2012
                                     by Race .................................................................... 22
Figure 28: Individuals Receiving CSB Substance Abuse Services, SFY 2012
                                     by Referral Source .................................................... 23
Figure 29: Individuals Receiving CSB Substance Abuse Services SFY 2012
                                     by Primary Drug of Abuse ....................................... 24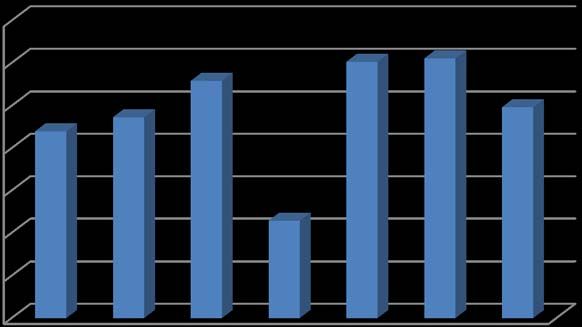
Biennial Report on Substance Abuse Services
                              Per Code of Virginia § 37.2-310
                                      to the Governor
                       and Members of the Virginia General Assembly

                                     EXECUTIVE SUMMARY

Overview
Title 37.2 of the Code of Virginia establishes the Virginia Department Behavioral Health and
Developmental Services (DBHDS) as the state authority for alcoholism and drug abuse
services. DBHDS works to ensure efficient, accountable and effective services available for
citizens with substance use disorders. The department is responsible for the administration,
planning and regulation of services for substance use disorders in the Commonwealth.

This biennial report is submitted in accordance with § 37.2-310 Subsection 4 which requires
DBHDS:

       4. To report biennially to the General Assembly on the comprehensive interagency state
       plan for substance abuse services and the Department's activities in administering,
       planning, and regulating substance abuse services and specifically on the extent to
       which the Department's duties as specified in this title have been performed.

This report provides epidemiological information about the extent to which substance use
disorders affect the residents of the commonwealth, information about services provided and the
individuals who received these services, and reports on major activities of the department on
their behalf.

Nature, Scope and Degree of Substance Abuse in Virginia
Epidemiological information about the numbers of residents using, abusing and dependent on
alcohol and other drugs in Virginia is derived from the National Survey on Drug Use and Health
(NSDUH), conducted annually under the auspices of the federal Substance Abuse and Mental
Health Services Administration (SAMHSA). NSDUH data, collected from individuals age 12
and older, can be analyzed regionally and by age groups. Another source of information is the
Office of the Chief Medical Examiner at the Virginia Department of Health (OCME) which
reports drug-caused deaths on an annual basis.

Over half (54.6%) of Virginians drink alcohol, and nearly half of these (23.21% of all
Virginians) engaged in binge drinking (drinking five or more drinks in one occasion) in the
month prior to the survey. This increases to 44.56% for those 18-25. Nearly seven percent
(6.92%) of Virginians meet the criteria for abuse or dependence on alcohol (see Appendix C for
definitions), and this rises to 16.27% for those 18-25. The proportion needing but not receiving
treatment for alcohol use is 6.42% for the general population, rising to 15.32% in the 18-25 age
group.

Illicit drugs include legal drugs that are used illicitly as well as drugs that are illegal. While
fewer than eight percent (7.98%) of Virginians age 12 and older used illegal drugs in the month

                                                 i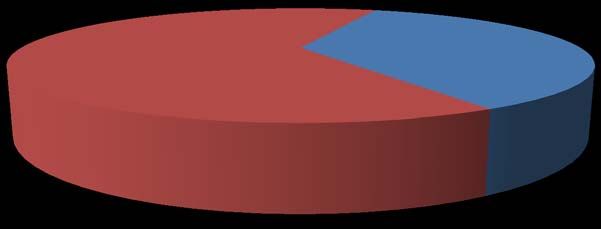
prior to the survey, that figure rises to 9.45 % for those 12-17 and 21.02% for those 18-25. In
the past year, 9.98% Virginians used marijuana but, following the same pattern, 12.88% of
those between 12-17 and 28.92% of those 18-25 used this drug. The rate of nonmedical use of
pain relievers in the past year is 4.6% for the Commonwealth, higher than the national rate of
4.57%. Age data indicate that this is a significant problem among youth in Virginia, with 5.95%
of those 12-17 and 11.39% of those 18-25 reporting nonmedical use of pain relievers in the past
year. The proportion of Virginians needing but not receiving treatment for illegal drug use is
slightly less (2.18%) than the national rate of 2.40%, but the rate among those 12-17 is 4.25%,
climbing to 6.74% for young adults ages 18-25.
(http://www.samhsa.gov/data/NSDUH/2k11State/NSDUHsae2011/NSDUHsaeStateTabs2011.htm#Tab104)

The Office of the Chief Medical Examiner’s 2011 Annual Report indicated 818 people died due
to drug/poison caused deaths, an increase of 18.2% since 2010. Prescription drugs accounted for
61.74% of these deaths while 17.48% were caused by illegal (street) drugs. Per capita rates of
drug caused deaths were higher (9.6 per 100,000) than motor vehicle crashes (9.4 per 100,000)
in the Commonwealth in 2011. One-third of all drug-caused deaths in the Commonwealth
happened in the western part of the state, but the prevalence of prescription drug deaths has
risen dramatically in other regions of the state as well, specifically in the northern and central
regions. (http://www.vdh.state.va.us/medExam/documents/2013/pdf/Annual%20Report%202011.pdf)

Characteristics of the Public Service System
Public community-based substance abuse services are provided through the 40 community
services boards (CSBs) established in Title 37.2 of the Code of Virginia. CSBs provide services
either directly or through contracts with other services providers. In State Fiscal Year 2012 (the
most recent data available), the CSB system provided clinical substance abuse services to
36,743 individuals at a total cost of $106,561,525. Sources of funding include federal grants
($43,956,776), state general funds ($46,629,700), local government ($38,889,682) and fees and
third party payors ($2,875,071). Two-thirds of those served are male and over one-third (38.1%)
are between the ages of 26-40. Sixty percent are White, nearly one-third (28.89%) are Black,
slightly more than six percent represent other groups, and two percent identified themselves as
multi-racial. Over one-third (36.69%) are referred by the criminal justice system. Alcohol is the
primary drug for which most individuals are seeking treatment (40.42%), followed by marijuana
(22.87%), closely followed by opiates (21.85%).

Major Activities

Treatment

Creating Opportunities for People in Need of Substance Abuse Services: An Interagency
Approach to Strategic Resource Development. DBHDS prepared a strategic plan for substance
abuse services and presented it in October 2011. This plan was the result of a two-stage, two-
year process involving advocates and individuals receiving services, providers, and other key
state agencies. The resulting plan, Creating Opportunities for People in Need of Substance
Abuse Services: An Interagency Approach to Strategic Resource Development
(http://www.dbhds.virginia.gov/documents/omh-sa-InteragencySAReport.pdf ), indicates that
nearly $54 million is needed to improve access to services, address gaps in the array of services
and provide adequate support services to those in need of substance abuse treatment.

                                                ii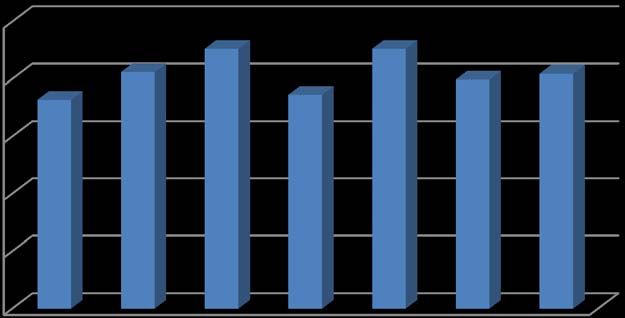
Bringing Recovery Supports to Scale Technical Assistance Center Strategy (BRSS-TACS). In
2012, DBHDS received competitive grant funding from the federal Substance Abuse and
Mental Health Services Administration (SAMHSA) to participate in a federally-sponsored
policy initiative focused on implementing recovery-oriented systems of care (ROSC) for people
with both mental illness and substance use disorders. DBHDS used part of the $50,000 award to
sponsor a statewide Recovery Forum in Roanoke on June 9-11, 2013. Approximately 110
persons representing all seven regions of the state and CSBs, state facilities, DBHDS staff, and
the substance abuse and mental health peer and advocacy services communities participated. A
steering committee has been organized to continue work on these goals and to plan a second
Recovery Forum.

National Governors Association Prescription Drug Prevention Project. As abuse of
prescription drugs continues to be a problem for the nation and in Virginia, the Commonwealth
was competitively selected, along with six other states, to participate in the initial policy
conference focusing on this topic sponsored by the National Governors’ Association (NGA).
The Department of Health Professions (DHP) was the lead agency for the Virginia team, joined
by the Secretary of Public Safety, Secretary of Health and Human Resources, the
Superintendent of State Police and the Commissioner of DBHDS. The team attended two
national meetings to receive technical assistance and participate in discussions led by experts to
assist the team in developing a strategy for Virginia. The team developed four subgroups to
focus on enforcement, disposal, monitoring, and training and education. The training and
education subgroup was chaired by the DBHDS Director of the Office of Substance Abuse
Services (OSAS). Each subgroup included a variety of expertise related to the subject matter.
The team hosted a statewide meeting in March 2013 that was attended by over 100 participants
and facilitated by staff from the NGA. Each subgroup presented its draft plan at the meeting and
received comment. The team has since finalized its plan, which has been accepted by the
Governor and forwarded to the NGA.

Juvenile Justice Behavioral Health Diversion Pilot. In the fall of 2012, Virginia was
competitively selected to participate in a national policy academy co-sponsored by SAMHSA
and the MacArthur Foundation to develop strategies for diverting youth with behavioral health
issues from the juvenile justice system. DBHDS collaborated with the Department of Juvenile
Justice (DJJ), the Office of Comprehensive Services (CSA), the 24th District Court Service Unit
and Horizon Behavioral Health Services to develop a strategy to screen youth for behavioral
health concerns whose parents were requesting petitions for Children in Need of Services or
domestic violence issues. The team used the $25,000 award to implement the project. Those
youth who qualified were referred to Horizon Behavioral Health Services for assessment and
services. The result was a significant decrease in the number of petitions filed and
accompanying increase in the numbers of children receiving appropriate behavioral health
services.

Synar: Tobacco Law Compliance. As a condition for receiving the federal Substance Abuse
Prevention and Treatment Block Grant (SAPT BG) states must (1) statutorily prohibit and
enforce the sale of tobacco products to minors; (2) conduct random, unannounced inspections of
tobacco retailers to ensure that they are complying with the law; and (3) annually report

                                                iii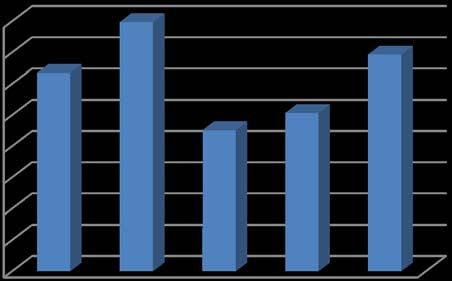
findings to the U.S. Department of Health and Human Services. Federal law requires a
noncompliance rate of no more than 20%. Failure to comply with any part of the law can result
in a loss of up to 40% of the total award, which would be a loss of $16 million for Virginia.
DBHDS contracts with the Department of Alcoholic Beverage Control (ABC) to conduct these
inspections using trained youth under the supervision of an ABC agent. Virginia achieved a
compliance rate of 13.0% in 2011 and 13.5% in 2012. DBHDS also works closely with CSBs to
develop and provide effective tobacco use prevention programming focused on youth.

Screening Women for Substance Use and Mental Health Disorders. DBHDS website includes
information, including specific screening tools appropriate for different populations, to help
professionals identify people who may need substance abuse services. These include tools for
women, adolescents and other adults.

Medication Assisted Treatment. DBHDS is responsible for providing regulatory oversight and
technical assistance to programs that utilize methadone in the treatment of opioid addiction. The
number of these programs is growing significantly throughout the state.

Professional Development. To improve the quality of services offered in the community,
DBHDS offered a variety of knowledge and skill building workshops on a regional level. These
include training in providing services to adolescents, substance abuse screening for women
seeking prenatal care, development of peer and recovery services, clinical supervision, training
health care providers and other providers of addiction services. These events were funded by the
federal Substance Abuse Prevention and Treatment Block Grant (SAPT BG). The largest of
these events include:

       Services to Adolescents Who Have Experienced Trauma. DBHDS sponsored two events
       to train counselors to provide treatment services to adolescents who have experienced
       trauma, such as witnessing or being the victim of a violent crime. Research indicates that
       a significant proportion of individuals with behavioral health problems have experienced
       serious traumatic events that have not been addressed. The longer these events remain
       unaddressed, the more emotional damage occurs, often leading to substance abuse, as
       well as depression, poor emotional control, and other serious behavioral issues. The
       training provided an opportunity to increase knowledge and skills in assessment and
       treatment practices designed to help adolescents who have experienced trauma. The 105
       participants attending a two-day event learned about providing trauma-informed services
       for adolescents with co-occurring substance abuse and mental health problems.

       Informing Parents and Caregivers about Adolescent Substance Abuse. DBHDS
       sponsored training to help parents and caregivers understand adolescent development,
       identify when an adolescent may be using drugs or alcohol, and learn how to get help.
       This three hour session provided information about the signs and symptoms of substance
       use, the treatment process, and strategies that family members can employ to take care
       of themselves during adolescent using episodes.

       Virginia Summer Institute for Addiction Studies (VSIAS). Held in Williamsburg,
       VSIAS provides an opportunity for Virginia substance abuse professionals to learn from

                                               iv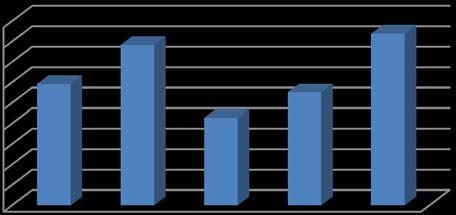
national experts through lectures and participatory workshops in an intensive learning
environment. VSIAS is a collaborative effort of the Virginia Association of Drug and
Alcohol Programs, the Virginia Association of Drug and Alcohol Counselors, and the
Substance Abuse Certification Alliance of Virginia. DBHDS provided staff and
financial resources for the institute. In 2011, 189 persons participated, and 366 persons
participated in 2012.

Virginia Association of Medication Assisted Recovery Programs (VAMARP). This
annual training event provides current information to professionals working with opiate-
dependent individuals. DBHDS provided staff support and funding. In 2011, 225
persons participated, and 240 persons participated in 2012.

Prenatal Care Providers. In conjunction with the University of Virginia (UVA), the
Department of Medical Assistance Services (DMAS), the Department of Health (VDH)
and DBHDS received a grant from the U.S. Department of Health and Human Services
to provide training in screening pregnant women for substance abuse, mental illness and
domestic violence.

Clinical Supervision. DBHDS provided skill and knowledge training in clinical
supervision to assure best practices and fidelity to treatment models. Approximately 91
new and experienced clinical supervisors from 21 community services boards, five state
facilities, and several opiate treatment programs attended a five-day training and skill
development program, “Clinical Supervision Workshop and Clinic,” in 2011. This
training met the requirements of the Virginia Department of Health Professions (DHP)
Board of Counseling and Board of Social Work for supervisors of candidates for either
the professional counselor license (LPC) or clinical social worker license (LCSW).

Psychiatrists and Other Medical Staff. In collaboration with the University of Virginia
(UVA) and the Virginia Association of Community Services Boards (VACSB), DBHDS
provided training for psychiatrists and other health care providers who work with
community services boards or state mental health facilities to improve their knowledge
about treating people with addictions or co-occurring mental health disorders. DBHDS
also collaborated with the Virginia Health Practitioners Monitoring Program (within the
Department of Health Professions) to provide training about pain management for
people who are recovering from addiction.

Creating Opportunities Goal to Further Develop Recovery and Peer Services. In
collaboration with the Substance Abuse and Addiction Recovery Alliance of Virginia
(SAARA), DBHDS provided funding from the federal Substance Abuse Prevention and
Treatment (SAPT) and Community Mental Health Services (CMHS) block grants to
present the third annual conference focused on peer and recovery support services for
persons with substance use disorders and/or mental illness. Over 200 attendees,
including peer providers, supervisors and clinical staff from the community services
boards, and state agency staff, participated in the conference.

                                         v
Interagency Relationships. DBHDS is represented on a number of state-level committees to
ensure collaboration and improve access to services. These include:
Commission on the Virginia Alcohol Safety Action Program. Established as a legislative
agency, the commission establishes and implements policy regarding operating
standards and criteria for the 24 local agencies that provide services to individuals
charged with driving under the influence of alcohol or other drugs. By statute (§18.2-
271.2.A), DBHDS is represented on the commission.
Drug Treatment Court Statewide Advisory Committee. Established by the Supreme
Court of Virginia, the committee focuses on evaluation of applications to establish local
drug treatment courts. By statute (§18.2-254.1.F), DBHDS is represented on the
committee.
Home Visiting Consortium and the Maternal, Infant and Early Childhood Home Visiting
Grant. This collaboration of early childhood home visiting programs that serve families
who are pregnant or who have children up to five years of age also serves as the
advisory committee for a federal grant managed by the Virginia Department of Health
(Maternal, Infant and Early Childhood Home Visiting grant). DBHDS provides access
to technical assistance concerning behavioral health, including providing training.
Substance Abuse Services Council. Established by statute (§ 2.2-2696), this council,
staffed by DBHDS/OSAS, consists of 29 members including two senators and four
delegates, as well as representatives from provider and advocacy organizations, and state
agencies. The purpose of the council is to advise the Governor and the General
Assembly on policies concerning substance abuse. The council meets four times per
year.
Prevention
Strengthening Families Prevention Grants. DBHDS used funds from the federal Substance
Abuse Prevention and Treatment Block Grant (SAPT BG) to support Strengthening Families in
16 communities. The program provides a weekly family meal as an opportunity for at-risk
families to meet with a facilitator and improve communication and other skills necessary to
parent in a healthy family. These programs are used to help families increase cohesion, a
research-based strategy that helps protect children from substance abuse and other problems.
Interagency Relationships
Strategic Prevention Framework State Infrastructure Grant. As a member of the
Governor’s Office for Substance Abuse Prevention (GOSAP) Collaborative [currently
the Virginia Office for Substance Abuse Prevention (VOSAP) Collaborative], DBHDS
was a partner with 12 other state agencies in the Commonwealth’s application to the
federal Substance Abuse and Mental Health Services Administration for funding to
identify, study and implement a major prevention initiative for the state. SAMHSA
awarded grant funds in the amount of $2,135,724 annually through 2015. These funds
viare being used to develop a statewide systematic approach to the prevention of underage
alcohol use. This is the first time that these efforts have been based on epidemiologic
data.
Prevention and Promotion Advisory Council (PPAC). This interagency council consists
of 12 members and advises the State Board of DBHDS on matters related to prevention
and promotions. Members are appointed by the board to receive and review information
on prevention efforts. The council developed a white paper on how changes in federal
government prevention policy will broaden programs and services to encompass all of
behavioral health as opposed to the previous singular focus on substance abuse.
Professional Development
Suicide Prevention. DBHDS staff provided a training of trainers focusing on suicide
prevention skills to 24 trainers, using the Applied Suicide Intervention Skills Training
(ASIST) curriculum. Those trainers then trained 796 individuals. An additional 97
individuals also participated in an ASIST training. DBHDS staff chaired a workgroup
that drafted a statewide suicide prevention strategic plan, currently in review.
Substance Abuse Prevention Specialist Training. DBHDS provided a five-day training
to 14 CSB prevention staff to improve their knowledge and skill in developing and
providing community-based prevention programs and services that are based on
scientific research. A total of 53 individuals participated in the training during the
biennium. This curriculum has recently been selected by SAMHSA for distribution to
other states.
Prevention Supervisor Mentorship Program. DBHDS sponsored five experienced CSB
supervisors to function as mentors to newly hired CSB prevention supervisors. These
mentors have provided over 200 hours of consultation since July 2012.
Off-site Prevention Supervision Program. This program provides the necessary
supervision to become designated as an Internationally Certified Prevention Specialist to
individuals who do not have local access to the appropriately credentialed professional
who can provide this type of assistance. To date, this program has been piloted with one
site.
Other Prevention Training. DBHDS provided 360 scholarships for CSB prevention staff
and community coalition members to attend training provided by the Virginia
Foundation for Healthy Youth to improve knowledge and skill in general prevention
knowledge and coalition building.
viiBiennial Report on Substance Abuse Services
Per Code of Virginia § 37.2-310
to the Governor
and Members of the Virginia General Assembly
OVERVIEW
Purpose
This biennial report provides information about the extent to which Virginians are affected by
substance use disorders and the activities supported by the Department of Behavioral Health and
Developmental Services (DBHDS) to address these needs during the biennium (2010-2012).
National statistical information analyzed at the state level and available state data were used to
identify state, regional and age-related issues.
The Department of Behavioral Health and Developmental Services
Title 37.2 of the Code of Virginia establishes the Virginia Department of Behavioral Health and
Developmental Services (DBHDS) as the state authority for alcoholism and drug abuse services.
DBHDS works to make efficient, accountable and effective services available for citizens with
substance use disorders. The department is responsible for the administration, planning and
regulation of services for substance use disorders in the commonwealth.
This biennial report is submitted in accordance with § 37.2-310 Subsection 4 which requires
DBHDS:
4. To report biennially to the General Assembly on the comprehensive interagency state
plan for substance abuse services and the Department's activities in administering,
planning, and regulating substance abuse services and specifically on the extent to which
the Department's duties as specified in this title have been performed.
This report provides epidemiological information about the extent to which substance use
disorders affect the residents of the commonwealth, information about services provided and the
individuals who received these services, and reports on major activities of the Department on
their behalf.
DBHDS supports substance use disorder prevention and treatment services provided in local
communities through the allocation of State General Funds (GF) and federal Substance Abuse
Prevention and Treatment Block Grant (SAPT BG) funds to 40 community services boards and
behavioral health authorities (collectively referenced as CSBs). These organizations are entities
of local government. The department’s relationship with all CSBs is based on the community
services performance contract. DBHDS funds, monitors, licenses, and regulates the CSBs which
function as:
• The single point of entry into the publicly-funded substance abuse services system;
• Providers of treatment and prevention services, directly and through contracts with
other providers;
• Advocates for individuals receiving services and individuals in need of services; and
1• Advisors to the local governments.
Substance Related Disorders
Substance use disorders involve the dependence on or abuse of alcohol and other drugs, which
include the non-medical use of prescription drugs, as defined using the American Psychiatric
Association’s criteria in the Diagnostic and Statistical Manual of Mental Disorders, 4th Edition-
Revised (DSM-IV-R). There are two distinct levels of substance use disorders: substance
dependence (addiction) and substance abuse. Dependence reflects a more severe substance
problem than abuse. The National Survey of Drug Use and Health (NSDUH, 20101), conducted
by the federal government, indicates that 9.63% of Virginians, or approximately 620,000
individuals, meet criteria for dependence on or abuse of illicit drugs or alcohol in the past year.
NATURE, SCOPE AND DEGREE OF SUBSTANCE ABUSE IN VIRGINIA
Sources of Information
Information about the types and extent of substance abuse in the commonwealth comes from
several resources. A major source of epidemiological information (the measure of the occurrence
of the disorder) is the National Survey on Drug Use and Health (NSDUH) conducted by the
federal Substance Abuse and Mental Health Services Administration (SAMHSA). Another
important source of information is provided by the Office of the Chief Medical Examiner
(OCME) at the Virginia Department of Health (VDH) concerning causes of death related to
substance abuse.
National Household Survey of Drug Use and Health
This survey is conducted annually by interviewing enough individuals age twelve and older in
the population to allow statistically valid generalizations to be made. In Virginia, a valid sample
of individuals representing each of five regions of the state is interviewed, which is helpful in
tracking regional trends to assist in planning and allocating resources. A list of Virginia cities
and counties grouped by these five regions is included as Appendix B.
Figure 1: Map of Virginia Displaying Five NSDUH Regions
2In addition, valid samples are collected by age groups so that developmental trends can be
identified. To strengthen the power of the data analysis of these smaller groups, SAMHSA
combines two or three years of data for analysis when it issues its official reports. The NSDUH
data that is reported in this document provides regional analysis of data collected in 2008, 2009,
and 2010. The age-group data was collected in 2010 and 2011. The population figures are for
Virginia in 2010, based on the U. S. Census. These differences in reporting years may cause data
reported in this document to conflict with other numbers published by DBHDS in different
publications as well as within this publication itself, but are necessary to provide the most current
and detailed regional and age-related data.
NSDUH collects data on the same issues each year. The charts below depict the responses to
selected questions in three ways. The first chart shows the proportion of the population impacted
by nation, state and region. The second chart shows the actual population impacted displayed by
state region. The regions are not equal in population size, and in some instances a larger number
of individuals may be affected by an issue even when the proportion of the population affected is
smaller. The third chart displays the responses by percent of population divided by age groups of
12-17, 18-25, and 26 and older. Analysis by age is important, as substance use disorders can
have long-term effects if not addressed.
Alcohol is both the most used and abused drug in the nation. NSDUH data indicate that,
nationally, 51.8% of the population older than twelve years used alcohol in the month prior to the
survey. In Virginia, the rate of alcohol use, 54.6%, is slightly higher.
Binge Drinking - About half of those who use alcohol engaged in binge drinking (five or more
drinks on one occasion) in the month prior to the survey. The national rate for binge drinking is
22.86%, and the rate in Virginia is slightly higher (23.21%), with the highest rate in Region 4
(25.10%) and the lowest rate in Region 2 (21.28%). The chart below displays the percent of the
population that engaged in binge drinking.
3Figure 2
Binge Alcohol Use in Past Month
Percent of Population age 12+
26.00%
25.00%
24.00%
Percent of
Population 23.00%
Age 12+
22.00%
21.00%
20.00%
19.00%
The chart below displays estimates of the actual numbers of people who engaged in binge drin
king by region. Although the proportion of binge drinkers in Region 4 is the highest, the actual
numbers of people who engaged in binge drinking was the highest in Region 2, followed by
Region 5.
Figure 3
Binge Alcohol Use in Past Month -
Population Age 12+
500,000
400,000
Population 300,000
Age 12+
200,000
100,000
0
Region 1 Region 2 Region 3 Region 4 Region 5
National Virginia Region 1 Region 2 Region 3 Region 4 Region 5
Percent of Population 23.39% 23.72% 24.57% 21.28% 25.02% 25.10% 23.96%
Population Figure 73,424,494 1,941,689 373,279 494,952 277,543 348,654 441,434
4Figure 4
Binge Alcohol Use in Past Month -
Percent by Age Groups
50.00%
Percent of 40.00%
Population in
30.00%
Age Group
20.00%
10.00%
0.00%
12-17 18-25 26+
12+ 12-17 18-25 26+
Percent of Population 23.21% 7.67% 44.56% 21.36%
Population Figure 1,899,941 48,715 412,531 1,151,244
The chart above displays a significant trend among Virginia youth. Although possession of
alcohol is illegal for those under 21, more than eight percent of Virginia’s youth engaged in
binge drinking the month prior to the survey, and nearly 45% of those between 18 and 25 drank
to this excess. For those who are 26 and older, more than one in five engaged in binge drinking
in the month prior to the survey.
Alcohol Dependence or Abuse - In the context of the NSDUH survey, the terms “dependence”
and “abuse” have specific clinical meanings. The Diagnostic and Statistical Manual, the standard
reference of the American Psychiatric Association used to diagnose psychiatric disorders, sets
forth distinct criteria for dependence and for abuse (see Appendix C). The chart below indicates
that nationally, 7.27% of Americans met criteria for one of these disorders, while a higher
proportion of Virginians (8.23%) met criteria for either abuse of or dependence on alcohol.
Regions 1 and 3 had the greatest proportion while Region 2 had the lowest. In raw numbers,
however, Region 2 had the greatest number of people who met one of these clinical criteria,
while Region 5 had the second most.
5Figure 5
Alcohol Dependence or Abuse in Past Year
Percent of Population Age 12+
10.00%
Percent of 8.00%
Population
Age 12+ 6.00%
4.00%
2.00%
0.00%
National Virginia Region 1 Region 2 Region 3 Region 4 Region 5
Figure 6
Alcohol Dependence or Abuse in Past Year
Population Age 12+
180,000
160,000
Population 140,000
Age 12+ 120,000
100,000
80,000
60,000
40,000
20,000
0
Region 1 Region 2 Region 3 Region 4 Region 5
National Virginia Region 1 Region 2 Region 3 Region 4 Region 5
Percent of Population 7.27% 8.23% 9.04% 7.45% 9.04% 7.97% 8.17%
Population Figure 22,821,551 673,697 137,340 173,280 100,279 110,708 150,522
6Figure 7
Alcohol Dependence or Abuse in Past Year
Percent of Population in Age Group
20.00%
Percent of 15.00%
Population in
Age Group
10.00%
5.00%
0.00%
12-17 18-25 26+
12+ 12-17 18-25 26+
Percent of Population 6.92% 4.24% 16.27% 5.61%
Population Figure 566,462 26,930 150,626 302,363
The chart above provides a picture of the degree of the problem of alcohol dependence among
youth in Virginia. Nearly five percent of children ages 12-17 suffer from alcohol dependence or
abuse, and that number is higher (more than 16%) for young adults ages 18-25. All told, more
than one in five Virginians ages 12-25 suffer from alcohol dependence.
Needing but not receiving treatment for alcohol use - The next three charts illustrate the extent to
which individuals in Virginia need but do not receive treatment for alcohol dependence. The
regions with the greatest proportions of individuals needing but not receiving treatment are
Regions 1 and 3, but the regions with greatest overall numbers of those individuals are Regions 2
and 5.
7Figure 8
Needing But Not Receiving Treatment for Alcohol
Use in Past Year - Population Age 12+
10.00%
Percent of
Population
Age 12+ 5.00%
0.00%
Figure 9
Needing But Not Receiving Treatment for Alcohol
Use in Past Year - Population Age 12+
160,000
140,000
120,000
Population
100,000
Age 12+
80,000
60,000
40,000
20,000
0
Region 1 Region 2 Region 3 Region 4 Region 5
National Virginia Region 1 Region 2 Region 3 Region 4 Region 5
Percent of Population 6.88% 7.54% 8.35% 6.85% 8.13% 7.29% 7.52%
Population Figure 21,597,286 617,215 126,857 159,324 90,185 101,263 138,547
8As illustrated earlier, adolescents and young adults in Virginia exhibit higher rates of alcohol
dependence than in the general population. Those same age groups also have higher rates of
needing but not receiving treatment, as the chart below indicates.
Figure 10
Needing But Not Receiving Treatment for
Alcohol Use in Past Year -
Percentage by Age Group
16.00%
Percent of
Population in 12.00%
Age Group
8.00%
4.00%
0.00%
12-17 18-25 26+
12+ 12-17 18-25 26+
Percent of Population 6.42% 4.15% 15.32% 5.14%
Population Figure 525,533 26,358 141,831 277,032
Illicit drugs include legal drugs that are used illicitly as well as drugs that are illegal. Illicit drug
use is on the rise in the United States. In 2010, an estimated 22.6 million (8.82%) Americans
aged 12 or older were current (in the last 30 days) illicit drug users. This is an upward trend,
from 8.0% in 2008 and 7.9% in 2004. Marijuana, psychotherapeutics, and cocaine lead the list of
the most abused illicit drugs. In Virginia, the incidence of illicit drug use is highest in Region 5
and lowest in Region 2. However, note that in actual numbers, Region 2 is among the highest
actual numbers of people using illegal drugs, with only Region 5 having more people using
illegal drugs. Region 3 has the fewest overall number of individuals identified as current illicit
drug users.
9Figure 11
Illicit Drug Use in Past Month
Percent of Population Age 12+
10.00%
Percent of
Population 5.00%
Age 12+
0.00%
Figure 12
Illicit Drug Use in Past Month
Population Age 12+
140,000
120,000
100,000
Population
80,000
Age 12+
60,000
40,000
20,000
0
Region 1 Region 2 Region 3 Region 4 Region 5
National Virginia Region 1 Region 2 Region 3 Region 4 Region 5
Percent of Population 8.82% 6.83% 7.26% 5.75% 7.19% 6.85% 7.48%
Population Figure 27,687,218 559,095 110,297 133,739 79,758 95,151 137,810
When viewed by age group, the incidence of current illicit drug use is significantly higher than
that of alcohol dependence in Virginia. Whereas around one-quarter of Virginians ages 12-25 are
currently abusing or dependent on alcohol, more than 30% use are illicit drugs, with the majority
of that higher incidence due to the 12-17 age group (5.02% for alcohol use, 9.45% for illicit drug
use).
10Figure 13
Illicit Drug Use in Past Month
Percent by Age Group
25.00%
Percent of
20.00%
Population
in Age
15.00%
Group
10.00%
5.00%
0.00%
12-17 18-25 26+
12+ 12-17 18-25 26+
Percent of Population 7.98% 9.45% 21.02% 5.53%
Population Figure 653,233 60,020 194,601 298,051
Marijuana use lags slightly behind national averages for proportions of the population, except for
Region 5. That region has the highest proportion of the population using at nearly the same
proportion as the nation. Region 4 has the second highest proportion of the population using.
Region 5 also has the highest number of actual persons using marijuana in the last year and
Region 2 ranks second in total number of users.
Figure 14
Marijuana Use in Past Year
Percent of Population Age 12+
15.00%
Percent of
Population 10.00%
Age 12+
5.00%
0.00%
11Figure 15
Marijuana Use in Past Year
Population Age 12+
225,000
200,000
175,000
Population 150,000
Age 12+ 125,000
100,000
75,000
50,000
25,000
0
Region 1 Region 2 Region 3 Region 4 Region 5
National Virginia Region 1 Region 2 Region 3 Region 4 Region 5
Percent of Population 11.47% 9.77% 9.73% 8.41% 9.63% 9.90% 11.36%
Population Figure 36,005,940 799,760 147,823 195,608 106,824 137,517 209,294
Nearly 13% of those between the ages of 12-17 and nearly 30% of those between the ages of 18-
25 currently use marijuana in Virginia, proportions higher than alcohol or illicit drugs as a
whole. These numbers dwarf the proportion of adults age 26 and older who currently use
marijuana, and provide a startling picture of the prevalence of marijuana use by Virginia’s
adolescents and young adults.
Figure 16
Marijuana Use in Past Year
Percent by Age Group
30.00%
Percent of 25.00%
Population in 20.00%
Age Group
15.00%
10.00%
5.00%
0.00%
12-17 18-25 26+
1212+ 12-17 18-25 26+
Percent of Population 9.98% 12.88% 28.92% 6.33%
Population Figure 816,950 81,806 267,738 341,169
Cocaine use is not tracked for this report due to the low level of use in Virginia (1.85%), which
is lower than the national average (1.80%).
Nonmedical use of pain relievers (commonly referred to as prescription drug abuse) continues to
be an area of primary concern for Virginia. In the past, the southwest region of the state had been
disproportionately affected by this phenomenon, as Region 3 had the highest proportion of
nonmedical use of pain relievers. However, the most recent data indicate that this problem is
now spreading throughout the commonwealth. While Region 3 still has the highest proportion of
individuals using pain relievers for nonmedical purposes, the proportions in Regions 1 and 4 are
nearly as high. A problem that was initially isolated to one part of the commonwealth is now
spreading statewide.
Region 2 has the highest overall number of individuals using pain relievers for nonmedical use.
The abuse of these drugs by young people presents a serious concern, as rates of abuse are nearly
twice as high for adolescents between the ages of 12-17 and nearly four times as high for young
adults between the ages of 18-25 than for adults ages 26 and older.
Figure 17
Nonmedical Use of Pain Relievers in Past Year
Percent of Population Age 12+
6.00%
5.00%
Percent of 4.00%
Population
Age 12+ 3.00%
2.00%
1.00%
0.00%
National Virginia Region 1 Region 2 Region 3 Region 4 Region 5
13Figure 18
Nonmedical Use of Pain Relievers in Past Year
Population Age 12+
100,000
80,000
Population 60,000
Age 12+
40,000
20,000
0
Region 1 Region 2 Region 3 Region 4 Region 5
National Virginia Region 1 Region 2 Region 3 Region 4 Region 5
Percent of Population 4.89% 4.76% 5.02% 4.14% 5.15% 4.99% 4.82%
Population Figure 15,350,397 389,648 76,266 96,292 57,128 69,314 88,803
Figure 19
Nonmedical Use of Pain Relievers in Past Year
Percent by Age Group
12.00%
10.00%
8.00%
Percent of
Population in 6.00%
Age Group
4.00%
2.00%
0.00%
12-17 18-25 26+
1412+ 12-17 18-25 26+
Percent of Population 4.60% 5.95% 11.39% 3.25%
Population Figure 376,550 37,791 105,447 175,166
Needing but not receiving treatment for illicit drug use – The percent of the population needing
but not receiving treatment is greater in Region 5 than in any other region, followed closely by
Regions 3 and 1. While the proportion is low in Region 2, it ranks second (behind Region 5) in
Virginia in the actual number of individuals needing but not receiving treatment for illicit drug
use.
Figure 20
Needing But Not Receiving Treatment for
Illicit Drug Use in Past year
Percent of Population Age 12+
3.00%
2.50%
Percent of
2.00%
Population
Age 12+
1.50%
1.00%
0.50%
0.00%
National Virginia Region 1 Region 2 Region 3 Region 4 Region 5
15Figure 21
Needing But Not Receiving Treatment for
Illicit Drug Use in Past Year
Population Age 12+
60,000
50,000
40,000
Population
Age 12+
30,000
20,000
10,000
0
Region 1 Region 2 Region 3 Region 4 Region 5
National Virginia Region 1 Region 2 Region 3 Region 4 Region 5
Percent of Population 2.53% 2.45% 2.51% 1.75% 2.78% 2.40% 2.99%
Population Figure 7,942,025 200,554 38,133 40,703 30,838 33,337 55,087
In spite of the high prevalence rates for illicit drug use for the 12-17 and 18-25 age groups in
Virginia, the percentages of individuals needing but not receiving treatment are low – 4.25% for
ages 12-17 and 6.74% for ages 18-25. However, in actual numbers, approximately 27,000 youth
between the ages of 12-17 who need treatment are not receiving it, while more than 62,000
young adults between the ages of 18-25 who need treatment are not receiving the help they need.
16Figure 22
Needing But Not Receiving Treatment for
Illicit Drug Use in Past Year -
Percent of Population in Age Group
8.00%
6.00%
Percent of
Population in
Age Group 4.00%
2.00%
0.00%
12-17 18-25 26+
12+ 12-17 18-25 26+
Percent of Population 2.18% 4.25% 6.74% 1.14%
Population Figure 178,452 26,993 62,398 61,443
Office of the Chief Medical Examiner
The Office of the Chief Medical Examiner (OCME) produces an annual report on causes of
death in the Commonwealth. The most recent report available, The Office of the Chief Medical
Examiner 2011 Annual Report, indicates that the number of drug-caused deaths since 2010 has
increased 18.2%. In 2011, 818 individuals died from this cause, with 61.74% of these deaths due
to narcotics. The statewide death rate from drug caused deaths in 2011 was 9.6 per 100,000,
higher than the rate of deaths by motor vehicle crashes in Virginia. Although this problem started
in the far southwestern region of the state due to abuse of prescription pain medication, it has
spread eastward as illustrated by the chart below. Appendix D displays a list of localities by
OCME region.
17Figure 23
Drug Deaths by OCME Region, 2006-11
300
250
200
Central
150 Northern
Tidewater
100 Western
50
0
2006 2007 2008 2009 2010 2011
2006 2007 2008 2009 2010 2011
Central 157 177 200 194 164 187
Northern 127 168 165 159 151 202
Tidewater 137 167 124 132 121 155
Western 248 205 246 228 256 274
Total 669 717 735 713 692 818
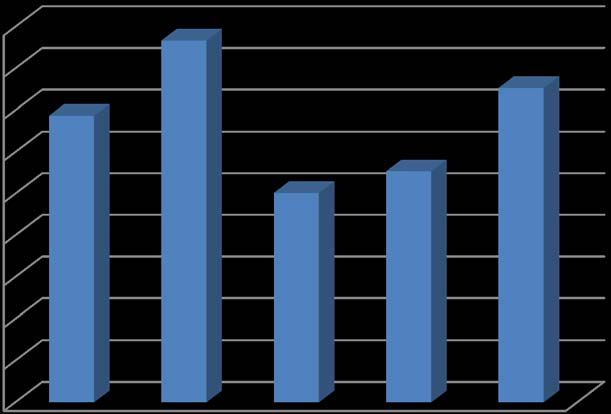
As described above, the abuse of prescription drugs continues to be an area of primary concern
in Virginia. In 2007, the OCME began tracking deaths specifically contributed to fentanyl,
hydrocodone, methadone, and oxycodone (FHMO). The trend in deaths related specifically to
these substances continues to increase, as illustrated by the charts below. Note that while the
issue persists in the Western district, usage has increased statewide.
18Figure 24
FHMO Deaths by District, 2006-11
180
160
140
120
Central
100
Northern
80 Tidewater
Western
60
40
20
0
2007 2008 2009 2010 2011
2007 2008 2009 2010 2011
Central 56 75 65 75 74
Northern 74 69 56 78 98
Tidewater 65 53 50 53 64
Western 143 159 154 166 158
Total 338 356 325 372 394
19CHARACTERISTICS OF THE PUBLIC SERVICE SYSTEM
Public community mental health, developmental, and substance abuse services are provided in
Virginia through a system of 40 community services boards (CSBs). CSBs function as single
points of entry into publicly funded mental health, developmental, and substance abuse services,
defined in § 37.2-100, including access to state hospital and training center services through
preadmission screening, case management, services coordination, and discharge planning. CSBs
also function as service providers, either directly or through contracts with other providers and as
advocates for individuals who are receiving or are in need of services. The table below shows
data on the services provided by CSBs in SFY 2012.
Cost of Publically Funded SA Services by Service Type - SFY 2012
Total Total Unit
Service Served Units Total Cost Cost
Acute Psychiatric or SA Inpatient Services 59 362 $142,371 $393
Community-Based SA Medical Detox Inpatient
Services 189 946 $452,426 $478
Outpatient Services 28,328 547,941 $45,279,427 $83
Case Management Services 10,315 79,265 $12,715,541 $160
Medication Assisted Treatment 1,779 81,070 $6,928,352 $85
Day Treatment/Partial Hospitalization 716 81,247 $3,488,097 $43
Highly Intensive Residential Services 2,582 21,785 $7,581,528 $348
Residential Crisis Stabilization Services 323 1,614 $749,856 $465
Intensive Residential Services 3,667 219,782 $26,376,715 $120
Supervised Residential Services 301 20,771 $2,419,538 $116
Supportive Residential Services 80 2,096 $387,168 $185
Note: Individuals may receive more than one service type
Overall in SFY 2012, CSBs provided services to 36,743 individuals at a total cost of
$106,521,019. As shown above, the most commonly delivered service type was outpatient
services (given to 28,328 individuals). Services range in intensity from highly intensive inpatient
services ($393 - $479 per service unit) to outpatient and day treatment/partial hospitalization
services ($43-$83 per service unit). For a description of each service type, see Appendix E.
The table below displays the amount of revenue by source for FY 2012.
Source of Funding Amount
Federal $43,956,776
State $46,629,700
Local $38,889,682
Fees and Third Party Payments $13,379,713
Other $2,875,071
20The charts below present data on the gender, age and race of the individuals served in SFY 2012.
Figure 25
Individuals Receiving CSB Substance Abuse
Services SFY 2012 by Gender
Female
Male
36%
64%
Individuals served were predominately male (23,393 or 64%), with 13,279 females receiving
services (36%).
Figure 26
Individuals Receiving CSB Substance Abuse
Services SFY 2012 by Age Group
15000
10000
5000
0
61
61
Percent of Treatment Population 8.00% 21.87% 38.15% 20.13% 10.17% 1.68%
Treatment Population Figure 2,939 8,035 14,019 7,396 3,736 618
The average age for services recipients was 34 years of age. Thirty-eight percent of these
individuals (14,019) were in the 26 to 40 age range.
21Figure 27
Individuals Receiving CSB Substance Abuse Services SFY 2012
by Race
Multi-Race
2% Unknown
2%
Other
6%
Black/African
American
30%
White
60%
Black/African Multi-
American White Other Race Unknown
Percent of Treatment Population 29.89% 59.74% 6.10% 2.48% 1.78%
Treatment Population Figure 10,983 21,952 2,242 913 653
Most individuals served reported their race as White (21,952 or 60%) with 10,983 individuals (or
30%) reporting their race as Black/African American. Six percent (2,242) reported their race in
other categories (Asian, Native American, Pacific Islander) while 2% (913) identified themselves
as being Multi-Racial.
The following two charts display data on sources of referral and primary drugs of abuse for
service recipients.
22Figure 28
Individuals Receiving CSB Substance Abuse Services SFY
2012 by Referral Source
14000
12000
10000
8000
6000
4000
2000
0
Family/ Criminal Other Care
Self Other Unknown
Friends Justice Provider
Percent of Treatment Population 28.32% 3.66% 36.69% 10.19% 8.78% 12.35%
Treatment Population Figure 10,406 1,346 13,482 3,745 3,226 4,538
The most common sources of referral were from components of the criminal justice system (law
enforcement, probation, parole, correctional facility, etc. – 13,482 or 37%) which, along with self
referrals (10,406 or 28%), accounted for over half of the individuals served.
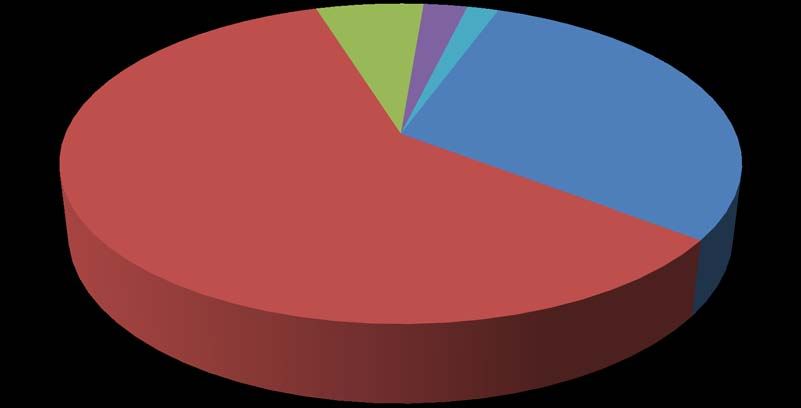
23Figure 29
Individuals Receiving CSB Substance Abuse Services SFY 2012
by Primary Drug of Abuse
14000
12000
10000
8000
6000
4000
2000
0
Cocaine/ Marijuana/
Alcohol Crack Hashish Opiates Other
Percent of Treatment Population 40.42% 10.41% 22.87% 21.85% 4.45%
Treatment Population Figure 13,801 3,555 7,811 7,462 1,519
Almost 14,000 service recipients (40%) reported alcohol as their primary drug of abuse. It is
worth noting that the number of persons reporting Heroin/Methadone/Other Opiates as the
primary drug of abuse (7,462 or 22%) is nearly equal to the number reporting Marijuana/Hashish
(7,811 or 23%) as the primary drug of abuse. This is likely related to the increased incidence of
abuse of prescription opioid-based pain medications. (See Figures 17, 18, 19 and 23.)
24MAJOR ACTIVITIES RELATED TO SUBSTANCE ABUSE SERVICES
Treatment Services
Creating Opportunities for People in Need of Substance Abuse Services: An Interagency
Approach to Strategic Resource Development. In the spring of 2010, DBHDS began the
development of an agency-wide strategic planning process which focused on critical aspects of
the agency’s mission. Among these was an initiative focused on substance abuse services.
Numerous reports had identified weaknesses in the state’s substance abuse treatment system that
seriously affected its ability to provide effective services to those in need. The goal of this
project was to create a strategic planning document that would provide long-term guidance for
developing and strengthening the publicly-funded substance abuse treatment system in Virginia.
To assure input from a wide range of stakeholders, this task was accomplished in a two-stage
process. The first stage built upon the input of a workgroup that included advocates, and public
and private providers. The mix included providers of services to offenders, adolescents, women
and the general population served by CSBs. This group focused on improving access to the array
of services necessary to support recovery, services to people with co-occurring mental illness and
substance use disorders, and services needed by adults in criminal justice populations.
Discussion concerning the needs other special populations (i.e., women, adolescents) was
included in the overall discussion about the necessary array of services.
The second phase of this project built on this work and utilized input from state agency
representatives from the Health and Human Resources secretariat (departments of Behavioral
Health and Developmental Services, Health, Health Professions, Medical Assistance Services,
Rehabilitative Service, Social Services) and Public Safety (departments of Corrections, Criminal
Justice Services, Juvenile Justice). The intent was to get systemic input into the plan for a
cohesive system across state agencies, as those in need of treatment for substance use disorders
typically have complex issues that require resolution in order to support recovery.
The resulting plan document, Creating Opportunities for People in Need of Substance Abuse
Services: An Interagency Approach to Strategic Resource Development
(http://www.dbhds.virginia.gov/documents/omh-sa-InteragencySAReport.pdf), was presented to the
Governor in October of 2011. This plan identified a need for nearly $54 million to ensure timely
access to services, address gaps in the service array, and develop other community-based
supports. In addition to significant initiatives for which DBHDS is responsible, the plan included
initiatives designed to be implemented by Public Safety agencies to reduce relapse associated
with recidivism. This document should provide direction for the development of resources to
treat substance abuse for several years.
Bringing Recovery Supports to Scale Technical Assistance Center Strategy (BRSS-TACS). In
2012, DBHDS received a grant from the federal Substance Abuse and Mental Health Services
Administration (SAMHSA) to participate in a federally-sponsored policy initiative, “Bringing
Recovery Supports to Scale Technical Assistance Center Strategy” (BRSS-TACS). The initiative
aims to advance recovery oriented systems, practices, and supports for persons with mental
health and/or substance use disorders. These practices include integrating persons with lived
experience of recovery into policy development, program design and delivery, improving access
25You can also read