The National Radiation Oncology Plan 2017 to 2021 - Ministry of ...
←
→
Page content transcription
If your browser does not render page correctly, please read the page content below
The National
            Radiation
            Oncology Plan
            2017 to 2021

Released 2017               health.govt.nz
Citation: Ministry of Health. 2017. The National Radiation Oncology Plan 2017 to 2021.
Wellington: Ministry of Health.
Published in May 2017
by the Ministry of Health
PO Box 5013, Wellington 6140, New Zealand
ISBN 978-1-98-850223-6 (online)
HP 6569
This document is available at health.govt.nz
This work is licensed under the Creative Commons Attribution 4.0 International licence. In essence, you
are free to: share, ie, copy and redistribute the material in any medium or format; adapt ie, remix, transform and build
upon the material. You must give appropriate credit, provide a link to the licence and indicate if changes were made.Contents
1 Introduction 1
1.1 Background 1
1.2 The National Radiation Oncology Plan 2017 to 2021 3
2 Context 4
2.1 Overview of radiation oncology in New Zealand 4
2.2 Overview of international trends in radiation oncology 5
3 Introducing the Service Planning Tool 7
3.1 Robust measurement to support quality improvement 7
3.2 Findings 8
4 Using the outputs of the Service Planning Tool 13
4.1 Addressing unwarranted variation 13
4.2 Supporting the foundations of the New Zealand health system 15
4.3 National clinical governance 17
4.4 The regional cancer networks 17
4.5 The role of the Ministry in the ongoing management of ROMDS 17
4.6 The role of private providers 18
5 A framework for action 19
5.1 Overview of the framework 19
5.2 Strategic priorities 20
6 Making it happen – tools, structures and processes 28
6.1 Cancer information 28
6.2 Clinical governance 31
6.3 Linear accelerator capacity 33
6.4 Workforce capacity 34
References 36
Appendix A: Progress with actions from the Radiation Oncology National
Linear Accelerator and Workforce Plan (2013) 38
Appendix B: Radiation oncology metrics 40
Quarterly measures 40
Annual measures 41
The National Radiation Oncology Plan 2017 to 2021 iiiList of tables
Table 1: New Zealand radiation oncology providers by ownership and location 4
Table 2: Provisional curative radiation therapy intervention rate for selected cancers,
2013–2015 10
Table 3: Factors affecting whether patients and referring clinicians choose radiation
therapy 21
Table 4: Actions to give people fair access to the services they need 22
Table 5: Actions to make radiation oncology services safe and effective 24
Table 6: Actions to make radiation oncology services sustainable 26
Table 7: Actions to improve cancer information 30
Table 8: Actions to establish the clinical governance function 32
Table 9: Actions to support enhanced linac capacity planning 33
Table 10: Actions to support enhanced workforce capacity planning 35
List of figures
Figure 1: Provisional radiation oncology intervention and subsequent treatment rates
by DHB of residence, 2013–2015 9
Figure 2: Provisional radiation oncology projected linear accelerator numbers based on
different intervention rates, 2015–2023 11
Figure 3: Provisional attendance numbers for curative intervention rates for breast
cancer by provider, 2014–2015 12
Figure 4: Framework for managing unwarranted variation 14
Figure 5: Functions and activities throughout the process of using the tool to address
unwarranted variation 16
Figure 6: Vision and outcomes, and their supporting tools, structures and processes 19
iv The National Radiation Oncology Plan 2017 to 20211 Introduction
1.1 Background
The New Zealand radiation oncology sector (including both the public and private radiation
oncology providers) and the Ministry of Health (the Ministry) have been working together to
improve the way clinical information is collected and used. The purpose of this work is to
support service and capacity planning, and improve quality in line with the Government’s
priority of improving cancer outcomes for all New Zealanders.
1.1.1 The Radiation Oncology National Linear Accelerator and
Workforce Plan
In 2014 the Ministry published the Radiation Oncology National Linear Accelerator and
Workforce Plan (Health Partners Consulting Group 2014), New Zealand’s first dedicated
national radiation oncology plan (‘the first national plan’). Its purpose was to guide a nationally
coordinated approach to radiation oncology service and capacity planning. The first national
plan was strongly linked to the development of the National Linear Accelerator and Workforce
Capacity Model (‘the Model’), an Excel workbook that helped district health boards (DHBs) and
regional cancer networks (RCNs) in building their understanding of current access and future
demand for radiation therapy, and its implications for linear accelerator (‘linac’) and workforce
capacity.
Through analysis using the Model, the first national plan identified that radiation oncology
providers and DHBs of domicile1 vary in their radiation therapy intervention rates (that is, the
rate at which people with cancer receive radiation therapy as part of their treatment plans).
Other variations it noted were in the length of time taken to deliver treatments and in the
number of treatments received per course of radiation therapy for the same types of cancer. In
response to such findings, the first national plan recognised the potential to improve equity in
access, quality of care and efficiency of service delivery by achieving greater standardisation of
clinical practice across New Zealand, which would in turn address key priorities of the National
Cancer Programme.
The first national plan made 15 recommendations to support the radiation oncology sector to
deliver on National Cancer Programme priorities. In summary, they fell into the three key focus
areas of:
1. further strengthening of planning, which would look beyond capacity to include patient
services as well
2. reviewing data collection, reporting and analysis to inform planning and quality
improvement
3. standardising care to improve equity of access, and quality and efficiency of service
delivery.
Progress against the 15 recommendations (see Appendix A) has informed the development of
this second National Radiation Oncology Plan.
1 DHB of domicile refers to the DHB where the treated patient resides, which may differ from DHB of treatment.
The National Radiation Oncology Plan 2017 to 2021 11.1.2 The New Zealand Cancer Plan 2015–2018
Cancer is a leading cause of morbidity and mortality in New Zealand, accounting for almost one-
third of all deaths. Given this level of significance, the Government has prioritised improving
cancer outcomes as a key area of focus and investment. The New Zealand Cancer Plan 2015–2018
(Ministry of Health 2014) provides a strategic framework to guide all cancer-related activities
across the health system. The aim is for all people to have timely access to excellent cancer
services that will enable them to live better and longer.
For Māori and people living in socioeconomically deprived areas, the burden of cancer is much
higher than it is for the general population. For this reason, the New Zealand Cancer Plan
focuses strongly on equity and improving cancer outcomes for all New Zealanders. No matter
what their ethnicity, gender, locality or socioeconomic status, people must be able to access the
right type of services to meet their needs. To improve cancer outcomes for Māori, the New
Zealand Cancer Plan is guided by the overarching framework and aspirations of the Māori
Health Strategy, He Korowai Oranga (Ministry of Health 2015).
The New Zealand Cancer Plan refers specifically to the predicted growth in cancer-related
activity and cost associated with the growth and ageing of the population. Spending on cancer
treatment services in 2008 was approximately 6 percent of publicly funded health costs, with
the overall spend projected to increase by 20 percent by 2021. Given such high projected
increases in cost, the New Zealand Cancer Plan strongly emphasises the need to improve
productivity and make cancer services sustainable by:
focusing on innovative models of service delivery
increasing the capability and capacity of the cancer workforce
ensuring quality by developing standards and protocols to guide care.
The New Zealand Cancer Plan addresses the growing burden of cancer, inequity of access and
outcomes, and accelerated growth in costs. It sets out the Government’s expectations for cancer
services and outlines the cancer-related initiatives that are being implemented nationwide by
2018. The New Zealand Cancer Plan is consistent with the overarching principles of:
equitably, effectively and sustainably meeting the future demand for cancer services
maintaining high quality of care and improving the quality of life for people with cancer
being fiscally responsible.
1.1.3 The New Zealand Cancer Health Information Strategy
A key way of putting the New Zealand Cancer Plan into action is to strengthen the consistency
and quality of information required to support performance improvement. The New Zealand
Cancer Plan states that by 2018 the Government expects the sector to have timely access to
comprehensive and accurate patient-level data, and that the various types of cancer information
will be structured to provide a consolidated view.
The Cancer Health Information Strategy (Ministry of Health 2015) details key strategies and
activities to achieve the Government’s expectations.
The Cancer Health Information Strategy identifies four strategic interventions:
1. Establish a national framework for managing consistent change to cancer data,
information and intelligence
2. Standardise, digitise and make accessible cancer data at the point of care
2 The National Radiation Oncology Plan 2017 to 20213. Combine relevant patient and cancer service data into cancer information
4. Analyse information, produce cancer intelligence and communicate it to stakeholders.
Given that the Ministry and the radiation oncology sector prioritise collecting and using data to
provide the information needed to improve both service planning and performance, this second
national plan is strongly aligned with the Cancer Health Information Strategy.
1.1.4 The New Zealand Health Strategy
In 2016 the Ministry published the New Zealand Health Strategy (Ministry of Health 2016). The
strategy outlines the high-level direction for New Zealand’s health system from 2016–2026.
Through five strategic themes –people-powered, closer to home, value and high performance,
one team and smart system – it emphasises providing integrated social services to improve the
health of people and their communities.
1.2 The National Radiation Oncology Plan
2017 to 2021
This National Radiation Oncology Plan (‘the Plan’) builds on the first national plan by taking a
broader perspective of the radiation oncology sector, and looking beyond linac and workforce
capacity to include patient services. The Plan is intended to strengthen the sector’s efforts to
improve quality, and service and capacity planning. It is guided by the New Zealand Cancer
Plan’s priorities and expectations, Cancer Health Information Strategy and the New Zealand
Health Strategy.
As part of national radiation oncology service planning, a Radiation Oncology Minimum Data
Set (ROMDS) has been introduced. This ongoing data collection will allow transparent
assessment of care pathways, and will inform capacity planning through the Service Planning
Tool (‘the Tool’).
The Plan is strongly informed by analysis of data from ROMDS and the Tool. It considers the
outputs of each to:
reveal variations in patient access and clinical practice by tumour type across the radiation
oncology providers
compare updated linac and workforce capacity projections with previous projections to
inform radiation oncology service and capacity development.
The Plan provides a set of metrics developed in collaboration with the radiation oncology sector
so that it is possible to benchmark the complexity, quality and consistency of service delivery
across New Zealand’s public and private radiation oncology providers. For the set of metrics, see
Appendix B.
The Plan presents:
a snapshot of the insights developed through collecting and analysing data from ROMDS
a framework for collecting and using radiation oncology data to understand variation in
access and practice, in order to improve service performance
guidance on priorities and actions for applying the framework over five years
guidance on how to align radiation oncology activities with the New Zealand Cancer Plan,
Cancer Health Information Strategy and the New Zealand Health Strategy.
The National Radiation Oncology Plan 2017 to 2021 32 Context
2.1 Overview of radiation oncology in
New Zealand
Radiation oncology services provide radiation therapy as a method of treating cancer. Radiation
therapy uses ionising radiation to destroy or damage cancer cells so they cannot multiply. It can
be used to cure cancer, shrink a tumour before surgery, reduce the risk of a cancer returning
after surgery, or control symptoms if a cancer is too advanced to cure. It is usually delivered over
an extended period due to the number of doses or ‘fractions’ required.
Radiation therapy may be delivered externally using a linac, or internally as brachytherapy
(where radioactive materials are placed inside the body in, or near, the cancer). Linacs are high-
cost technology and must be replaced about every 10 years. They also require custom-built
facilities (‘bunkers’) that protect staff from radiation.
To deliver radiation therapy, a highly specialised workforce works in a multidisciplinary team.
Core team members are the radiation oncologist, radiation therapist and medical physicist.
Radiation therapy is commonly given as part of a combination treatment with surgery and/or
chemotherapy. For this reason, radiation oncology functions within a wider cancer service in
which professionals use multidisciplinary meetings to plan and monitor overall patient
treatment. Professional disciplines within a wider cancer service can include medical oncology,
paediatric oncology, surgical oncology, clinical haematology and palliative care.
Nine radiation oncology providers operate in New Zealand. Three of them are privately owned
and the remaining six are owned by DHBs. Table 1 lists each radiation oncology provider by type
of ownership and location.
Table 1: New Zealand radiation oncology providers by ownership and location
Radiation oncology provider Ownership Location
Auckland DHB Public Auckland
Auckland Radiation Oncology Private Auckland
Waikato DHB Public Hamilton
Kathleen Kilgour Centre Private* Tauranga
MidCentral DHB Public Palmerston North
Capital and Coast DHB Public Wellington
Canterbury DHB Public Christchurch
St George’s Cancer Care Centre Private Christchurch
Southern DHB Public Dunedin
Note: * The Kathleen Kilgour Centre also routinely provides public radiation therapy funded by Bay of Plenty DHB.
4 The National Radiation Oncology Plan 2017 to 2021Because radiation oncology services are highly specialised and costly, they need to serve a large
population catchment. For this reason, providers usually offer support for travel and
accommodation to patients and their families and whānau. The radiation oncology service also
usually provides outreach (visiting) clinics to improve access for patients living in rural and
smaller urban areas. The service has close links with local specialists and primary health care
services.
2.2 Overview of international trends in
radiation oncology
2.2.1 Evolution of radiation therapy technologies
Radiation therapy techniques and delivery technologies continue to develop globally. Intensity
modulated radiotherapy (IMRT) and image guided radiotherapy (IGRT) are two advanced
radiation therapy options that are becoming routine in clinical practice in developed countries,
including New Zealand. Internationally the use of stereotactic ablative body radiotherapy
(SABR) is increasing along with proton beam therapy (PBT) (Cancer Research UK 2014).
However, while SABR is available in New Zealand, PBT is not.
In addition to having increasingly sophisticated delivery technologies, radiation therapy is
moving towards delivering more personalised care. Key innovations in this area include:
adaptive treatments that respond to changes in tumour and patient characteristics
throughout the course of treatment. While these are proven to improve patient outcomes,
such as reducing side effects and normal tissue damage, they can involve significant
investment of staff time
molecular and biological imaging techniques to support more targeted treatments.
The role of radiation therapy software is growing as its sophistication increases and allows
aspects of the treatment planning process to be automated. Such developments should help
minimise unwarranted variation in therapy, make treatment delivery more efficient, improve
clinical practice through sharing and peer review of plans, and enable staff to link plans with
outcomes.
2.2.2 The use of target intervention rates
Several countries (including the United Kingdom, Australia, Canada, the Netherlands and
Sweden) have set ‘optimal’ intervention rates (IRs) as a national standard for access to radiation
therapy. England has progressed further to develop optimal access rates for specific radiation
therapy techniques – for example, 24 percent of radical fractions should be delivered by inverse
planned IMRT. The aim of such targets is to encourage National Health Service Trusts (ie,
public hospitals) to invest in contemporary technologies.
Countries vary in what they consider to be the optimal access rate for radiation therapy, and
these standards also change over time. Recent reviews of international evidence in several
countries have recommended reducing IR targets for each type and stage of cancer. In England,
for example, the recommendation was to reduce the IR target for cancer from 52 percent to
40.6 percent (Round et al 2013), and in Australia from 52 percent to 48 percent (Barton et al
2013).
The National Radiation Oncology Plan 2017 to 2021 5To date, New Zealand has not specified a national IR goal. Instead it has focused on providing
timely access for patients referred for radiation therapy, and reducing barriers to accessible and
high-quality treatment to improve patient outcomes. The initial steps towards these goals have
been to improve the approach to collecting and using clinical data. With the development of the
Service Planning Tool (section 3.1), it is now possible to understand variation by tumour stream,
including in IRs. The intention is to use the Tool to guide the delivery of high-quality care, which
in future may include setting optimal IRs for specific tumour streams if this is considered likely
to improve quality of and access to care.
2.2.3 Developing a world-class radiation oncology service
A report for Cancer Research UK describes seven prerequisites for a world-class radiation
oncology service (The Tavistock Institute 2014). These components are based on a combination
of broad consensus from the literature, examples of global best practice and the views of leading
practitioners in the field. The seven prerequisites are for the radiation oncology service to:
1. have sufficient capacity and activity volume to create economies of scale
2. fully use up-to-date technology and equipment
3. have sufficient numbers of trained staff to meet demand and develop the service
4. invest adequately in capital, with an appropriate business model and commissioning
structure to use it effectively
5. conduct high-quality research and transfer research knowledge into practice
6. create an evaluation culture by providing robust measurement tools to support evidence-
based, high-quality practice
7. have a work environment and an organisational culture, supported by effective leadership
and management, that promote coordinated planning, multidisciplinary working, and
good radiotherapy practices, standards and research.
In the New Zealand context, these seven prerequisites have helped to form the framework
within which this Plan has been developed.
6 The National Radiation Oncology Plan 2017 to 20213 Introducing the Service
Planning Tool
3.1 Robust measurement to support quality
improvement
In line with Government priorities for cancer treatment, the Ministry and the radiation oncology
sector are focusing on the collection and use of data to inform quality improvement, and service
and capacity planning.
The first national plan suggested the radiation oncology services of DHBs of domicile2 and
radiation oncology providers vary significantly, including in IRs, subsequent treatment rates
(STR) and complexity. However, it could not confirm such variations as the existing national
data set was not robust enough in terms of the measures it used and the accuracy of the data.
Recognising the fundamental importance of accurate information for capacity and service
planning, quality improvement, evaluation and research, this second national plan has reviewed
how providers capture and use radiation oncology data, covering the entire process from
submitting data to monitoring and escalating actions. The aim is to ensure that all radiation
oncology providers are collecting and reporting data consistently, and that this is analysed and
used for quality improvement within a consistent national framework.
The data fields and metrics have been agreed across the sector through the Radiation Oncology
Working Group (ROWG), and a data collection system specified. The metrics focus on three
main areas.
1. Equity of access – do all New Zealanders have access to the radiation therapy they need?
2. Capacity – do the radiation therapy providers have the linac and workforce capacity to
provide that care?
3. Quality of care – how can the sector demonstrate the quality of the care it provides?
Timeliness of care falls into areas 2 and 3, and is covered in the national Faster Cancer
Treatment programme (for more details, see Ministry of Health 2014).
The radiation oncology providers have each contributed data to compile a test data set, covering
2012–2015, to support the new metrics and prepare for the full radiation oncology information
system that this Plan advances. The National Linear Accelerator and Workforce Capacity Model
was updated and further developed, becoming known as the Service Planning Tool (the Tool).
The Tool now includes the new data elements, and allows users to analyse data by the major
cancer types. Users can also explore future projection scenarios for each cancer type, with
parameters including the IR, the STR, the number of attendances per course, and time taken for
each attendance. With future developments of the Tool, it will be possible to collect and analyse
more ethnicity data, sourced from the Ministry’s national collections.
2 DHB of domicile refers to the DHB where the patient primarily resides, which may differ from DHB of treatment.
The National Radiation Oncology Plan 2017 to 2021 73.2 Findings The test data set, with data from each of the radiation therapy providers, was loaded into the Tool and used in a preliminary analysis for 2012–2015. The preliminary analysis has combined these three years to reduce variability in data from year to year. As the new data collection system is implemented, these findings will be updated. For this reason, the findings are presented below only to illustrate some of the ways in which the Tool will be used and should be seen as provisional. These provisional findings will not inform decision-making around clinical practice and the data will be analysed in more detail once it becomes more robust. 3.2.1 Equity of access Intervention rate A key measure of access to radiation oncology is the population IR. This assesses the proportion of cases of cancer that are treated at least once with radiation therapy. The Cancer Registry provides the number of cancer cases, while the radiation oncology data system collates the number of people being treated. New Zealand’s overall IR of 37 percent is comparable with the IRs of New South Wales (NSW Health 2013) and the United Kingdom, but some research indicates that higher rates (up to 48 percent) might contribute to population health gain (Delaney and Barton 2015). For more on potential growth in the IR for New Zealand, see section 5.1, priority 3. Evidence-based IRs vary widely by cancer type, so the same access rates by cancer might result in different overall IRs. Nevertheless it would be expected that within the mix of cancers being treated, all of the DHBs would lie within a 5–8 percent IR span. As Figure 1 shows, the range by DHB is from 28–44 percent, which is more than would be expected from variations in cancer type. There appears to be little difference between males and females, and the national Māori IR of 37 percent is the same as the overall rate. 8 The National Radiation Oncology Plan 2017 to 2021
Figure 1: Provisional radiation oncology intervention and subsequent treatment rates by
DHB of residence, 2013–2015

Source: Radiation oncology provisional data, EY analysis.
Note: Excludes treatments for non-melanoma skin cancer, benign cancer, in-situ, myelodysplasia, and conditions
other than cancer (enables matching like for like with the international literature). Cancer registrations estimated for
2014–2015. Intervention rate = the proportion of all registered cancers that are treated with at least one course of
radiation therapy. Subsequent treatment rate = the proportion of all radiation therapy treatment courses delivered to
people who have already had at least one treatment course for the same cancer. Subsequent treatment courses at
same time for same patient counted once only. Circles proportional to the average number of treatments 2013–2015.
Colours represent cancer network areas.

Subsequent treatment rate
A second measure of access, the STR, considers the proportion of all treatments that were the
second or later treatments for that person for that cancer. The STR mainly represents access to
palliative (rather than curative) treatment. It is expected that subsequent treatment rates will
vary more than intervention rates because palliative care arrangements vary across the DHBs
(some issues around defining courses are also yet to be resolved.) The vertical axis data in Figure
1 indicates that the subsequent treatments comprise 23 percent of all treatments (21 percent for
Māori) and range from 15–35 percent across DHBs.

The curative IR
The purpose of treatment can be seen as a subset of the IR. For those first treatments done for
curative purposes, the spread by DHB is smaller: the provisional data ranges from 17–30 percent.
On average, 24 percent of all registered cancers in New Zealand get a curative radiation oncology
course. For Māori patients the rate is slightly lower at 21 percent. The rank order by DHB is
similar to that for the overall IR.

                                                    The National Radiation Oncology Plan 2017 to 2021                 9
The IR for individual cancers
The IR can also be examined for individual cancers. For example, Table 2 shows the curative
intervention rate for the four most commonly treated cancers (excluding non-melanoma skin
cancer). The proportion of cancers receiving a curative radiation treatment varies based on the
evidence of effectiveness and the stage of the cancer at presentation. Overall, around two-thirds
of breast cancers and half of rectum cancers received at least one curative course, while only
24 percent of prostate cancer patients and 13 percent of lung cancer patients were so treated.
Rates varied significantly by DHB, as evidenced by the minimum and maximum percentages in
Table 2 – small numbers of cancers in smaller DHBs can create large swings from year to year.
The pattern varies by cancer: in other words, it is not that one DHB has low radiation therapy
access in every cancer; rather they might be relatively low in one and high in another. It is
necessary explore cancer pathways further, at both the therapy providers and the referring
hospitals. Metrics for these four key cancers for radiation oncology treatment will be covered by
DHB in the first year of monitoring (see Appendix B).
Table 2: Provisional curative radiation therapy intervention rate for selected cancers,
2013–2015
Cancer Number of Number treated Average IR Minimum DHB Maximum DHB
registrations per year with radiation rate rate
Breast 3,056 1,970 64% 40% 81%
Prostate 3,627 863 24% 7% 34%
Lung 2,038 273 13% 8% 17%
Rectum 798 400 50% 36% 71%
Source: Radiation oncology provisional data, EY analysis. Cancer registrations estimated for 2014–2015.
Note: IR = intervention rate. Average IR refers to the proportion of all registered cancers that are treated with at least
one curative course of radiation therapy for that specific tumour type. Minimum DHB rate = lowest proportion by DHB
of domicile; Maximum DHB rate = highest proportion by DHB of domicile.
3.2.2 Capacity
As section 3.1 notes, the Service Planning Tool has been updated with the new provisional data.
Based on current operational parameters (treatment visits per course and treatment times),
linac numbers and operating hours, and given no increase in IRs, New Zealand might need five
to six additional linacs by 2023.3 This additional demand will come from the growth in both the
overall population and the older population, which together will increase the number of cancers
expected and therefore the number of people undergoing radiation treatment. This increased
demand is offset a little by the expected fall in incidence of some cancers – for example, in lung
cancer through the reduction in tobacco smoking. Note that this prediction assumes the current
mix of public and private provision continues, and that each radiation oncology provider
maintains its current catchment.
3 This estimate is based on the assumptions that: linacs operate for up to nine hours per week day for peak months;
intra-monthly fluctuations in demand can be managed through judicious use of overtime; and linacs can be
operated 95 percent of the available time (nine hours per week day). Changes to these assumptions would change
the overall estimate. For example, if the assumptions were that linacs operated only eight hours per week day and
operated 90 percent of the time, between seven and eight linacs might be required by 2023.
10 The National Radiation Oncology Plan 2017 to 2021To provide these additional courses, a larger workforce will be needed. Based on current
workforce provisioning (and assuming current vacancies are filled), the estimated need is for an
additional 28 radiation oncologists, 24 medical physicists and 70 radiation therapists by 2023 to
maintain current IRs. Current workloads are assumed to continue; for example, if overtime is
used extensively now, then that would continue into the future.
If the IR rises over future years, then the number of linacs required will increase. Each
percentage point increase in IR equates to roughly an extra linac over time for the New Zealand
population – rising to 42 needed from the 31 available in 2015, if an IR of 45 percent is reached
(a scenario based on all DHBs reaching a rate equal to the highest reached by a DHB in 2013–
2015) (see Figure 2). The subsequent treatment rate is held steady in these scenarios, as are the
number of treatment visits per course and average time per treatment. The timing of any
increase is illustrated in the Tool for each provider, with local circumstances and demand
determining the actual development of additional capacity.
Figure 2: Provisional radiation oncology projected linear accelerator numbers based on
different intervention rates, 2015–2023
Source: Radiation Oncology Service Planning Tool, provisional data. Based on estimated cancer registration growth
and current work parameters as discussed in text.
Note: IR = intervention rate; 37% maintains current rates. ‘Actual’ represents current linear accelerator stock. Figures
subject to change once the Radiation Oncology Minimum Data Set is fully operational.
3.2.3 Variation in practice
In the future, it will be possible to use the detailed data collected for the Tool to compare
treatment regimes across providers. While still provisional, the test data set highlights some
variation in current treatment patterns. For example, breast cancer treatment has changed in
recent years to prefer a shorter course of 15 treatments rather than the traditional 25 treatment
course (where anatomy allows). This shorter course is termed ‘hypofractionation’ – literally
fewer fractions, where a fraction is a proportion of a radiation oncology treatment. As expected,
curative treatments follow this pattern at most centres (Figure 3): the main peak is at 15–16
visits and a secondary one at 25 visits. Two centres appear to show the reverse pattern.
The National Radiation Oncology Plan 2017 to 2021 11Figure 3: Provisional attendance numbers for curative intervention rates for breast cancer by provider, 2014–2015 Source: Radiation oncology provisional data, EY analysis. Note: Curative first treatments for external beam radiation treatment for breast cancer showing the number of visits (attendances) per course. Each graph represents a provider; one provider is not represented, as data was not supplied. 12 The National Radiation Oncology Plan 2017 to 2021
4 Using the outputs of the
Service Planning Tool
New functions and accountabilities will be needed, first, to make the Tool a sustainable part of
everyday practice at national, regional and local levels. They will also be needed to ensure people
use its insights to address unwarranted variation in radiation oncology services and inform
capacity planning. Radiation oncology services will provide a prototype for cancer services
generally in their use of information within the Cancer Health Information Strategy framework.
The approach to establishing the Tool must ensure it drives the actions outlined in section 6.1.
4.1 Addressing unwarranted variation
In 2014, the Health Quality & Safety Commission published a literature review on methods for
addressing unwarranted variation (HQSC 2014). Unwarranted variation is defined as variation
that cannot be explained on the basis of illness, medical evidence or patient preference. Clinical
care can be grouped into three categories to help understand how services may vary.
1. Effective care – interventions have benefits that far outweigh the risks. In this case, almost
every patient will receive the ‘right’ treatment defined by evidence-based guidelines.
Unwarranted variation here generally involves underuse.
2. Preference-sensitive care – more than one generally accepted treatment option is
available. The rate of ‘right’ treatment depends on informed patient choice but treatment
rates can vary extensively because of differences in professional opinion.
3. Supply-sensitive care – these clinical activities include doctor visits, diagnostic tests and
hospital admissions. Their frequency of use depends on the capacity of the local health
care system. The key issue is that those living in districts with a high-intensity pattern of
care have worse or no better outcomes than those living in low-intensity regions. That is,
greater intensity of care does not necessarily equate to improved outcomes.
In its publication, the Health Quality & Safety Commission outlines a step-by-step process for
understanding and managing variation. The first step is to identify variation and understand its
causes to establish whether it is actually unwarranted. International experience shows that
understanding clearly which variations are unwarranted and agreeing on responsibilities for
action are critical to moving from initial information gathering towards decisions about
allocating resources and changing behaviour.
Since 2008 the Ministry has supported the radiation oncology providers and private radiation
therapy services to gather information on access to and provision of radiation oncology services.
Using the Tool, the sector will now be able to understand variation with more detailed and
accurate data. However, to effectively address variation, an appropriate structure must be
established and given the resources to take action. The Health Quality & Safety Commission’s
literature review highlights the need for a focused programme of work to:
define unwarranted variation clearly and consistently
prioritise those variations and causes that have the strongest impact on equity, effectiveness,
efficiency and patient health outcomes
agree on responsibilities for action and leadership to influence change (HQSC 2014).
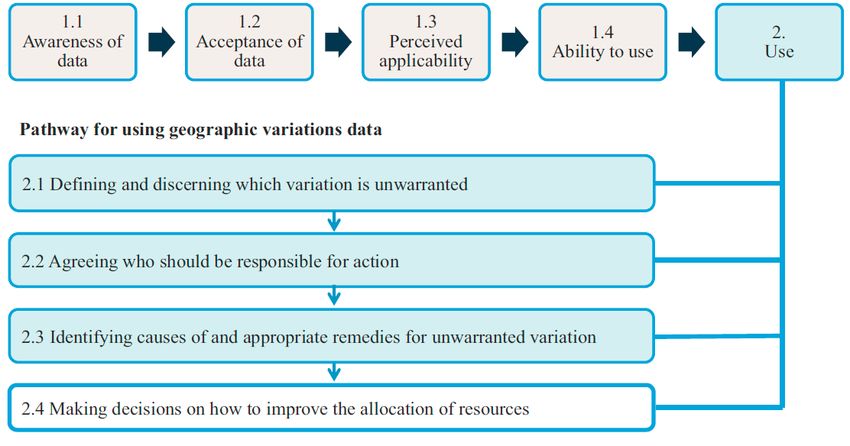
The National Radiation Oncology Plan 2017 to 2021 13Figure 4 presents a useful framework for moving from information gathering and decision-
making to supporting performance improvement.
Figure 4: Framework for managing unwarranted variation
Source: Schang et al (2014).
The radiation oncology sector has reached box 1.4 ‘ability to use’ and is ready to move to box 2
‘use’ (Figure 4). Section 6.1 sets out the actions needed to establish the appropriate structure
that will support steps 2.1–2.4.
Importantly, the use of data to improve clinical practice is not without its challenges. The United
Kingdom National Cancer Intelligence Network gives practical advice on publishing
comparative data and managing outlier institutions (NCIN 2012). Acknowledging that such
tasks can be challenging, it provides a principles-based approach to manage outliers most
effectively while recognising the need for flexibility to account for different circumstances. The
principles, as summarised below, give useful guidance for the radiation oncology sector on using
and managing information from ROMDS.
Involve clinical staff strongly from the start.
Engage early with professional leaders.
Build sufficient time into plans for publication.
Inform those included in the analysis that it is happening.
Inform potential outliers well in advance of publication and be prepared to address their
concerns.
Be prepared to conduct additional analyses.
Respond sensitively to requests and challenges.
Emphasise outcomes that are better than expected and the opportunities to learn from these.
14 The National Radiation Oncology Plan 2017 to 20214.2 Supporting the foundations of the
New Zealand health system
The Tool has been developed to support two dimensions of radiation oncology planning:
1. clinical service planning, including quality improvement
2. linear accelerator (linac) and workforce capacity planning.
While these two dimensions address different components of service delivery, they overlap in
some ways. For example, if intervention rates or workforce models change, it may influence use
of current capacity and, in turn, future requirements.
The New Zealand public health system has strong foundations in devolving power through
clinical governance and DHB accountability. Arrangements for applying the radiation oncology
Tool support these foundations, as does the regional collaboration between constituent DHBs
and between public and private radiation oncology providers. DHBs have the local
accountability for service and capacity planning, access and outcomes; they are legislated to
fund access to the necessary services for their resident populations. DHBs work closely with the
RCNs to gain regional commitments by constituent DHBs to support capacity planning and
decision-making among radiation oncology providers. Figure 5 shows the functions and
activities involved in using the Tool nationwide to address unwarranted variation, covering the
entire process from submitting data to monitoring and escalating actions.
The National Radiation Oncology Plan 2017 to 2021 15Figure 5: Functions and activities throughout the process of using the tool to address unwarranted variation Note: Responsible parties: Ministry = Ministry of Health; ROWG = Radiation Oncology Working Group; RCNs = regional cancer networks; DHBs = district health boards; RO providers = radiation oncology providers. 16 The National Radiation Oncology Plan 2017 to 2021
4.3 National clinical governance
The governance structure of the National Cancer Programme was refreshed in May 2016. To
reflect the changing priorities for cancer as set out in the New Zealand Cancer Plan and the New
Zealand Health Strategy, the Cancer Programme Leadership Board (the Board) was established
as the main governance body overseeing the National Cancer Programme. The Board will drive
and support the long-term strategic direction for cancer.
Within the new National Cancer Programme structure, the Radiation Oncology Working Group
(ROWG) will continue to have a key role in clinical leadership across the public and private
radiation therapy providers. Through this Plan, its role will be expanded and more explicit as it
takes on responsibility for national clinical governance of radiation oncology (section 6.2).
ROWG’s terms of reference, membership and resourcing will be reviewed to ensure they are
appropriate to support this function. The Ministry will continue to be responsible for providing
secretariat support for ROWG.
4.4 The regional cancer networks
Within the National Cancer Programme, the role of the four regional cancer networks (RCNs) is
to provide regional leadership through working with the DHBs in their regions to promote
collaboration in service planning and delivery. RCNs are contracted by the Ministry and their
primary accountability is to their constituent DHBs, who in turn are accountable to the Minister
for delivering their regional priorities as outlined in regional planning documents. While the
functions of each of the RCNs are similar, their local context informs their priorities and so their
work programmes may be different.
The role of RCNs in supporting the implementation of the national plan and ROMDS will focus
on radiation oncology service and capacity planning, and supporting quality improvement.
ROWG will give the RCNs guidance on unwarranted variation and the RCNs will work with their
constituent DHBs and radiation oncology provider(s) to define and action a regional plan for
addressing that variation.
4.5 The role of the Ministry in the ongoing
management of ROMDS
The Ministry will be primarily accountable and responsible for the ongoing management of the
ROMDS. This includes the first three functions of the entire process for using ROMDS (see
Figure 5):
submitting data and inputting it into the Tool
analysing and reporting
interpreting and circulating results.
The long-term vision, as outlined in the New Zealand Cancer Plan and the Cancer Health
Information Strategy, is for the radiation oncology sector to have timely access to
comprehensive and accurate patient-level data across treatment modalities.
The National Radiation Oncology Plan 2017–2021 17The strategies in the Cancer Health Information Strategy align closely with those activities
needed to support the ongoing management and use of the Tool. In particular, they involve:
providing a national framework for managing cancer data and ongoing changes
combining relevant patient and cancer service data into cancer information for service and
capacity planning
analysing information to produce cancer intelligence and communicate it to stakeholders.
The final activities listed above – generating cancer intelligence, developing meaningful insights
and effectively communicating them to stakeholders – are particularly important as they frame
the clinical governance review (see Figure 5). The long-term vision for managing cancer data is
to have the required information flowing into a central analysis hub operated by the Ministry.
However, given the Cancer Health Information Strategy will not be fully implemented before the
sector is using the Tool, an interim solution will be needed to support the radiation oncology
sector with achieving its priorities.
As section 6.1 outlines, the first action for making ROMDS part of everyday practice is to
establish an interim solution that enables the radiation oncology sector to continue to build on
its use of data to inform clinical practice. The Ministry is currently working with the Cancer
Health Information Strategy to develop a solution that will support the transition into the future
central analysis hub.
4.6 The role of private providers
Private providers will be responsible for supplying ROMDS data. Although standards of care
that ROWG develops will be primarily aimed at the public radiation oncology providers, private
providers will be encouraged to improve services voluntarily based on analysis of the data.
18 The National Radiation Oncology Plan 2017 to 20215 A framework for action
5.1 Overview of the framework
The vision for radiation oncology services is:
Radiation oncology services will be equitable to all New Zealanders, providing them with
high-quality care to achieve the best possible outcomes.
Underpinning the vision are three priority outcomes.
1. People have fair access to the treatment they need.
2. Radiation oncology services are safe and effective.
3. Radiation oncology services are sustainable.
Five key supporting tools, structures and processes that will help to make the vision and
outcomes happen are:
1. cancer information
2. clinical governance
3. linear accelerator capacity
4. workforce capacity
5. information technology (IT) infrastructure.
Figure 6 summarises this framework for action.
Figure 6: Vision and outcomes, and their supporting tools, structures and processes
The National Radiation Oncology Plan 2017–2021 195.2 Strategic priorities
5.2.1 Priority 1: People have fair access to the treatment they
need
Faster Cancer Treatment
The Government is committed to better, sooner, more convenient health care, and the Faster
Cancer Treatment (FCT) programme is a key element in achieving this. The FCT programme is
designed to reduce waiting times for appointments, tests and treatment, and standardise care
pathways for all patients wherever they live.
The Faster Cancer Treatment health target is 85 percent of patients referred urgently with a high
suspicion of cancer receive their first cancer treatment (or other management) within 62 days.
This will increase to 90 percent by July 2017.
Data from 1 October 2015 to 31 March 2016 suggests patients receiving radiation therapy as
their first treatment are less likely to meet the 62-day target than patients receiving other
treatment modalities (such as chemotherapy and surgery). This difference highlights the need
for continued effort to improve timely access to radiation therapy.
Fair access
In addition to the Faster Cancer Treatment health target, the two other key indicators of access
to radiation therapy are:
intervention rate (IR): the proportion of all registered cancers that are treated with at least
one course of radiation therapy
subsequent treatment rate (STR): the proportion of all radiation therapy courses delivered to
people who have already had at least one course for their cancer.
As discussed in section 3.2.1, in New Zealand the average IR is 37 percent and average STR is
23 percent. Individual DHB radiation therapy rates range from 28–40 percent for IR and 15–
35 percent for STR. These wide ranges highlight the considerable variation in access across the
DHBs. The reasons for these differences and their implications are not immediately apparent.
However, with the Tool and the supporting clinical governance structure in place, the radiation
oncology sector can now investigate the issue further and take action to minimise unwarranted
variation in access.
There is no evidence to suggest patients who need radiation therapy in New Zealand are being
turned away because of workforce or linac capacity shortages. However, factors that can help or
reduce a person’s access to services include:
the clinical practice of the referrers
the clinical practice of the treating radiation oncologist
the radiation oncology provider’s model of care
how far away the patient lives from the radiation oncology provider
the patient’s own choice
the tumour type
the patient’s ethnic group
the patient’s socioeconomic deprivation level.
20 The National Radiation Oncology Plan 2017 to 2021It is likely that the current variation in access reflects a complex interplay of such factors.
Through its research into the causes of variation in access, New South Wales Health (2011)
provides an evidence-based list of factors identified through the international literature (see
Table 3). The evidence underpinning these factors suggests that addressing these barriers will
improve access, as measured by both referral and intervention rates.
The Government has prioritised improving the coverage and functionality of multidisciplinary
meetings as a key initiative for the FCT programme. Cancer is often treated using multiple
treatment modalities, including radiation therapy, chemotherapy and surgery. The specialty of
the referrer, or the preferences of the individual specialist, may influence which of the multiple
treatment modalities they use and the order in which they use them. For this reason,
multidisciplinary meetings can be useful in supporting evidence-based treatment planning.
Those investigating variation in access in New Zealand will consider questions such as the
following.
Are varying STRs simply a reflection of differing approaches to palliative care around the
country, or are providers not offering radiation therapy as an option for some patients?
Where a DHB of domicile has a lower intervention or subsequent treatment rate, what is the
impact of this? Is the DHB using other cancer treatment modalities instead?
It is expected that the RCNs will lead the detailed investigation of such questions, with national
guidance from ROWG. RCNs are well placed to take a regional view of service variation, and
work locally with DHBs and radiation oncology providers on achieving national standards of
access.
Table 3: Factors affecting whether patients and referring clinicians choose radiation
therapy
Perspective Factor Description
Patient Distance Where the distance to treatment is significant, patients may choose another
treatment option. Factors related to ease of transport, such as availability of
public transport and road quality, also affect their choice.
Accommodation Whether affordable accommodation is available for the lengthy treatment
period and whether financial compensation is available (and easy to access)
may influence patient choice.
Patient perception Perception of risk and benefit of radiotherapy compared with other treatment
options (another treatment, or no treatment).
Disruption to Degree of disruption that treatment causes to the patient and family/carers.
patient
Family/carer Availability of family/carer support in the location of treatment.
support
Waiting times Perception of waiting times, based on media, service data or other sources.
Cultural Rates of cancer mortality are higher among the Māori and Pacific populations,
considerations mainly because of disparities in treatment. Important ways of reducing these
disparities are to have empathetic personal contact and to acknowledge and
respect Māori and Pacific family structures, culture and life circumstances, and
the importance of history, land and community. Treatment that is remote from
the spiritual link with home and community is also a barrier.
Financial impacts Out-of-pocket costs or upfront payment.
The National Radiation Oncology Plan 2017–2021 21Perspective Factor Description
Referring Pathway Understanding and knowledge of radiotherapy indications and treatment
clinician regimes. Involvement in a multidisciplinary meeting may help improve this
understanding, as would access to online referral and treatment guidelines.
Specialty Radiotherapy is often delivered in conjunction with surgery and chemotherapy.
The specialty of the referrer, or the preferences of the individual specialist,
may influence which of the multiple treatment modalities they use and the
order in which they use them. Having multidisciplinary meetings and access to
referral and treatment pathways and guidelines may improve access to
treatment for patients.
Waiting times If the clinician perceives the patient may have a lengthy wait, this may
discourage them from making referrals, whether or not that perception
matches reality.
Financial impacts Financial impacts of referral on an individual practitioner or on a service.
Priority 1: Actions – Roadmap
Table 4 lists the actions planned to enhance enquiry into clinical variation and improve access to
services in line with Government priorities.
Table 4: Actions to give people fair access to the services they need
Action Who is involved By when
1.1 Prioritise at least one variation in ROWG will review current variation/s in access and 2017–2021
access and/or care query of prioritise at least one query per year
interest per year and investigate The Ministry will undertake the specific analysis
the root cause required
RCNs will investigate the causes of variations beyond
the data
1.2 Plan and implement initiatives to ROWG will determine the standard of care expected 2017–2021
manage the prioritised variation/s and monitor progress
in access per year RCNs will plan the initiative in collaboration with
radiation oncology providers and referrers
Radiation oncology providers will implement the
initiative in collaboration with RCNs and referrers
1.3 Understand variation RCNs and radiation oncology providers will work with Ongoing
DHB cancer managers to understand variation and
report to ROWG
5.2.2 Priority 2: Radiation oncology services are safe and
effective
Evidence-based care and variation in clinical practice
In addition to variable intervention rates, the first national plan identified significant variation
between radiation oncology providers in their subsequent treatment rates, treatment times and
numbers of treatments per course for the same cancers. Challenges with the accuracy of data
made it difficult to validate the variation for the first national plan. However, the plan
considered that while some variation in clinical practice is to be expected, evidence-based care
would drive convergence towards the same specific care pathways. It would therefore be
worthwhile to further investigate the potential benefits of increasing standardisation and cross-
provider learning.
22 The National Radiation Oncology Plan 2017 to 2021Using ROMDS under the guidance of this second national plan will provide the sector with a
more reliable means of evaluating variation in clinical practice. While the data reported in this
Plan is provisional, initial findings suggest the providers are reasonably consistent in their
treatment patterns for the major cancers. Some differences are noticeable though. For example,
for curative treatment for breast cancer, current evidence suggests the majority of women can be
treated with a 15- or 16-day course; however, some providers continue to provide mainly 25-day
courses (see Figure 3 in section 3.2.3). Similar types of variation across providers are evident for
prostate and lung cancer.
However, it is important to note that not all variation is undesirable or unwarranted. As Mulley
(2010) writes, ‘The trick is in reducing the bad variation, which reflects the limits of professional
knowledge and failures in its application, while preserving the good variation that makes care
patient centred’. Through ROWG, national direction on the best evidence-based treatment
pathways will help the sector to interpret variation and identify approaches to address it.
At a national level it is difficult to determine whether local variation is warranted. Local
initiatives and analyses are required to understand the reasons for the variation and to identify
any variation that is unwarranted. This is why ROMDS has the support of a governance and
accountability structure that operates throughout the sector from national through to regional
and local levels (see section 6.2). The aim is to achieve the related prerequisite of a world-class
radiation therapy service: to create an evaluation culture by providing robust
measurement tools to support evidence-based, high-quality practice.
The learnings of the Health Quality & Safety Commission and of existing national and regional
clinical networks will inform the approach to reducing unwarranted clinical variation that the
radiation oncology sector uses.
Research
High-quality research and the transfer of research knowledge into practice drive
the evidence-based care noted above and form another prerequisite for delivering world-class
radiation therapy. Directly contributing to and participating in research is considered a marker
of good practice. Nations with a reputation for delivering effective radiation oncology services –
such as the Netherlands, Canada and Sweden – all conduct extensive research. This work
includes conducting many clinical trials and adopting any beneficial learnings. When findings
are translated into routine clinical practice, this in turn promotes inquiry, innovation, the
spread of knowledge and retention of staff.
Tripartite Radiation Oncology Practice Standards
This Plan recognises that implementing mandatory standards of care can be an effective way of
increasing safety and quality of care. In 2013 the ROWG adapted the Tripartite Radiation
Oncology Practice Standards, developed by the Royal Australian and New Zealand College of
Radiologists (Tripartite Committee 2008), for use in New Zealand. At this stage it is too early to
recommend that those standards should be implemented, either partially or in full. Further
investigation is needed to assess whether it is feasible to implement them and what their costing
implications would be. This Plan includes an action to review the standards by 2018 (see Table 8
in section 6.2).
The National Radiation Oncology Plan 2017–2021 23You can also read