The Burden of Osteoporosis in New Zealand: 2007-2020
←
→
Page content transcription
If your browser does not render page correctly, please read the page content below

Auckland UniServices Limited                               School of Population Health
                                                                      Tamaki Campus
                                                               University of Auckland
                                                                    Private Bag 92019
                                                                        AUCKLAND

                           Prepared for Osteoporosis New Zealand Inc

           The Burden of Osteoporosis in New Zealand: 2007-2020

                                               October 2007

Prepared for Osteoporosis New Zealand by:

Dr Paul Brown
Dr Rob McNeill
Eman Radwan
Jane Willingale

On behalf of the School of Population Health

ACKNOWLEDGEMENT:
The authors would like to acknowledge the expert clinical advice given by the scientific committee, and
especially Professor Ian Reid, Dr Brandon Orr-Walker, Julie Harris and Gillian Robb.

This report was commissioned by Osteoporosis New Zealand and is proudly supported by an independent
 education grant from Fonterra Brands Ltd. Fonterra Brands Ltd has had no part in the commissioning,
                                  direction or content of this report.

                                                                                                          1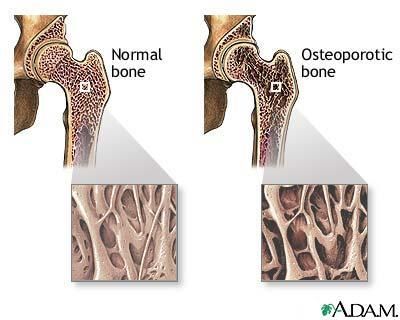
Contents
1        EXECUTIVE SUMMARY .......................................................................................................................................... 5
2        UNDERSTANDING THE BURDEN OF OSTEOPOROSIS ...................................................................................... 6
3        BACKGROUND .......................................................................................................................................................... 8
     3.1 WHAT IS OSTEOPOROSIS?............................................................................................................................................ 8
     3.2 TYPES AND CAUSES OF OSTEOPOROSIS ........................................................................................................................ 8
        3.2.1 Genetics ........................................................................................................................................................... 9
        3.2.2 Age .................................................................................................................................................................. 9
        3.2.3 Lifestyle............................................................................................................................................................ 9
        3.2.4 Hormones......................................................................................................................................................... 9
        3.2.5 Diet ................................................................................................................................................................ 10
        3.2.6 Cigarette smoking .......................................................................................................................................... 10
     3.3 DIAGNOSIS............................................................................................................................................................... 10
     3.4 PREDICTORS OF OSTEOPOROTIC FRACTURES .............................................................................................................. 11
4        BURDEN OF OSTEOPOROSIS: MORBIDITY AND MORBIDITY ..................................................................... 13
     4.1 MORBIDITY: BONE FRACTURES ................................................................................................................................. 13
        4.1.1 The Incidence of osteoporotic fractures in New Zealand.................................................................................. 13
        4.1.2 Incidence of hip fractures from all causes: 2003 to 2005 ................................................................................. 14
        4.1.3 Incidence of fractures in New Zealand: 2007 .................................................................................................. 14
     4.2 BURDEN OF OSTEOPOROSIS AND OSTEOPOROTIC FRACTURES ON QUALITY OF LIFE ....................................................... 16
5        BURDEN OF OSTEOPOROSIS – HEALTH SERVICES USAGE AND COST OF CARE ................................... 18
     5.1 COST OF TREATING OSTEOPOROTIC FRACTURES ....................................................................................................... 18
        5.1.1 Cost of treating hip and vertebral fractures in hospital.................................................................................... 18
        5.1.2 Cost of treating vertebral and other types of fractures outside of hospital ........................................................ 19
     5.2 MEDICAL AND ASSOCIATED COSTS AFTER A FRACTURE ............................................................................................. 20
     5.3 TREATMENT AND MANAGEMENT OF OSTEOPOROSIS .................................................................................................. 22
     5.4 COST OF OTHER CONDITIONS .................................................................................................................................... 23
     5.5 TOTAL COST OF OSTEOPOROSIS ................................................................................................................................ 24
6        BURDEN OF OSTEOPOROTIC FRACTURES: 2007, 2013 AND 2020 ................................................................. 25
     6.1     INCIDENCE OF OSTEOPOROTIC FRACTURES: 2007, 2013 AND 2020 .............................................................................. 25
     6.2     MORTALITY AND MORBIDITY FROM OSTEOPOROTIC FRACTURES: 2007, 2013 AND 2020 .............................................. 26
     6.3     ECONOMIC BURDEN OF OSTEOPOROSIS: 2007, 2013 AND 2020 .................................................................................... 26
7        PREVENTION, TREATMENT AND MANAGEMENT .......................................................................................... 28
     7.1     NUTRITION .............................................................................................................................................................. 28
     7.2     LIFESTYLE ............................................................................................................................................................... 29
     7.3     PHARMACEUTICAL INTERVENTIONS .......................................................................................................................... 29
     7.4     EDUCATION AND COUNSELLING................................................................................................................................ 30
8        CONCLUSIONS AND RECOMMENDATIONS...................................................................................................... 31
     8.1     THE BURDEN OF OSTEOPOROSIS ............................................................................................................................... 31
     8.2     IMPLICATIONS AND RECOMMENDATIONS .................................................................................................................. 32
9        OSTEOPOROSIS NEW ZEALAND – BUILDING A STRONGER FUTURE ....................................................... 33
10       REFERENCES........................................................................................................................................................... 34

                                                                                                                                                                                       2
11 APPENDICES ............................................................................................................................................................ 37
APPENDIX A: POPULATION PROJECTIONS FOR 2007, 2013 AND 2020 ................................................................................... 37
APPENDIX B: METHODOLOGY FOR ESTIMATING THE PREVALENCE OF OSTEOPOROTIC FRACTURES IN NEW ZEALAND ........... 38
APPENDIX C: PROJECTED NUMBER OF OSTEOPOROTIC FRACTURES FOR 2007 ...................................................................... 41
APPENDIX D: METHODOLOGY FOR ESTIMATING THE PREVALENCE OF DIAGNOSED OSTEOPOROSIS ...................................... 45
APPENDIX E: UNIT PRICES AND METHOD FOR DETERMINING HEALTH SERVICES USAGE AND COST ASSOCIATED WITH
OSTEOPOROSIS .................................................................................................................................................................. 46
3LIST OF TABLES
TABLE 1: ESTIMATED NUMBER OF MEN AND WOMEN DIAGNOSED WITH OSTEOPOROSIS IN NEW ZEALAND IN 2007 (FROM NEW
ZEALAND HEALTH SURVEY 2002-2003) ........................................................................................................................ 11
TABLE 2: ANNUAL FEMALE HIP FRACTURE INCIDENCE BETWEEN 2003-05 BY AGE BAND AND ETHNICITY (PER 10,000) .............. 14
TABLE 3: ANNUAL MALE HIP FRACTURE INCIDENCE BETWEEN 2003-05 BY AGE BAND AND ETHNICITY (PER 10,000).................. 14
TABLE 4: TOTAL PROJECTED OSTEOPOROTIC FRACTURE INCIDENCE IN 2007 ............................................................................. 15
TABLE 5: UTILITY ESTIMATES AFTER FRACTURES * ................................................................................................................. 16
TABLE 6: LIFE YEARS LOST DUE TO OSTEOPOROTIC FRACTURES ............................................................................................... 17
TABLE 7: LOST QALYS FROM OSTEOPOROTIC FRACTURES ...................................................................................................... 17
TABLE 8: AVERAGE COST OF HOSPITALISATION - HIP AND VERTEBRAL FRACTURES ................................................................... 19
TABLE 9: HOSPITALISATION COST OF HIP AND VERTEBRAL FRACTURES IN NEW ZEALAND ($NZ2007)....................................... 19
TABLE 10: COST OF TREATING WRIST, FOREARM AND OTHER FRACTURES IN NEW ZEALAND ($NZ2007) ................................... 20
TABLE 11: AVERAGE AMOUNT AND COST OF COMMUNITY SUPPORT *....................................................................................... 21
TABLE 12: COST OF CARE AFTER FRACTURE: COMMUNITY SUPPORT AND RESIDENTIAL CARE .................................................... 22
TABLE 13: TOTAL COST OF CARE AFTER A FRACTURE DUE TO OSTEOPOROSIS............................................................................ 22
TABLE 14: EXPENDITURES ON PHARMACEUTICALS SPECIFIC OR MAINLY USED IN THE TREATMENT OF OSTEOPOROSIS ................ 23
TABLE 15: TOTAL COST OF TREATMENT AND PHARMACEUTICALS TO NEW ZEALAND ................................................................ 23
TABLE 16: PERCENTAGE OF CONDITIONS ATTRIBUTABLE TO OSTEOPOROSIS (TAKEN FROM ACCESS ECONOMICS, 2001) ............. 23
TABLE 17: TOTAL COST OF OSTEOPOROSIS IN NEW ZEALAND .................................................................................................. 24
TABLE 18: TOTAL PROJECTED OSTEOPOROTIC FRACTURE INCIDENCE IN 2007, 2013, 2020* ..................................................... 25
TABLE 19: LIFE YEARS LOST DUE TO OSTEOPOROTIC FRACTURES ............................................................................................. 26
TABLE 20: ESTIMATED QALYS LOST DUE TO OSTEOPOROTIC FRACTURES ................................................................................ 26
TABLE 21: TOTAL COST OF OSTEOPOROSIS 2007, 2013 AND 2020 ............................................................................................. 27
LIST OF FIGURES
FIGURE 1: PROJECTED RESIDENT POPULATION AGED 50+ YEARS IN 2007, 2013 AND 2020 ........................................................... 6
FIGURE 2. DISABILITY-ADJUSTED LIFE YEARS LOST TO OSTEOPOROSIS AND VARIOUS NEOPLASTIC DISORDERS IN EUROPE (TAKEN
FROM JOHNELL AND KANIS, 2006) ................................................................................................................................... 7
FIGURE 3: NORMAL BONE COMPARED TO OSTEOPOROTIC BONE (IMAGE FROM A.D.A.M. INC.).................................................... 8
FIGURE 4: OUTCOME PATHWAYS FOLLOWING VERTEBRAL AND HIP FRACTURES WITH ASSOCIATED PROBABILITIES .................... 21
FIGURE 5: ESTIMATED NUMBER OF OSTEOPOROTIC FRACTURES IN 2007, 2013 & 2020 .............................................................. 25
41 Executive Summary
· Osteoporosis is internationally recognized as a serious health condition in developed countries. The
impact of osteoporosis is far greater than many other high profile conditions, including breast and
prostate cancers.
· Until now the burden has been unknown in New Zealand. Furthermore, because the diagnosis of the
condition is not regularly funded by the Public Health system, has been difficult to estimate.
However estimates of the burden are now showing similarity with other developed countries.
· Many osteoporotic fractures are preventable – essentially “the disease we don’t have to have”. Like
the major epidemics of the past, targeted health interventions now could drastically curb the
incidence of osteoporosis, fractures and morbidity, which in New Zealand currently stands at one hip
fracture every two hours.
· This year about 80,000 New Zealanders will break bones because of osteoporosis, and about three
quarters will be women.
o That is a fracture every 6 minutes, and if nothing is done, this will increase to 120,000 people
by 2020, with a fracture every 41/2 minutes.
· Moreover, osteoporosis is an expensive disease in relative terms. The cost of treating fractures is
estimated to be over $300 million per annum. The total cost is estimated to be over $1.15 billion per
annum in health costs, with a heavy burden on hospitals and nursing homes.
· Osteoporosis costs New Zealanders 12,000 years of life in 2006-07, with over half of these years lost
due to premature death, and the remainder due to the disability burden of the disease.
o More years of life are lost in New Zealand due to osteoporosis than to Parkinson’s disease,
HIV/AIDS, rheumatoid arthritis or cervical cancer.
· Fracture rates due to osteoporosis are comparable with those identified elsewhere, including
Australia, the US and Europe. The international osteoporosis epidemic has become widely
acknowledged, with the International Bone and Joint Decade (2001-10) launched to counter the
burgeoning problems of the disease.
· Most fractures are seen later in life, but the foundations of bone health are laid down in childhood,
adolescence and young adulthood, and so osteoporosis is sometimes referred to as a pediatric
disease.
· If preventative action is taken now, the health burden and financial burden of osteoporosis for New
Zealanders can be significantly reduced in the future.
· In view of the enormous costs and health burden of osteoporosis, it is recommended that:
o The diagnosis of osteoporosis by DXA scan be funded for women over 50 years who have
experienced a low trauma fracture
o Active steps to increase awareness the population and health professionals of the significant
health burden of osteoporosis should be taken without delay, and
o Osteoporosis be adopted by Government as a national public health priority with
commensurate funding.
52 Understanding the burden of osteoporosis
Osteoporosis is a skeletal disease associated with low bone density and disruption of bone architecture.
Although bones naturally lose density and weaken with age, osteoporosis, especially if severe or
accelerated, is seen as a significant issue for the public health system for two reasons. First, osteoporosis is
associated with an increased risk of fractures (particularly fractures of the hip and vertebra), and these
fractures result in significant decrease in quality of life and premature mortality. The impact of fractures can
last for years, and some fractures can lead to premature mortality. Thus, the potential impacts on the health
of those who suffer from osteoporosis make the condition a cause of concern.
Yet in addition to the impact on those who suffer from the condition, osteoporosis is seen as a significant
issue for the public health sector as well. The reason is that as the number of older (50+ years) New
Zealanders increases (Figure 1), so too will the burden of the disease on the public health system. This
makes the condition a cause of concern for all New Zealanders, regardless of whether they suffer from the
condition or not.
Figure 1: Projected resident population aged 50+ years in 2007, 2013 and 2020
1000000
Projected Resident Population Aged 50+ Years
900000
800000
700000
600000
500000 Female
Male
400000
300000
200000
100000
0
2007 2013 2020
Year
International studies have identified osteoporosis as a significant public health issue in most developed
countries. Figure 2, for instance, shows the Disability Adjusted Life Years (DALYs) lost to various
disorders in Europe (Johnell and Kanis, 2006). Osteoporosis ranks between lung cancer and colorectal
cancer in terms of the number of DALYs lost.
The burden of osteoporosis in New Zealand has not previously been quantified. While evidence from other
countries suggests that it is likely to be significant, identifying the burden requires considering factors such
as the age of population and the health services and treatments that are available to the general public. This
report describes the current and future burden of osteoporosis, focusing first on the mortality and morbidity
associated with the condition and then the economic burden on the public health system in New Zealand.
The burden of osteoporosis is reported for 2007 and then projected for 2013 and 2020. As described below,
it is estimated that there will be over 84,000 osteoporotic related fractures in New Zealand in 2007,
including over 3800 hip fractures (the most serious type of osteoporotic fracture). The cost of treating these
fractures is expected to exceed $300 million, with another $33 million spent on treatment and management
of the condition and over $800 million to treat and manage secondary illnesses related to osteoporosis. If
nothing is done, these numbers are expected to increase significantly by 2013 and 2020.
6Figure 2. Disability-adjusted life years lost to osteoporosis and various neoplastic disorders in Europe (taken
from Johnell and Kanis, 2006)
DALY's (000) lost to various neoplastic disorders
Skin 266
Cervix 392
Oesophagus 428
Bladder 438
Uterus 454
Ovary 501
Liver 532
Prostate 541
Oropharynx 582
Pancreas 705
Leukemia 712
Lymphoma 733
Stomach 1352
Breast 1703
Colorectum 1862
Osteoporosis 2006
Lung 3244
0 500 1000 1500 2000 2500 3000 3500
The conclusion that the loss in quality of life and health expense due to osteoporosis will increase in the
future is based on the assumption that New Zealand does nothing to stem the tide. However, the future
impacts are only projections and the good news is that a number of treatments and interventions have been
shown to be effective and cost-effective in treating and preventing fractures due to osteoporosis. Thus, the
burden can be reduced if New Zealanders choose to take steps to combat and stem the condition.
The purpose of this report is therefore to help New Zealanders understand the health and economic burden
of osteoporosis in New Zealand so as to guide decisions about actions that can be taken to diagnose, prevent
and treat the condition. The information in this report describes not only the size of the problem, but also the
potential gains that might be made from taking actions to prevent or reduce the adverse health effects
resulting from osteoporosis.
73 Background
3.1 What is osteoporosis?
Bone is living, growing tissue made mostly of an organic matrix (protein collagen), bone cells and bone
minerals. Bone cells consist of osteoblasts (bone forming cells) and osteoclasts (bone resorption cells)
(WHO, 2003). The bones that form the skeleton of the human body undergo a continuous process of
modelling during childhood and adolescence (Office of the Surgeon General, 2004). The mechanical
competence of the skeleton is maintained by the process of remodelling where osteoclasts remove old bone
which is replaced by new bone formation by osteoblasts (Compston, 2004). Formation of new bones on one
site, and removal of old bone at another site on the same bone, allows for bone growth and repair (Office of
the Surgeon General, 2004). During the first three decades of life there is bone growth, with relative balance
occurring (under normal circumstances) between 20-40 years of age (Compston, 2004).
Peak bone mass, the point at which bones have their maximum strength, is attained at the third decade of
life (Compston, 2004). With higher peak bone mass, the impact of subsequent bone loss is lessened, and
therefore the risk of fracture is reduced (Compston, 2004; Poole & Compston, 2006; WHO, 2003). Bone
mineral density (BMD) is often used as a surrogate measure of bone strength. Bone loss starts to occur
when there is increased bone resorption that is not followed by equivalent bone formation. This bone loss
gives rise to porous bones, or osteoporosis, as shown in Figure 3 (Compston, 2004). Bone loss is often
gradual and without warning signs until the disease is advanced (WHO, 2003). For this reason, osteoporosis
has become known as “the silent thief” (Munch & Shapiro, 2006).
Figure 3: Normal bone compared to osteoporotic bone (Image from A.D.A.M. Inc.)
3.2 Types and causes of osteoporosis
There are three types of osteoporosis, relating to different causal factors:
· Post-menopausa l/Age Associated: Women often develop an accelerated bone loss around
menopause due to reduced oestrogen levels (WHO, 2003). Age associated osteoporosis appears
8with advancing age (Manuele et al., 2007). Most age-associated osteoporosis in women is post-
menopausal, so these types are often not treated as separate.
· Idiopathic: Refers to cases where there is no known aetiological reason identified for osteoporosis
(Manuele et al., 2007).
· Secondary: There are a number of diseases and conditions associated with increased risk of
secondary osteoporosis, including endocrine disorders (e.g., thyrotoxicosis and insulin-dependent
diabetes mellitus), gastrointestinal disorders (e.g., Coeliac disease and Crohn’s disease), metabolic
and nutritional disorders (e.g., Haemophilia and chronic renal disease, anorexia and bulimia),
neoplastic and various other conditions. In addition, a number of common drugs are associated with
increased risk of secondary osteoporosis, including glucocorticosteroids, anticonvulscents,
gonadotrophin-releasing hormone agonists and oestrogen antagonists (e.g., Tamoxifen).
This said, osteoporosis is generally viewed as resulting from a combination of age-related, hormonal,
dietary, lifestyle and genetic factors, all of which can lead to reduced bone mass (Compston, 2004).
3.2.1 Genetics
Some of the variability in bone mineral density may also be genetically determined. Evidence of this comes
from the fact that a family history of fragility fracture is strongly associated with fracture risk (WHO, 2003).
Populations with higher body weights also have higher bone mineral density. This is particularly relevant in
New Zealand, where Maori and Pacific peoples tend to have greater bone density than people of European
origin. The prevalence of osteoporotic fractures in immigrant populations (including Asian populations in
New Zealand) tends toward that of the host nation, suggestion a strong influence of lifestyle.
3.2.2 Age
Peak bone mass is one of the main determinants of fracture risk due to osteoporosis later in life (WHO,
2003). Bones become larger, heavier and denser, until peak bone mass is reached in our third decade (20 to
30 years of age) of life (Compston, 2004). After that, resorption begins to exceed formation, and bones
gradually lose their strength. With lower peak bone mass there will be an increased risk of osteoporotic
fractures from this natural age-related loss of bone mass (WHO, 2003). This also means that the longer we
live, the more likely we are to have an osteoporotic fracture, regardless of peak bone mass.
3.2.3 Lifestyle
Lack of physical activity, and particularly weight-bearing resistance-training, is another important
determinant of bone loss (WHO, 2003). For example, patients confined to bed and astronauts under
weightless conditions lose as much as one percent of their trabecular bone per week (Cummings, Kelsey,
Nevitt, & O'Dowd, 1985). Studies comparing athletes with normal controls have also shown that athletes
have a higher bone mineral density than non-athletes (Cummings, Kelsey, Nevitt, & O'Dowd, 1985; WHO,
2003).
3.2.4 Hormones
Osteoporosis is three times more common in women than in men (WHO, 2003), partly due to oestrogen
deficiency that accelerates bone turnover during menopause. Women lose bone density two to four times
faster after menopause than before, so that some women have lost half their skeletal mass by age 65. Early
or surgically induced menopause or amenorrhea increases the risks of osteoporotic fractures, as do
decreases in oestrogen resulting from anorexia nervosa or exercise induced amenorrhea (WHO, 2003).
Male hypogonadism, manifested by a decrease in testosterone levels, contributes to the development of
osteoporosis in males in their later years. Declines in testosterone with age occur more slowly in men than
9the sharper decrease in oestrogen at menopause. This combined with a higher peak bone mass and shorter
life expectancy are contributing factors to a lower rate of osteoporosis presentation in men (Levy et al.,
2002; WHO, 2003).
Other hormonal events or conditions that increase the risk of osteoporosis are thyroid conditions and
conditions that increase glucocorticoid levels. Primary hyperparathyroidism and hyperthyroidism increase
the rate of bone turnover, whereas glucocorticoids reduce bone formation (WHO, 2003).
3.2.5 Diet
Bone is constructed mainly of calcium and phosphate deposited in a matrix of protein (Cummings, Kelsey,
Nevitt, & O'Dowd, 1985). Almost all of the body’s calcium is present in the bones and teeth (WHO, 2003).
Adequate calcium balance depends on dietary intake, absorption and excretion. Inadequate calcium intake
or calcium absorption is a major risk factor for osteoporosis (Cummings, Kelsey, Nevitt, & O'Dowd, 1985).
With age, calcium intake falls (on average to about half that of RDI for those older than 60) and the ability
to adapt to a low calcium diet and calcium absorption are decreased.
Vitamin D deficiency also results in bone loss (WHO, 2003). Vitamin D is produced in the skin on exposure
to ultraviolet rays. The efficiency of this process is reduced with age, skin pigmentation and extensive use
of sunscreens applied to the skin and reduced exposure to sunlight (WHO, 2003). There are reports of
increasing vitamin D deficiency in many population groups. Some of these groups are represented in New
Zealand, including those suffering reduced Vitamin D due to reduced ultraviolet exposure in Southern
latitudes and in certain ethnic groups.
3.2.6 Cigarette smoking
Smoking reduces bone mineral density (WHO, 2003), with bone density diminishing by 2% for each 10
year increase in age in smoking women. For instance, by 80 years of age, women who smoke will have 6%
less bone density than women who do not smoke (Law & Hackshaw, 1997).
3.3 Diagnosis
Osteoporosis results in lower bone density and disruption of bone architecture. It is usually diagnosed
through the measurement of bone mineral density. Although there are several ways to measure bone
density, the recommended approach is through a single or dual energy X-ray absorptiometry (SXA and
DXA scans). These scans examine the bone mineral content by the area or volume measured. SXA is used
in measuring bone mineral density at appendicular sites such as heel and wrist. DXA measures bone mineral
density at other sites such as the spine and hip.
Bone mineral density decreases with age. All individuals can expect a loss of BMD as they get older. Thus,
a reduction in bone mineral density alone is not sufficient to diagnose an individual as having osteoporosis.
Traditionally, this determination is made using the World Health Organisation’s definition of osteoporosis -
bone mineral density at the time of diagnosis that is 2.5 or more standard deviations below the normal ‘age-
matched’ peak bone mass (WHO, 2003). The determination of the normal peak bone mass is derived from
the measurement of a representative sample of men or women aged 20-29 years, meaning that the diagnosis
is made by comparing loss of bone mineral density to this criterion.
The New Zealand Health Survey (2002/03) asked people whether they had been told by a doctor that they
had osteoporosis. As shown in Table 1, it is estimated that approximately 70,000 people 50+ years are
diagnosed with osteoporosis in 2007, almost 90% of them being female. Approximately 20,000 diagnoses
are associated with a fracture, but another 50,000 had their diagnoses initiated through other means. Some
10(though probably not all) would have had the diagnosis confirmed by DXA scan, though the precise number
is difficult to estimate. (See Appendix B for a description of the methodology).
In New Zealand, diagnosis of osteoporosis is usually made using DXA scans. Many individuals who may
have osteoporosis are not investigated for and therefore cannot be diagnosed as having osteoporosis. . For
every person who is diagnosed there are an unknown number of people at risk for osteoporotic fractures
who remain undiagnosed.
Table 1: Estimated number of men and women diagnosed with osteoporosis in New Zealand in 2007 (from New
Zealand Health Survey 2002-2003)
Men 50–54 55–59 60–64 65–69 70–74 75–79 80–84 85 + TOTAL
Diagnosed
903 1046 9 1082 407 11 0 474 3932
by fracture
Diagnosed
467 1363 982 12 0 1255 1100 273 5452
other
Diagnosed 1370 2409 991 1094 407 1266 1100 747 9384
Women 50–54 55–59 60–64 65–69 70–74 75–79 80–84 85 + TOTAL
Diagnosed
1175 1100 3285 1458 2749 1907 1284 2498 15456
by fracture
Diagnosed
3662 5043 5269 5110 7472 6532 8159 4544 45791
other
Diagnosed 4837 6143 8554 6568 10221 8439 9443 7042 61247
TOTAL 50–54 55–59 60–64 65–69 70–74 75–79 80–84 85 + TOTAL
Diagnosed
2078 2146 3294 2540 3156 1918 1284 2972 19388
by fracture
Diagnosed
4129 6406 6251 5122 7472 7787 9259 4817 51243
other
Diagnosed 6207 8552 9545 7662 10628 9705 10543 7789 70,631
3.4 Predictors of osteoporotic fractures
The primary cause of mortality and morbidity associated with loss of bone density results from the
increased likelihood of fractures, and there are numerous other risk factors associated with fractures,
including (Melton, 2000):
· Age
· Previous fractures
· Self-rated health
· Smoker
· Weight gain since age 25 (protective)
· Height
· Socioeconomic status
However, BMD is the most significant single risk factor in predicting the likelihood of osteoporotic
fractures (although many fractures occur in those who have normal BMD especially at menopause). The
risk of fractures increases with any BMD loss. For instance, the risk of a hip fracture increases 2.6 fold with
each standard deviation decrease in bone mineral density, and the risk of other types of fractures increases
by 1.6 fold for each standard deviation decrease (Johnell et al., 2005; Marshall, Johnell, & Wedel, 1996).
11As the risk of fractures increases with any BMD loss and continues to increase past the point of 2.5 standard
deviations below peek BMD (the WHO definition of osteoporosis), there is some debate over the usefulness
of the defining ’osteoporosis’ as a condition. According to this view, bone loss and bone density are
important factors, but the focus should be on the increased risk associated with any bone loss, not just the
bone loss that is 2.5 standard deviations below an average (Johnell et al., 2005; Marshall, Johnell, & Wedel,
1996; Richards et al., 2007; Schuit et al., 2004). Interventions to reduce fractures should include all the
factors that predict fractures, not just those related to osteoporosis.
Despite this, the WHO’s definition of osteoporosis is still useful. The point of 2.5 standard deviations does
represent a point at which there is a significantly increased risk of fracture. Thus, an individual meeting the
criterion of osteoporosis runs a significant risk of suffering a fracture. It is important for individuals to
understand their condition and health status so that they can take actions to reduce their chance of suffering
a fracture. The diagnosis conveys information about the extent of their risk. The definition is also useful for
health funders and decision makers who require a measure of the extent of the problem when prioritising
health spending.
124 Burden of osteoporosis: Morbidity and morbidity
4.1 Morbidity: Bone fractures
As stated above, the main burden of osteoporosis results from fractures due to reduced bone mineral density
and other risk factors (WHO, 2003). For instance, a longitudinal study of an elderly population (60 years old
and above) showed that 1 in 2 women and 1 in 3 men will sustain an osteoporotic fracture at some point in
their lives (Jones et al., 1994). After one vertebral fracture, the risk of another fracture within 12 months
increases over four fold (Osteoporosis Australia, 2001). There is also a large increase in fracture risk after
the first hip fracture.
From middle-age onwards, osteoporotic fractures cause increasingly significant morbidity since
musculoskeletal damage is more likely to result in long term disability. The most commonly occurring
osteoporotic fractures occur in the hip, spine and forearm (Kanis et al., 2001). Although all types of
fractures are associated with significant pain and loss of quality of life (Rabenda et al., 2007), hip fractures
result in the most serious disabilities (Pasco et al., 2005; Taylor et al., 2004). An estimated 50% of
individuals require long-term care after a hip fracture (Osteoporosis Australia, 2001) and hip fractures often
lead to an earlier death (approximately 25% of people suffering from a hip fracture dying within 12 months
of sustaining a fracture; Kanis et al., 2003). For those who live, fractures can result in a loss of function,
consistent pain and deformity. It also leads to reduced activity levels due to fear of suffering another
fracture. This can lead to significant psychological issues among people with osteoporosis (Gold &
Solimeo, 2006). There is also evidence that all fractures are associated with increased mortality
(Pongchaiyakul et al., 2005).
4.1.1 The Incidence of osteoporotic fractures in New Zealand
There are two challenges faced when estimating the number of fractures due to osteoporosis in New
Zealand.
1. The under-diagnosis of osteoporotic fractures. The diagnosis of osteoporosis can be an expensive
and time consuming process. As a result, a formal diagnosis of osteoporosis is often not conducted,
meaning it is difficult to ascertain from hospital or primary care records alone whether osteoporosis
was a contributing factor to the fracture. Another commonly omitted contributory factor for fracture
is the severity and/or nature of the force that lead to the fractures (e.g., fracture resulting from a trip
from less than standing height might indicate a fragility fracture). This can make it difficult to
discern whether osteoporosis was a contributing factor.
2. The under-reporting of fractures. The major source of information on fractures in New Zealand
comes from the National Minimum Data Set (discharge records from all events in public hospitals).
While some types of fractures, such as hip fractures, nearly always result in hospitalisations, many
other fractures may be left un-treated or be treated in a primary care or A&E clinic. Basing incidence
estimates on recorded hospitalised fractures can significantly under estimate the prevalence of
osteoporotic fractures.
This report overcomes these obstacles using a methodology employed elsewhere to extrapolate the number
of all common osteoporotic fractures (e.g., (Johnell & Kanis, 2006).
Hip fractures nearly always result in a hospitalisation and therefore represent a relatively accurate estimate
of the number of this type of fracture, the incidence of hip fractures between 2003 and 2005 was taken from
the National Minimum Data Set (NMDS). This was then used to estimate the number of hip fractures per
10,000 of the population (by age and ethnicity) in New Zealand. This information was then combined with
NZ Census information (including projections by age, gender and ethnicity) to get the expected number of
13hip fractures in 2007, 2013 and 2020. The number of other types of fractures was then estimated using
information from previous studies (Kanis, Oden et al, 2001) on the ratio of hip fractures to other types of
osteoporosis fractures. This provided an estimate of the number of all common types of osteoporotic
fractures in each age group.
This methodology assumes that the relationship between hip fractures and other fractures is the same in
New Zealand as in other countries, without any adjustments for a different lifestyle (although it does
account for ethnicity, age and gender). Details of the methodology are provided in Appendix B.
4.1.2 Incidence of hip fractures from all causes: 2003 to 2005
Table 2 and Table 3 show the annual hip fracture incidence (per 10,000 people) for females and males
respectively, between the years 2003 and 2005. The results show that hip fracture rates increase with age
and are much more common in people of European origin. On average the fracture rates for Europeans were
approximately 30% higher than for Maori, Pacific and Asian peoples. The results also show that the fracture
rates for females were approximately 70% higher than for males. It should be noted that cohort group effect
and small numbers of hip fractures in some age bands may be a potent confounder for ethnic minorities and
the very old.
Table 2: Annual Female hip fracture incidence between 2003-05 by age band and ethnicity (per 10,000)
Age Group European Maori Pacific Asian
50-54 1.19 1.58 0.64 1.06
55-59 3.28 2.15 3.31 2.19
60-64 5.81 7.18 4.55 3.85
65-69 12.11 8.18 2.90 9.62
70-74 27.76 14.02 20.83 20.29
75-79 65.43 39.06 34.38 44.74
80-84 132.80 84.85 70.59 109.52
85-89 242.44 153.33 150.00 150.00
90+ 359.16 200.00 100.00 250.00
Table 3: Annual Male hip fracture incidence between 2003-05 by age band and ethnicity (per 10,000)
Age Group European Maori Pacific Asian
50-54 1.99 1.39 1.28 1.53
55-59 3.95 3.05 1.72 0.00
60-64 4.39 7.14 3.61 0.84
65-69 8.11 8.39 10.34 5.94
70-74 15.52 12.09 21.05 9.38
75-79 35.73 22.92 13.64 25.00
80-84 82.30 60.00 33.33 50.00
85-89 158.21 66.67 66.67 100.00
90+ 264.12 100.00 * 33.33
*No fractures reported in this age group
4.1.3 Incidence of fractures in New Zealand: 2007
Combining the information provided in Tables 2 and 3 with information on the projected population in New
Zealand (by age and ethnicity) in 2007 provides an estimate of the number of hip fractures that can be
expected in New Zealand in 2007. As in previous studies (e.g., Jones, et al, 1994; Kanis et al, 2000; Kanis,
14Oden et al, 2001), it is assumed that all hip fractures in this age group are attributable to osteoporosis. While
this approach has been recognised as creating a slight upward bias in the number of hip fractures for
younger ages, it is thought to balance out by missing some hip fractures in older individuals (especially
those in residential care) that are not diagnosed or are not referred to hospital (e.g., remain in a residential
care facility). Using this approach, there are estimated to be 3803 osteoporotic hip fractures in New Zealand
in 2007 (Table 4).
Identifying the number of other types of fractures due to osteoporosis is more problematic because of
underreporting and misdiagnosing. As described in Appendix B, the approach used here follows that used in
previous studies (e.g., Kanis, Oden et al, 2001), namely using the ratio of osteoporotic hip fractures to other
osteoporotic fractures receiving treatment to estimate the number of osteoporotic fractures receiving
treatment in hospitals in New Zealand, and using the estimates from previous studies of the number of
vertebral and other types of osteoporotic fractures (e.g., ribs, wrist and forearm) receiving treatment to
estimate the total number of osteoporotic fractures in New Zealand in 2007. For instance, Kanis, Oden et al
(2001) estimate the ratio of osteoporotic rib fractures receiving treatment to osteoporotic hip fractures to be
1.72 , suggesting that there are approximately 3780 osteoporotic rib fractures receiving treatment each year.
However, it is estimated that only 18% of all osteoporotic rib fractures present to hospital, meaning that
there is an estimated 21000 rib fractures in New Zealand in 2007 (see Appendix C).
The estimated total number of osteoporotic fractures is show in Table 4. In all, there will be approximately
84,354 osteoporotic fractures in New Zealand in 2007. As shown in Appendix B, only 5% of the total
fractures are hip fractures, with vertebral (33%), rib (25%) and forearm (14%) being the most common type
of fractures. 60% of the fractures will happen to women.
Table 4: Total projected osteoporotic fracture incidence in 2007
Men 50–54 55–59 60–64 65–69 70–74 75–79 80–84 85 + TOTAL
Hip 29 46 45 68 95 173 266 384 1106
Vertebra 1687 1001 953 751 1191 1429 1616 1775 10405
Other 2513 4192 1411 2048 1604 1654 3506 3476 20406
TOTAL 4229 5239 2410 2867 2890 3257 5389 5636 31917
Women 50–54 55–59 60–64 65–69 70–74 75–79 80–84 85 + TOTAL
Hip 17 41 62 103 179 382 624 1289 2697
Vertebra 865 888 1304 1458 2128 3140 2693 5114 17590
Other 2059 2486 2101 2727 2780 4557 4759 10681 32151
TOTAL 2941 3415 3467 4288 5086 8079 8077 17084 52437
TOTAL 50–54 55–59 60–64 65–69 70–74 75–79 80–84 85 + TOTAL
Hip 46 87 107 171 274 555 890 1673 3803
Vertebra 2552 1890 2258 2209 3319 4569 4309 6889 27994
Other 4572 6678 3512 4775 4384 6212 8266 14157 52556
TOTAL 7170 8654 5877 7155 7977 11336 13465 22720 84354
The projected number of osteoporotic fractures by ethnicity in New Zealand is shown in Appendix B. NZ
European’s constitute nearly 92% of all fractures, due both to the high life expectancy (particularly among
women) and the higher presumed incidence of osteoporosis. Fractures in Maori people constitute 4% of the
total, with fractures in Pacific and Asian people constituting the remaining 4% of the total number of
fractures.
154.2 Burden of osteoporosis and osteoporotic fractures on quality of life
Osteoporotic fractures lead to a significant reduction in quality of life. While there are many measures of
quality of life, a measure that is commonly used in health funding decisions is Quality Adjusted Life Years
(QALYS). QALYs consist of two parts:
1. a measure of the individual’s quality of life (utility state) given their health status (e.g., fracture)
2. The number of years they are in that utility state.
Utility states range from 0 (representing death) to 1 (representing full health). Reductions in QALY can
therefore be interpreted as the number of life years lost due to osteoporosis adjusted for the reduced health
state of the individuals after the fracture.
The utility states following an osteoporotic fracture are shown in Table 5 (adapted from Zethraeus et al,
2007). Two caveats to note. First, the results report only the utility losses due to hip fractures and vertebral
fractures that require hospitalisation. This is not to imply that the other types of fractures do not result in
reductions in utility, but rather that the reductions tend to be of a short duration relative to the more serious
fractures. Second, the utility losses are only for fractures and not for those living with osteoporosis with or
without complications. There is little information available on the utility losses for those suffering from
osteoporosis. The result of both these caveats is to underestimate the true utility loss due to osteoporosis. As
such, the numbers reported below should be seen as indicative only.
The first line of Table 5 shows the average utility for individuals by age. The difference between the utility
state after a hip or vertebral fracture and the well utility state is therefore the reduction in utility due to the
fracture. Not surprisingly, hip fractures are associated with the largest drop in utility; an average of 20
points relative to the well state utility. The utility loss after a vertebral fracture varies slightly with age, from
a 10 point drop for younger ages to a six point drop in later age groups.
Table 5: Utility estimates after fractures *
50–54 55–59 60–64 65–69 70–74 75–79 80-84 85 +
Well 0.94 0.90 0.86 0.83 0.79 0.71 0.63 0.55
Hip fracture 0.74 0.70 0.66 0.63 0.59 0.51 0.43 0.35
Vertebral fracture 0.84 0.81 0.77 0.74 0.71 0.64 0.57 0.50
(* Adapted from Zethraeus et al, 2007)
The number of QALYs lost can be calculated by combining the lost utility with the number of life years lost
due to osteoporotic fractures. Center et al (1999) reported the lost life years due to different type of fractures
by comparing life expectancy of a sample of the general population with people who had suffered a hip
fracture or other major fracture (including a major vertebral fracture). The life years and difference in life
expectancy are shown in Table 6 (adapted from Center, Nguyen, Schneider, Sambrook, & Eisman, 1999).
16Table 6: Life years lost due to osteoporotic fractures
MEN 50–54 55–59 60–64 65–69 70–74 75–79 80-84 85 + TOTAL
Hip -510 -666 -519 -574 -512 -798 -399 -379 -4357
Vertebra -1512 -693 -465 -213 -95 -126 -181 -241 -3527
TOTAL -2022 -1359 -984 -788 -607 -924 -580 -620 -7884
WOMEN 50–54 55–59 60–64 65–69 70–74 75–79 80–84 85 + TOTAL
Hip -367 -670 -694 -619 -786 -458 -250 -328 -4172
Vertebra -159 -149 -198 -198 -204 -126 -86 -123 -1244
TOTAL -526 -819 -892 -817 -991 -584 -336 -451 -5416
TOTAL 50–54 55–59 60–64 65–69 70–74 75–79 80–84 85 + TOTAL
Hip -878 -1336 -1212 -1193 -1298 -1256 -648 -707 -8529
Vertebra -1671 -842 -663 -411 -300 -251 -267 -364 -4770
TOTAL -2548 -2178 -1876 -1605 -1598 -1508 -916 -1071 -13299
Combining the information from Tables 5 and 6 with the number of osteoporotic fractures in New Zealand
Table 4 provides an estimate of the number of QALYs lost in a given year due to osteoporotic fractures in
New Zealand.
The results suggest that in 2007, the number of QALYs lost due to osteoporotic fractures in New Zealand is
expected to be nearly 2,100 per year (Table 7). There are more life years lost for males (1,175) than females
(935) due to the differing pattern and timing of fractures and the difference in life expectancy. As discussed
below, QALYs can be used when evaluating and prioritising interventions to reduce the burden of
osteoporosis.
Table 7: Lost QALYs from osteoporotic fractures
MEN 50–54 55–59 60–64 65–69 70–74 75–79 80-84 85 + TOTAL
Hip -102 -133 -104 -115 -102 -160 -80 -76 -871
Vertebra -141 -62 -42 -19 -8 -9 -11 -12 -304
TOTAL -243 -196 -146 -134 -110 -168 -91 -88 -1175
WOMEN 50–54 55–59 60–64 65–69 70–74 75–79 80–84 85 + TOTAL
Hip -73 -134 -139 -124 -157 -92 -50 -66 -834
Vertebra -15 -13 -18 -18 -16 -9 -5 -6 -100
TOTAL -88 -147 -157 -142 -174 -100 -55 -72 -935
TOTAL 50–54 55–59 60–64 65–69 70–74 75–79 80–84 85 + TOTAL
Hip -176 -267 -242 -239 -260 -251 -130 -141 -1706
Vertebra -156 -76 -60 -37 -24 -18 -16 -18 -404
TOTAL -331 -343 -302 -276 -284 -269 -146 -160 -2110
175 Burden of osteoporosis – Health services usage and cost of care
There are a number of different types of resources to consider when assessing the cost of osteoporosis,
including:
· Direct cost of treating fractures that result in a hospitalisation (including acute treatment,
rehabilitation and outpatient visits);
· Direct cost of treating fractures that do not result in a hospitalisation (such as GPs and A&E clinics);
· Medical and non-medical costs after a fracture;
· Cost of management for people diagnosed with osteoporosis; and
· Costs of treating other conditions for which osteoporosis is a contributing factor.
These are not the full range of resources associated with treating, detecting and caring for people with
osteoporosis. Not included are the time and energy expended in caring for people with fractures, loss of
productivity and other indirect costs. These are likely to be significant since osteoporotic fractures can place
a significant burden to informal caregivers. However, there is little information available to help quantify
the burden on caregivers, nor is there information on the lost opportunities that people with osteoporosis
suffer as a result of their condition or fracture.
The costs shown below do reflect the majority of resources expended by the public health system to detect
and treat conditions relating to osteoporosis. Understanding the magnitude of the costs is particularly
relevant for health planning since it provides an indication of the resources expended (and therefore the
potential savings) from interventions aimed at reducing the burden of osteoporosis.
The relationship between osteoporosis and a number of other conditions is only now being recognised. This
includes some conditions that are attributable to other conditions (e.g., back pain) but are really the result
from osteoporotic fractures (e.g., vertebral fractures). This misdiagnosis can lead to significant expenditure
of health care resources. But osteoporosis is also a risk factor for many common conditions, with the
increased severity of those conditions being related to the increased severity of osteoporosis. Although the
resources associated with these conditions are difficult to identify, previous studies (Access, 2005) have
estimated the relationship between the expenditures on osteoporotic fractures and these other conditions.
The estimated costs are described below.
The goal is to identify the financial burden associated with osteoporosis. The financial burden refers to the
additional or marginal cost associated with the condition, not the total cost associated with treating and
caring for people with osteoporosis. A prevalence approach is taken in that the costs represent the total cost
to New Zealand in a given year (valued in 2007 New Zealand dollars). A list of the unit prices and other
information relating to the estimated use of health services are described in Appendix E.
5.1 Cost of Treating Osteoporotic Fractures
5.1.1 Cost of treating hip and vertebral fractures in hospital
Hip fractures are the most resource intensive type of osteoporotic fracture, with hospital stays in New
Zealand averaging nearly 14 days in acute wards. Approximately 70% of those suffering hip fractures will
be admitted to a rehabilitation ward, with the average stay being an additional 22 days.
Finally, it is estimated that 50% of those with hip fractures will receive outpatient visits after care is
concluded. In all, the average cost of treating a hip fracture is estimated to be nearly $24,000 per person
(Table 8).
18Table 8: Average cost of hospitalisation - hip and vertebral fractures
Hospitalisation Rehabilitation Outpatient
Length of Length of Average Prob. of Total
stay stay Prob. of number Cost outpatient Cost of
(days) Cost (days) Cost Rehab of visits visit hosp.
Hip 13.9 $14,937 22 $12,062 70% 2.4 $955 50% $23,859
Vertebra 11.3 $12,131 1.6 $637 50% $12,450
For those who are hospitalised due to a vertebral fracture, the average length of stay in hospital is
approximately 11 days. They typically do not receive rehabilitation as a separate inpatient event, but may
receive outpatient visits. The estimated cost of the hospitalisation event for a vertebral fracture is $12,450.
As mentioned above, because of their severity, it is assumed that all hip fractures result in a hospitalisation.
The evidence suggests that the number of vertebral fractures that go undetected is significantly higher, with
some studies reporting that only 8% of these fractures result in hospitalisations and many go completely
undiagnosed (or misdiagnosed) (Finnern & Sykes, 2003).The best estimate for the number of vertebral
fractures resulting from osteoporosis that require hospitalisation in New Zealand is 8%.
Combining the cost of treatment with the probability of receiving treatment and the number of fractures
implies that the cost of treating hip and vertebral fractures in New Zealand hospitals is $118 million per year
(see Table 9).
Table 9: Hospitalisation cost of hip and vertebral fractures in New Zealand ($NZ2007)
Probability of
Expected cost
Number of cases cases requiring Total Cost to NZ
per case
hospital stay
Hip $23,859 3803 100% $90,748,983
Vertebra $12,450 27994 8% $27,881,511
TOTAL COST $118,630,494
5.1.2 Cost of treating vertebral and other types of fractures outside of hospital
Some fractures to the wrist, forearm or other sites will be treated in hospital. For instance, patients
hospitalised with a fractured tibia have an average length of stay of 3.3 days in hospital and experience
several weeks of moderate disability. However, most fractures to the wrist, forearm or other sites will not
result in hospitalisation stay but rather be seen in primary care or by the other health professionals. Yet
treatment for these patients is still costly, requiring multiple visits to health providers, imaging and
diagnostic procedures and medications to control pain and discomfort.
There is little information on the cost of treating other fractures or vertebral fractures that do not require
hospitalisation. However, previous studies (e.g., Dolan, P., & Torgerson; 1998), applied an average cost of
treatment across all common other fractures (including those requiring hospitalisation and those that do
not). For the purposes of this study, it was assumed that the average cost of fractures other than vertebral or
hip treated in hospital was $2,191 per fracture. However, based on previous studies, it is estimated that only
70% of the other fractures will be treated (with the others being left untreated), and only 22% of the
remaining vertebral fractures being correctly identified and treated as a fracture (see Appendix E for more
detail).
19Using this estimate, the expected cost of treating wrist, forearm and other similar types of fractures in New
Zealand is over $94 million per year (Table 10).
Table 10: Cost of treating wrist, forearm and other fractures in New Zealand ($NZ2007)
Expected cost Probability
per treated Number of of being
case cases treated Total Cost to NZ
Other fractures $2,191 52556 70% $80,605,724
Vertebral
fractures $2,191 27994 22% $13,493,815
TOTAL COST $94,099,539
5.2 Medical and Associated Costs after a fracture
People with osteoporosis can suffer fractures while living in the community, in a residential facility or
private hospital or in a public hospital. In order to identify the costs associated with osteoporotic fractures
after leaving a hospital or receiving care, it is important to identify where people were living before their
fractures and what happened to them after the fracture. Most fractures resulting from osteoporosis do not
result in a change in residence.
For instance, as shown in Table 4, 53% of those suffering a hip fracture will be in residential care or a
private hospital at the time of the incident and 47% out in the community. After the fracture, 61% will be
discharged to a residential facility, suggesting that for 8% of people the hip fracture will be the reason for
their admission to a residential facility.
For those suffering a vertebral fracture who are hospitalised, 62% will be in the community prior to the
incident, and 58% will return to the community after hospitalisation. The remaining 42% will go to a
residential facility, implying that 4% of those hospitalised will be admitted to a residential facility for the
first time as a result of their fracture.
Finally, those suffering vertebral fractures not requiring hospitalisation or fractures of other types are not
expected to change their place of residence as a result of the fracture. Those who were in a residential
facility are likely to remain in the facility and those living in the community are likely to remain there.
People returning home after a fracture are likely to receive a variety of community services such as meals
on wheels, home help and visits by a District Nurse during their recovery. Previous studies suggest that the
percentage of people receiving the care depends upon the type of fractures (more services are made
available to those with hip fractures than with other types), with the number of visits or services depending
on a variety of factors.
Extrapolating these findings to New Zealand would suggest that:
· After a hip fracture, 22% of people will receive nursing services, 49% physiotherapy and 16%
meals on wheels. Most will attend an orthopaedic clinic.
· For those who suffer a vertebral fracture, 16% can be expected to receive physiotherapy, 23% will
receive home help and 9% will receive meals on wheels (Table 11).
Overall, the expected cost of care for someone with a hip fracture who returned to the community is $1,381
in the year following the fracture.
20You can also read