Horizon 2020 Mediterranean report - Annex 4: Morocco EEA Technical report No 6/2014
←
→
Page content transcription
If your browser does not render page correctly, please read the page content below
EEA Technical report   No 6/2014

Horizon 2020 Mediterranean report
                          Annex 4: Morocco

                                  ISSN 1725-2237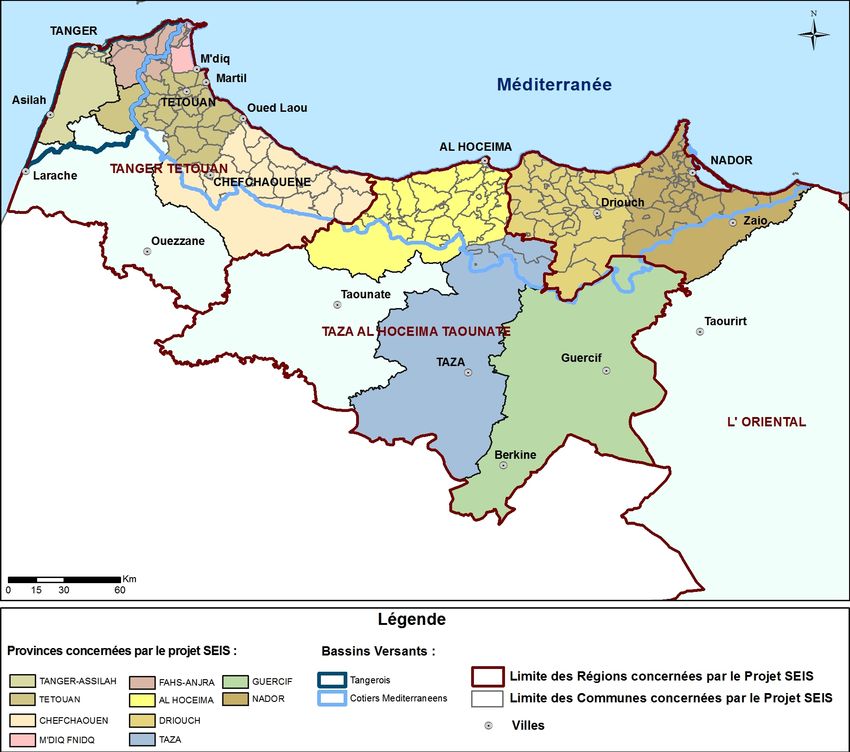
Cover design: EEA
Cover photo © MaslennikovUppsala (istockphoto)
Layout: EEA/Pia Schmidt

Legal notice
The contents of this publication do not necessarily reflect the official opinions of the European Commission
or other institutions of the European Union. Neither the European Environment Agency nor any person or
company acting on behalf of the Agency is responsible for the use that may be made of the information
contained in this report.

Copyright notice
© European Environment Agency, 2014
Reproduction is authorised, provided the source is acknowledged, save where otherwise stated.

Information about the European Union is available on the Internet. It can be accessed through the Europa
server (www.europa.eu).

Luxembourg: Publications Office of the European Union, 2014

 REG.NO. DK- 000244

European Environment Agency
Kongens Nytorv 6
1050 Copenhagen K
Denmark
Tel.: +45 33 36 71 00
Fax: +45 33 36 71 99
Web: eea.europa.eu
Enquiries: eea.europa.eu/enquiries
Annex 4: Morocco

Contents

Introduction................................................................................................................ 4

Overview of the area under study............................................................................... 5

Priority areas.............................................................................................................. 8
   Municipal waste........................................................................................................ 8
   Wastewater and sanitation........................................................................................13
   Industrial emissions.................................................................................................17

National profile......................................................................................................... 23
  Introduction............................................................................................................23
  Environmental governance........................................................................................23
  Natural features......................................................................................................24
  Socio-demographic characteristics..............................................................................26
  Socio-economic activities and pressures on the environment	����������������������������������������26
  Outlook for the environment and sustainable development	�������������������������������������������27

Specific thematic area............................................................................................... 28
  Cleaning up the Marchica Lagoon...............................................................................28

Bibliography.............................................................................................................. 30

Acronyms.................................................................................................................. 31

Annex A4.1 Population changes in the 41 towns and cities situated
            in the area under study.......................................................................... 32

Annex A4.2 Maps showing surface-water quality in the area under study................. 34

                                                                               Horizon 2020 Mediterranean report                 3
Annex 4: Morocco

    Introduction

    Several business sectors in the area under study        state of the environment and how it is changing in
    have undergone significant development over             the area under study, and present a clear idea of
    the past few decades, most notably the industrial,      the origin of the pressures generated. It will also
    tourism and construction sectors. This development      highlight progress that has already been made,
    has been accompanied by a number of major               and describe the political initiatives taken in each
    infrastructure projects in the area's ports and         of the areas concerned. The analysis contained in
    industrial zones, and also on its road and railway      this report is based on available data collated in the
    networks.                                               context of this project or of other projects carried out
                                                            at regional or national scale.
    However, this development has also had an
    environmental impact on the area. Pressures             This paper is based on the analysis of a set
    have been placed on the area's resources and            of indicators identified as part of the Shared
    natural environment owing to improper waste             Environmental Information System (SEIS) project.
    management practices: this has resulted in liquids      They describe, as far as possible, the impact that
    (generated by both houses and industrial facilities)    socio-economic activities have on resources and
    being emitted into the water cycle, without having      the natural environment. They are based on the
    been pretreated. These improper practices are one       Driving forces, Pressures, State, Impacts and
    of the main reasons for the worsening state of the      Responses (DPSIR) framework, which makes it
    area's natural heritage and the increasingly poorer     possible to analyse the cause–effect relationships
    health and hygiene conditions suffered by its           that exist between the various factors that impact the
    inhabitants.                                            environment.

    This report, which forms Morocco's contribution         This document is the culmination of a group
    to the Horizon 2020 initiative, aims to analyse the     effort: every member of the steering committee of
    country's current environmental situation and future    the national SEIS project has contributed, in close
    prospects for the three priority areas covered by the   collaboration with representatives of the various
    initiative. It will provide an understanding of the     local parties involved.

4   Horizon 2020 Mediterranean report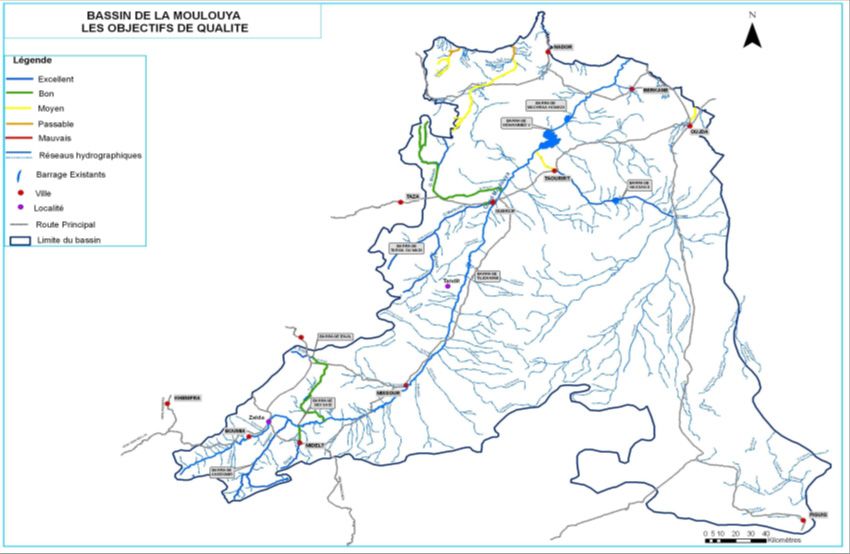
Annex 4: Morocco
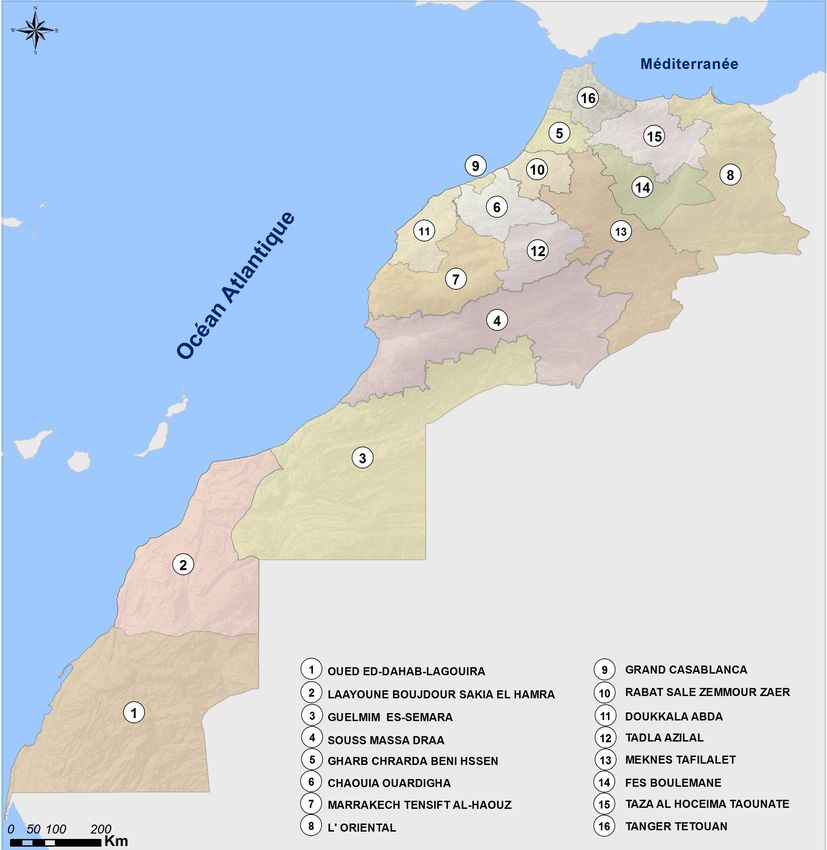
Overview of the area under study
The area under study in this assessment covers contains 41 sites of biological and ecological interest
regions located in the Mediterranean river basin as (SBEIs), as well as several national parks, most
follow: notably those at Talassemtane and Al Hoceima.
• The basin of the Moulouya River, covering 8 % The prefectures and provinces shown in Table A4.1
of the entire country (74 000 km²) and spanning are either wholly or partially covered by this
4 economic regions (1) and 9 provinces and assessment.
prefectures (2). In the 2004 General Population
and Housing Census (GPHC), the basin's The combined total population of these prefectures
population stood at around 2.5 million, with and provinces increased from 4.16 million in 2004
54 % living in towns and cities. The Moulouya to almost 4.53 million in 2011. This population
rises in the High Atlas and Middle Atlas ranges accounts for 16 % of the national gross domestic
and the High Plateaus. Its course stretches over product (GDP).
more than 600 km, with highly fluctuating water
levels. The 41 towns and cities that fall entirely within
the area under study had a population of around
• The Tangier and Mediterranean coastal basins, 10 000 in 2004 (the lower limit set for the project —
which have a total, combined surface area of see Annex A4.1), their combined total population
9 000 km2 and together cover 6 prefectures and increased from 2.22 million in 2004 to around
provinces (3). This area is drained by many 2.62 million in 2011. They account for 58 % of the
rivers and streams that form very narrow valleys area's population.
at their mouths. These valleys have created a
highly undulating relief, with a series of hills The assessment of the municipal waste and
lying to the west, and high mountains lying to wastewater priority areas, as defined under
the east. In the 2004 census, the area's population the H2020 initiative, will be based on data and
stood at 2.2 million people, with 1.5 million information gathered for the towns and cities
(54 %) living in towns and cities, and 1.3 million located in the prefectures and provinces listed
(46 %) in rural areas. below. The assessment of the industrial emissions
priority area will be based on data obtained from
This territory has a wide variety of landscapes, the network for monitoring the levels of telluric
including a coastal zone (512 km long and with pollution conveyed to the Mediterranean Sea, which
39 beaches), plains (Moulouya), arid plateaus were collected as part of the Programme for the
(Guercif) and mountainous regions (Rif and Middle Assessment and Control of Marine Pollution in the
Atlas). It has an abundance of natural resources and Mediterranean (MED POL) programme.
(1) Four in their entirety (Tangier, Fahs Anjra, Tetouan and M'diq-Fnideq) and two partially (Chefchaouen (65 %) and Al Hoceima
(90 %)).
(2) Five in their entirety (Oujda, Berkane, Nador, Jerada and Taourirt) and four partially (Figuig, Taza, Boulemane and Guercif).
(3) Four in their entirety (Tangier, Fahs Anjra, Tetouan and M’diq-Fnideq) and two partially (Chefchaouen (65 %) and Al Hoceima
(90 %)).
Horizon 2020 Mediterranean report 5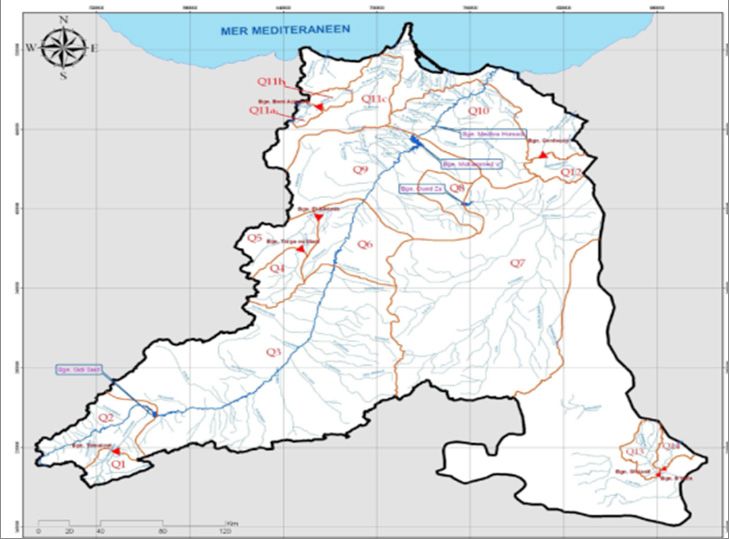
Annex 4: Morocco

    Map A4.1          The Moulouya Basin

    Source:   ONEM.

    Map A4.2          The Mediterranean basin

    Source:   ONEM.

6   Horizon 2020 Mediterranean report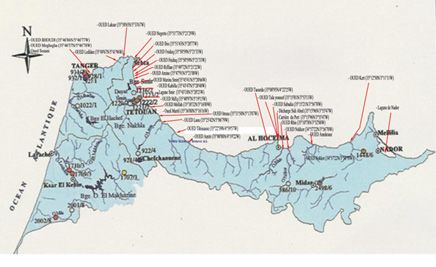
Annex 4: Morocco

Table A4.1 Population of the area under study

Provinces and prefectures                 Percentage                   Total population         Population covered by the
                                              (*)                                                     SEIS project
                                                                2004 GPHC            2011         2004            2011

Moulouya Basin

1. Oujda                                      100                 476 021           508 026      406 695         462 281

2. Taourirt                                   100                 206 009           219 225      118 373         146 933

3. Nador                                      100                 505 022           518 822      277 464         306 284

4. Berkane                                    100                 270 012           277 185      114 508         125 823

5. Jerada                                    74.2                  78 636            77 586       57 306          59 780

6. Driouch                                    100                 223 010           241 817       47 192          53 355

7. Boulemane                                 85.1                 157 352           169 206       32 473          37 648

8. Taza                                      24.7                 137 964           143 105        3 983           4 432

9. Midelt                                    61.9                 159 203           170 167       44 429          50 152

10. Guercif                                   100                 184 602           199 196       64 657          82 559

Tangier and Mediterranean coastal basins

11. Chefchaouen                              79.6                 336 546           376 781       35 797          43 760

12. Tangier-Assilah                            55                 442 308           520 713      439 308         516 606

13. Fahs Anjra                               98.5                  66 015           104 421       10 354          16 382

14. Tetouan                                  97.8                 464 440           504 354      325 035         411 179

15. M'diq-Fnideq                              100                 140 006           174 735      133 073         171 865

16. Al Hoceima                               79.1                 312 819           329 346      110 992         126 608

Total                                                          4 159 965         4 534 685     2 221 639      2 615 647

Note:       (∗) Percentage of the population living in the area under study.

Source:     ONEM.

                                                                                      Horizon 2020 Mediterranean report     7
Annex 4: Morocco

    Priority areas

    Municipal waste                                                       without being appropriately packaged (Department
                                                                          for the Environment, 2004).
    Issues surrounding waste
                                                                          Between 2007 and 2010, the amount of household
    Morocco's urban population increased by 10 %                          and solid waste produced across the entire country
    between 2003 and 2011. This led to an increase in the                 went up by 5.9 %, an increase of 6.3 million t/year,
    demand for basic services, including the collection,                  to 6.67 million t/year. During the same period, the
    treatment and disposal of household and solid                         collection rate of this waste shot up from 44 % to
    waste.                                                                72 %.

    The management of household and solid waste                           The average rate of production stands at
    has certainly improved markedly over the past                         0.76 kg/res./day (0.3 kg/res./day in rural areas, and
    decade. However, there are a number of areas                          1.2 kg/res./day in urban and suburban areas), while
    that have room for improvement, especially as                         the average waste collection rate is estimated to be
    regards financial resources and waste management                      around 80 % in urban areas.
    qualifications at local–government level, availability
    of the necessary infrastructure, and access to the                    Based on the available data, the amount of
    land needed to set up sanitary landfills.                             household waste that was produced in 2010 in the
                                                                          area under study is estimated at approximately
    To make matters worse, some of the waste generated                    969 000 t per year (4), which accounts for roughly
    is disposed of in uncontrolled landfill sites or in                   14.5 % of national waste production. The average
    the vicinity of water channels, without having been                   rate of production stands at 0.75 kg/res./day, with
    pretreated.                                                           figures ranging from 0.44 kg/res./day to 1.38 kg/
                                                                          res./day. This variation can be explained by
    As a result, household and solid waste is still a                     urbanisation rates, the pressures linked to tourist-
    real problem area with significant ramifications for                  based activities, and the ways in which waste is
    public health, natural resources and socio-economic                   managed in the provinces. The collection rate
    activities in general.                                                ranges from 80 % to 90 %, and depends on the
                                                                          system put in place by local authorities to provide
                                                                          this service to citizens.
    State and impacts
                                                                          In addition, waste production has continued to
    Household waste in Morocco is predominantly                           rise over the past 10 years. The graph below,
    organic (50 % to 70 %) and is characterised by high                   which illustrates the changes recorded in several
    humidity (65 % to 70 %) and density levels, and a                     provinces in the area, clearly shows the increase
    low calorific value (< 1 000 kcal/kg). It occasionally                in waste production since 2008, with a growth rate
    consists of paper/cardboard (8 % to 10 %), plastic                    ranging between 1.5 % and 30 %. This increase can
    (6 % to 10 %), glass (1 % to 3 %) and metals (1 % to                  be explained by the escalating rates of urbanisation
    4 %). This has the effect of accelerating its rate of                 (currently around 6 % in coastal towns), and also
    fermentation, and means that it cannot be stored                      by the pressures generated by tourism during the
    for sustained periods of time at production sites                     summer holidays.

    (4) Data collected from partner organisations (report on the state of the local environment or SEIS project) or calculated with respect
        to the national rate. The total amount of waste produced corresponds to the total population of the provinces in the area under
        study.

8   Horizon 2020 Mediterranean report
Annex 4: Morocco
Table A4.2 Production of household and solid waste
Provinces and prefectures Population Amount of waste produced Average rate of production
(2010), in tonnes per year (kg/res./day)
Moulouya Basin
Oujda 454 039 118 881 0.72
Taourirt 142 757 27 457 0.53
Nador 301 995 101 048 0.92
Berkane 277 185 67 063 0.66
Jerada 59 387 12 888 0.59
Driouch 52 448 10 332 0.54
Boulemane 36 851 10 222 0.76
Taza 4 365 1 211 0.76
Midelt 258 557 67 077 0.67
Guercif 199 196 32 000 0.44
Tangier and Mediterranean coastal basins
Chefchaouen 42 593 8 312.8 0.53
Tangier-Assilah 505 228 254 850 1.38
Fahs Anjra 15 518 4 305 0.76
Tetouan 399 490 167 929 1.15
M'diq-Fnideq 166 798 51 650 0.85
Al Hoceima 124 294 34 479 0.76
Total 969 705 0.75
Note: Estimation based on the national rate of production.
Source: ONEM, Data collected from partner organisations, Regional Report on the State of the Environment (Oriental Region).
Household waste poses a threat to public health and Pressures and driving forces
to the long-term sustainability of the environment.
This threat tends to increase significantly when Socio-economic activities, population growth,
such waste is stored in uncontrolled landfills which urbanisation and changes in consumer habits are
contaminate the soil and water resources, pollute the main driving forces behind pressures placed on
the atmosphere and scar the surrounding natural the environment by increased waste generation.
landscape.
The population of the area under study increased
Figure A4.1 shows the amount of waste produced from 2.22 million to 2.62 million between 2004
by certain provinces and urban areas over the years, and 2011. In addition, this area is regarded as
based on data collected from partner organisations in one of the most urbanised regions in Morocco: its
the context of the SEIS project. urbanisation rate ranges from 58 % (in the Tangier-
Tetouan region) to 62 % (in the Oriental region),
Unlike the cities of Tetouan and Tangier, the other exceeding the overall national rate (estimated at
major conurbations (Oujda, Berkane, Nador and 55.1 %).
Al Hoceima) each have sanitary landfills that
together are able to receive around 292 700 t of The tourism sector, which forms one of the
waste per year, which accounts for 36 % of the waste key sectors for driving the country's economic
produced in the area under study, and corresponds development, has expanded rapidly in the area
to 40 % of its population. The waste produced by under study, and in so doing, has contributed to
other medium-sized towns (such as Chefchaouen, the increased amounts of waste produced. Over the
Taza and Midelt) and municipalities are sent to past decade, the number of tourism establishments
uncontrolled landfills or stored in unsightly rubbish in the Tangier-Tetouan region has almost doubled,
tips lying close to these urban areas. increasing from 73 in 2000 to 122 in 2009 (up by
Horizon 2020 Mediterranean report 9Annex 4: Morocco
Figure A4.1 Amount of waste produced from 2003 to 2011
Tonnes/year
300 000
250 000
200 000
150 000
100 000
50 000
0
2003 2004 2005 2006 2007 2008 2009 2010 2011
Berkane 61899 62521 63260 64007 64761 65523 66293 67063 67833
GUERCIF 18700 21250 22750 27900 28287 29200 30186 31172 32184
TANGER-ASSILAH189538 208038 226542 231149 235942 239452 242965 249030 255100
Tétouan 79570 82125 83585 83950 84680 89425 129210 136875 135415
Midelt 12944 13202 13467 13736 14011 14291 14577 14868 15165
Note: Tonnes/an = Tonnes/year; Tanger = Tangier; Tétouan = Tetouan.
Source: ONEM, Data collected from partner organisations, Regional Report on the State of the Environment (Oriental Region).
Table A4.3 Sanitary landfills in the area under study
Cities with a sanitary Municipalities served by the sanitary landfill Number of residents Capacity
landfill served (tonnes/year)
Oujda Bni Drar 360 000 100 000
Berkane Sidi Slimane Echcharraa, Aklim and Zegzel 227 000 63 000
Al Hoceima Ait Youssef Ouali, Ajdir and Bni Bouayach 112 000 31 000
Nador Segangan, Zaio, Bni Ansar, Al Aaroui, Selouane 354 000 98 700
and Ras El Ma
Total number of sanitary landfills: 4 1 053 000 292 700
Total number of towns/cities and municipalities served: 18/41 (40 %) (36 %)
Source: ONEM, Data collected from partner organisations, Regional Report on the State of the Environment (Oriental Region).
65.57 %). Around 6.83 % of all the hotels in Morocco 3 739.97 Gg CO2 (equivalent in 2004), representing
are located in this region. an increase of over 56 %.
Figure A4.2 shows the number of overnight stays
that were recorded in the Tangier-Tetouan region Responses and outlooks
between 2004 and 2011.
The waste collection rate has improved over the
Waste is also a source of greenhouse gas emissions, past few years as a result of local authorities
which are responsible for global warming. increasingly favouring the privatisation of the waste
In Morocco, these emissions rose from 2 419 management sector, which has delegated waste
gigagrams (Gg) CO2 (equivalent in 1994) to collection services to private operators. As part of
this new approach, the National Household and
10 Horizon 2020 Mediterranean reportAnnex 4: Morocco
Figure A4.2 Number of overnight stays in the collection rate of 90 % (this rate currently stands
Tangier-Tetouan region, at 75 %);
2004–2011
• establish, for every urban area (100 %), sanitary
Number of overnight stays landfills for receiving household and solid
waste;
1 250 000
• restore all existing landfills after they have been
1 200 000
closed (100 %);
1 150 000
• privatise waste management in urban areas
where this management could generate a profit
1 100 000 for private operators, but at the same time keep
costs down to accommodate local authorities;
1 050 000
• develop the 'waste sorting/recycling/recovery'
1 000 000 sector by implementing pilot sorting initiatives,
in order to achieve a recycling rate of 20 %;
950 000
• raise public awareness about issues surrounding
04
05
06
07
8
09
10
11
0
20
20
20
20
20
20
20
20
waste.
Source: HCP, 2014.
Under this programme, sanitary landfills will serve
every town, city and urban area, uncontrolled
Solid Waste Management Programme (NHSWMP) landfills will be restored, and local authorities will
launched in 2007 provides financial and technical benefit from improvements in their waste collection,
support to local authorities seeking to improve the treatment and disposal services.
ways in which they collect, process and dispose of
their waste. The programme has seen a significant rise in the
number of studies and interventions aiming to better
By 2020, this programme aims to: control and rationalise the management of solid
waste in the area under study. Many projects have
• provide for the collection and treatment of been carried out, and others are either under way
household waste in urban areas, and achieve a or in the pipeline (for instance, the drawing up of
Table A4.4 Actions in progress or scheduled to take place under the NHSWMP
Restoration of uncontrolled landfills Establishment of sanitary landfills
Completed or in progress Scheduled by 2020 Completed or in progress Scheduled by 2020
Nador M'diq Oujda Tangier
Tetouan Fnideq Berkane Taza
Al Hoceima Oued Laou Nador Fnideq
Berkane Aklim Al Hoceima Oued Laou
Tangier Boulemane Jerada
Tetouan Taza Guercif
Targuist Bni Drar Taourirt
Bni Bouayach Boulemane
Imzouren Chefchaouen
Driouch Tetouan
Tafoughalet Driouch
Midelt
Guercif
Ras El Ma
Source: ONEM, 2014.
Horizon 2020 Mediterranean report 11Annex 4: Morocco
prefectural/provincial master plans for managing These master plans set out:
household waste). Similarly, several towns and cities
have opted to delegate waste management in order • the objectives to be reached concerning the
to improve the service provided. collection and disposal rates of household and
solid waste;
Table A4.4 shows the sanitary landfills that
have already been established, and the existing • the sites appropriate for constructing facilities
uncontrolled landfills that have already been to dispose of and store this waste, taking into
restored, as well as any similar operations that are account the guidelines for town-planning;
currently under way or scheduled to take place.
• an inventory with a 5-year and a 10-year forecast
It highlights the following points. of the amounts of waste to be collected and
disposed of as a function of their origin, nature
• The area under study has 4 of the sanitary and type;
landfills of the 14 established in Morocco to
date, which are financed by the government and • an investment programme covering the same
the relevant local authorities. The operation of periods, giving a calculation of the costs
these landfills has been contracted out to private involved in establishing sanitary landfills and
operators (Oujda: CSD/CRB; Berkane: VEOLIA; building plants for treating, recovering, storing
Al Hoceima: SEGEDEMA; Nador: AVERDA). or disposing of this waste, and also in restoring
uncontrolled landfills;
• Nine more landfills will be operational by 2020.
• the financial and human resources needed,
• Three uncontrolled landfills have been restored and the actions to be taken in order to raise
and a further four are currently being restored. awareness and provide information and advice.
• The restoration of the remaining 16 uncontrolled As regards waste management at Morocco's coastal
landfills is scheduled to take place by 2020. resorts during the holiday season, in 1999 the
Mohamed VI Environmental Protection Foundation
In addition, the legal framework governing the launched the 'Clean Beaches' programme in a bid
waste sector has been strengthened over the past to bring the country's beaches up to the requisite
few years, thanks to the adoption of several laws environmental standards — and keep them that
and regulations. way. The programme aims to make beaches
cleaner and more hygienic, and focuses on raising
• Law No 28-00 on the management and disposal awareness of the various stakeholders involved,
of waste seeks to curb the harmful nature and either putting in place or improving basic
of waste and reduce the amount of waste infrastructure.
produced, and also to organise the collection,
transportation, storage, treatment and disposal The programme proved hugely successful at the
of waste, as well as waste recovery, in an beaches that were initially selected, with visitor
environmentally sustainable way. A series numbers soaring and pioneering partnerships
of regulations have been adopted in order to struck up between the local authorities involved
implement this law. and socially responsible companies. This prompted
the foundation to launch the even more ambitious
• Law No 22-10 on the use of degradable or and proactive 'Blue Flag' programme in 2002.
biodegradable plastic bags prohibits the Backed by the Foundation for Environmental
production, for the local market, of bags made Education (FEE), this programme's objective
of non-degradable or non-biodegradable plastic, is to see Morocco's beaches officially classified
and also bans such bags from being imported, as complying with the highest international
sold or stored for the purposes of being sold, or environmental standards.
given away for free.
The beaches on Morocco's Mediterranean
Furthermore, under the provisions of Law No 28‑00, coastline were inspected between May 2010 and
several prefectural and provincial master plans for February 2011, with 33 out of 35 being classified as
managing household and solid waste have been 'clean beaches', three of which (the municipal beach
drawn up, and others are currently being devised. at Saidia, and the beaches at M'diq and Fnideq)
were awarded the 'Blue Flag' eco-label.
12 Horizon 2020 Mediterranean reportAnnex 4: Morocco
Wastewater and sanitation 2.62 million (57.83 % of the people living in the
area under study). This volume of wastewater
Issues surrounding wastewater was recorded for towns and cities having a public
sanitation system, and a population of around 10 000
Since the 1960s, one of Morocco's key priorities in 2003.
has been the construction of hydraulic facilities
to facilitate socio-economic activities and provide However, over the same period, there was a
safe drinking-water for the entire population. significant disparity between different towns and
However, this development of the country's water cities in terms of properties being connected to
infrastructure has not been accompanied by any sanitation systems. This disparity was attributed to
serious efforts to bring its liquid sanitation and several factors: the distance that some towns lie from
wastewater treatment infrastructure up to scratch. major conurbations; the fact that drinking water and
electricity was not accessible to all; and the sheer
Until 2005, Morocco's liquid sanitation isolation of some urban areas and other geographical
infrastructure was considerably underdeveloped: features, which complicated the expansion of the
issues surrounding wastewater management were sanitation infrastructure to cover them. However,
not prioritised; what sanitation infrastructure broadly speaking, the past few years have seen a
did exist covered only a small proportion of the marked rise in the number of connected properties
country; and wastewater treatment rates were low. in every town and city: between 15 % and 75 % of
properties were connected in 2003 (depending on
At national level, and more particularly in the the town or city in question), compared to between
Mediterranean region forming the subject of this 60 % and 97 % in 2011.
assessment, the deficiencies in liquid sanitation
infrastructure resulted in a steady decline in the The last few years have also witnessed a general rise
quality of both water resources and the natural in terms of access to sanitation, with a number of
environment, which in turn posed a threat not national programmes being implemented including
only to the health of the population but also to the a wastewater sanitation and treatment programme
socio‑economic development of the region. and programmes for making drinking water and
electricity accessible to all.
In a bid to resolve this situation, the public
authorities introduced a framework policy for Overall, in practically every town and city falling
the sector by setting up the National Liquid within the area under study, the number of
Sanitation and Waste Water Treatment Programme properties connected to sanitation systems has, since
(NLSWWTP), which seeks to increase the number 2006, exceeded the national average, which stood
of properties connected to sanitation systems and at 70 %. In 2011, around 70 % of these towns and
reduce the amount of pollutants discharged into cities had a connection rate higher than the national
receiving environments. average, which now stands at 72 %.
Figure A4.3 shows how the connection rates of
State and impacts certain towns and cities have evolved, in relation to
the national rate.
In both Morocco as a whole and in the area under
study, the vast majority of urban areas (around Concerning the treatment of wastewater collected in
80 %, accounting for 97 % of the urban population) the 41 towns and cities in the area under study:
are served by public sanitation systems, with the
remaining 20 % or so being served by independent • 22 towns and cities already had treatment plants
or private sanitation systems. The most common in 2011;
types of sanitation systems in urban areas are
combined systems. • treatment plants were being constructed in a
further five towns and cities;
According to the available information, the
volume of wastewater collected in the area under • treatment plants were scheduled to be built
study has almost doubled over the past decade, between 2013 and 2017 in a further nine towns
increasing from around 45 million m3 in 2003, for a and cities;
population of 2.22 million (i.e. 52.85 % of the people
living in the area under study), to approximately • there were no plans to build treatment plants in
79 million m3 in 2011, for a population of the remaining five towns and cities.
Horizon 2020 Mediterranean report 13Annex 4: Morocco
Figure A4.3 Number of properties connected to sanitation systems
%
120
100
80
60
40
20
0
2003 2004 2005 2006 2007 2008 2009 2010 2011
Midar Driouch Missour Taourirt Imzouren Tetouan National
Source: ONEM, Data collected from partner organisations, Regional Report on the State of the Environment (Oriental Region).
The first wastewater treatment plants became and use of non-conventional water sources, projects
operational in 2004. Since then, significant progress promoting reuse of treated waste will soon be
has been made in this field: in 2011, there were initiated in the area under study, especially in the
14 treatment plants in the area under study, plants where tertiary treatment is performed.
accounting for around 19 % of those in Morocco.
According to the available data, these plants treat The operation of these treatment plants generates
almost 95 % of the wastewater collected. sludge, with approximately 4 184 t being produced
in the area under study in 2010, accounting for
Table A4.5 gives a summary of the different types almost 12 % of the country's total amount that year.
of wastewater treatment methods employed at the This sludge production is essentially a result of
various plants located in the area under study. wastewater treatment for the cities of Nador and Al
Hoceima.
According to the available information, wastewater
treated in the area under study is not currently Generally, there are two ways in which this sludge
reused. However, as part of the implementation of a is managed: it is either sent to landfills after having
national water strategy that highlights water saving been pretreated (thickening and/or dehydration), or
stored at the treatment plants.
Table A4.5 Types of treatment performed
In addition, trials have been carried out in an
at the treatment plants
attempt to process this sludge for reuse, most
notably in Nador:
Type of treatment Number of treatment plants
Primary treatment 2 • incineration trials in cement works;
Secondary treatment 7
Tertiary treatment 5 • experiments to assess its fertilising power.
Total 14
Conversely, in the absence of information on the
Source: ONEM, Data collected from partner organisations,
Regional Report on the State of the Environment sanitation networks in rural parts of the area under
(Oriental Region). study, it may be considered that access to improved
14 Horizon 2020 Mediterranean reportAnnex 4: Morocco
sanitation systems in these regions is close to that has a significant impact on the development of
recorded at a national level (i.e. around 11 %). tourism.
When wastewater is discharged directly into Pressures and driving forces
receiving environments without having been
pretreated, there are a variety of economic, social, Population growth, urbanisation and greater
environmental and health-related ramifications. numbers of tourists during the summer holidays
There is no specific information on this subject are the main driving forces behind the pressures
for the area under study and no studies have placed on the environment due to increasing levels
been carried out there. The possible ramifications of wastewater generation.
of improper wastewater management should
therefore be highlighted for that area, as these may The population of the towns and cities located in
impact the following. the area under study has grown incessantly over
the past decade, rising from around 2 221 639 in
• Public health: 2004 to some 2 615 647 in 2011. What's more, the
wastewater is the principal transmission vector number of tourists visiting the area has also gone
of waterborne diseases, whether through up dramatically. These developments have resulted
consumption, direct contact or agricultural in a marked increase in the volume of household
reuse without being treated. Statistics show liquids discharged: according to available
that these diseases are most common in the information, roughly 46 million m3 were discharged
vicinity of areas in which untreated wastewater each year around the turn of the century, compared
is discharged or dispersed. to around 80 million m3 in 2011.
• The living conditions of the local population: Table A4.6 shows how the volume of discharged
found chiefly in poorly drained districts, household wastewater has evolved in recent years,
wastewater is not an only unpleasant sight and for several of the major cities in the area under
smell, but it is an ideal breeding ground for study.
pathogens.
Until the beginning of the 21st century, the
• Water resources: wastewater generated placed much pressure on
water resources contaminated by wastewater the environment, since properties in the area
must be treated, at great cost, before they are fit under study were being connected to sanitation
for human consumption. systems at low to average rates, ranging from 15 %
to 75 %. A significant proportion of the household
• The quality of bathing water: wastewater generated was discharged directly into
the large quantities of wastewater discharged the natural surroundings, without having been
into the sea severely reduce seawater quality pretreated. According to available information,
along the coastline, and pose health risks in the first wastewater treatment plants became
the form of contaminated fish and shellfish, operational in 2004. This untreated discharge
or polluted swimming waters; in turn, this caused severe damage to the receiving environment
Table A4.6 Wastewater volumes for certain cities in the area under study
City 2008 2009 2010 2011
Waste- Population Waste- Population Waste- Population Waste- Population
water (residents) water (residents) water (residents) water (residents)
volume volume volume volume
(Mm3/ (Mm3/ (Mm3/ (Mm3/
year) year) year) year)
Tangier-Assilah 855 905 20.784 874 024 32.226 892 170 33.041 910 387
Tetouan 14.965 345 547 15.564 370 739 16.218 389 308 17.079 400 700
Nador 134 246 136 462 138 747 8.194 141 067
M'diq 1.379 64 694 1.365 66 997 1.476 69 163 2.386 71 264
Source: ONEM, Data collected from partner organisations, Regional Report on the State of the Environment (Oriental Region).
Horizon 2020 Mediterranean report 15Annex 4: Morocco
by adversely impacting the quality of its natural • The Ministry of General Affairs and
resources, and especially its water resources. Governance, which leads the Inter-Ministerial
Pricing Commission and sets the regulations
There is also another source of pressure on the governing sanitation and drinking-water tariffs
environment: the generation of substantial amounts at the production and distribution stages.
of sludge, arising from the operation of treatment
plants situated in the area under study, without • The independent bodies responsible for
any prudent form of environmental management distribution, which, as financially autonomous
being in place. local public organisations, oversee, on behalf of
the municipalities, the distribution of drinking
water and electricity, and also of sanitation in
Responses and outlooks large conurbations.
The public authorities have implemented a • The National Office of Electricity and Drinking
number of measures in recent years. Their aim is to Water (Water Division), which is responsible
improve the quality of life of the local population: for organising the supply of drinking water
to address the shortfalls of the sanitation and on a national scale, and for looking into,
wastewater treatment infrastructure, and restore implementing and managing the production
the area's water resources, bathing water and of drinking water in urban areas. It also has
natural surroundings to their former glory — and powers concerning the distribution of drinking
keep them that way. Some of these measures are water and sanitation, which it can delegate to
described below. local municipalities.
Institutional level • The river basin agencies, whose management
On both an institutional level and an organisational boards bring together all the parties involved in
level as relates to sanitation infrastructure, the water management, and which are responsible
Municipal Charter has placed local municipalities for organising and overseeing the management
in charge of managing liquid sanitation services. of water in the river basins under their charge.
The charter also gives these municipalities the right
to decide the form of management that is most • The private sector, through subcontracted
appropriate for them: direct control, independent companies, which under Moroccan law have
control or subcontracting to a specialist operator. been placed in charge of drinking-water
distribution, electricity distribution and liquid
Other than the municipalities, the principal sanitation.
ministerial departments and public and private
bodies and establishments involved in the • Non-governmental organisations, which are
sanitation sector are described below. essentially involved in providing water to rural
populations.
• The Ministry of the Interior, which, as the
entity officially overseeing local municipalities, Regulatory level
provides them with technical assistance and • The enactment, in 1995, of Law No 10-95 on
helps them coordinate the distribution of water, which has proved to be a crucial turning
drinking water and sanitation services. point in policy on conservation, protection and
integrated management of water resources,
• The Department for the Environment, which as it regulated discharges and introduced a
is responsible for devising and overseeing the funding instrument based on the 'polluter pays'
implementation of the country's environmental principle. Several decrees for implementing
policies. this law have also been adopted, in particular
standards governing the discharges of
• The Department for Water, which is in charge household wastewater and the liquid discharges
of managing public water services, as well as emanating from certain industrial sectors (pulp,
assessing and organising water resources. paper and cardboard industries, and the sugar
industry).
• The Ministry of Health, which is responsible for
all health aspects related to water. • The adoption, in 2002, of the new Municipal
Charter, which confirms the prerogatives of
local municipalities in matters related to the
16 Horizon 2020 Mediterranean reportAnnex 4: Morocco
management of sanitation services, and sets out • the number of treatment plants rose from 6 in
the different ways in which these services can be 2006 to 14 in 2011.
managed.
In addition, other sanitation projects falling within
• The coming into force (since 1996) of contracts the remit of the NLSWWTP are currently being
delegating the management of public water, carried out in the area under study or are scheduled
sanitation and electricity services in certain towns to take place in the near future. These include:
and cities.
• the construction (currently under way) of five
• The enactment, in 2001, of Law No 31-00, which treatment plants:
places the National Drinking Water Authority
(ONEP) in charge of managing liquid sanitation −− two secondary treatment plants (Ben Taieb
services in municipalities, when the management and Guercif);
of those services had been entrusted to it.
−− three tertiary treatment plants (Chefchaouen,
Financial level Midelt and Oued Laou);
Within the context of the NLSWWTP, sanitation
projects are financed to the tune of between 30 % and • a further nine treatment plants that are scheduled
50 % by the state, and of between 50 % and 70 % by to be built:
operators, through specific partnership agreements.
−− five secondary treatment plants (Missour, Ras
Technical level El Ma, Zaio, Debdou and Jerada);
The NLSWWTP was devised in 2006 in order to meet
the following objectives: −− four plants for which the type of treatment
will be defined by technical studies (Driouch,
• have 75 % of all properties in urban areas Midar, Ajdir and Bni Drar).
connected to the sanitation network by 2016, with
a rise to 80 % by 2020, and ultimately to 100 % by Once completed, the various sanitation projects
2030; that are currently under way in the area under
study, together with those pencilled in under the
• reduce household pollution by 50 % by 2016, 60 % NLSWWTP, will help the region's sanitation sector
by 2020 and 100 % by 2030; meet the required environmental standards and
will improve its wastewater management. This
• have all wastewater treated to tertiary level and will significantly alleviate the economic, social,
be reused, by 2030. environmental and health-related impacts of
wastewater discharges in the region, and also help
The programme also forms part of the initiative to markedly improve the standard of life of the local
launched by the international community population.
for establishing the principles of sustainable
development. It aims to meet Millennium
Development Goal 7 (MDG7: 'ensure environmental Industrial emissions
stability'), and more specifically Target 23, which
seeks to 'halve, by 2015, the proportion of the The region in question is that spotlighted by the
population without sustainable access to safe national MED POL programme for monitoring
drinking-water and basic sanitation'. Morocco's Mediterranean coastline. It covers the
northernmost parts of the two basins mentioned
It should be noted that the majority of the sanitation above (the Moulouya Basin, and the Tangier and
projects carried out in the area under study and Mediterranean coastal basins), with surveillance
relating to wastewater treatment and the restoration points located where discharges are made directly
and extension of the network in the desert fall within into the sea. This programme, which is coordinated
the remit of the NLSWWTP. by a national network of laboratories and partner
institutions, monitors the activities of liquid-discharge
Thanks to these projects: monitoring stations listed and shown in Figure A4.4.
• the number of properties in the area under study The programme aims to assess, both quantitatively
that are connected to the network increased from and qualitatively, the household and industrial
around 65 % in 2006 to almost 80 % in 2011; effluents generated by the major conurbations
Horizon 2020 Mediterranean report 17Annex 4: Morocco
Figure A4.4 Map and list of MED POL-Morocco monitoring stations
MOR1 Tangier
Code Stations
MOR1E1 Lihoud River
MOR1E2 Tangier discharge (Sidi
Bouknadel Port)
MOR1E3 Souani River
MOR1E4 Moghora River
MOR1E5 Aliane River
MOR1E6 Ksar Seghir River
MOR2 Tetouan
MOR2E1 Fnidq discharge
MOR2E2 M'diq
MOR2E3 Martil River (downstream)
MOR2E4 Laou River
Martil River (upstream)
MOR3 Al Hoceima
MOR3E1 TP inlet
Map: Discharge points of major towns and cities
TP outlet Parameters measured: pH; conductivity; dissolved oxygen (O2); temperature (T°);
total phosphorus (Ptot); phosphate (PO4); total Kjeldahl nitrogen (TKN);
MOR4 Nodor ammonium (NH4); nitrate (NO3); nitrite (NO2); chemical oxygen demand (COD);
biological oxygen demand (BOD); mercury (Hg); suspended matter (SM);
MOR4E1 Nador TP outlet
cadmium (Cd); copper (Cu); chromium (Cr); nickel (Ni); lead (Pb); zinc (Zn);
MOR4E2 Cabaillo River manganese (Mn); iron (Fe); mercury (Hg), etc.
MOR4E3 Selouane River Source: MEDPOL–Morocco.
MOR4E4 Moulouya River
MOR4L Nador Port
Atalayoune
Ras El Ma
Bni Ansar
Kariat Arkmane
located in the basins adjoining the Mediterranean. Its State and impacts
structure is based on potential sources of pollution.
In the Tangier-Tetouan region, the pollution load
Other measurements of the national network emitted by industrial plants was estimated to stand
related to surface-water quality are also taken into at around 7 000 t of oxidisable matter in 2004, with
consideration, in order to assess the pollution load more than half being discharged directly into the
of industrial and household emissions in the area. natural surroundings. If no preventative measures are
taken, it is estimated that this figure will reach 9 000 t
by 2020, which could cause irreparable damage to
Industrial emissions issues the quality of the receiving environments (Regional
report on the state of the environment, 2012).
There are several major issues currently needing
attention in the area under study: they are More than 50 % of the organic load is discharged
predominantly linked to the discharges of industrial by the food-processing sector, most notably by the
enterprises that are not connected to the sanitation sugar-producing industry (45 %). The remainder is
network and have no treatment plants on site. These generated by slaughterhouses (13 %), dairies (12 %),
industrial plants are especially prevalent along cheese makers (9 %) and oil mills (9 %). The latter
the coastline, something which could generate are concentrated in the Loukkos basin upstream of
significant pressures on the natural and physical the El Makhazine River dam, and pose a threat to the
surroundings. quality of water at this dam.
18 Horizon 2020 Mediterranean reportAnnex 4: Morocco
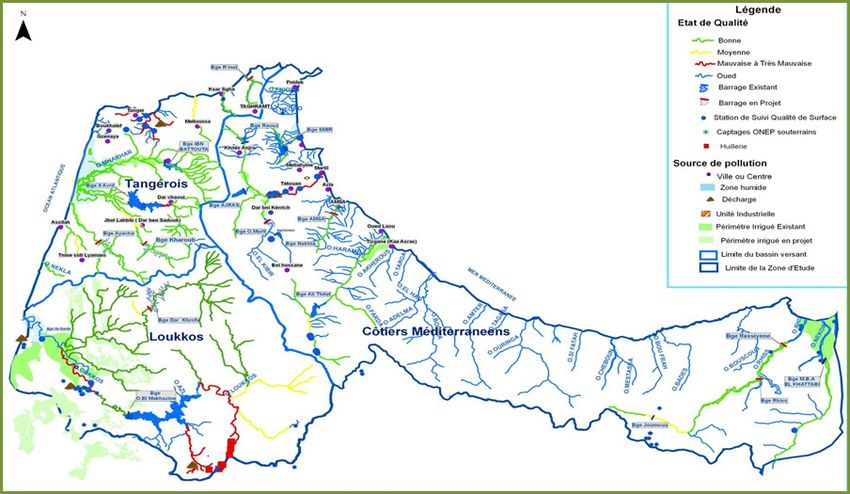
Surface-water quality is generally good in the that the activated sludge treatment plant in the
Tangier-Tetouan region, with the exception of industrial area of Guzenaya, which is currently
certain river sections lying downstream of urban at the trial phase, is intended to eventually treat
or industrial discharges (see Annex A4.2). The river these discharges.
sections considered to experience a permanent or
temporary deterioration in water quality are listed Surface-water quality in the Moulouya Basin
below. generally ranges from good to average. In addition,
according to the most recent surface-water studies
• The upstream section of the Martil River, published by the Moulouya River Basin Agency
which receives household and industrial (2011–2012), the overall quality of the rivers in this
discharges from the cities of Tetouan and basin is still good to average on the whole, with
Martil, is extremely polluted, especially when the only exceptions being those stretches of river
the water level is low, as the river's dilution lying downstream of points where pollutants are
capacity is significantly reduced. The amount discharged. Here, quality is poor, most notably in
of dissolved oxygen in the section of the river the stretch of the Bounaim River lying downstream
lying downstream from where household and from the Oujda treatment plant, and the stretches
industrial effluents are discharged from the of the Cheraa River lying downstream from the
city of Tetouan is very low, and is non-existent treatment plants in Berkane, Missour, Midelt,
along the 16-kilometre stretch leading up to Cabaillou, Selouane and Oued El Heimer (mining
the mouth. The river has been found to contain discharges from the smelting plant at Oued El
organic pollutants originating from household Heimer). During studies in 2005, the water quality
discharges and food‑processing plants, together recorded by the stations at these points generally
with toxic substances (such as chromium and ranged from poor to very poor.
mercury) that have been discharged by chemical
plants and tanneries. This deterioration in quality is due to the high levels
of BOD, COD and nitrogen- and phosphorous-
• The Laou River has seen a slight deterioration containing salts, all of which contribute to a high
in the quality of its water lying downstream pollution load. However, water quality is better in
of discharges from the city of Chefchaouen. the winter than in the summer, at least in terms of
Consequently, the water quality ranges from the BOD, COD, NH4, Ptot and FC parameters.
excellent to average during the wet season, and
is poor at several sampling points during the dry According to studies carried out under the
season. Further downstream, the water purifies MED POL monitoring programme (2011–2012), the
itself and returns to its original high quality. concentration of two industrial pollution indicators
remained below the discharge threshold values
• The Mghogha and Souani rivers, for their (national reports of the MED POL programme: 2005
part, receive almost 7 % of the urban effluents and 2012). The concentration of phosphorus varied
discharged from the city of Tangier. Water according to the location of the sampling point in
quality in these two rivers continues to be rather relation to the discharge points, on the one hand,
low, due to the leachate coming from Tangier's and the flow rates of effluents, which may fluctuate
uncontrolled landfill site (situated close to the with the seasons, on the other. However, these
river mouths), discharges from suburban areas concentrations were generally below the discharge
that have still not been intercepted, accidental threshold value for this parameter (5). Figure A4.4
discharges from utility networks, a number of indicates the concentrations of this parameter,
industrial discharges from industrial areas, and recorded in 2004 and 2012, at certain points covered
water being shed during the winter. As a result, by the programme.
an increase in conductivity has been observed:
it can reach up to 6 694 µS/cm at certain times of As regards TKN, concentrations recorded at the
the year. monitoring points in the Tangier-Tetouan region
sometimes exceeded the threshold value in 2004,
• The Boukhalef River receives water from the but the situation improved greatly in 2012, due to
conurbation of Guzenaya, which has caused its actions taken in the region to enhance sanitation
water quality to deteriorate. It should be noted infrastructure and reduce industrial pollution.
(5) Order used for laying out the grid for surface-water quality (2002).
Horizon 2020 Mediterranean report 19Annex 4: Morocco
Table A4.7 Simplified water-quality grids
a) Water quality grid for surface water
Quality Dissolved O2 BOD COD NH4+ (mg/I) Ptot FC
parameter (mg/I) (mg O2/I) (mg O2/I) (mg/I) (/100 ml)
Excellent >7 20 000
Very poor 25 > 80 >8 >3 n/a
b) Water quality grid for ground water
Quality Conductivity Cl- NO3- (mg/I) NH4+ MO FC
parameter (µs/cm) (mg/I) (mg/I) (mg/I) (/100 ml)
Excellent < 400 < 200 8 > 20 000
Very poor > 3 000 > 1 000 >8 n/a n/a
Source: MEDPOL–Morocco.
Figure A4.4 Total phosphorus (Ptot) concentrations at the MED POL monitoring points
Ptot (mg/l)
12
10
8
Concentration
6
4
2
0
Oued Oued Oued Rejet Oued Martil Oued Oued, Oued VLR *
Lihoud Souani Moghrora Fnideq (aval) Negro Selouane Moulouya
2004 6.99 4.16 6.72 8.97 1.25 0.33 10
2012 4.777 1.735 5.615 9.742 7.31 1.85 0.18 0.18 10
Note: Oued = River; Rejet Fnideq = Fnideq discharge; aval = downstream, VLR = DTV.
* DTV: Discharge threshold value defined by order/decree.
Source: MEDPOL–Morocco.
20 Horizon 2020 Mediterranean reportAnnex 4: Morocco
Figure A4.5 Total Kjeldahl nitrogen (TKN) concentrations at the MED POL monitoring points
NTK (mg/l)
80
70
Concentration
60
50
40
30
20
10
0
Oued Oued Oued Rejet Oued Oued Oued, Oued VLR *
Lihoud Souani Moghrora Fnideq Martil Negro Selouane Moulouya
(aval)
2004 62.3 70.53 49.51 49.67 16.97 0.78 30
2012 6.27 4.03 6.49 4.7 3.69 7.28 8.4 4.17 30
Note: Oued = River; Rejet Fnideq = Fnideq discharge; aval = downstream, VLR = DTV.
* DTV: Discharge threshold value defined by order/decree.
Source: MEDPOL–Morocco.
As regards heavy metals, studies have shown that Pressures and driving forces
the amounts of elements present in the sediment
were generally lower than the average natural Industrial pollution is mainly generated by
sedimentary contents, except for certain parameters industrial plants situated in urban areas, in
that occasionally exceeded this norm: iron for the particular the conurbations of Tangier and Tetouan.
discharges at Fnideq, chromium for the Moghogha The majority of industrial plants in the latter city
River and zinc for the Souani River. Table A4.8 are located in urban areas and in the valley of the
provides the results of studies carried out in Martil River, where there is a high concentration
June 2012. of pollution originating from metallurgy, textile,
Table A4.8 Heavy metal concentrations in sediment at the MED POL monitoring
points
Moghogha
discharge
Moulouya
Bni Ansar
Selouane
Arkmane
ANSC (a)
Cabaillo
Souani
Fnideq
Kariat
Negro
River
River
River
River
River
River
Parameter
Cd (µg/g) < 0.040 < 0.040 < 0.040 < 0.040 < 0.040 < 0.040 < 0.040 < 0.040 < 0.040 0.6
Cu (µg/g) 12.3 10.01 0.706 4.3 0.531 18.3 3.03 1.6 5.2 26
Cr (µg/g) 30 67.9 15.6 15 6.05 12.4 20.3 5.3 35 45
Ni (µg/g) 11.8 25.2 20.1 10.9 1.2 10.5 13.5 1.4 23.3 22
Pb (µg/g) 75.8 10.2 7.14 12.5 6.3 20.5 12.7 2.7 36.9 22
Zn (µg/g) 158 65 47.1 77 10.3 182 56.3 7.9 97.5 88
Hg (µg/g) 0.112 0.092 0.061 0.064 0.058 0.092 0.08 0.069 0.086 -
Fe (mg/g) 13.14 24.72 20.83 12.82 4.020 28.37 14.56 4.332 23.64 20 (*)
Mn (µg/g) 270.05 688 210 278 147 325 212 117 513 400
Note: (a) Average natural sedimentary contents (in μg/g) ((*) Fe in mg/g).
Source: MEDPOL–Morocco.
Horizon 2020 Mediterranean report 21Annex 4: Morocco
chemical and paper-making plants, food-processing Financial instruments to combat industrial
factories and slaughterhouses. pollution
In 1998, the Department for the Environment
Industrial pollution in Tangier, on the other hand, launched a programme to combat industrial
stems from the following four sources: pollution, which involved encouraging industrial
and artisanal companies to invest in anti-
• the industrial zone lying next to the Route de pollution measures, make more efficient use of
Tétouan (the main road leading to Tetouan), from raw materials and use clean technologies. An
which liquid effluents (textiles, aluminium, paper Industrial Depollution Fund (IDF) was set aside
making, food processing, etc.) are discharged into for the programme, with further financial support
the urban sanitation network; being provided by partner organisations based in
Germany.
• the Mghogha district (textiles, tanneries, food
processing, etc.), from which liquid effluents are Seven projects (six of which focusing on the
discharged into the Mghogha River; treatment of liquid discharges) have been rolled
out in the Tangier-Tetouan region, at a total cost of
• the Moulay Ismael district (flour milling MAD 35 million, of which the IDF has contributed
and textiles) to the south of the city, which is MAD 14 million.
connected to the municipal drainage system;
A new Industrial Water Depollution Incentive
• the cluster of industrial plants (dyeing Mechanism (IWDIM) has recently been put in place
workshops) on the road leading to the airport, in Morocco, to continue encouraging companies
south-west of the city, from which wastewater is to cut back their pollution levels. The mechanism
discharged into the Lihoud River. provides river basin agencies with the financial
means necessary for subsidising anti-pollution
The textiles and leather sector is the second most projects by 20 % to 40 %. These projects specifically
polluting industry in the Tangier-Tetouan region; relate to construction of plants for treating liquids
it generates around 42 % of the total pollution load discharged by industrial entities. It was granted
emitted in the area, and is mainly concentrated in the a budget of MAD 100 million for the 2011–2013
city of Tangier. More than 80 % of the area's chemical period. The Moulouya River Basin Agency has given
pollution, meanwhile, originates from ceramics, the green light to three different projects, at a total
surface treatment and chemical manufacturing plants. cost of MAD 43 million, with MAD 10 million being
sourced from funds.
In the Oriental region, industrial activities are
concentrated in Oujda, Nador, Salouane and Bni Legal framework
Ansar, which together account for almost 75 % of Moroccan legislation governing the protection of
the industrial plants in the region. The chemical/ water resources has been bolstered by a substantial
parachemical and food-processing sectors have the number of laws and regulations, most notably Law
most plants and produce the greatest volumes in the No 10-95 on water and the texts implementing it.
region.
This framework has resulted in a number of
While a number of large industrial plants, such as standards being adopted concerning discharges of
Sucrafor, Sonasid, the Bni Snassen Tannery and household wastewater and discharges of liquids
Atlas Bottling, have equipment to treat their residual from certain industrial sectors (the pulp, paper
waters, their discharges are still occasionally rife with and cardboard industries and the sugar industry).
pollutants and micro-pollutants. Some of these plants Further standards concerning the direct and indirect
also discharge pollution directly into rivers. discharges of other industrial sectors are currently in
the process of being drawn up or adopted.
Responses In addition, a draft law on the protection and
enhancement of the coastline is on the verge of
Several initiatives and programmes are currently being adopted by the Moroccan government. This
being implemented by various stakeholders, in a law seeks to pave the way for a national coastline
bid to curtail the pressures generated by industrial protection policy, based on an integrated vision of
emissions. coastal areas.
22 Horizon 2020 Mediterranean reportYou can also read