Landslide Susceptibility Analysis: A Case Study of Nainital Municipal Area
←
→
Page content transcription
If your browser does not render page correctly, please read the page content below
Landslide Susceptibility Analysis: A Case Study of
Nainital Municipal Area
Prashasti Bhattacharyya ( prashastibhattacharyya@gmail.com )
Dept. of Geography, Sarsuna College, 4/HB/A Ho Chi Minh Sarani Behala, Upanagari, Sarsuna, Kolkata,
West Bengal 700061, India https://orcid.org/0000-0001-5500-1447
Shubhanita DasGupta
BGC: Bhairab Ganguly College https://orcid.org/0000-0003-3377-3467
Sourav Das
Sarsuna College
Suchismita Paul
Sarsuna College
Research
Keywords: Landslide vulnerability, susceptibility, transmutation, parameters, GIS, factors, mapping
DOI: https://doi.org/10.21203/rs.3.rs-106891/v1
License: This work is licensed under a Creative Commons Attribution 4.0 International License.
Read Full License
Page 1/48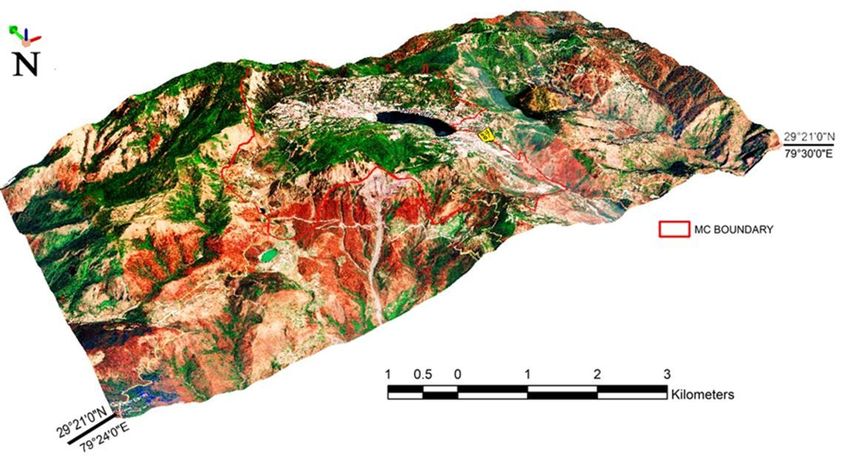
Abstract
Landslides are one of the most recurrent natural phenomena that are of overwhelming signi cance in the
Himalayas. The Himalayan terrain being under severe transmutation by human interference and excess
urban penetration has led to triggering of landslides along with causing colossal damage to property and
loss of life. Immense risk looms large all along the Himalayas with cumulating conditions that build the
potentiality to landslides. The study of landslides has drawn worldwide attention mainly due to the
aggravating socio-economic consequences as well as the increasing pressure of urbanization on the
mountain environment. In order to reduce the damage and manage vulnerable areas, there is imperative
need to formulate comprehensive Landslide Vulnerability and Susceptibility Zonation maps for different
areas of the Himalayan region emphasizing the urbanized and burgeoning pockets. The concept of
landslide susceptibility and landslide susceptibility assessment have been introduced in the past couple
of decades and various methodologies have been developed for evaluating the devastating power of
landslides and its associated processes. The ultimate aim is to evolve a method suitable for speci c
areas through which appropriate management measures can be taken to reduce the risk from potential
landslides. Any approach towards LSZ would require identi cation of the conditions leading to slope
failure, their systematic mapping and evaluation of their relative contributions by amalgamation of all
factors in the ultimatum.

The aim of this paper is to assess the various landslide vulnerability factors in Nainital Municipality area
on raster-based GIS platform and generate landslide vulnerability and susceptibility maps. To achieve the
objective, a detailed inventory of maps based on all parameters assessed has been generated of the
study area from the satellite imageries and eld data. The accuracy of results is being validated by
constant observation and prediction accuracies.

Introduction
The study of landslides has drawn worldwide attention mainly due to increasing awareness of the socio-
economic impact of landslides, as well as the increasing pressure of urbanization on the mountain
environment (Aleotti and Chowdhury 1999). The mountain environment, which is already a fragile zone
due to tectonic activities, slope instability and mass movements of highly crushed and deformed rocks,
becomes highly vulnerable to slope failure when anthropogenic factors disturb the stability of the region.
In order to reduce the damage caused by landslide initiations and reactivations, a landslide susceptibility
map is really needed (Van Den Eeckhaut et al., 2006). Landslide is a recurring disaster often occurring in
conjunction with and triggered by other disasters like cloud bursts and further causing disasters like ood
in the Himalayas. The concept of landslide susceptibility and landslide susceptibility assessment have
been introduced in the past couple of decades and various methodologies have been developed for
evaluating the devastating power of landslides and its associated processes. The ultimate aim is to
evolve a method through which appropriate management measures can be taken at the right time to
reduce the risk from potential landslides. In order to prioritize the area for hazard mitigation efforts, it is
bene cial to have a LSZ (Landslide Susceptibility Zonation) map prepared depicting the ranking of the
                                                   Page 2/48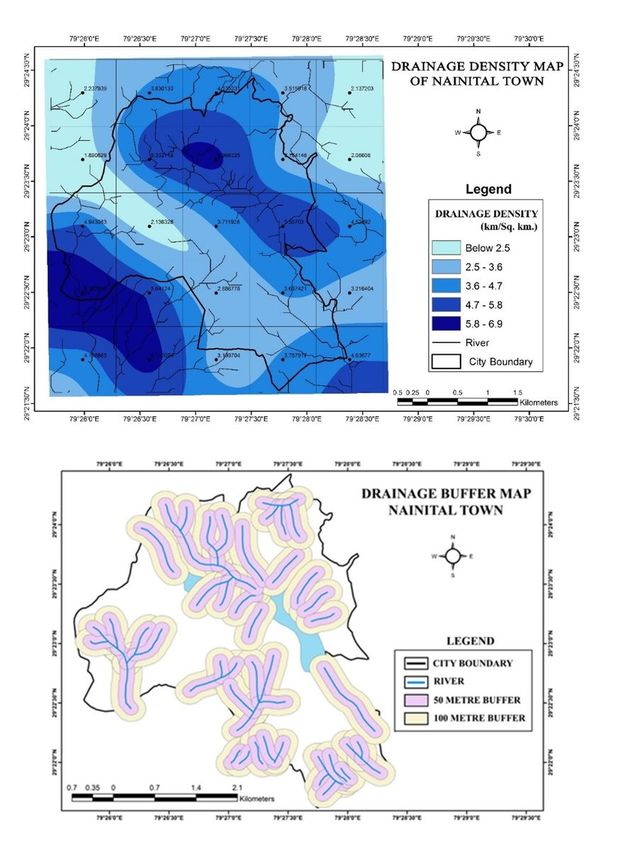
area based on actual and/or potential threat of slides in future. Any approach towards LSZ would require
identi cation of the conditions leading to slope failure, their systematic mapping and evaluation of their
relative contributions.
2.0 Study Area
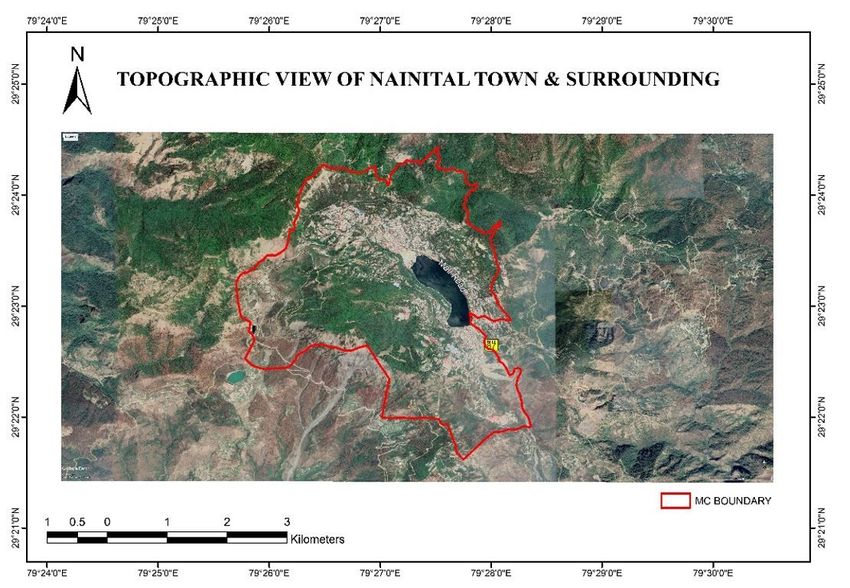
Nainital town, one of the most favoured tourist destinations is located in the Indian state of Uttarakhand.
Study was conducted in this hill station, Nainital,, with elevation ranging between 1400 m. above MSL
(approx.) to about 2600 m. above MSL (approx.) and covering an area of 11.73 square km (4.53 sq. mile)
and also the headquarter of Nainital district. Latitudinal and longitudinal extensions of the study area are
between 29o0’ N to 29o36’21’’ N latitudes and 78o50’53’’ E to 80o0’ E longitudes in the Kumaun foothills of
the outer Himalaya. Nainital Municipal Corporation has 12 wards that have been speci cally analyzed
leaving aside the Army Cantonment Board area (Figure 1).
The area enjoys a sub-tropical to sub-humid climate, with average annual rainfall of 1246 mm. The area
is named after the lake (tal) which is the central attraction of tourists owing here and has experienced
burgeoning growth.
2.0 Literature Review
Literature review for the study can be divided into conception development regarding landslide
susceptibility studies done so far and an information based appraisal of the study area’s demographic
growth and tourism growth.
Landslide hazard zonation (LHZ) is the classi cation of a land surface into homogeneous areas or
domains and their ranking according to degrees of actual/potential hazard caused by mass movement
(Varnes 1984). Landslide hazard zonation mapping is a signi cant step of knowledge building which is
prerequisite of any comprehensive landslide assessment management, disaster mitigation and further
resilience building. The scope of landslide vulnerability assessment study is interdisciplinary and based
on spatio-temporal information easily derivable from remote sensing but remains incomplete without
being integrated with detailed empirical validation (Pandey et al. 2008). With the help of geospatial
techniques, identi cation and appraisal of landslides in even remote areas of mountain ranges like the
Himalayas is rendered possible and delineating landslide vulnerable zones on the basis of major
causative factors has been made easy (Anbalagan et al. 2014). The use of geo-informatics or GIS based
multi-criteria analysis in the landslide hazard mapping and causation was undertaken by several
researchers (Sarkar and Kanungo 2004; Hong et al. 2007; Kouli et al. 2010; Avtar et al. 2011; Othman et
al. 2012; Devkota et al. 2013; Paulín et al. 2014; Ahmed 2015; Cárdenas and Mera 2016; Hadmoko et al.
2017; Stanley and Kirschbaum 2017; Mahdadi et al. 2018). The strategy of landslide analyses includes
understanding the process, hazard analysis and prediction in order to reduce the impending damages
caused. Studies involve generation of landslide inventories, collecting relevant factor information and
mapping, exploratory statistical analysis, selection of nal factor maps generated by weights and
creating criteria tree hierarchy to proceed on to overlay exercise of vulnerability map generation.
Page 3/48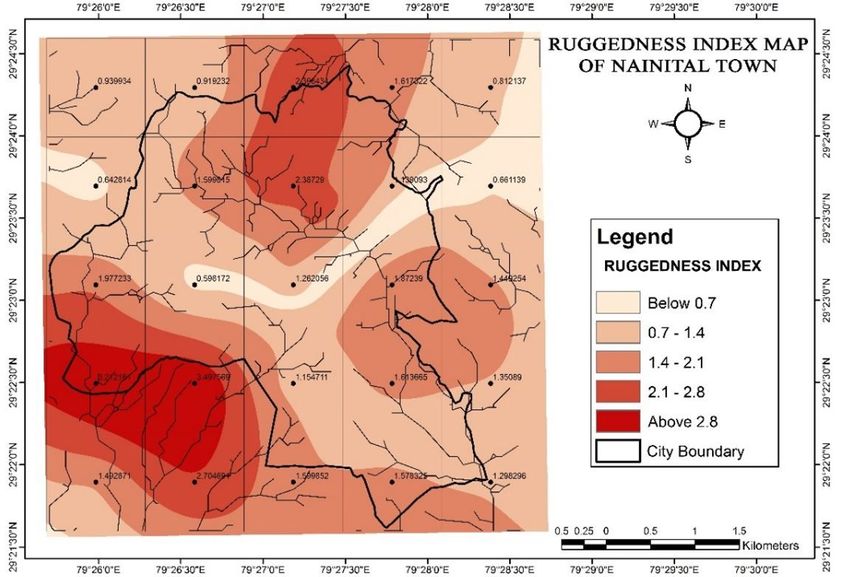
Landslide susceptibility studies can be done by various methods, of which four methods are favoured:
deterministic, inventory-based probabilistic, heuristic and statistical techniques (Guzzetti et al. 1999).
Multi-criteria decision analysis method belongs to heuristic analysis and include the analytic hierarchy
process (AHP), the weighted linear combination (WLC), the ordered weighted average (OWA), etc.
(Feizizadeh and Blaschke 2013; Ahmed 2015). Heuristic methods allow site-speci c and landslide type-
speci c evaluations of the causal factors along with conjunction of experts’ knowledge and experience,
and avoid the generalization that is often integral to data-driven ones (Van Westen et al. 2011).

The state of Uttarakhand (India) has got a history full of landslides related events. Memories of major
landslides that have caused large-scale human tragedies, material damage and associated
environmental and social hazards in Garhwal Himalaya can be traced. The landslides killed about 220
people in the entire rainy season of 2010, where 65 lives were lost, 6 persons went missing, 21 people
were injured, 84 livestock died, 534 houses were fully damaged and 2138 houses were partially damaged
due to heavy precipitation within 4 days from 18 to 21 September 2010, which virtually brought
Uttarakhand to a grinding halt for several days (SEOC report, 2010). Landslides and their secondary
hazards such as landslide dams and subsequent ash oods often turn into major disasters as was
witnessed in 1970 when a 77 year old landslide dam (Gohana tal) in the Birahi-Ganga river, a tributary of
Alakananda, breached and caused major destruction in the downstream areas of Alakananda. There
have been numerous studies involving landslide hazard evaluation (Guzetti et al., 1999). Landslide
hazard may be assessed through heuristic (Anbalgan, 1992, Saha et al. 2002), deterministic (Terlien et al.,
1995, Gokceoglu and Aksoy 1999, Acharya et.al., 2006, Dahal et al., 2008) and statistical approaches (Yin
and Yan, 1988; Van Westen, 2000; Lee and Min, 2001; Dai et al., 2001; Van Westen et al., 2003; Suzen and
Doyuran, 2004; Saha et al., 2005; Kanungo et al., 2006; Mathew et al., 2007; Dahal et al., 2007 and
Chauhan et al., 2010 among others). In the southern margin of Kumaun sub-Himalaya, the frequency of
landslides is high due to structural and neotectonic activities along the main boundary thrust (MBT) zone
along with superimposition of number of clumsy settlements thriving in the zone.

Physiographically, the Nainital District can be divided into three broad physiographic divisions – the
Lesser Himalayan Zone, which is comprised of crystalline metasedimentaries, the Himalayan Foot Hill
Zone or the Siwalik formations and the Piedmont Alluvial Tract further subdivided into the Bhabar and
Tarai zones hosting a number of “tals” or lakes (Figure 2). Tourism and other factors related to it have led
to the steep slopes being highly populated with time, making this area vulnerable to landslides.

3.1 Review of Population Growth and Tourism: A Grave Situation in a Fragile Terrain

The fragile terrain which is naturally highly vulnerable to landslides becomes more susceptible if the built-
up area, especially the residential area increases at a fast pace. The situation here is much more
aggravated by the escalation of tourism in recent decades. Hence an appraisal of landslide vulnerability
entails the need to review population and tourism growth rates of the place.

3.1.1 Population Growth

                                                  Page 4/48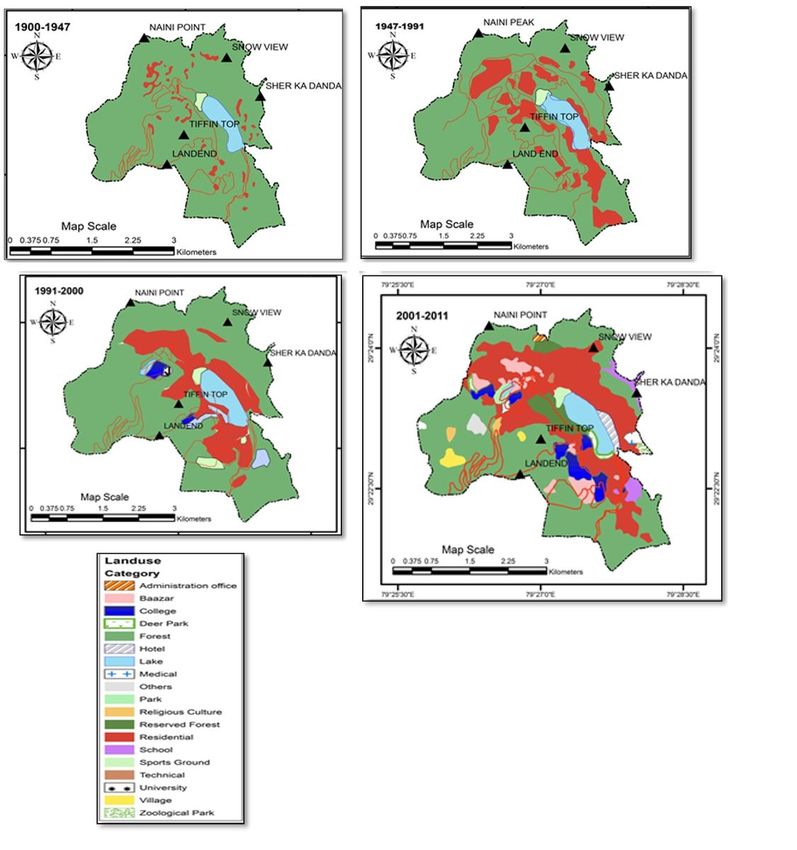
The population growth of Nainital Township from 1901 to 2011 has been depicted with the help of a
graph. It is seen that the population was much lower during the 1900s but steadily increased thereafter.
The total population was just 6903 persons in 1901 but in the next ten years about 3367 persons were
added and the total population increased to 10270 in 1911. The following decade saw addition of just
965 people so that the census year 1921 recorded a total population of 11235 people. 1931 was an
interesting census year where 5% decrease of total population took place. The total population recorded
was 10673, which was almost similar to that of 1911. Since 1941, population steadily grew, rst at a slow
rate of 9.79%. 1941 census year recorded a total population of 11718 persons. The next decade saw
11.73% growth, making it 13093 persons in 1951. 1971 saw a marked increase of 56.51% growth within
10 years, the total population recorded being 25167 persons after which the rate decreased to 3.68%. In
1981 the total population was 26093 and in 1991 it became 29831. 2001 recorded a total population of
38630 persons and the last census year of 2011 recorded a total population of 41377 persons. Analysis
of the growth rate shows a highly uctuating trend (Figure 3a). But as the total population is increasing,
in future Nainital may see an increase in land conversion rate and hence landslides too.

The Exponential growth curve of Nainital Town compares the actual growth of population with the
estimated population. It is seen that from 1901 to 1921, the actual population was more than the
estimated population. However, the actual population recorded a decrease from 1931 to 1961. This was
much lower than the estimated population during this span of time. Since 1971 the actual population has
been higher than the estimated population. During the 1991 census year both were seen to be almost
same, but thereafter the situation changed. The gap between both rates was highest during 1981 census,
when the population was expected to decline to less than 10000, but instead showed an actual increase
to 26093. Since 2001 however, the actual population is seen to be higher than estimated (Figure 3b).

The ward-wise population growth rates of Nainital shows that Ward No. 1 i.e. Snow View has experienced
the highest growth rate of almost 20.68, followed by Ward No.7 i.e. Sher Ka Danda which is 17.26. Ward
no. 6 (Awagarh) and Ward No. 10 (Sukha Tal) has experienced growth rates of 12.56 and 11.17
respectively. Ward Nos. 11, 9, 2, and 3, i.e. Mallital Bazar, Nainital Club, Narayan Nagar and Hari Nagar
have population growth rate less than 10. Ward Nos. 4 (Ayarpatta), 5 (Raj Bhawan), 8 (Upper Mall) and 12
(Shri Krishnapur) have growth rate less than 5. The ward with least population growth i.e. 0.3 is No. 13
(Tallital Bazar) (Figure 4a). It is interesting to note that all the wards that have low population growth rate,
i.e. at least lower than 10 have low landslide records both with respect to area as well as numbers. Snow
View, Sher Ka Danda Awagarh and Sukha Tal are the wards having higher population growth rates and
also high records of landslide with respect to area and numbers.

Population projection for these wards show an alarming situation as the population of Snow View ward
is projected to be very high in the 2021 Census. While the present population (2011) of the ward is just
5381 persons, the projected value is 382022.877, which means it is more than 6 times the present
population. If this truly takes place, not only will the ward be highly susceptible to landslides but the
magnitude of disaster will also be high, as a huge amount of people will be affected. The wards Sher Ka
Danda and Awagarh also show a high projected population. Whereas the present (2011) population is
                                                   Page 5/48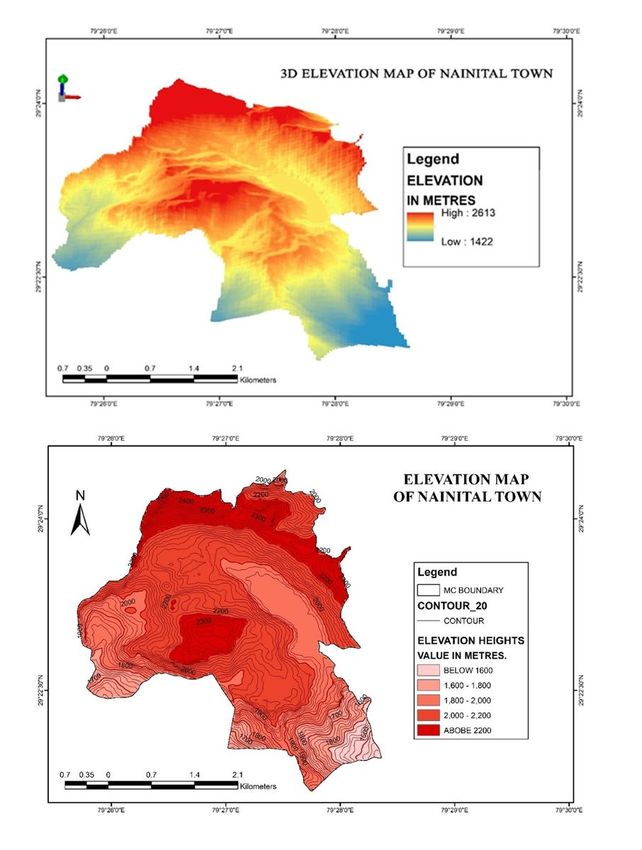
3481 and 3597 respectively, both wards show more than three times increase of projected population,
i.e.17114.92 and 11740.84 (Figure 4b). These two wards also have high landslide values. All the other
wards also show an increase, although not at such a high rate.

Population density shows that highest density is in south-western ward followed by southern and south
eastern parts of the town. It is to be also mentioned that although the northern and eastern wards depict
lesser density, these areas host mainly the hotels of this burgeoning tourist centre (Figure 4c).

3.1.2 Tourism Growth:

Tourism is the main economic activity of Nainital. Traditionally, Nainital attracts large number of tourist
population in the summer even when much is yet to be done to improve and develop its tourist
infrastructure. As indicated by the graph, the area is mostly visited by la large number of Indian tourists.
The total number of Indian tourists increased from 365941 in 2001 to 898077 in 2012. However, the
number fell to 737130 in 2013 due to the Kedarnath Disaster which affected the number of tourist ow to
Uttarakhand. According to Nakajo Akihito, previously Indian’s tourist population mainly comprised of
foreigners and elites. But because of the recent growth of middle income level, the domestic tourism
market has expanded. The number of foreign tourists, although minor in proportion to Indian tourists has
also been growing at a high rate. Infact the growth rate of foreign Tourists is higher than that of domestic
tourists (Figures 5a, b, c). To attract high end tourists including foreign tourists, who have capacity to pay,
higher order facilities need to be created for comfortable accommodation, high altitude recreations
including adventurous tourism etc. As the tourism sector grows further, more employment opportunities
will be created as a result of expansion of the aforesaid activities and enterprises. Not only from India but
also from the other countries of the world tourists come here every year. The beauty of the Naintal Lake is
the main attraction of the tourist. With its beauty some religious causes are also being attached to its
glory. According to the Hindu Puranas, the left eye of the Goddess Sati fell into here. Thus Nainital
became one of the famous 51 ‘Hindu Piths’ of India and a large number of tourist and Hindu pilgrims
come here which in turn helps the tourism of Nainital but at the same time uncontrolled development and
expansion of urbanization shall lead to detrimental consequences, especially in the already landslide
susceptible wards of Nainital.

4.0 Aim of the Study

The aim of this paper is to analyze the factors responsible for vulnerability of this area to slope failure
with an emphasis on the anthropogenic effect in this terrain through the study of landslide hazard
zonation maps of Nainital town region. The main objective is to evaluate preconditioning spatial factors
based on image analysis and ground survey integration on a GIS platform to prepare landslide
susceptibility maps that can be probabilistically used to predict where landslides may occur in future.

Materials And Methods

                                                   Page 6/48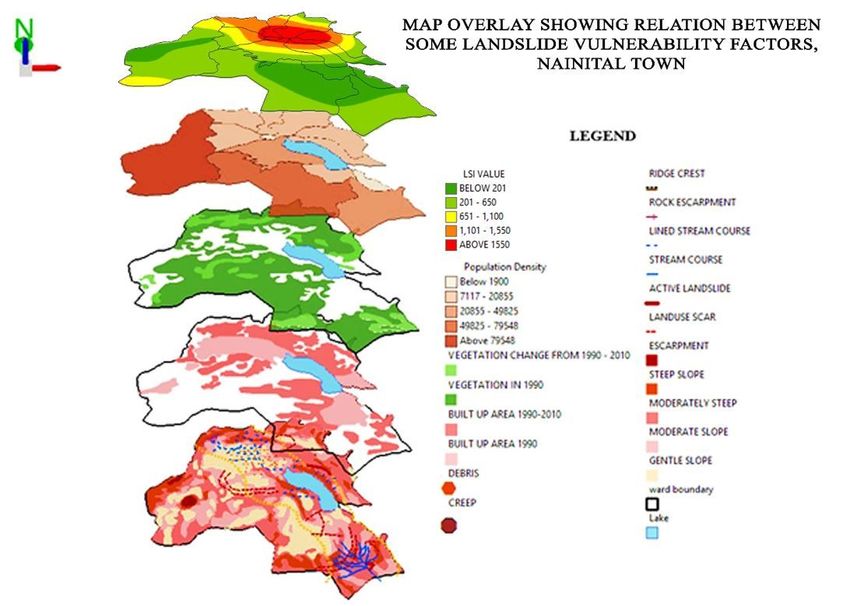
The present study is based on geographic information system technology in conjunction with 2 methods,
viz. a method based on experts’ knowledge and experience, and the analytic hierarchy process (AHP)
method. The susceptibility study of Nainital is assessed using the analytical hierarchy process (AHP) via
an AHP weighted information content method. Using the AHP method supposedly will make the landslide
hazard map of increased validation and acceptance.

To achieve the objective, a detailed landslide inventory map of the study area has been generated from
the high resolution satellite imagery and eld studies. Apart from this, landslide causal factor parameter
maps of the study area has been prepared from various sources viz., satellite imagery, ancillary data,
Digital Elevation Model (DEM), published literature / reports and eld visits. Finally, landslide
susceptibility map of the study area is produced, after which landslide susceptibility assessment is done
to identify the areas more prone to such disasters in order to take suitable measures in future (Figure 6).

For the Landslide Vulnerability Mapping based on the inherent nature of the study area, the landslide
susceptibility factors and their corresponding landslide susceptibility values are determined, keeping the
total 100 and dividing the factor values according to signi cance (Table 1). The factors may be modi ed
based on availability of data. Slope, relative relief, drainage density, ruggedness, dissection indices,
landform are easier to be calculated from topographical sheet and from remote sensing image analysis.
For lithological features, geological map analysis and eld study su ced. Following this a map for each
factor is prepared and the classes therein are identi ed. Subclass wise values or weights were then
assigned keeping in mind that their sum must be equal to the corresponding LSV (Table 2). The
assigning of sub class weights will also depend on signi cance of the classes on landslide susceptibility
of the area concerned.

A digital elevation model (DEM) of the study area was used based on Advanced Spaceborne Thermal
Emission and Re ection Radiometer (ASTER) elevation data (30m resolution) from which a number of
landslide responsible factor values were deduced. These factors are elevation, slope, aspect and to some
extent drainage. There has been collation done using topographical sheets 53O/7 and 53O/11 of Survey
of India (SOI). These maps with scale 1:50,000 were georeferenced using WGS 84 datum, Universal
Transverse Mercator (UTM) zone 45 N projection in ArcGIS desktop 10.5. The drainage aspect was
deciphered from SOI topographical sheets and validated with the ASTER DEM data. Contour elevation,
slope, aspect maps were prepared from ASTER DEM data in spatial analysis tools in ArcGIS platform and
validated with topographical sheet collation and validation. `Geological features like lithology were
derived from Geological Survey of India and lineament was deciphered from Landsat TM data and
validated from GSI information. Land use /land cover data was decoded from precision based
digitization from Arc Earth image and validation with cadastral maps provided by Nainital Lake
Development Authority. Rainfall data was available for only 1 station and this was found unsuited for the
purpose and the study area being very small, the indirect effect of rainfall based on the aspect factor was
considered as more relevant. Population data was obtained from Census Reports (Figure 6).

                                                 Page 7/48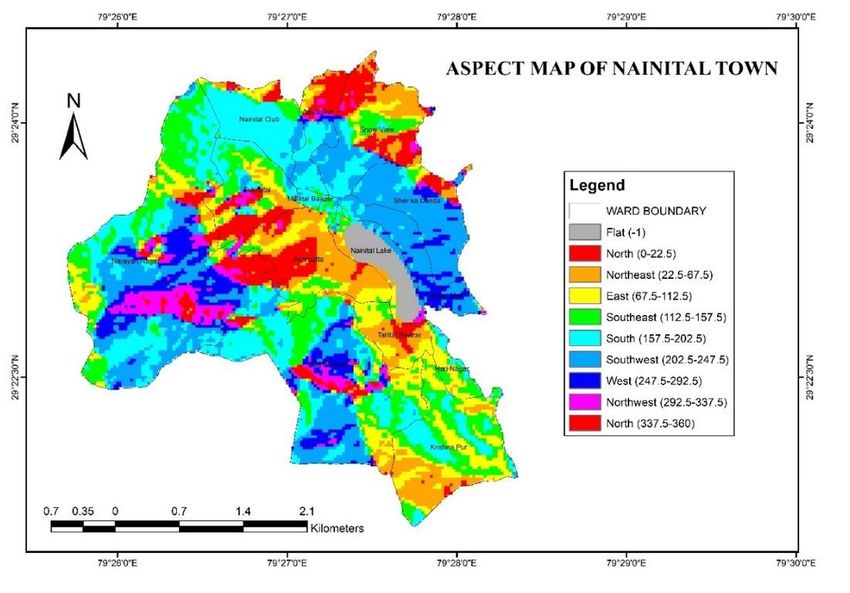
The maps prepared on the factors have zones in a grid-wise framework. It is added that in any grid there
can be single values or point features or micro zonal variations. Considering micro zonal variations is
more speci c for the purpose. If a single average value is there for each grid, corresponding subclass LSV
is assigned to each grid factor wise. If micro zones are analysed of each grid, the % of area under each
subclass in a grid is calculated and then the area percentages with the corresponding subclass LSVs are
multiplied. Then the answers are added to nd total subclass values of each grid for every factor. The
total value is divided with the factor gross LSV.

Example: Say in a grid, 20% area is under 305m relative relief, 50% under 305-395m and 30% under 395-
485m. Calculation will be 20 x 0.4 (subclass value acc. to table 2)= 8, 50 x 0.6 = 30 and 30 x 1.4 = 42,
adding 8 + 30 + 42 we get the total subclass value as 80. This is then divided by LSV of relative relief i.e.
6 to get 13.33 as the nal value.

All the factor LSVs or the factor nal values are added to nd grid wise total LSV. To nd LSI (Landslide
Susceptibility Index) data on landslide occurrences in the study area is required. Here too 2 methods have
been used. One is considering only grid wise number of landslide sites and second is considering area of
the landslide scar/ area affected. Then the following formula is applied:

LSI = Landslides % per sq.km X LSV / 100

A. If no. of landslide is 6 in a grid of area 5sq.km and its LSV is 136.568, then

LSI = 6/5 X100 X 136.568/100 = 163.88

B. If area of site is taken, and landslide area is 2sq.km in a grid of 5sq.km, LSV 136.568, then

LSI= 2/5 X 100 X 136.568/100 = 54.63

A landslide vulnerability map is then prepared with classes selected based on total LSV and two landslide
susceptibility maps prepared based on two way measurement of LSI.

Results And Discussion
6.1 Slope and Aspect:

Slope is the most basic parameter for stability considerations, especially in mountains, as with increase
in slope, shear stress of basal material increases in direct proportion (Lee et al. 2004). It is the rst
derivative of elevation with each pixel (pixel size 80 m × 80 m) denoting the angle of slope at a particular
location.

Study of the slope aspects of the area reveal that most of the area have gentle (less than 15o) to
moderately gentle (25o – 35o) slope. Few areas on the northern, north-western and western border of the
town have steep slope i.e. 35o – 50o. The slopes immediately adjoining the Naini Lake on both sides and

                                                   Page 8/48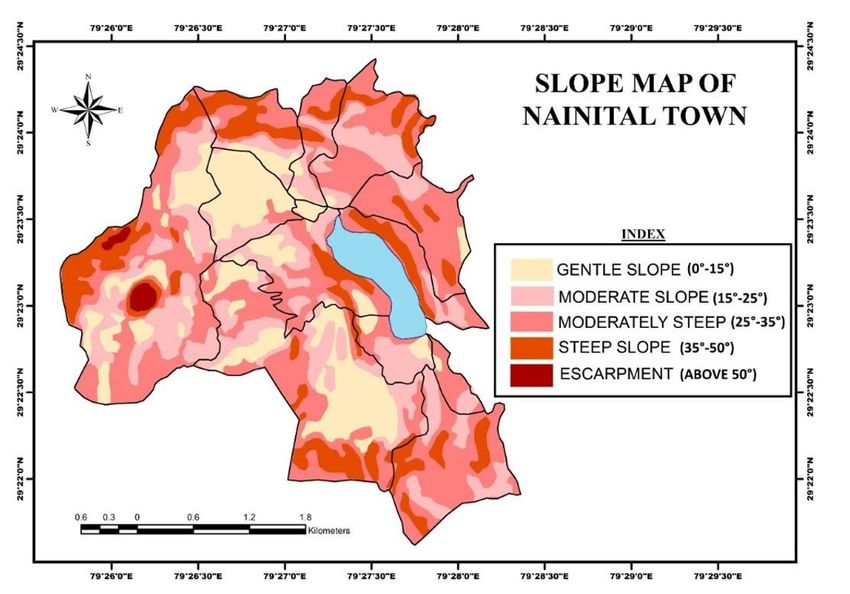
the southern part have steep slopes too. Escarpment having very steep slope i.e. more than 50o lies in the
western part of the town (Figure 7). The slope aspect plays a great role in determining the type and
magnitude of landslide in any area. The areas in Nainital town having steep slope and escarpment are
likely to be mass wasted easily and are prone to slides and falls. Gentle slope areas on the other hand are
more prone to slow creeping movements. They pose no major danger if vegetated. On the other hand the
slope and aspect of the area affect the rate of insolation received by the place, type and intensity of
precipitation, runoff and distribution of vegetation in and around the town. Many areas like Sher ka
Danda, Naini peak, Golf course, Deopatha and Krishnapur also show steep slopes and the Balia Nala
 owing roughly in south-easterly direction has carved out a deep valley due to intense shearing in the
area.

On the context of this study involving a small area and highly unsuitable to analyze disparity of
precipitation due to unavailability of spatial data, aspect is rendered one of the signi cant parameters in
preparing landslide hazard zonation maps. Exposure to solar radiation, rainfall and discontinuities which
are related parameters of aspect largely control the occurrence of landslides. Aspect degree is classi ed
according to the aspect classes as at, north, east, south and west so on and so forth based on
directions, i.e. an aspect map generally refers to the direction to which a mountain slope faces. Nainital
topography circumscribes the position of the lake in a basin and left slope having north to north east
aspect while the right slope have south- south west – west aspects marking windward and leeward
locations. The aspect map is a very important parameter to understand microclimatic effects or impact
of solar radiation on local climate of the Nainital area and was derived from ASTER DEM.

The Aspect Map reveals that the area around the lake is at. The steep slopes right to the lake are
directed west and south-west, while that on the left of the lake trend north, northeast and east . Majority
of the area in the northeast and southwest have south, southwest and west aspect (Figure 8). The rate of
insolation, the amount of rainfall and the type of ground cover and tourism based land use depends on
the aspect of the place much more than any other factor.

6.2 Relief

Terrain elevation is an important factor to identify other factor impacts of this landslide-prone area. The
elevation map of Nainital MC depicts the relief characteristics with the help of contours drawn at interval
of 20m. The average elevation is 2084 metres (6837 ft) above sea level. The highest point is the China or
Naina Peak with an elevation of 2619 metres (8593 ft). The average elevation steeply increases from the
extreme southeastern corner of the town till the extreme northwestern sector. The contours, especially in
the northern, northeastern and western part of the town show a close spacing indicating steepness of the
terrain. The presence of a ridge in the northern part and escarpment in the western part is clearly seen
from the arrangement of contours. However the area adjoining the Lake has uniform relief (Figures 9a, b).

6.2.1 Relative Relief (RR) depicts the range of elevation of a particular place. High values of relative relief
indicate a rugged terrain, whereas low values of relative relief indicate that the relief is almost featureless.

                                                   Page 9/48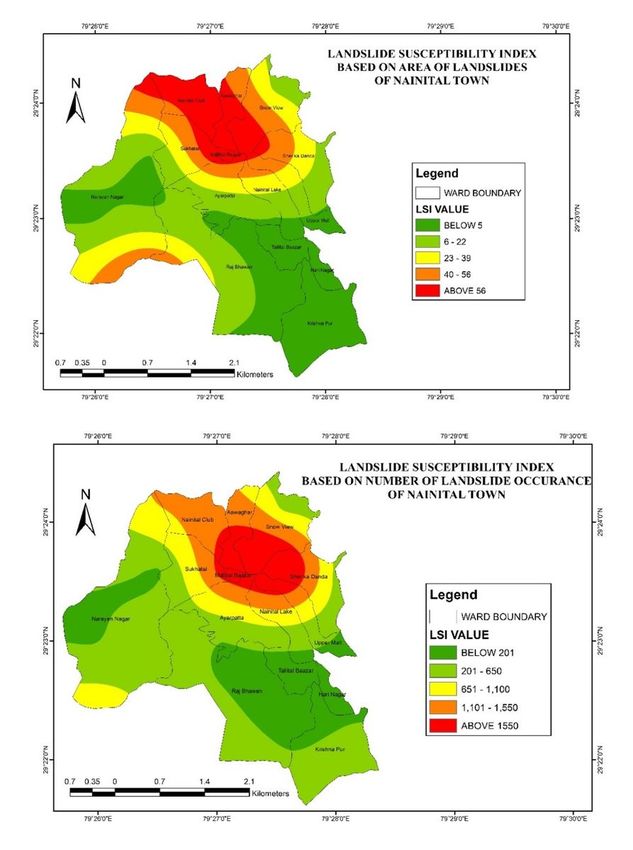
The average RR is approximately 900 metres. Elevation is low (1935.5) around the Naini Lake but steeply
rises towards the north and south west of the town. Naini peak with height of 2611.5 meters above msl is
the highest point of the area while Sher ka Danda, Deopatha and Ayarpatha respectively measure 2402,
2435.1 and 2352 meters above msl. The area around the lake has moderately steep slope and steep
slope in some places, which indicates that the RR is also high. The map shows that the area around the
Naini Lake has a relative relief of 305m to 350m. The values rise to about 600m towards the north and
southwestern part of the town. This indicates that the terrain is rugged due to the presence of rocky
knobs, outcrops and escarpments (Figure 10).

6.2.2 Dissection Index (DI) is an indicator of the relationship between maximum relief and relative relief. It
thus gives an idea of the nature and magnitude of degradation of absolute relief or the whole terrain. The
value to DI varies from 0 which indicates no dissection and 1, which indicates high dissection. DI values
in the town ranges between 0.16 to 0.36 (approx.), indicating low to moderate dissection. The region
around the Naini Lake is least dissected. The northern part having high relief and the whole southern part
of the town having steep slopes and escarpment is more dissected (Figure 11).

6.3 Lithology

Nainital Lake is covered by limestone or dolomitic limestone and north, eastern and south eastern parts
are covered by slate and shale. There are a number of fault lines and small thrust lines in and around the
city. A fault runs across and along the lake intersecting from N-S the entire city.

The oldest rocks exposed in the study area, thus, belong to the Almora Group. Three distinct lithological
suits can easily be identi ed within the Almora Group. These are as follows:

  1. Crystallines and Schists
  2. Quartzite
  3. Granite and Augen gneisses

The rocks of the Almora group tectonically lie over the Ramgarh group along the SAT (South Almora
thrust). Three distinct lithological sites can easily be identi ed within the Ramgarh Group also. These are:

  1. Profoundly mylonitized chlorite quartz porphyry
  2. White and purple sericitic medium grained quartzite interbedded with grey, green and silvery sericite
     schist and chocolate brown, limonitic phylite
  3. Carbonaceous and locally pyretic phyllites and slates altering with blue green banded marmorized
     limestone.(Figure 12a)

Lineament studies have been integrated with drawing the geological features and are supposed to help
reveal generalities on areas of weakness in understanding the cause of landslides. In the Himalayas that
landslide phenomena are aggravated and hastened by being close to regional geological lineaments

                                                  Page 10/48
(Pachauri and Pant 1992; Mathew et al. 2007; Ramli et al. 2010). The lineament density of the study area
was analyzed by using the line density analyst extension of ArcView GIS.
The lineaments thus represent weak zones along which mass wastage is likely. It was encouraging to
note that some of the lineaments correlate positively with the structural discontinuities even through the
two does not exactly overlap each other. It is important to note that the main lineaments are observed to
show a trend both parallel and transverse to the alignment of the Naini Lake. Most lineaments show NE-
SW to NNE-SSW and NW-SE trend. A signi cant lineaments showing NNW-SSE trend is observed to
traverse through Hanumangarhi area while another one trends parallel to Balianala. The lineament
pattern of Nainital area shows a relative close collation with that of drainage line and the ridge patterns
(Figure 12b). As for the analysis, the result in this study indicates that most of the landslides have been
found to occur at 50-100 metres from lineaments especially along the lake and in the town’s south and
north outskirts.
6.4 Drainage Density and Distance to Drainage
Drainage is one of the most important factors that control landslides as its densities denote the nature of
the ruggedness of the area, its soil, geological properties and even condition of land use/ land cover.
The streams emerging from the hills on the plain below are strikingly divided into numerous branches
and channels. The River Debka, Nihal, Kosi, Gola and Bhakra, all of which presents the same character
over the foot hill plain. In the hilly region the main water parting may be marked distinctly, which runs
from Nainital north-west ward, separating the south-westerly drainage from the north-easterly drainage
which is carried by Jokh Nadi, Ghora Gad and Mawani Gadhera etc. The main river of the basin may be
easily marked along the line from which the drainage is owing into the Tal on one hand and also owing
outwards to the southeastern part of the city.
The Drainage Density (DD) map reveals that the DD is highest in the northern part of the town. Here the
values range between 5.8 km/sq.km. to 6.9km/sq.km. The whole area in the northern and northeastern
part of the town has high DD values ranging from 4.7 to 5.8 km./sq.km. This corresponds to the location
of the Naini Lake. The values continuously decrease outward from the lake area towards the area having
gentler slopes then again starts increasing towards the southwestern part of the town from the
escarpment area downslope (Figure 13a). The drainage buffer map shows areas close to drainage lines
(Figure 13b) and this has been collated further with land use map and landslide occurrence sites to reveal
further that areas close to drainage are most vulnerable locations.
6.5 Ruggedness Index
Ruggedness Index (RI) is an indicator of the relationship between relief and drainage. The RI values
around the Lake and main settlement area ranges between below 0.7 to 1.4. Like the DI values RI values
also increase northwards and southwestwards. With respect to landslide susceptibility values, however,
unlike other factors ruggedness values indicate an assigned subclass value of only 0.3 (Figure 14).
Page 11/486.6 Landforms
The Topographic view of Nainital MC and its surroundings reveal that the area near the mall road
appears to have a at structure with slopes surrounding it on all sides. The stream Balia Nala dissects it
from a north west to southeast direction. The area to the southwest appears like a table land having
dense vegetation. The boundary of the town has a much higher elevation than the central part, which
appears like a basin. Landslide scars are visible on the slopes along the town boundary and on the slopes
surrounding the Lake (Figure 15).
The Stability Map of Nainital Town depicts that Ridge Crest lies on both sides of the Lake. The immediate
right slope of the Lake is dominated by creep as the mass wasting process. Wasted debris are found on
the northern part of the Lake. Both slopes of the ridge, especially the right slope is an active landslide
zone. Landslide scars are present in the area bordering the Lake especially to the northeast, northwest
and south of the Lake. Landslide areas are seen scattered throughout the town, especially the rock
escarpment present along the northwestern boundary of the town. Other major landslide areas are
present to the south and southeastern boundary and minor areas are found towards the northeastern
boundary (Figure 16).
6.6.1 Land use and Land cover of Present Nainital
Residential and built-up area surrounds the Naini Lake, although there is absence of houses along the
immediate left and right bank of the lake upto a distance of about 0.5 kilometre owing to the steep
slopes. Settlements are mainly concentrated to the northern and southern part of the Lake and in the high
and middle zone at an elevation varying between 1400 to 2000 meters and in the lower valley stretch at
an elevation less than 1200 meters. Settlements are absent in the upper high zones at elevation above
2000meters. The transportation routes provide a good connectivity to the settlements. The network of
roadways is concentrated in the settlement zone around the lake and runs towards the southwest and
southeastern part of the town. A playground is located towards the north of the lake and other scattered
areas near the lake. Shallow and dense vegetation is found on the steep slopes and escarpment area.
The northwestern, western and southeastern part of the town have few scattered open spaces. Only a
minor portion in the western part is put to agricultural use. The overall map shows distinct landuse zones
existing in relation to relief and slope characteristics (Figure 17).
Land use / Land cover Change: The history of evolution of Nainital Town since 1841 to 1947 shows that
the built up area was scarce till 1900 except a few government buildings present near the southern bank
of Naini Lake. Between 1900 and 1947 urban built up area increased but growth occurred in a scattered
manner along the northern bank of Naini Lake near Kumaun University, surrounding Sukha Tal. From
1947 to present day there has been growth of settlements mainly for tourism purposes, mainly
concentrated along the north-western and south-eastern banks of Naini Lake surrounding the Municipal
O ce and Market area respectively, as well as along the eastern bank of the lake. There has been a rise
of about 15.96% in the areal coverage of built up space from 1990 to 2010. There has been about 15.36
% decrease in vegetation cover from 1990 to 2010, although there has been slight increase in tree-cover
Page 12/48through plantation near the southern banks of Naini Lake. Area under agricultural land use has decreased
slightly by about 0.75% (Figures 18a, b, c, d). It can be seen that land use in different slope areas clearly
show relation of land use with slope aspect in parts of Nainital. It is evident from the diagram that the
intensity of agricultural land use is highest in south western part of Nainital and built up area is highest in
north eastern part. This clearly indicates that the southern part of Nainital has comparatively gentler
slope. Percentage of forested area is highest in the moderate and steep slope areas, whereas, open area
is present in gentle slope areas. Proportion of built up area declines with increase in steepness but a
considerable development has taken place on moderate slopes. The same trend is followed by
agricultural land use.
6.6.2 Vegetation quality:
Vegetation quality based on Normalised Difference Vegetation Index (NDVI) has been done to show that
much of Nainital has lost its original once present dense vegetation cover suited naturally to the terrain.
Less than 40% area is presently under dense vegetation (0.32- 0.58) while lesser dense (0.24- 0.32)
encircle these areas and are dissected in continuity by scattered trees. Much of the town centre
surrounding the lake has lost vegetation and has scattered trees depicted by low NDVI values (0.049 –
0.24) (Figure 19).
6.6.2 Distance from Road
Nainital Town and its surrounding areas like Sukha Tal, Bhimtal, Saat Tal have high level of accessibility.
There is good connectivity of the lake area with nearby towns like Haldwani, Kathgodam etc. Accessibility
is highest in the whole region surrounding the Lake, even on the steep and moderately steep slopes on the
right bank of the Lake. It continues to be moderately high on the northern and southern part of the lake to
the southwest and southeast part of the town. But the southern and extreme northern and northeastern
part of the town is least accessible. A study of land use type and relief in connection to accessibility
reveals that in case of Nainital town both play an important role in case of accessibility. In fact some
areas are inaccessible due to the presence of dense forest here. However, the road network concentration
on steep slopes and rugged areas indicate greater danger from landslides which may lead to road
closures and related problems.
Road density is highest in the area where Kumaun University and High Court is located and in the
residential area surrounding Sukha Tal. Density of road is also high along the eastern bank of Naini Lake
dotted with hotels and residences. The southern bank of Naini Lake with Market, Bus stand and
Government o ces also has high road density. The buffer map (Figure 20) shows the areas in proximity
to road network and upon collation with landslide occurrences and other factors reveal that areas close to
roads are more prone to landslides, for eg. The eastern bank road of Naini Lake.
7.0 Major Findings:
Page 13/48The main aim of this study is to analyse the landslide susceptibility of the Nainital Municipal Corporation
area with the help of the Landslide Susceptibility Index and a Landslide Susceptibility Map prepared on
the basis of the LSI. All the factors responsible for landslides in any area are studied in details with the
help of maps. The assigned subclass values for each of the factors and their subclasses have been
analysed and nally the following inferences have been drawn.
The steep slopes (35o to 50o) and moderately steep slopes (25o to 35o), bordering the Lake have a
subclass value to 7 and 5 respectively. Only a small part of escarpment to the southwest part of the
town has a subclass value of 10. These areas are more probable to suffer due to landslides. Other
areas having moderate and gentle slopes can be assigned subclass values of 2 and 1 respectively.
These have a less probability of occurrence of landslides.
The area surrounding the lake has a sub-class value of 0.6. The north and southwestern part has a
sub-class value ranging between 1.4 and 2.2 indicating that they have a greater potential of being
affected by landslides.
Some areas have low DI values, in case of which the assigned sub-class value is 0.2. The values
gradually increase in accordance with the changes in relative relief. The northern part has higher DI
values of about 0.36. In this case the assigned sub-class value is 1.5 making it a high probability
zone for landslides.
The Nainital town is underlain by shale, siltstones and sandstones, dolomites and limestone and
shale which has a subclass value of 4.5 each indicating weak lithology. Moreover the presence of
lineaments, thrusts, nappe etc. increases the susceptibility of these areas to landslides.
The northern part has a high subclass value of 1.5, as the DD here is more than 5.8 km/sq. km. In
other parts of northern and northeastern Nainital, the assigned subclass value is 1.2. Thus it is clear
that with respect to drainage density the probability of landslides is very high here.
The built-up area in the high relief part itself is an indication of high probability slope instability. The
settlements have been assigned a high sub-class value of 6; open spaces have been assigned a sub-
class value of 4. The presence of these indicates the susceptibility of this area to landslides.
As the road is present around the Lake area which also has steep slope the probability of landslide
becomes high as here the assigned subclass value is 5.
The presence of features like ridge crest, escarpment, landslide scar etc. is an indication of landslide
susceptibility, with the assigned sub- class value being 0.4, 2 and 1.5.
7.1 Landslide Vulnerability State
The Landslide Vulnerability Index Map of the town (Figure 21) is used to identify the areas most
vulnerable to the hazard. Except for small scattered areas in the northeast, east and south the area is
moderate to highly vulnerable to slides. The values range between 97 and more than 156. More than 90%
area of the town is vulnerable to landslides, of which more than 65% area has vulnerability values above
127. Major areas around the Naini Lake, the western, southwestern and extreme southeastern part of the
town is highly vulnerable to landslides with values above 156. A small part of Hari Nagar and Raj
Page 14/48Bhawan, which has least area affected by slides and few occurrences of such hazard, is identi ed to be
least vulnerable. Other parts of Raj Bhawan, Tallital Bazar, Krishna Pur and Upper Mall have moderate
vulnerability to landslides. The whole northern part of the town comprising large parts of Narayan Nagar,
Sher ka Danda, Sukha Tal, Nainital Club, Ayarpatta, Aawaghar and snow view are highly vulnerable to
slope failure. Western part of Sukha Tal, northern part of Naini Lake area, western part of Sher ka Danda,
northern part of Upper Mall, eastern part of Mallital Bazar, southern part of Snow View and southern part
of Narayan Nagar have the highest vulnerability to slides. This region is connected by transportation
routes and settlements are mainly present along these arteries. Slope failures in this area would have
disastrous consequences if suitable measures are not taken to check them.
After thorough analysis of the landslide locations and areas covered, the Landslide Susceptibility
Zonation Maps prepared with the help of it the following observations can be made:
Landslide Susceptibility Index has been calculated based on the area of landslides in Nainital MC (Figure
22a). The LSI values range between less than 5 to more than 56. The southern part of the Naini Lake i.e.
Tallital Bazar, Hari Nagar, Shri Krishna Pur, parts of Upper Mall and Narayan Nagar has very low LSI
values and hence low area affected by landslides. The central part of the town comprising the area
surrounding the above places has moderate LSI values, between 6 and 22. The northern part of the Lake,
comprising parts of Sher Ka Danda, Sukha Tal, Naini Lake and Snow View and the southwestern section
of Narayan Nagar, has LSI values ranging between 40 and 56. The extreme northern part comprising
Awaghar, Mallital Bazar and Nainital Club has highest LSI values i.e. above 56. Thus it is seen that
landslides affect a greater part of the town in the northern and southwestern sectors compared to other
areas.
A second map has been prepared with the help of LSI values calculated based on the number of
occurrence of landslides (Figure 22b). The value ranges between 201 and 1550. It is seen that with
respect to number of slides the LSI value is lowest in the southeastern, central and western part of the
town comprising areas under Raj Bhawan, Tallital Bazar, Narayan Nagar, Upper Mall and Hari Nagar. The
LSI value is moderate, ranging between 651 and 1000 in parts of Sukha Tal, Ayarpatta, Naini Lake and
Sher ka Danda area. The LSI is highest, i.e it ranges between 1101 and more than 1550 in the northern
and northeastern part of the town comprising Nainital Club, Aawaghar, Snow View, Mallital Bazar and
western part of Sher ka Danda. Thus, it roughly coincides with the region where the total area affected by
slides is highest.
Conclusion
Landslides cause huge loss of human life and property in mountainous areas across the globe every
year. There is an inescapable requirement to have landslide susceptibility zonation map so that disaster
prone areas can be delineated. The local authorities can make use of this data for disaster preparedness
and implement mitigation techniques. Several methodologies have been suggested for landslide
hazard/susceptibility zonation. The present research demonstrates the application of statistical based
Page 15/48modeling for landslide susceptibility mapping in part of the Himalaya, which is prone to frequent
occurrence of landslides. The potential of remote sensing and GIS has been exploited in database
preparation and at integration stages. In this research, a modi ed method has been used to generate a
LSZ map of Nainital Municipal area by taking into account and collating various landslide causal factors
(Figure 23). Landslide susceptibility assessment and prediction deals with the spatial component of
hazard, and has as a main objective to answer to the following question: Where can future landslides
occur? Research on the spatial probability of landslide occurrence is vital to the local administrative
authorities and decision makers who are responsible for civil protection, infrastructure planning,
environmental management and landslide mitigation strategies. It is hoped that the zonation of landslide
susceptible areas may help in effective and e cient management of landslide related hazard.
Declarations
Availability of Data and Materials
The datasets generated and/or analysed during the current study are not publicly available due to it being
self-generated data based on on-site primary survey, but are available from the corresponding author on
reasonable request. Other base maps are based on satellite images.
Competing Interests
The authors declare that they have no competing interests.
Funding
The work, being our own personal academic research work, has been carried out fully with the personal
expenditure of the main and corresponding author Prashasti Bhattacharyya, Asst. Professor, Department
of Geography, Sarsuna College.
Authors' contributions
The research paper is a joint endeavour of all the authors each completing their part of work duly
assigned by the main and corresponding author.
PB, being the main author, organized and conducted the survey with her team of surveyors. The analysis
and interpretation of collected data was also done by her.
SD and SP completed the whole procedure of database management, calculation and mapping.
SDG assisted PB in map analysis, explanations, drawing conclusions and nal preparation and writing of
the report.
All the authors read and approved the nal manuscript.
Page 16/48Acknowledgements
NA
Authors' information
Added separately
References
1. Acharya G, De Smedt F, Long N T, (2006) Assessing Landslide hazard in GIS: A Case Study from
Rasuwa, Nepal. Bulletin of Engineering Geology and the Environment 65: 99-107.
2. Ahmed MF, Rogers JD, Ismail EH (2014) A Regional Level Preliminary Landslide Susceptibility Study
of the Upper Indus River Basin. European Journal of Remote Sensing 47(1):343–373. https
://doi.org/10.5721/eujrs 20144 721
3. Ahmed B (2015) Landslide Susceptibility Mapping Using Multi-criteria Evaluation Techniques in
Chittagong Metropolitan Area, Bangladesh. Landslides 12(6):1077–1095. https ://doi.org/10.1007/
s1034 6-014-0521-x
4. Ahmad RA, Singh RP, Adris A (2017) Seismic Hazard Assessment of Syria using Seismicity, DEM,
Slope, Active faults and GIS. Remote Sensing Applications: Society and Environment 6:59–70. https
://doi.org/10.1016/j. rsase .2017.04.003
5. Aleotti P and Chowdhury R (1999) Landslide Hazard Assessment: Summary Review and New
Perspectives. Bulletin of Engineering Geology and the Environment 58: 21–44.
6. Anbalagan R (1992) Landslide Hazard Evaluation and Zonation Mapping in Mountainous Terrain.
Engineering Geology 32:269–277.
7. Anbalagan R, Kumar R, Parida S, Lakshmanan K (2014) GIS based Post Earthquake Landslide
Hazard Zonation Mapping of Lachung Basin, Sikkim. International Journal of Emerging Technology
and Advanced Engineering 4(1):431–441
8. Anbalagan R, Kumar R, Lakshmanan K, Parida S, Neethu S (2015) Landslide Hazard Zonation
Mapping using Frequency ratio and Fuzzy logic Approach, A Case Study of Lachung Valley, Sikkim.
Geoenvironmental Disasters 2(6):1–17. https ://doi.org/10.1186/s4067 7-014-0009-y
9. Anbarasu K, Sengupta A, Gupta S, Sharma SP (2010) Mechanism of activation of the Lanta Khola
Landslide in Sikkim Himalayas. Landslides 7:135–147. https ://doi.org/10.1007/s1034 6-009-0193-
0
10. Avtar R, Singh CK, Singh G, Verma RL, Mukherjee S, Sawada H (2011) Landslide Susceptibility
Zonation Study using Remote Sensing and GIS Technology in the Ken-Betwa River Link area, India.
Bulletin of Engineering Geology and Environment 70(4):595–606. https ://doi.org/10.1007/s1006 4-
011-0368-5
Page 17/4811. Bera A, Mukhopadhyay BP, Das D (2018) Morphometric Analysis of Adula River Basin in
Maharashtra, India using GIS and Remote Sensing Techniques. In: Geo-spatial Data in Natural
Resources, pp 13–35. https ://doi.org/10.21523 /gcb5.1702
12. Calligaris C, Poretti G, Tariq S, Melis MT (2013) First Steps Towards a Landslide Inventory Map of the
Central Karakoram National Park. European Journal of Remote Sensing 46(1):272–287. https
://doi.org/10.5721/eujrs 20134 615
13. Cárdenas NY, Mera EE (2016) Landslide Susceptibility Analysis using Remote Sensing and GIS in the
Western Ecuadorian Andes. Natural Hazards 81(3):1829–1859. https ://doi.org/10.1007/s1106 9-
016-2157-8
14. Cevik E and Topal T, (2003) GIS-based Landslide Susceptibility Mapping for a Problematic Segment
of the Natural Gas Pipeline, Hendek (Turkey). Environmental Geology 44: 949–962. 12th Esri India
User Conference 2011
15. Chauhan S, Sharma M, Arora M K (2010) Landslide Susceptibility Zonation of the Chamoli Region,
Garhwal Himalayas, using Logistic Regression Model. Landslides 7: 411–423
16. Chen Y, Khan S, Paydar Z (2010) To Retire or Expand? A Fuzzy GIS-based Spatial Multi-criteria
Evaluation Framework for Irrigated Agriculture. Irrigation and Drainage 59(2):174–188. https
://doi.org/10.1002/ird.470
17. Chopra BR (1977) Landslides and Other Mass Movements along Roads in Sikkim and North Bengal.
Bulletin of the International Association of Engineering Geology 16(1):162–166
18. Chung C F and Fabbri A G (1999) Probabilistic Prediction Models for Landslide Hazard Mapping.
Photogrammetric Engineering and Remote Sensing 65(12): 1389- 1399.
19. Chung C F and Fabbri A G (2003) Validation of Spatial Prediction Models for Landslide Hazard
Mapping. Natural Hazards 30: 451-472. Dahal R K, Hasegawa S, Nonomura A, Yamanaka M, Dhakal
S, Paudyal P. (2007). Predictive Modeling of Rainfall-induced Landslide Hazard in the Lesser
Himalaya of Nepal based on Weights-of-Evidence. Geomorphology 102 (2008): 496–510.
20. Dahal R K, Hasegawa S, Nonomura A, Yamanaka M, Dhakal S, (2008), DEM-based Deterministic
Landslide Hazard Analysis in the Lesser Himalaya of Nepal, Georisk: Assessment and Management
of Risk for Engineered Systems and Geohazards 2:3: 161–178.
21. Dai F, Lee C (2002) Landslide Characteristics and Slope Instability Modeling using GIS, Lantau
Island, Hong Kong. Geomorphology 42(3–4):213–228. https ://doi.org/10.1016/s0169
-555x(01)00087 -3
22. Dai F C, Lee C F, Li J, Xu Z W, (2001) Assessment of Landslide Susceptibility on the Natural Terrain of
Lantau Island, Hong Kong. Environmental Geology 40: 381–391.
23. Devkota KC, Regmi AD, Pourghasemi HR, Yoshida K, Pradhan B, Ryu IC, Dhital MR, Althuwaynee OF
(2013) Landslide Susceptibility Mapping using Certainty Factor, Index of Entropy and Logistic
Regression Models in GIS and Their Comparison at Mugling-Narayanghat Road Section in Nepal
Himalaya. Natural Hazards 65(1):135–165. https ://doi.org/10.1007/s1106 9-012-0347-6
Page 18/4824. Feizizadeh B, Blaschke T (2013) GIS-Multicriteria Decision Analysis for Landslide Susceptibility
Mapping: Comparing Three Methods for the Urmia Lake Basin, Iran. Natural Hazards 65(3):2105–
2128. https ://doi. org/10.1007/s1106 9-012-0463-3
25. Feizizadeh B, Roodposhti MS, Jankowski P, Blaschke T (2014) A GIS-based Extended Fuzzy Multi-
criteria Evaluation for Landslide Susceptibility Mapping. Computers and Geosciences 73:208–221.
https ://doi.org/10.1016/j. cageo .2014.08.001
26. Ghosh C (2013) Landslides Induced Damages due to Recent Sikkim Earthquake: Strategies for
Geotechnical Intervention. In Proceedings of the International Symposium on Engineering Under
Uncertainty: Safety Assessment and Management (ISEUSAM-2012). Springer, India, pp 1289–1298
27. Gokceoglu C and Aksoy H (1999) Landslide Susceptibility Mapping of the Slopes in the Residual
Soils of the Mengen Region (Turkey) by Deterministic Stability Analyses and Image Processing
Techniques. Engineering Geology 44: 147–161. GSI (2002) Geological Map 53N series. Geological
Survey of India.
28. Gorsevski PV, Jankowski P, Gessler PE (2006) A Heuristic Approach for Mapping Landslide Hazard by
Integrating Fuzzy Logic with Analytic Hierarchy Process. Control and Cybernetics 35:121–146
29. Greenway DR (1987) Vegetation and Slope Stability. In: Anderson MG, Richards KS (eds) Slope
Stability. Wiley, New York, pp 187–230
30. Guzzetti F, Carrara A, Cardinali M, Reichenbach P (1999) Landslide Hazard Evaluation: A Review of
Current Techniques and Their Application in a Multi-scale Study, Central Italy. Geomorphology
31(1):181–216. https ://doi.org/10.1016/S0169 -555X(99)00078 -1
31. Hadmoko DS, Lavigne F, Samodra G (2017) Application of a Semi-quantitative and GIS-based
Statistical Model to Landslide Susceptibility Zonation in Kayangan Catchment, Java, Indonesia.
Natural Hazards 87:437–468. https ://doi.org/10.1007/s1106 9-017-2772-z
32. Hindayar JN, Dasarwar P, Srivastava SP, Kumar NT, Mohan M, Som SK (2016) Dynamicity of the
Himalayan Landslide—a Tectono-geotechnical Appraisal of the 13th Mile Landslide, Sikkim. Journal
of Geological Society of India 88:197–205. https ://doi.org/10.1007/s1259 4-016-0478-6
33. Hong Y, Adler R, Huffman G (2007) Use of Satellite Remote Sensing Data in the Mapping of Global
Landslide Susceptibility. Natural Hazards 43:245–256. https ://doi.org/10.1007/s1106 9-006-9104-z
34. Kanungo D P, Arora M K, Sarkar S, Gupta R P, (2006) A Comparative Study of Conventional, ANN
Black Box, Fuzzy and Combined Neural and Fuzzy Weighting Procedures for Landslide Susceptibility
Zonation in Darjeeling Himalayas. Engineering Geology 85: 347–366.
35. Kanwal S, Atif S, Sha q M (2016) GIS based Landslide Susceptibility Mapping of Northern Areas of
Pakistan, a Case Study of Shigar and Shyok Basins. Geomatics, Natural Hazards and Risk. https
://doi.org/10.1080/19475 2016.12200 23
36. Kolat C, Ulusay R, Suzen ML (2012) Development of Geotechnical Microzonation Model for Yenisehir
(Bursa, Turkey) Located at a Seismically Active Region. Engineering Geology 127:36–53. https
://doi.org/10.1016/j. engge o.2011.12.014
Page 19/4837. Kouli M, Loupasakis C, Soupios P, Vallianatos F (2010) Landslide hazard zonation in high risk areas
of Rethymno Prefecture, Crete Island, Greece. Natural Hazards 52(3):599–621. https
://doi.org/10.1007/s11069-009-9403-2
38. Lee S, Choi J, Min K (2004) Probabilistic Landslide Hazard Mapping using GIS and Remote Sensing
Data at Boun, Korea. International Journal of Remote Sensing 25(11):2037–2052. https
://doi.org/10.1080/01431 16031 00016 18734
39. Lee S and Min K (2001) Statistical Analysis of Landslide Susceptibility at Yongin, Korea.
Environmental Geology 40:1095–1113.
40. Lei CI (2012) Earthquake-triggered landslides. In: 1st Civil and Environmental Engineering Student
Conference, 25–26 June 2012. Imperial College, London
41. Lu P F and An P (1999) A Metric for Spatial Data Layers in Favorability Mapping for Geological
Events. IEEE Transactions in Geoscience and Remote Sensing 37: 1194-1198.
42. Mahdadi F, Boumezbeur A, Hadji R, Kanungo DP, Zahri F (2018) GIS-based Landslide Susceptibility
Assessment using Statistical Models: a Case Study from Souk Ahras Province, NE Algeria. Arabian
Journal of Geosciences 11:476. https ://doi.org/10.1007/s1251 7-018-3770-5
43. Mathew J, Jha VK, Rawat GS (2007) Application of Binary Logistic Regression Analysis and its
Validation for Landslide Susceptibility Mapping in Part of Garhwal Himalaya, India. International
Journal of Remote Sensing 28(10):2257– 2275. https ://doi.org/10.1080/01431 16060 09285 83
44. Mathew J, Jha V K and Rawat G S (2007) Weights of Evidence Modelling for Landslide Hazard
Zonation Mapping in Part of Bhagirathi Valley, Uttarakhand. Current Science 92(5): 628-638.
45. Othman AN, Naim WM, Noraini S (2012) GIS based Multi-criteria Decision Making for Landslide
Hazard Zonation. Procedia – Social and Behavioural Sciences 35:595–602. https
://doi.org/10.1016/j.sbspr o.2012.02.126
46. Oztekin B and Topal T (2005) GIS-based Detachment Susceptibility Analyses of a Cut Slope in
Limestone, Ankara—Turkey. Environmental Geology 49: 124–132.
47. Pachauri A, Pant M (1992) Landslide Hazard Mapping based on Geological Attributes. Engineering
Geology 32(1–2):81– 100. https ://doi.org/10.1016/0013-7952(92)90020 -y
48. Pal I, Nath SK, Shukla K, Pal DK, Raj A, Thingbaijam KKS, Bansal BK (2008) Earthquake Hazard
Zonation of Sikkim Himalaya using a GIS platform. Natural Hazards 45(3):333–377. https
://doi.org/10.1007/s11069-007-9173-7
49. Pandey A, Dabral PP, Chowdary VM, Yadav NK (2008) Landslide Hazard Zonation using Remote
Sensing and GIS: A Case Study of Dikrong River Basin, Arunachal Pradesh, India. Environmental
Geology 54(7):1517– 1529. https ://doi.org/10.1007/s0025 4-007-0933-1
50. Pareta K (2004) Hydro-geomorphology of Sagar district (MP): A Study through Remote Sensing
Technique. In: Proceeding in XIX MP Young Scientist Congress, Madhya Pradesh Council of Science
and Technology (MAPCOST), Bhopal
51. Paulín GL, Bursik M, Hubp JL, Mejía LMP, Quesada FA (2014) A GIS Method for Landslide Inventory
and Susceptibility Mapping in the Río El Estado Watershed, Pico de Orizaba Volcano, México. Natural
Page 20/48You can also read