E-SCOOTER PILOT 2020 EVALUATION - City of Chicago
←
→
Page content transcription
If your browser does not render page correctly, please read the page content below
2020
E-SCOOTER PILOT
         EVALUATION

CITY OF CHICAGO — MAYOR LORI LIGHTFOOT
              MAY 2021

                  CHICAGO
Table of Contents
Letter From the Commissioner                    3

Executive Summary                               4

About the 2020 Pilot                            10
    Pilot Purpose                               10
    Overview of 2020 Pilot Terms                11
    Data Collection and Evaluation              13
    The 2020 Pilot in Context                   14

E-Scooter Use                                   15
    Supply of E-Scooters for Trips              15
    Number of Trips                             16
    Distance and Duration of Trips              18
    Location of Trips                           19
    Timing of Trips                             20
    Purpose of Trips                            21
    Alternate Mode Choice for E-Scooter Trips   22
    Who Made E-Scooter Trips                    24

Safety, Satisfaction And Compliance             25
    Sidewalk Riding                             25
    Geofences                                   25
    E-Scooter Parking                           26
    Rider Safety                                29
    311 Reports                                 31
    City Enforcement of Vendors                 32

Coverage, Distribution, And Equitable Access    34
    Geographic Distribution of E-Scooters       34
    Equity Priority Area Distribution           35
    Affordability and Payment                   37
    Community Outreach                          38
    Seated Devices                              39

Feedback on the Future of E-Scooters            40
    Public Opinion                              40
    Feedback on Future Improvements             41

Appendix                                        44

2
Letter From the Commissioner
Dear Chicagoans,

I am excited to share CDOT’s analysis of our second e-scooter pilot program with the public. As
we contemplate bringing new technology and transportation modes to Chicago, data transparency
and objective analysis are important pillars in our decision-making. Two very different e-scooter
pilots have helped guide us through the opportunities and challenges posed by e-scooters on our
public way.

The second pilot in particular dealt with the uncertainties of COVID-19 as fewer destinations were
available to some of our users, reducing the potential for higher ridership. However, the ability to
ride a greener single occupancy mobility option in open air provided a safe environment for others.
The lock-to technology also helped significantly improve the clearance of our sidewalks and public
way from clutter that can block ADA access. The pilot results also confirm that a geographic com-
ponent is necessary to ensure equitable access to any new mobility option in our neighborhoods.
We hope this report will ignite a conversation across our City to help us determine if e-scooters can
add to the micromobility landscape in Chicago.

Gia Biagi
Commissioner
Chicago Department of Transportation

3
Executive Summary
About the Pilot

In June 2019, the Chicago Department of Business Affairs and Con-
sumer Protection (BACP) and the Chicago Department of Transporta-              212         sq mi

tion (CDOT) launched a four-month e-scooter pilot with 10 vendors and           Size of the 2020
                                                                                   pilot area
2,500 scooters in a 50 square mile area on the West, near Southwest and
near Northwest Sides of Chicago. During and after the 2019 pilot, the
city analyzed data on e-scooter use and vendor performance, solicited
feedback from the public, and convened an advisory group of commu-             2.6        million
nity, business, and advocacy organizations. With the findings from these       Total population of
evaluation processes, CDOT and BACP created updated terms for a 2020                pilot area

e-scooter pilot.

The 2020 e-scooter pilot aimed to better understand what role e-scoot-
ers play as a potentially travel option in Chicago; the operational chal-
                                                                                      3
                                                                               Number of vendors
lenges e-scooters present and the ways they can be lessened; and, how           operating in 2020
effectively e-scooter vendors can operate citywide while promoting in-           e-scooter pilot
creased mobility and access for everyone. Notable aspects of the 2020
pilot terms include an Equity Priority Area that covered approximately
half of Chicago in which each e-scooter vendor was required to deploy
at least 50% of their fleet, and a “lock-to” requirement for e-scooter park-
                                                                                123         days
                                                                                 Duration of the
ing. The 2020 pilot terms also emphasized education requirements for               2020 pilot
riders. Vendors were required to develop a safety quiz, and all riders
renting a shared e-scooter in Chicago in 2020 were required to answer
at least 80% of questions correctly on the quiz before their first ride.
Additionally, the 2020 e-scooter pilot offered the opportunity to test
                                                                               10,000
                                                                               Maximum number
another socially-distanced transportation mode for the public as the
                                                                               of devices allowed
COVID-19 global pandemic unfolded.                                                 to operate

The 2020 e-scooter pilot ran from August 12 to December 12 with three
participating vendors: Bird, Lime and Spin. Each e-scooter company that
participated in the 2020 pilot was permitted to deploy up to 3,333 scoot-
ers for a total citywide fleet of 10,000 devices.

4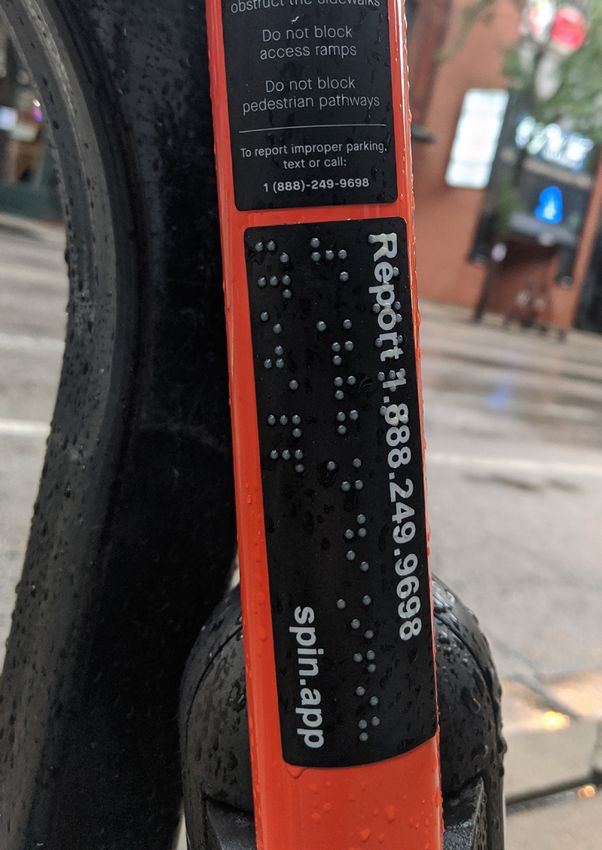
The Role of Scooters in the Transportation Network

On average, 7,415 e-scooters per day were deployed and available on
Chicago’s streets during the 2020 pilot. The City estimates that 540,035       540,035
                                                                               Total mobility trips
trips were taken during the pilot, equating to an average of 0.59 trips per
                                                                                  for analysis
e-scooter per day. Approximately 125,000 (23%) of all trips originated in
the Equity Priority Area. In general, e-scooters were used primarily for
shorter-distance trips. The average trip distance was 2.10 miles and av-
erage trip duration was 18.50 minutes.
                                                                                4,391
When e-scooter riders were surveyed about how they would travel if an            Avg daily trips

e-scooter was not available, walking and biking were the most common
modes mentioned as likely alternatives. Some riders reported that they
would have used ride hail or driven alone instead. An overwhelming ma-
jority of e-scooter riders surveyed (90%) agreed e-scooters made it eas-       10,735
ier to reach a destination or complete a trip, and 60% agreed that shared        Most trips in a
e-scooters are useful in meeting daily transportation needs.                   single day (Sept 5)

When e-scooter riders were surveyed about where they rode e-scooters

                                                                                23.4%
to, no dominant trip purpose was identified. Approximately one third
of riders said they “sometimes” or “often” used e-scooters to make so-
cial visits, to ride for enjoyment, to attend recreational activities, or to    Share of trips in
                                                                               Equity Priority Area
do household errands. Riders who live in the Equity Priority Area were
1.6 times more likely to say they “sometimes” or “often” used a shared
e-scooter to get to or from work than riders citywide. E-scooter trips
were concentrated on Friday through Sunday with over half of all trips
made on these three days of the week.

Compared to Chicago’s overall population, shared e-scooter riders in the
2020 pilot were almost twice as likely to be in the 25-34 age group, almost
twice as likely to have a Bachelor’s degree, 1.7 times more likely to iden-
tify as white than average, and 1.3 times more likely to identify as male
than average. Despite the overall demographic profile of scooter riders,
nearly 25% of the trips in the 2020 scooter pilot started or ended in the
Equity Priority Area. Outside the Equity Priority Area (where companies
had no requirement to deploy e-scooters), trips origins were heavily con-
centrated in just a few Chicago Community Areas on the North and Near
West Sides of the city.

5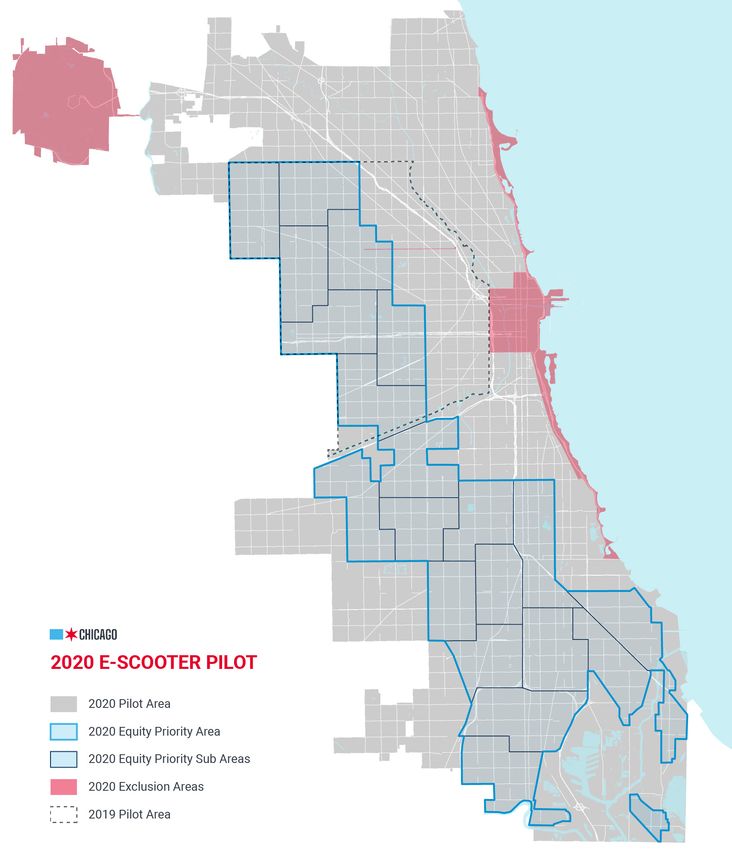
E-Scooter Operations & Enforcement

During the 2020 pilot the City of Chicago tested a
number of operational requirements which resulted
in improved performance. In general, in 2019 and
2020, geofencing to exclude scooters from areas
where they were not allowed to operate was largely
successful -- geofenced areas included the Central
Business District, the 606, Lakefront Trail, and certain
college campuses. The 2020 pilot tested a require-
ment that e-scooters must be locked to a fixed ob-
ject to end a trip. This also improved operations and
reduced calls to 311 regarding parking complaints.

Concern over e-scooters operating on the side-
walk remained high in 2020 even though only
one official 311 complaint was logged regarding
sidewalk riding. On their pilot applications, scoot-
er vendors committed to bringing sidewalk riding
detection technology to demonstrate in the city.
However, no vendors ultimately deployed this
technology during the pilot.

BACP conducted a total of three field and data en-
forcement missions during 2020 to test vendor
compliance with pilot terms and conditions. The vast
majority of the violations noted during the pilot were     Credit: Spin
for not achieving the e-scooter coverage and fleet
rebalancing requirements in the Equity Priority Area.
All vendors ultimately came into compliance on the
rebalancing requirements. The City also attempted
to measure injury risks associated with e-scooters
in partnership with the Chicago Department of Pub-
lic Health. The normalized rate of e-scooter-related
emergency room visits per scooter trip was 0.27 per
100,000 trip records. However, most injuries record-
ed were relatively minor injuries to the scooter users
themselves, not to other people.

 6
Access and Availability                                Share of Devices Deployed (per square mile),
                                                       by Community Area

In 2020, the City refined the Equity Priority Area
concept by requiring companies to rebalance
their fleet twice per day to meet fleet the cover-
age and distribution targets. This was based on a
2019 pilot observation that e-scooters deployed
into Priority Areas would move out of the area
over the course of the day. The refined 2020 pilot
led to good scooter access, with approximate-
ly 90% of the Equity Priority Area being within a
5-minute walk of an e-scooter.

The City did not set the prices that vendors could
charge for e-scooters in either the 2019 or 2020
pilots. All vendors priced e-scooters with a $1
unlock fee and a per-minute cost. In 2020, the
typical per-minute was $0.39. Two vendors of-
fered discounts on the per-minute fees for trips
that started or ended in the Equity Priority Areas.
Without discounts, the typical cost of the average
18.5 minute e-scooter trip was approximately $8
in 2020. All three vendors offered cash-based ac-
cess options, and all three vendors offered a text-
                                                                        $8
                                                                 Typical cost of the
to-ride feature for riders without a smartphone.                average 18.5 minute
Usage of both of these programs was too low to                  e-scooter trip in 2020
draw any meaningful insights.

Operators were strongly encouraged, but not re-
quired, to deploy seated devices that provide a
more accessible option for riders with disabilities.                 56%
All three vendors deployed only a very small num-                Share of riders who
ber of seated devices, they were never available                 agreed e-scooters
                                                                  were affordable
on operators’ apps as part of the shared fleet, and
these devices were deployed only in the closing
weeks of the pilot.

7
Public Opinion

In general, the city received fewer complaints
related to pilot in 2020 than in 2019. For exam-
ple, 311 reports dropped 75% when factoring in
the increased number of devices. Nearly half of
the 311 complaints logged in 2020 did not list
a clear complaint or indicated complaints that                                        Credit: Spin
were actually not a violation of the pilot terms.
Over 20% of the 311 calls were for e-scooters
locked to private property, especially fences.

E-scooter riders and non-riders had differing
opinions on the future of scooters in Chicago:
88% of e-scooter riders indicated that scoot-
ers should be part of Chicago’s transportation
system, while 65% of non-riders thought that
                                                                                       Credit: Bird
shared e-scooters should not be available in
Chicago. Riders generally wanted to see fur-
ther improvements in the e-scooter systems
including payment integration (such as Ventra
or Transit app) and equipment upgrades like
seated scooters, improved brakes, and larger
wheels. Sidewalk riding and e-scooter parking,
especially on residential streets, were major
pain points in 2020 for non-riders.
                                                                                      Credit: Lime

        -75%                                 88%                            31%
     Decline in e-scooter-             Shared of riders surveyed    Shared of non-riders surveyed
     related 311 reports-             who said shared e-scooters     who said shared e-scooters
     per-device-deployed              should be part of Chicago’s    should be part of Chicago’s
    compared to 2019 pilot               transportation future          transportation future

8
Looking Ahead

Based on survey results of scooter riders in 2019
and 2020, e-scooters appear to serve as useful
transportation for some people. The reported trip
purposes, reported substitution of ridehail and
drive-alone trips with e-scooters, and data on
trip lengths suggest that e-scooters fill a mobility   Credit: Spin
need for short trips.

Several technologies and features tested in 2020
were successful at managing e-scooter opera-
tional issues, particularly geofencing and lock-to
parking requirements. On the other hand, concern
about sidewalk riding remained very high -- al-
though the nature of the actual problem is hard
to quantify with data. Scooter vendors recognize
                                                       Credit: Bird
this concern and have indicated to the city that
technologies like sidewalk riding detection could
address this issue, but no such technologies were
delivered in either the 2019 or 2020 pilot.

Results from the 2020 and 2019 pilots reiter-
ate the importance of managing e-scooter
supply to balance scooter availability and sys-
tem usability with potential oversaturation and
clutter in the public way. The Equity Priority
Area measures tested in 2019 and 2020 also
demonstrate the need to actively manage cov-
erage, distribution, and rebalancing standards
for e-scooter fleets. Outside the Priority Areas,
e-scooters and e-scooter use clustered in a
few neighborhoods. However, when the city set
strong equity-based targets for coverage and
distribution, vendors were able to deploy and
balance their fleets accordingly, and people
rode e-scooters.

9
About the 2020 Pilot
Pilot Purpose

In June 2019, the Department of Business Affairs and Consumer Pro-

                                                                             24
tection (BACP) in conjunction with the Chicago Department of Trans-
portation (CDOT) launched an e-scooter pilot which ran from June 15,                  months
2019 to October 15, 2019 under an Emerging Business Permit (EBP).           Maximum lifespan
                                                                             of an Emerging
EBPs are issued by BACP for a non-renewable two-year period, allow-
                                                                             Business Permit
ing the City to test innovative businesses that do not fall under current
license structures.

Under the original EBP, the City ran a second pilot in 2020 that last-       123         days
ed from August 12, 2020 to December 12, 2020 with three participat-          Duration of both
                                                                            the 2019 and 2020
ing vendors: Bird, Lime and Spin. The purpose of the 2020 pilot was           e-scooter pilots
to further learn how scooters function within Chicago’s transportation
system. The 2020 pilot terms were adjusted from those in 2019 based
on performance, feedback from the public, and input from an advisory                3
group consisting of community, business, and advocacy organizations.         Vendors selected
A summary of community questions and objectives for the 2020 pilot          to operate in 2020
                                                                              e-scooter pilot
is available in the Appendix. Three main themes emerged to explore in
the 2020 pilot.

Role in the transportation network: How are e-scooters used citywide?
                                                                                    4
                                                                             Vendors applied
                                                                            to operate in 2020
Dangers, inconveniences, and non-compliance: How might these be               e-scooter pilot
limited or mitigated?

Coverage, distribution, and equitable access: How successfully and                10
                                                                            Vendors participated
uniformly can vendors operate in a large citywide service area and how
                                                                             in the 2019 pilot
might vendors address potential economic, health, or accessibility barri-   and were eligible to
ers to using e-scooters?                                                    apply to operate in
                                                                                 2020 pilot

10
Overview of 2020 Pilot Terms
Number of Vendors: Whereas the 2019 pilot had 10 participating vendors, the 2020 pilot was limited
to 3 vendors to reduce the administrative burden on the City staff and to improve the rider experience.
Vendors were selected through an application process consisting of questions and criteria designed to
determine if a vendor would be able to meet the City’s objectives, terms, and conditions for the EBP. Four
vendors responded with a complete application, and the City selected the 3 highest-scoring applicants.
Coverage and Distribution: The e-scooter pilot area was expanded to cover nearly the entire city, an
area four times larger than that tested in the 2019 pilot. In addition, the Chicago Department of Public
Health (CDPH) Healthy Chicago 2.0 Economic Hardship Index and additional mobility and demo-
graphic factors were used to define an Equity Priority Area where residents face elevated economic,
health and mobility barriers, covering approximately 45% of the pilot area. The Priority Area was sub-
divided into 20 smaller sub-areas, and each vendor in the pilot was required to deploy 2.5% of their
e-scooter fleet to each sub-area to try and achieve availability of e-scooters across the city.
212 sq mi
Size of the 2020
pilot area
50 sq mi
Size of the 2019
pilot area
45%
Share of pilot area
designated as an
Equity Priority Area
2.6 million
Total population of
pilot area
11Fleet Size: The total size of the pilot was in-
creased to 10,000 e-scooters to reflect the
larger geographic area of the 2020 pilot. Each
vendor was required to ramp up to and main-
tain a fleet of between 3,000 and 3,333 devices
during the pilot.
Fleet Management: E-scooters could remain out
on the streets overnight but were not available
for public use to try and reduce the traffic and air
quality impacts of vendors being required to col-
lect all e-scooters each night and re-deploying
them each morning.
Parking: Unlike the 2019 pilot, all e-scooters in
the 2020 pilot were required to be equipped with
locks, and users were required to lock scooters
to a fixed object in the public right of way (e.g.
bike rack, street sign) at the end of their trip. The
purpose of this requirement was to try and re-
duce clutter and obstruction of the sidewalk.
Full terms of the 2020 pilot and vendor selection pro-
cess are available at: www.chicago.gov/scooters.
Key aspects of the pilot terms that were not
changed from 2019 include the following:
Credit: Spin
Time and Duration: The pilot lasted four
months with scooters allowed to operate from
5am-10pm.
Use Restrictions: E-scooter riding was prohibit-
ed on all sidewalks, the Bloomingdale Trail (the
606), the Lakefront Trail, and the Central Busi-
ness District (CBD).
12E-Scooter Technology: Devices were required to be capped at a maxi-
mum speed of 15 MPH and meet standards on braking, visibility (lights
and reflectors), bells and device size.
Administrative Fees: Vendors were charged an upfront fee of $1/day/
15 mph
Maximum allowed
device to cover the costs of administering the pilot. e-scooter speed
The 2020 pilot also requested the testing of various new vendor provided
technologies and features including seated scooters (see p. 39), sidewalk
riding detection (see p. 25), new rider education requirements (see p. 30)
and other concepts such as “helmet selfies.”
Data Collection and Evaluation
Information presented in this report is drawn from several sources to
capture both quantitative information as well as qualitative feedback.
• Mobility Data Specification (MDS) data feeds provided by vendors
to the City which contained information on devices deployed and
trips made1 2 million
Total individual data
• 311 data for resident issue reports
“events” collected
• An online feedback tool to gather information from both riders and via MDS feeds
non-riders
• A survey developed for and administered to shared e-scooter riders
CDOT partnered with Dr. Abolfazl Mohammadian and Dr. Ehsan Rahimi 2,400
from the University of Illinois at Chicago’s (UIC) Department of Civil, Completed
Materials, and Environmental Engineering to develop a shared e-scoot- responses received
to rider survey
er rider survey. This collaboration produced a survey and distribution
methods that achieved a representative sample, allowing responses to
provide a strong and reliable understanding of shared e-scooter riders,
their habits, their experiences, and their feedback.
1
The City did not have access to any personal rider information attached to trips. Further, individual trip timestamps were rounded to the
nearest hour and the accuracy of start/end locations was also rounded off prior to analysis to further avoid identifying personal movements.
13The 2020 Pilot in Context
Results between the 2019 and 2020 pilots cannot be directly com-
pared since pilot terms were modified in 2020 based on 2019 learnings.
Notably, the 2020 pilot served a much larger service area during the 58
COVID-19 pandemic. The 2020 pilot
launched 58 days
further into the
Additionally, it is very difficult to understand the full nature and extent of calendar year
impacts the COVID-19 pandemic may have had on shaping outcomes in compared to the
the 2020 pilot. As COVID mitigations, e-scooter operators were required 2019 pilot
to clean key device points (e.g. handlebars) every time a staff member or
contractor came into contact with a device. Some potential effects of the
pandemic to consider include the following:
147
For every degree
Weather and season: COVID-19 delayed the launch of the 2020 pilot, increase in daily
which ran from mid-August through mid-December, whereas the 2019 high temp, 147
pilot ran from June through October. A regression analysis was con- more e-scooter
trips could be
ducted to compare total daily trips with daily high temperature, daily low expected
temperature, and daily precipitation. This analysis found a statistically
significant correlation: for every degree increase in daily high tempera-
10%
ture 147 more e-scooter trips are expected (all else equal). No significant
relationship was identified between precipitation and trips. See Appendix
for more detail. Non-e-scooter
users surveyed
that said COVID-19
COVID-related restrictions on activities: Approximately 10% of non- prevented them
e-scooter users surveyed said COVID-19 prevented them from using a from using a shared
e-scooter
shared e-scooter because they did not feel safe or did not have anywhere
to go. Nevertheless, Chicago’s Divvy bikeshare system saw record rider-
ship in August, September, and October 2020.
14E-Scooter Use Supply of E-Scooters for Trips Each of the three vendors in the pilot could deploy up to 3,333 devices and were required to deploy at least 3,000 devices. Vendors could slowly ramp up device deployment in the first few weeks of the pilot and ramp down in the final few weeks. On average, 7,415 e-scooters were available in Chicago during the pilot, and device availability peaked on October 26, 2020, at 9,091 devices. Average Daily Device Deployments, by Vendor Device Distribution Heatmap Snapshots September 12 October 12 November 12 15
Number of Trips

A total of 630,616 total trip records were created during the 2020 pilot.
After processing the data to remove records that were too short in time
                                                                                630,616
                                                                                 Total trip records
or distance to represent actual trips, the City estimates that 540,035 trips
were taken during the pilot. Approximately 126,000, or 23%, of those trips
started in the Equity Priority Area.

Daily trip rates peaked in September at 6,642 trips/day on average and          540,035
then declined by approximately 40% month-over-month through October,            Total mobility trips
                                                                                   for analysis
November, and December.

Whereas all vendors had the same requirements to supply e-scooters

                                                                                 4,391
(fleet size, availability, and distribution), customer demand (use) varied by
vendor. 28.2% of trips during the pilot were on Bird e-scooters, 43.7% on
Lime e-scooters, and 28.0% on Spin e-scooters.                                    Avg daily trips

Average Trips/Day

7,000
6,000
                                                                                10,735
                                                                                  Most trips in a
5,000
                                                                                single day (Sept 5)
4,000
3,000
2,000

                                                                                 23.4%
1,000
      0
             August     September      October      November      December
                                                                                 Share of trips in
     Total   5,944         6,642         4,223        2,516         1,293
                                                                                Equity Priority Area
     Bird    1,867         2,043         1,086         574           241
     Lime    2,067         2,771         2,066        1,309          696
     Spin    2,009         1,828         1,071         633           356

                                                                                126,462
                                                                                Total trips in Equity
                                                                                   Priority Area

16
Transportation Choice/ Travel Behaviors:
As there is no standard unit to compare demand between different travel
modes and services in the City, it is difficult to understand the significance
of e-scooter use with respect to other options. Walking, biking, taking transit,
and driving, all have different levels of cost, availability, speed, comfort, and
2.1
supporting infrastructure, each of which is a key factor to determine how
many trips want to be taken, can be taken, and are taken by each mode. miles
82,700 people walk to work in Chicago.2 During the 2020 pilot, approximate- Avg trip distance
ly 12,500 trips/day were made on the Divvy bikeshare system which had a
fleet size of approximately 9,000 bikes. CTA ridership on an average weekday
during the pandemic was 303,000 on buses and 154,000 on rail. CTA rider-
ship on an average day before COVID was 700,000 each on buses and rail.
18.5 min.
Avg trip duration
Utilization:
0.59
Utilization or trips-per-deivce-per-day is a common industry metric of
e-scooter supply and demand relative to a given fleet size. In 2020, this
metric averaged 0.59 trips-per-device-per-day citywide, 0.26 in the Equity Avg trips per
device per day
Priority Area, and 0.97 outside the Equity Priority Area. These low utiliza-
tion rates mean that the average e-scooter sat unused for the vast ma-
jority of the day. In 2019, the pilot averaged 3.0 trips-per-device-per-day,
although several differences could have influenced this, including the ser-
vice area of pilot area being limited to neighborhoods with higher popula-
tion density, the cost of trips being higher in 2020, and potential impacts
of COVID. Utilization in 2020 also varied by vendor and by month.
Trips-per-Device-per-Day
August September October November December
Bird 1.6 1.0 0.5 0.3 0.1
Lime 1.4 1.1 0.6 0.4 0.2
Spin 1.0 0.6 0.3 0.2 0.2
Total 1.3 0.9 0.5 0.3 0.2
Users and Use
When asked how frequently they had taken a shared e-scooter trip in the 8.5%
last month, the majority of riders (59%) said they took 1-3 trips, including Share of riders who
23% of riders who took one trip. 8.5% of riders said they took more than took more than 10
e-scooter trips in
10 trips in the last month, and survey results indicate that this relatively
the last month
small group of riders took more than one third of all trips.
2
Source: US Census Bureau and http://www.activetrans.org/sites/files/2020regionalmodesharereport.pdf
17Distance and Duration of Trips Avg Trip Distance (miles),
by Community Area
Trip distance, trip duration and calculated trip
speed varied inside and outside the Equity Pri-
ority Area.
Distance: The average distance of an e-scooter
trip in 2020 was 2.10 miles citywide, 2.57 miles
in the Equity Priority Area, and 1.95 miles outside
the Equity Priority Area.
Duration: The average e-scooter trip lasted
18.50 minutes citywide, 27.64 minutes in the Eq-
uity Priority Area, and 15.62 minutes outside the
Priority Area.
Speed: The calculated end-to-end trip speed of
e-scooter trips was 6.8 MPH citywide, 5.6 MPH in
the Equity Priority Area, and 7.5 MPH outside the
Priority Area.
Avg Calculated Trip Speed (mph),
It is possible that increased trip distance within by Community Area:
the Priority Area is related to different land use
patterns or a lower population density within the
Priority Area. However, it is not understood at this
time why trips within the Priority Area took longer
to cover a given distance (i.e. were slower).
Overall, average trip lengths in the 2020 pilot
were 40% longer than in 2019. This trend of in-
creased trip distance was also observed in peer
city e-scooter programs and in Chicago’s Divvy
bike system. It is possible that this trend is relat-
ed to an overall shift in trip patterns due to the
COVID-19 pandemic.
18Location of Trips Total Trips per Square Mile,
by Community Area
Trips made have been classified by where the
trip started. A substantial number of trips start-
ed in Community Areas on the North and Near
West sides of the city, with 60% of all trips during
the pilot originating in just eight of the city’s 77
Community Areas, and 29.2% of trips originating
in Lake View and Lincoln Park which account for
only 2.9% of the total pilot area and 6.5% of the
population. Approximately 23.4% of all trips orig-
inated in the Equity Priority Area, which covered
approximately 45% of the pilot area and account-
ed for 44.7% of the population.
When adjusting for the varied geographic size
and population of different community areas,
Lake View and Lincoln Park still top the list, with
the highest number of trips per square mile hap-
pening in Lake View and the highest number of
trips per person happening in Lincoln Park. Total Trips per 1,000 Residents,
by Community Area:
Top-10 Community Areas by Trips:
Community Trips/ Trips/ Total Share
Area Pop* Sq Mi Trips Trips
Lincoln Park 1,014 21,979 69,628 12.9%
Lake View 877 28,150 88,066 16.3%
West Town 628 11,541 52,808 9.8%
Hyde Park 572 9,704 15,701 2.9%
Near West Side 446 4,905 27,887 5.2%
Uptown 422 10,517 24,557 4.5%
Logan Square 352 7,097 25,470 4.7%
Near North Side 274 8,915 24,519 4.5%
Edgewater 227 7,382 12,830 2.4%
Rogers Park 143 4,230 7,778 1.4%
*per 1,000 residents
19Timing of Trips
E-scooter trips were more likely to happen between Friday and Share of Trips by Day of Week:
Sunday with over half of all trips made on these three days Day of Week Share of Trips
of the week. During the 2019 pilot, weekday trips followed a Sunday 15.7%
somewhat traditional commuting pattern with an uptick in the Monday 11.2%
morning and a clear peak in the late afternoon. By contrast, Tuesday 11.0%
in 2020 trips gradually increased through the day to a peak in Wednesday 13.3%
mid-to-late-afternoon. It is possible that this shift in the time of Thursday 13.2%
trip making is related to the disruption of traditional commut-
Friday 16.2%
ing during the COVID-19 pandemic and a relatively greater use
Saturday 19.3%
of e-scooters for non-work trips in 2020 than 2019.
Average Daily Trips by Start Hour (2020):
Average Daily Trips by Start Hour (2019):
20Purpose of Trips Among all riders, 90% agreed e-scooters make it easier to reach a destination or complete a trip, and 60% agreed that shared e-scooters are useful in meeting their daily transportation needs. Shared e-scooter riders surveyed were asked how often in the past month they used a shared e-scooter for various purposes. The results below are the share of riders who responded “some- times” or “often,” as opposed to “once” or “never.” There was no single trip purpose that overwhelm- ingly characterized how and why e-scooters were used. Approximately one third of riders said they “sometimes” or “often” used e-scooters to make social visits, to ride for enjoyment, to attend recre- ational activities, or to do household errands. Riders who live the Equity Priority Area were 1.6 times more likely to say they sometimes or often used a shared e-scooter to get to or from work. Percent of E-scooter Riders Who Indicated an E-scooter Trip Purpose “Sometimes” or “Often” Trip Purpose All Priority Area Black or African American Hispanic or Latino Visiting friends/relatives 34% 37% 41% 37% Riding around having fun 33% 39% 48% 42% Attending recreational activities 31% 30% 33% 33% Doing household errands 30% 33% 43% 32% Eating meals outside of home 24% 30% 33% 26% All other shopping activities 24% 26% 34% 30% Routine Shopping (e.g. groceries) 23% 25% 34% 28% Going to or from the workplace 16% 26% 27% 23% Health care appointments 11% 11% 17% 11% Priority Area = Residents whose self-identified home zip codes fell within the Equity Priority Area 21
Alternate Mode Choice for E-scooter Trips

Shared e-scooter riders surveyed were asked what alternate travel mode
they would have used if an e-scooter had not been available for their                                  29.5%
most recent trip. Among all e-scooter riders, 53.2% said they would an-                                Share of e-scooter
ticipate choosing to walk or bike instead, 29.5% would choose to drive                                trips that replaced a
                                                                                                           vehicle trip
or use ride-hail instead, and 11.6% would choose to take transit instead.
4.5% of riders reported they would have not made a trip at all.

Substitute Mode Choice for Most Recent E-scooter Trip (by Share of Trips)
60%
50%
40%
30%
20%
10%
 0%
		  All Priority Area                                                Black or        Hispanic or
				                                                                  African          Latino
				                                                                 American
     Vehicle Trip                   29.5%             24.7%           25.6%            26.9%
     Walking or Bicycle Trip        53.2%             50.2%           42.2%            47.1%
     Transit Trip                   11.6%             19.4%           22.2%            19.7%

Priority Area = Residents whose self-identified home zip codes fell within the Equity Priority Area

Interactions with Transit Use:
E-scooters have the potential to interact with transit in two ways:

     Complementary: 36% of shared e-scooter riders in 2020 said they used
                                                                                                          36%
                                                                                                      Share of e-scooter
     an e-scooter to get to or from a CTA bus, CTA rail or Metra. Survey re-                          riders who used an
     sults indicate that 36% of e-scooter riders used CTA rail almost daily                           e-scooter to get to
                                                                                                       or from transit at
     before the COVID-19 pandemic and 24% used CTA buses almost daily.                                     least once

     Substitution: COVID-19 had a specific impact on transit mode choice.

                                                                                                         1.0%
     Approximately 22% of e-scooter riders surveyed said they “often” used
     an e-scooter to avoid using transit because of COVID-19 concerns.
                                                                                                      Avg daily e-scooter
                                                                                                       trips compared to
Overall, the average daily trips on e-scooters in the 2020 pilot (4,500/
                                                                                                      avg daily CTA trips
day) equates to 1.0% of total CTA average daily weekday ridership
(457,000/day) during the pilot.

22
Interactions with Divvy Use:
E-scooters have the potential to interact with bikeshare in three ways:
New market segment: Half of e-scooter riders said they “never” used
Divvy, suggesting that shared e-scooters introduced many riders to 50%
shared micromobility. Share of e-scooter
riders who said they
have never used
Complementary: 23% of shared e-scooter riders reported also having
Divvy
a Divvy membership.
19,756
Substitution: When 2020 shared e-scooter riders were asked to con-
sider their most recent shared e-scooter trip, 10% said they would have
used Divvy if an e-scooter had not been available. This potentially rep- Avg Divvy trips/day
in August 2020, a
resents approximately 520 trips per day, or about 4% of Divvy’s average
system record
daily ridership during the pilot.
Overall, August, September and October 2020 all saw record monthly rid-
ership for the Divvy system. August 2020 was the highest-ever ridership
month for Divvy (19,756 trips/day) since the system launched in 2013.
Detailed Substitution Mode Choice for E-Scooter Trips (by Share of Trips)
Trip Purpose All Priority Area Black or African American Hispanic or Latino
Walked 39.5% 42.4% 34.8% 37.9%
Ride-Hail (Uber, Lyft, Via) 18.9% 13.1% 12.6% 14.2%
Personal Vehicle 10.5% 11.2% 12.2% 12.7%
Divvy Bikeshare 9.8% 4.6% 3.5% 5.2%
CTA Bus 8.2% 14.5% 18.3% 14.5%
No Trip 4.5% 3.2% 7.0% 4.3%
Personal Bicycle 3.9% 3.2% 3.9% 4.1%
CTA Train 3.2% 4.2% 3.0% 4.9%
Other 0.9% 2.5% 2.2% 2.0%
Personal Scooter 0.3% 0.0% 0.9% 0.0%
Taxi 0.1% 0.4% 0.9% 0.0%
Pace Bus 0.1% 0.7% 0.9% 0.3%
Metra Train 0.0% 0.0% 0.0% 0.0%
Priority Area = Residents whose self-identified home zip codes fell within the Equity Priority Area
23Who Made E-scooter Trips Compared to Chicago’s overall population, shared e-scooter riders in the 2020 pilot were almost twice as likely to be in the 25-34 age group, almost twice as likely to have a Bachelor’s degree, 1.7 times more likely to identify as white than average, and 1.3 times more likely to identify as male than average. E-Scooter Users Reported Demographics Age E-Scooter Riders Chicago Residents Over 18 18-24 18.0% 12.1% 25-34 54.0% 24.9% 35-44 20.0% 18.3% 45+ 8.0% 44.7% Education E-Scooter Riders Chicago Residents Over 25 High School or Less 5.5% 36.3% Some College or Associate Degree 19.0% 22.4% Bachelor’s Degree 50.0% 23.9% Graduate or Professional Degree 24.0% 17.0% Race and Ethnicity E-Scooter Riders Chicago Residents White, not Hispanic or Latino 59.0% 33.3% Black or African American 11.0% 29.6% Hispanic or Latino 16.0% 28.8% American Indian or Alaska Native 1.0% < 1% Asian 8.0% 6.6% Native Hawaiian or Pacific Islander 1.0% < 1% Gender E-Scooter Riders Chicago Residents Female 37.41% 51.3% Male 60.1% 48.7% Other 0.92% not captured by census data Prefer Not to Answer 1.57% not captured by census data Household Income E-Scooter Riders Chicago Residents Less than $50,000 29.4% 42.3% $50,000 - $100,000 35.9% 25.4% $100,000 - $150,000 16.3% 14.7% More than $150,000 18.5% 17.6% 24
Safety, Satisfaction and Compliance
Sidewalk Riding

Sidewalk riding remained the top issue among non-riders surveyed, with 88% agreeing that people riding
e-scooters on the sidewalk was concerning to them. However, only one 311 complaint was recorded
regarding sidewalk riding. While it was not a requirement, two vendors indicated in their pilot applica-
tions that they would deploy sidewalk riding detection technology to alert riders to correct their behavior
during the pilot. However, neither vendor ultimately deployed the technology during the pilot. To date, no
e-scooter vendor has proven sidewalk riding detection technology on a large scale in the US.

Geofences

Geofences are digital fences that communicate with e-scooters to slow and/or stop if they enter a re-
stricted area where e-scooters are not permitted. Major geofences in the 2020 pilot were the Blooming-
dale Trail (the 606), Lakefront Trail, Central Business District, and portions of the campuses of DePaul
University, Loyola University, the University of Illinois at Chicago and the University of Chicago. Data and
anecdotal evidence indicate that, compared to the 2019 pilot, geofences in the 2020 pilot performed
very well, potentially due to improved device technology/operator implementation and revised geofenc-
ing strategies by the City. Overall, based on device data tracking, the average non-compliance rate of
geofences of the Lakefront Trail and Central Business District was two-tenths of one percent (0.2%)

•    DePaul University was proximate to a major node of scooter deployments and ridership. The
     University reported consistent issues of e-scooters being left on campus property. DePaul offi-
     cials also reported that it was difficult to contact vendors to correct issues, noting that it often
     took over an hour to get through to report an issue.

•    On the Lakefront Trail, resident complaints and reports from the Park District early in the pilot
     indicated that some e-scooter riders were consistently accessing and riding along the trail. In
     response, the City mandated vendors implement specific geofences at Lakefront Trail access
     points, after which reports of e-scooters on the Trail and instances of devices appearing on the
     Trail on data feeds were negligible

Geofence Violations on Lakefront Trail and in Central Business District

		                                                  Bird                  Lime              Spin
 Lakefront Trail devices per day                    1.7                   0.6               0.4
 Central Business District devices per day          4.4                   3.4               2.8
 Total average devices deployed per day             1,795                 2,695             2,581

25
E-Scooter Parking Feedback and pilot data indicate the device lock- ing requirement substantially improved parking performance over the 2019 pilot. An observation- al survey over three days of 261 devices in Lake View and Lincoln Park (which saw among the highest densities of devices) found that 97.3% of devices were locked and parked correctly. Reports of improper parking were significantly reduced in 2020: to 0.16 complaints per 1000 devices per day compared to 0.72 in 2019. This translates to approximately one complaint per day on aver- age during the 2020 pilot. However, survey data of non-riders reveal a split sentiment on parking: 40% said the locking requirement helped improve parking issues, and 40% said it did not. The most common complaint filed with 311 (73 reports) was about e-scooters locked to private property—typically fences. The second most common complaint filed with 311 (39 reports) was that an e-scooter was locked to a municipal sign pole posting a Residential Disabled Parking permit space. The City relayed these reports to vendors to rectify with extra urgency. The City re- served the right to confiscate an e-scooter that was in violation of pilot rules if thevendor did not resolve the issue within two hours. The City re- trieved one scooter locked to a municipal sign pole marking a Residential Disabled Parking per- mit space. Anecdotal input received from com- munity stakeholders and leaders focused on concerns over the quantity of scooters locked in the public right of way, even if they were locked appropriately. Parking of e-scooters in the park- ways on residential streets, while allowed, was often a concern for some. 26
People with Disabilities:
Among non-rider survey respondents with dis-
abilities, 44% agree that the locking requirement
was helpful, and the Mayor’s Office for People
with Disabilities reports it heard no specific con-
cerns about e-scooter parking in 2020, compared
to frequent concerns in 2019. However, 50% of
non-rider survey respondents with disabilities
said that e-scooters parked on sidewalks were
“often” a danger or inconvenience and 66% that
e-scooters parked on sidewalks made it more
difficult to access a bus stop or train station.
New in 2020, devices were required to have con-
tact information in braille and raised lettering to
make it easier for residents with visual impair-
ments to contact e-scooter vendors. About 1.5%
of non-rider survey respondents with disabilities
said they contacted an e-scooter vendor using
braille on a device. The City also received feed-
back from people with disabilities that braille
on some devices was in very small print and
difficult to access, located at the bottom of the
e-scooter’s stem.
Bird educational messaging on proper parking
practices to keep pathways clear (credit: Bird)
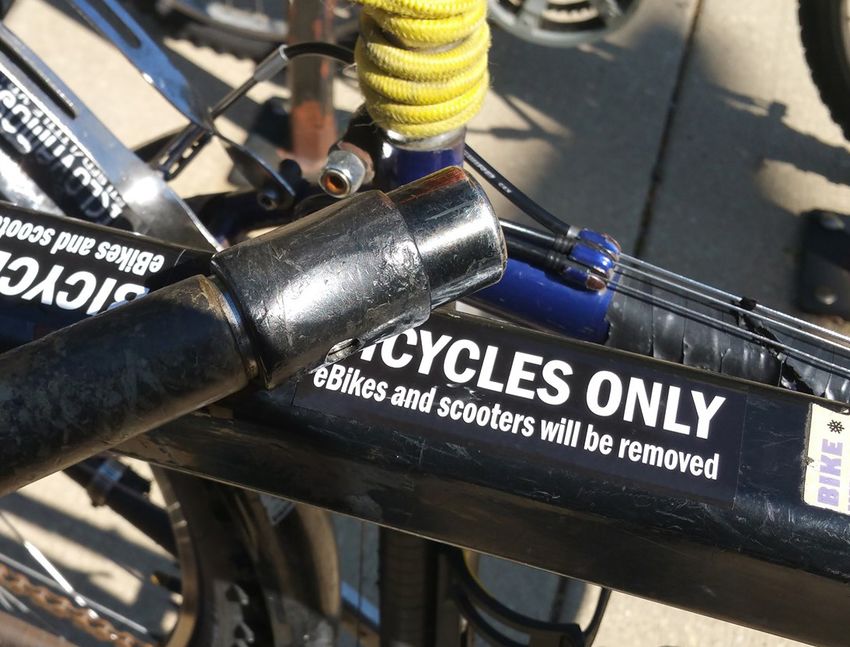
27Conflicts with Bike Parking:
The City’s Municipal Code allows scooters and
other similar devices (both shared and private-
ly-owned) to park at and lock to bike racks. The
City worked closely with vendors to implement
best practices for parking methods to mitigate
the effect of e-scooter deployments on bike
parking. As the pilot progressed, e-scooter oper-
ators adjusted parking methods with the goal of
Credit: @hieronymus_burp
leaving sufficient parking available for bicycles.
The photos at right show an example of a ven-
dor taking up a large share of bike rack parking
in the first week of the pilot and their response
following resident complaints
The City received feedback from residents who
felt e-scooters should not be allowed to park
at bike racks as well as feedback that scooters
and bikes using the same racks was accept-
able. Opinions were most strong among non-
e-scooter riders who say they use a personal
bicycle often or almost daily, with 65% of these
respondents agreeing that the e-scooter locking
requirement made it more difficult to find bike
parking. The city observed rogue “bicycles only”
stickers applied to some city bike racks. 311 re-
ceived a total of four reports (out of 337 total
reports) of e-scooters creating a conflict with
available bike parking.
Credit: @streetsblogchi
28Rider Safety
Survey results indicate that roughly half of Chicagoans feel there is room to improve scooter safety.
45% of riders say they want safer devices, and 56% of non-riders (and 72% of non-riders with a dis-
ability) said they did not use an e-scooter because they were concerned about safety.
Injuries:
A total of 171 probable emergency department visits due to e-scooter incidents were recorded
during the 2020 pilot, compared to 192 in the 2019 pilot. The normalized rate of scooter-related ER
visits per scooter trip was slightly higher in 2020 than 2019 (0.27 per 100,000 trip records in 2020 vs.
0.23 per 100,000 trip records in 2019) 93% of recorded ER visits related to e-scooters were e-scooter
riders themselves, and 5% were pedestrians injured by an e-scooter. No patients were admitted to
the hospital due to an ER visit, and 98% of patients were discharged with non-serious injuries.
Riders identifying as Black and Latinx were disproportionately represented (when correcting for the
share of trips made) in records of ER visits related to e-scooters. The reason for this is not known.
Although riders were required to be age 18 or older to operate a shared e-scooter, 22 reported inju-
ries were of minors. See following page for an important note on injury data.
Reported Emergency Department (ED) Visits by Age
80%
60%
40%
20%
0%
5-11 12-17 18-24 25-44 45-64 65+
Share of Riders* 0.0% 0.0% 17.8% 73.8% 8.1% 0.3%
Share of Reported ED Visits 2.3% 10.5% 26.9% 43.3% 15.2% 1.8%
Reported Emergency Department (ED) Visits by Race/Ethnicity
80%
60%
40%
20%
0%
Black, Latinx White, Other, Asian,
non-Latinx non-Latinx non-Latinx non-Latinx
Share of Riders* 10.5% 16.0% 59.5% 6.0% 8.0%
Share of Reported ED Visits 33.3% 28.3% 28.3% 4.4% 1.3%
*Based on rider survey
29Helmet Use and Availability:
According to survey results, 25% of e-scooter riders
say they wore a helmet sometimes (32% in the Equi-
ty Priority Area) and 9% say they wore a helmet often.
Per the terms of the pilot, vendors were required
to offer riders free helmets. Vendors reported giv-
ing away a total of 998 free helmets, including 718 Credit: Spin
from Spin, 200 from Lime and 80 from Bird. Two
operators—Bird and Lime— stated in their pilot ap-
plications that they would implement “helmet sel-
fie” incentives: riders take a selfie in the e-scooter
app and earn ride credits if the app sees the user
wearing a helmet. Lime was not able to deploy the
technology. Bird reported 87 selfies collected.
Education and Communication:
Credit: Spin
Vendors were required to meet new education re-
quirements in 2020 for e-scooter riders and the pub-
lic. Vendors largely communicated rider education
through their apps, pushing messages about safe-
ty and rules of operation—with a special focus on
courteous operation in the public way and proper
parking. Most notably, vendors were required to de-
velop a safety quiz, and all riders renting a shared
e-scooter in Chicago in 2020 were required to an-
swer at least 80% of questions correctly on the quiz
before being able to start their first ride. Vendors
also pushed out rider education messaging on so-
cial media. Both Spin and Bird also ran educational
advertisements on CTA vehicles and at CTA sta- Safety quiz shown in the Bird app (credit: Bird)
tions, with Bird specifically targeting areas with high-
er rates of complaints about poor parking behavior.
NOTE ON INJURY DATA: The Chicago Department of Public Health analyzed potential injuries related to shared e-scooters during the 2020
pilot by analyzing hospital emergency department visit data. These results should be interpreted very cautiously due to several important
limitations. First, the data only captured people with injuries seen at Chicago EDs (and Chicago residents seen at non-Chicago Illinois EDs).
People who were injured, but did not seek care, or who were seen in non-emergency department medical settings are not included. Second,
the data only includes injuries that were labeled appropriately in the ED medical record. It is possible that injured individuals may have been
misclassified and not identified. Finally, this data is only an estimate; CDPH cannot assign injuries as being e-scooter pilot related. In addi-
tion, in 2020, CDPH did not ask Chicago hospitals to tag “e-scooters” injuries as they did in 2019 for the first e-scooter pilot
30311 Reports
During the 2020 pilot, 337 reports were filed through 311 for e-scooter-re- 311 Reports per Day
lated issues. This equates to 2.7 reports per day on average, but 311 report Month Reports
rates peaked when the pilot launched and declined over the duration of the Aug. 3.0
pilot. The average number of 311 reports-per-day-per-device was 75% lower Sep. 4.1
than in 2019. Nearly half of 311 reports were either blank or did not list a spe- Oct. 3.1
cific violation of pilot rules (e.g. resident wanted all e-scooters be removed Nov. 1.4
from their neighborhood). The most common issue reported was e-scooters
Dec. 1.2
locked to private property, especially fences (21.7% of all reports)
Vendors were required to rectify reported problems within two hours and
the public was encouraged to first contact e-scooter vendors to resolve any
issues before contacting 311. Only 11% of non-riders surveyed agreed it
was easy to contact e-scooter vendors to resolve an issue, and only 13% of
non-riders agreed e-scooter vendors resolved issues in a timely manner. Just
under 40% of riders said it was easy to get customer support.
311 Reports
Reported Issue # of Reports
Reported Issues that Violated Pilot Rules
E-scooter locked to private property 73
E-scooter locked to handicap pole 39
Scooter blocking public way (sidewalk, alley, etc.) 29
E-scooter parked unlocked 15
E-scooter parked on private property (driveway, lawn) 14
Resident unable to reach e-scooter vendor 3
E-scooter on 606 or Lakefront Trail 2
E-scooter riding dangerously 1
E-scooter riding on the sidewalk 1
Reported Issues that Did Not Violate Pilot Rules
Issue unclear/ No violation of pilot rules 69
Comment blank/ Not enough information 32
Request for all e-scooters to be removed from area 26
E-scooters on parkway or locked to tree 20
General dislike for e-scooters 9
E-scooters taking up too much room on bike racks 4
31City Enforcement of Vendors
The City created a transparent enforcement policy (available online
at www.chicago.gov/scooters) to improve clarity with how the City 3
Enforcement
would assess vendor compliance and the actions the City may take for
field and data
non-compliance. Vendors reported that, for the most part, enforcement missions
policies were clear. However, multiple vendors expressed a desire to be
made aware of violations more quickly.
Enforcement Actions: 14
BACP conducted three field enforcement missions in partnership with Notices to Correct
(Warnings) issued
CDOT to check for compliance on device requirements, operational and
parking compliance, and vendor responsiveness to issues. Device informa-
tion was also pulled from data feeds to check for compliance with deploy-
ment requirements throughout the pilot. Per the terms of the pilot, Equity 258
Priority Area rebalancing requirements were checked twice per day, with Administrative
each instance of failed rebalancing resulting in a violation (i.e. up to two vi- Notices of Violation
(Citations) issued
olations per day). The first round of enforcement occurred the week of Au-
gust 31, and vendors with violations were sent “Notices to Correct” for each
violation. Notices to Correct are not violations per se, but rather an official
warning with a mandated date upon which compliance must be achieved. 74%
Three subsequent rounds of enforcement were conducted the weeks of Share of citations
October 4, November 16, and upon the conclusion of the pilot. Violations issued related to
failure to comply
observed in these subsequent missions resulted in “Administrative Notices
with Equity Priority
of Violation” or, citations. Area requirements
A total of 14 Notices to Correct and 256 Administrative Notices of Viola-
tion were issued during the pilot, as shown on the next page.
96%
Share of citations
Vendor Response to Enforcement:
issued to a single
After receiving Notices to Correct (warnings) for failure to meet Priori- vendor—Bird
ty Area requirements and minimum device requirements, Lime soon
achieved compliance, while Bird did not. After beginning to receive admin-
istrative notices of violations (citations) for not meeting the requirement
to have 50% of devices deployed in the Equity Priority Area, Bird achieved
compliance. By the end of the pilot, Bird did not achieve compliance on
minimum device requirements nor the requirement to distribute 2.5% of
devices to each of the 20 sub-areas within the Equity Priority Area.
32Enforcement Actions Notices to Correct (Warnings) Bird Lime Spin Failure to rebalance required share of e-scooters in each of 20 Priority Sub-Areas 1 1 0 Failure to deploy minimum number of required devices per day 1 1 0 Failure to correct e-scooter parked improperly within two hours of being reported 1 1 1 Failure to have an operational warning bell on one or more inspected scooters 1 1 0 Failure to have a clear opt-in policy for sharing data with third parties 0 1 1 Failure to display an app-based rider quiz that includes safety questions 1 1 0 Failure to provide vendor information on e-scooter in braille 1 0 0 Total Notices to Correct 6 6 2 Administrative Notices of Violation (Citations) Bird Lime Spin Failure to correct e-scooter parked improperly within two hours of being reported 1 1 1 Failure to have an operational warning bell on one or more inspected scooters 0 1 0 Failure to provide vendor information on e-scooter in braille 3 0 0 Failure to rebalance required share of e-scooters in each of 20 Priority Sub-Areas 144 5 0 Failure to rebalance required share of e-scooters in Equity Priority area 40 1 0 Failure to deploy minimum number of required devices per day 59 0 0 Failure to have an operational warning bell on one or more inspected scooters 0 1 0 Total Administrative Notices of Violation 247 8 1 33
Coverage, Distribution and Equitable Access
Geographic Distribution of E-scooters

The 2020 pilot featured an Equity Priority Area       Avg Daily Percent Share of Devices Deployed
                                                      to the Priority Area
covering approximately 45% of the pilot area.
Vendors were required to deploy 50% of their de-      		              Bird      Lime        Spin

vices to the Equity Priority Area, including a fur-   August         46.0%      41.0%      56.2%
ther requirement to deploy 2.5% of their e-scoot-     September      44.7%      53.4%      57.8%
er fleet to 20 sub-areas within the larger Equity     October        48.2%      53.5%      55.3%
Priority Area. Outside the Priority Area vendors      November       57.6%      53.4%      55.9%
could choose how much or how little of the city       December       59.8%      54.7%      55.9%
to serve.
                                                      Entire Pilot   50.43%    51.52%     56.26%
Coverage of Equity Priority Area:
Over the course of the entire pilot, the City’s
                                                      Avg Total Daily Share of Devices Deployed,
standard was achieved with 53.3% of devices
                                                      Top-10 Community Areas
deployed within the Equity Priority Area. Ven-
                                                      Community Area		          Share
dors varied in the extent and consistency to
                                                      Lake View		               6.84%
which they achieved the coverage target: Spin
                                                      Lincoln Park		            6.48%
met the coverage requirement 98.8% of pilot
days, Lime 72.4% of pilot days, and Bird 44.7%        West Town		               5.69%

of pilot days.                                        Near West Side		          4.40%
                                                      Austin		                  3.33%
Coverage Outside the Equity Priority Area:            Logan Square		            3.19%
Outside the Equity Priority Area, the pilot saw       Near North Side		         2.89%
a significant concentration of deployments to         Belmont Cragin		          2.86%
a relatively small geography in the North and         Uptown		                  2.73%
Near West Sides of the city. On average, about        Auburn Gresham		          2.63%
1/3 of all devices were deployed to just eight
community areas.

34
Equity Priority Area Distribution
In the 2019 pilot, the City discovered that many e-scooters were deployed to the Equity Priority Area
in the morning and then ridden or rebalanced out of the area in the afternoon and evening, leaving
the areas underserved. In 2020, Equity Priority Area vendor device deployment compliance was
checked both in the morning and afternoon. As a result, device availability substantially improved
throughout the day in 2020. Additionally, the Priority Area was divided into 20 smaller subzones,
and vendors were required to deploy 2.5% of their devices to each zone.
Spin consistently met the distribution requirement over the course of the pilot. Lime had strong
compliance also, falling short of the requirement by 0.1% percentage points in two zones when
data are averaged over the entire pilot. Bird’s performance in meeting the requirements in many
Equity Priority Sub-Areas was inconsistent.
Avg Distribution of Vendor E-scooters Fleet by Equity Priority Sub-Area
Bird Lime Spin
0.9% - 1.9% 2.4% 2.8% - 3.0%
2.0% - 2.4% 2.5% - 2.9%
2.5% - 7.1%
35Physical Access to Devices:
9,091
The number of devices deployed reached their highest points in mid-
and-late-October, peaking at just over 9,000 on October 26. Deployment
data pulled from the pilot mid-point—on October 14—show that nearly Highest number of
devices deployed at
half of the Priority Area was within a two-minute walk of a device, and
single point in time
almost the entire Priority Area was within a five-minute walk.
Access to Devices
October 14, 2020 Entire Pilot Area Priority Area
Pct area w/in 2 minutes of a device 36.2% 47.8%
Pct area w/in 5 minutes of a device 72.2% 92.0%
87%
Priority Area residents who did take a shared e-scooter trip reported
improved mobility and accessibility. Among those riders, 80% said that
shared e-scooters are more convenient than other travel modes, 85% Share of riders who
said e-scooters made
said e-scooters made their travel more efficient and 87% said e-scooters
it easier to reach
made it easier to reach a destination or complete a trip. Further, 64% of their destination
riders who live in the Priority Area said that shared e-scooters were useful
in meeting their daily transportation needs.
Just under 75% of riders in the Priority Area agreed a shared e-scooter 75%
Share of riders who
was usually available when they wanted one—on par with the share of all
said an e-scooter
riders. Survey data indicate however that riders in the Priority Area often was usually
had to walk longer distances to reach a device, with 15% saying they often available when they
wanted one
had to walk more than five minutes, compared to just 10% of all riders.
Duration of Walk to Access E-scooter
All Priority Black or Hispanic
Area African or Latino
American
Often had to walk < 2 minutes 29% 25% 28% 27%
Often had to walk > 5 minutes 28% 27% 13% 17%
Priority Area = Residents whose self-identified home zip codes fell within the
Equity Priority Area
36You can also read