Evaluating the Electric Vehicle Subsidy Program in China
←
→
Page content transcription
If your browser does not render page correctly, please read the page content below
Evaluating the Electric Vehicle Subsidy Program in China

                                                   Jing Qian ∗

                                                 October, 2018

                                                    Abstract

           China has become the world’s largest market for electric vehicles (EVs) since 2015 and the
       government promotes the technology aggressively by providing large subsidies for EV buyers.
       The amount of subsidy is based on the driving range instead of the battery capacity as in the
       U.S. This paper evaluates the impacts of the subsidy program using detailed vehicle registration
       data in China from 2010 to 2015 and a household survey of vehicle ownership. I develop
       and estimate a market equilibrium model for China’s automobile market in which the demand
       side consists of a random coefficient discrete choice model and the supply side characterizes
       automakers’ pricing decisions under the government subsidy program. The estimation suggests
       that while the subsidy program in 2015 contributed to 94 percent of EV sales in large cities,
       the program favored small and low-quality EV models that consumers do not value and led to
       a $2.88 billion loss in social welfare. The hypothetical subsidy program based on the battery
       capacity would have led to a $0.62 billion increase in consumer surplus and a $0.2 billion
       increase in social welfare compared with the subsidy program.

   ∗
     Jing Qian is a Ph.D. candidate in the Dyson School of Applied Economics and Management at Cornell University.
Email: jq58@cornell.edu; Address: 410 Warren Hall, 137 Reservoir Ave, Ithaca NY 14850. I thank Shanjun Li, Panle
Jia Barwick, Jura Liaukonyte, and Sumudu Watugala for their guidance and support of this project. I also thank the
useful comments from Eric Zou, the 20th CU Environmental and Resource Economics Workshop participants, Camp
Resources XXV participants, and the Dyson school AEP seminar participants. Data for this research is generously
supported by China National Information Center, Shanjun Li, and Panle Jia Barwick. Lastly, I wish to thank Congyan
Han and Binglin Wang for their help in collecting data.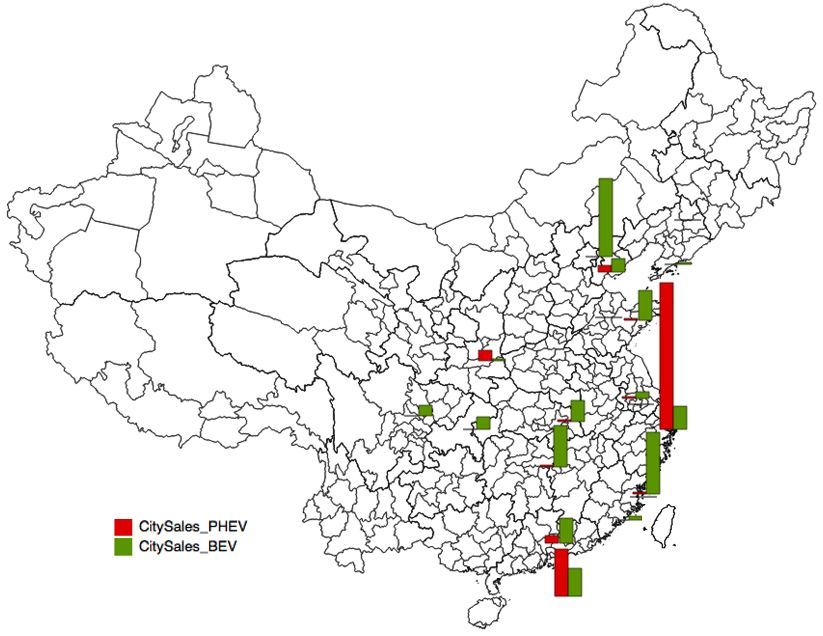
1      Introduction
Since 2015 China has become the world’s largest market for electric vehicles (EVs), overtaking
the United States which has been the forerunner in electrification. Sales of EVs in China have
grown rapidly from 8,159 in 2011 to nearly 580,000 in 2017, accounting for half of the global EV
sales. As the largest emissions producer 1 and oil importer, electrifying transportation is essential
to addressing the environmental problems and reducing exposure to oil price validity and security
risks since electricity is domestically sourced. In addition, accelerating the development of the EV
industry is also important to the economy as the ban on internal combustion engine (ICE) vehicles
is becoming more popular around the world. The trend of electrifying transportation provides an
opportunity for China’s domestic automakers in developing EV technologies to embrace the future
of the automotive industry.2
    Growth of EVs is largely driven by government incentives. However, this tends to vary greatly
across countries. All zero-emission cars in Norway, the country with the world’s largest EV market
share, are exempted from value-added tax (VAT) and registration tax. In the United States, the
second largest EV market, the federal government provides tax credits capped at $7,500 for EV
buyers which is based on the battery capacity. EV buyers also enjoy state incentives. For example,
Clean Vehicle Rebate Project (CVRP) provides EV buyers with up to $2,500 in California. In
China, this is quite different, and the subsidy is based on the driving range of battery electric
vehicles (BEVs), which increases as the driving range rises. The central subsidy for BEVs ranged
from 31,500 Yuan ($4,854) to 54,000 Yuan ($8,322). In the case of Plug-in Hybrid Electric Vehicles
(PHEVs), the subsidy was 31,500 Yuan ($4,854) in 2015. In addition to the central subsidy, EVs
also received subsidies from local governments. The majority of the local governments provided a
subsidy proportional to the central subsidy in a fixed ratio for each city.
    Due to these aggressive incentives, China has witnessed a boom in EV sales. However, the
program causes distortion in consumer choices. Figure 1 shows that bunching is found just above
150km according to the driving range of BEVs which accounted for nearly 70% of EV sales in
2015. BEVs with a driving range just above 150km saw a subsidy growth of about 43%. In fact,
the most popular EVs in China are the small and low-quality vehicle models produced by young,
domestic, and private firms (Ou et al., 2017).3 One reason for the domination of small vehicles is
that firms intend to obtain the subsidy using the lowest production cost in a short time. For instance,
    1 In 2014, the transportation sector corresponded to 23% of global carbon dioxide emissions (International Energy
Agency 2016) and 30% of PM2.5 (World Health Organization). In 2009, China became the world’s largest market in
the automobile sector. The transportation sector in China was estimated to be responsible for 7-8% of national carbon
dioxide emissions (China’s Energy Efficiency and Conservation).
    2 Foreign automakers are leading in the ICE vehicle industry. In China, private automakers and SOEs only account

for about 28% of gasoline car production.
    3 In a Chinese article published by the Ministry of Finance in China, about 66% of the EVs are micro EVs regarding

to the ten most popular EVs. Less than 20% of the EVs apply high technology.

                                                          1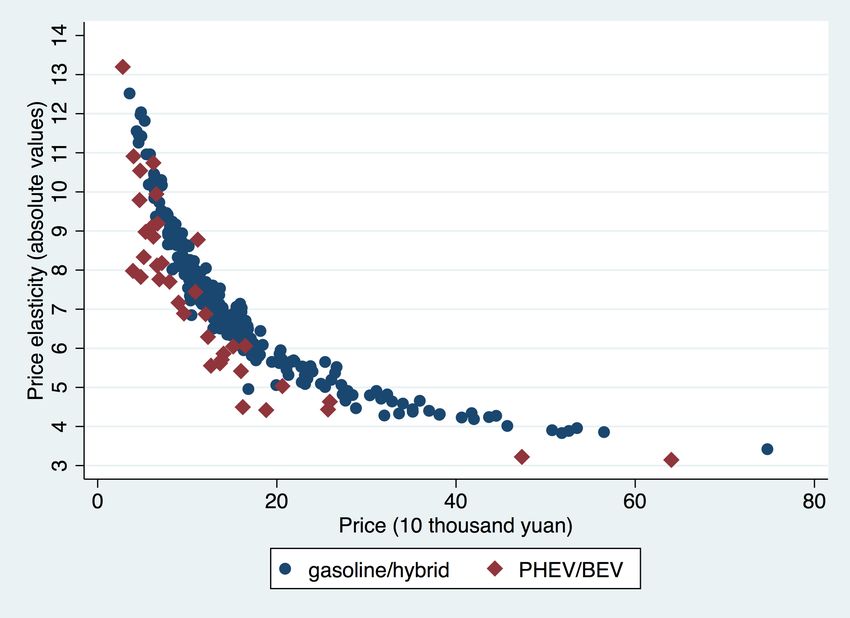
the popular BEV model Kangdi K11 is based on its gasoline powered version dubbed the Panda,
so that firm does not need to completely redesign the vehicle. The other main reason is that the
willingness to pay (WTP) for EVs is low in China. According to a report by UBS Evidence Lab,
Chinese consumers would consider purchasing an EV only if the price of the EV is less than that
of an equivalent ICE vehicle. Small and low-quality EVs usually have a low price after subsidies
so that they are more attractive to the consumers.
     To understand the impact of subsidies on consumer surplus and social welfare, I estimate a
market equilibrium model in the framework of Berry, Levinsohn, and Pakes (1995) (henceforth
BLP) and Petrin (2002). The demand side is a random coefficient discrete choice model and the
supply side characterizes automakers’ pricing decisions under the subsidy program. I supplement
the city-level sales data (macro-moments) with the household survey of vehicle ownership (micro-
moments) which relates household demographic characteristics to household choices. Based on the
model and parameter estimation, I construct a counterfactual in which there were no subsidies on
EVs. While 94% of EV sales in 2015 were driven by the subsidy program, it led to an 18.66 billion
Yuan ($2.88 billion) loss in social welfare. Then, I compare the consumer surplus under the subsidy
program based on the driving range to a counterfactual where the subsidies for EVs were based on
the battery capacity. The results show that there would be an increase in the range, size, weight, and
horsepower of BEVs. The consumer surplus would increase by 4.03 billion Yuan ($0.62 billion),
and the social welfare would also increase by 1.27 billion Yuan ($0.2 billion) in 2015. In addition,
I confirm the opinion that the environmental benefits of EVs are highly related to locations. Since
coal-generated electricity is still the primary energy source in most cities, growth in EV sales has
little or even a negative impact on reducing air pollution.
     This paper makes the following four contributions to the existing literature. Firstly, this study
examines the efficiency of the subsidy program, especially the impacts of the subsidy on con-
sumer surplus and social welfare, which contributes to the literature on EV market from another
aspect. Previous studies have examined the design and effects of financial incentives on EV adop-
tion (Sierzchula et al. (2014), Borenstein and Davis (2016), Clinton and Steinberg (2016), and
DeShazo et al. (2017)). Sierzchula et al. (2014) use the data from 30 countries. Borenstein and
Davis (2016), Clinton and Steinberg (2016), and DeShazo et al. (2017) focus on the U.S. mar-
ket. All papers find a significantly positive impact of subsidies on EV sales. Borenstein and Davis
(2015) and DeShazo et al. (2017) also take subsidy distribution into consideration. Their studies
show that high-income EV buyers receive most of the subsidies. Progressive rebates or aggressive
rebates with price caps are superior to a single rebate for EVs regardless of family income from
the cost-effectiveness analysis. However, they do not take network externalities into consideration.
Springel (2016) and Li et al. (2017) find that charging station investment and EV adoption respond
positively to each other in Norway and the U.S. market. Besides investment in charging stations,

                                                  2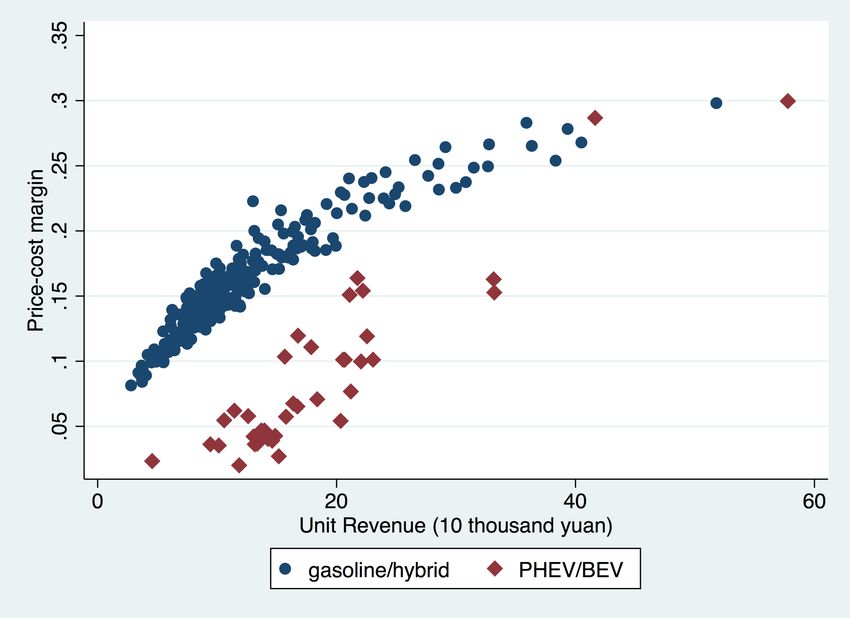
Li (2016) concludes that manufacturer investment in charging standards to make them compatible
would have a positive impact on EV adoption as well. Another stream of literature explores effi-
ciency of subsidies from an aspect of pollution (Zivin et al. (2014) and Holland et al. (2016)). They
find that the environmental benefits of EVs vary across locations depending on the electricity gen-
eration mix. This paper investigates the limitation of technology-based subsidies through focusing
on the consumer purchasing decisions. In particular, I evaluate the distortion in consumer choices
resulting from the unique subsidy program which subsidizes EVs in terms of their driving range.
    Secondly, the study adds to the existing literature on evaluating the consumption responses
to energy efficient programs. Boomhower and Davis (2014), Houde and Aldy (2014), and Chen
et al. (2017) point out the presence of inframarginal consumers in evaluating effectiveness of
energy efficient programs. Chen et al. (2017) find that 53% of the subsidies for fuel efficient cars
in China were ineffective and distributional. However, under the EV subsidy program, most of
the EV consumers are marginal consumers rather than inframarginal consumers, and the program
inefficiency mainly comes from the deviation from their best choices.
    Thirdly, to my knowledge, this paper is the first one to evaluate the EV subsidy program based
on a structural method incorporating both demand and supply side in China. Helveston et al.
(2015) design a survey to estimate consumer preferences for conventional vehicles, hybrid vehicles
(HEVs), and EVs in China and the U.S. Ma et al. (2017) use city-level aggregate data and regres-
sions to study the impact of various policies including subsidies on EV adoption. This paper differs
from prior works on the EV market in China by utilizing registration data at the city-model-quarter
level as well as an equilibrium model of the Chinese automobile market. The approach is closely
related to Beresteanu and Li (2011) which examine the impacts of gasoline prices and income tax
incentives on HEV adoption and Barwick et al. (2017) which investigates the local protection in
China. This approach would allow me to do different counterfactuals to see the effects on the whole
automobile market and social welfare.
    Finally, this paper provides policy implications to China, other developing countries, as well as
developed countries. Recently the Chinese government issued a new energy vehicle (NEV) credit
mandate which is supposed to go into effect in 2018. However, credits for BEVs are still depen-
dent on the electric range. This paper addresses the welfare consequences of subsidizing EVs in
terms of their driving range, which would provide a timely reference for the Chinese government.
Since China is quite different from other developed countries and early EV adopters, other devel-
oping countries can learn from China’s experience to understand what works and what does not
when making policy decisions. More importantly, since we are all under the same dome (Chai
Jing), air pollution produced in China can affect populations all over the world. The technological
advancement in China also has a spillover impact on other countries.
    The rest of the paper is organized as follows. Section 2 describes the industry and policy

                                                 3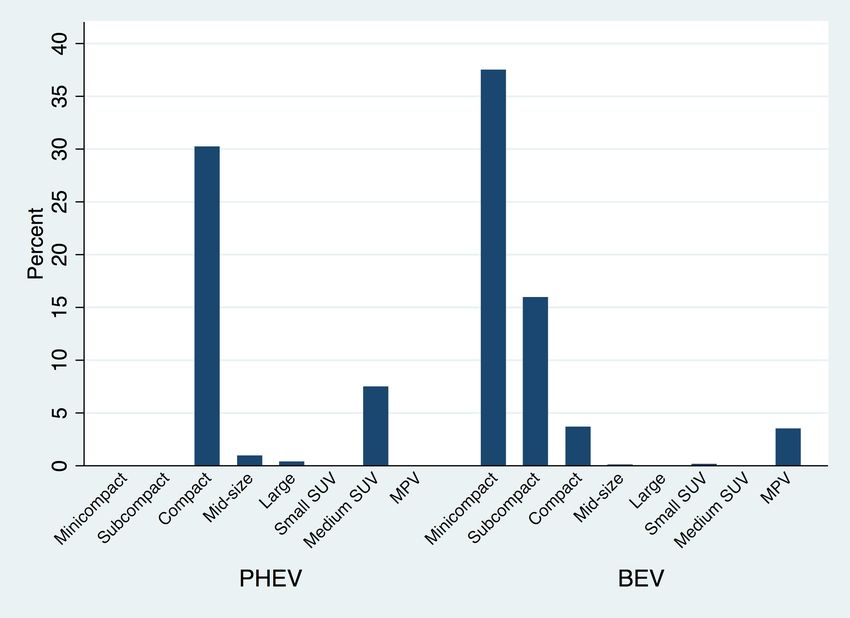
background of the Chinese EV market, presents the data, and discusses descriptive evidence of
positive correlation between subsidies and EV adoption. Section 3 describes the market equilibrium
model. Section 4 reports results from the structural estimation. Section 5 discusses the quantitative
impact of the subsidy program using simulations. Section 6 quantifies the welfare impact of the
subsidy program. Section 7 concludes.

2      Background and Data
In this section, I first present an introduction of the government support especially subsidies on
the development of the Chinese EV industry and the outcome of the current policies for promoting
EVs. I then discuss the data and descriptive evidence of the impact of subsidies on EV sales.

2.1     Policy Background
On September 17, 2013, China’s Ministry of Industry and Information Technology (MIIT), together
with the Ministry of Finance (MoF), the Ministry of Science and Technology (MoST), and the Na-
tional Development and Reform Commission (NDRC) issued a policy ”Regarding the Continuous
Promotion and Application of New-Energy Vehicles” which decided to provide a one-time subsidy
to eligible 4 EVs solely in terms of their driving range. Import EVs, such as Tesla, are not included
on the subsidy list. According to the Notice, BEVs with a driving range between 80km and 150km,
150km and 250km, and above 250km were granted a one-time subsidy of 35,000 Yuan ($5,394),
50,000 Yuan ($7,705), and 60,000 Yuan ($9,246) Yuan, respectively in 2013. PHEVs with a driv-
ing range above 50km were given 35,000 Yuan ($5,394) in 2013. Additionally, the subsidy would
decrease by 10% and 20% in 2014 and 2015, respectively. However, the reductions were revised
later to 5% and 10%. The central subsidies across years are summarized in Table 1.
    Compared with the earlier policies issued in May 20105 , this policy extended the subsidy cov-
erage from 5 to 25 pilot cities and changed the subsidy criterion from battery capacity to driving
range. Unlike other financial incentives like tax credits or rebates, the subsidies were directly al-
located to firms. The price that consumers paid was the market suggested retail price (MSRP)
reduced by subsidies.
    4 Vehicles on the ”Energy Conservation and New Energy Vehicle (NEV) List” can get a subsidy from the central
government. Except for GX2, Lifan 320, and Panda, all the other domestic or joint-venture EVs on the market are on
the list.
    5 MoF issued the subsidy document ”Financial subsidy interim measures for private purchase of new energy vehicle

in pilot cities”. The 5 pilot cities were Shanghai, Changchun, Shenzhen, Hanghzou, and Hefei. The subsidies for
private purchasing depended on the battery capacity. The standard was 3000 Yuan/kwh (462 $/kwh). The maximum
subsidy for PHEV and BEV was 50,000 Yuan ($7,705) and 60,000 Yuan ($9,246), respectively.

                                                         4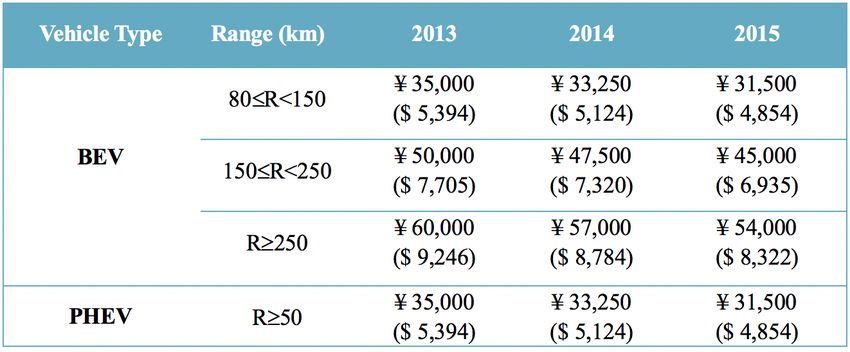
Some local governments also provided subsidies for EVs. Figure 2 shows the dates when the
local governments started to provide subsidies for the private purchasing of EVs in the 19 first
two tier cities 6 that are covered in this analysis. All the 19 cities excluding Jinan offered local
subsidies. Before 2014, only four cities, Shenzhen, Hangzhou, Guangzhou, and Shanghai offered
local subsidies. In Shanghai, the subsidy amount was fixed to 30,000 Yuan ($4,623) for PHEVs
and 40,000 Yuan ($6,164) for BEVs from 2013 to 2015. In order to get the subsidy, the EVs must
be included in the local list of Shanghai. Besides Shanghai, Hangzhou also offered a fixed amount
of subsidy for EVs starting from December 2014. Previously, the subsidy amount in Hangzhou
was based on the battery capacity from 2011 to 2012. From May 2014, consumers in Nanjing and
Wuxi were eligible to get a 25,000 Yuan ($3,953) subsidy for purchasing a BEV and a 15,000 Yuan
($2,312) subsidy for purchasing a PHEV from their provincial government. Later, the provincial
government announced to subsidize EVs in terms of their wheelbase in March 2015. In addition
to the subsidy from provincial government, EV consumers in Nanjing also received a fixed amount
of subsidies, 35,000 Yuan ($5,394) for BEVs and 20,000 Yuan ($3,082) for PHEVs from local
governments. Except for Shanghai, Hangzhou, Nanjing, and Wuxi, the other 14 cities began to
offer EV buyers with a subsidy proportional to the central subsidy in a fixed ratio for each city
starting from 2014,7 which means the local subsidies were also based on the driving range of
BEVs. Table 2 demonstrates the maximum local subsidy an EV consumer received in the 18 cities
in 2015. The subsidies for PHEVs were less than those for BEVs. Similar to Shanghai, Beijing had
its own subsidy catalogue which excluded PHEVs to get the local subsidy. The amount of subsidy
was quite large relative to the MSRP of EVs especially small BEVs. For example, the maximum
total subsidy for the popular BEV model Geely Zhidou was 95,000 Yuan ($14,640) which was
almost 60% of its MSRP. An upper bound was set by governments to avoid excessive subsidies in
some cities8 .
     In addition to subsidies, EVs included in the catalogue issued by MIIT are exempted from the
10% sales tax starting from September 2014. Besides financial incentives, in Shanghai, Beijing,
Guangzhou, Tianjin, Hanghzou, and Shenzhen where consumers are restricted from purchasing
new vehicles, owners of eligible EVs are exempted from the purchase restriction. EV buyers are
either assigned to a separate lottery pool for EV applicants only or granted a plate. Owners of
eligible EVs also receive exemption from driving restrictions in Beijing9 , Chengdu, and Wuhan.
   6 The   ranking is based on China Business Weekly in 2010.
   7 Guangzhou provided a flat subsidy of 10,000 Yuan for EV purchasing before December 2014,         and then it started to
subsidize EVs according to the 2013 central subsidies. Similar to Guangzhou, Shenzhen offered 60,000 Yuan ($9,246)
for BEVs and 30,000 Yuan ($4,623) for PHEVs from July 2010 to May 2013, and then it started to subsidize EVs
according to the 2013 central subsidies from 2014.
    8 The local government in Hangzhou set the limit at 50% of the MSRP. The upper bound in Changsha, Qingdao,

Guangzhou, Wuhan, Chongqing, Xi’an, and Shenyang was 60%, and the upper bound in Xiamen, Nanjing, and Wuxi
was 80%.
    9 In Beijing, only EVs on the local list are unrestricted from the car purchase and driving restrictions

                                                             5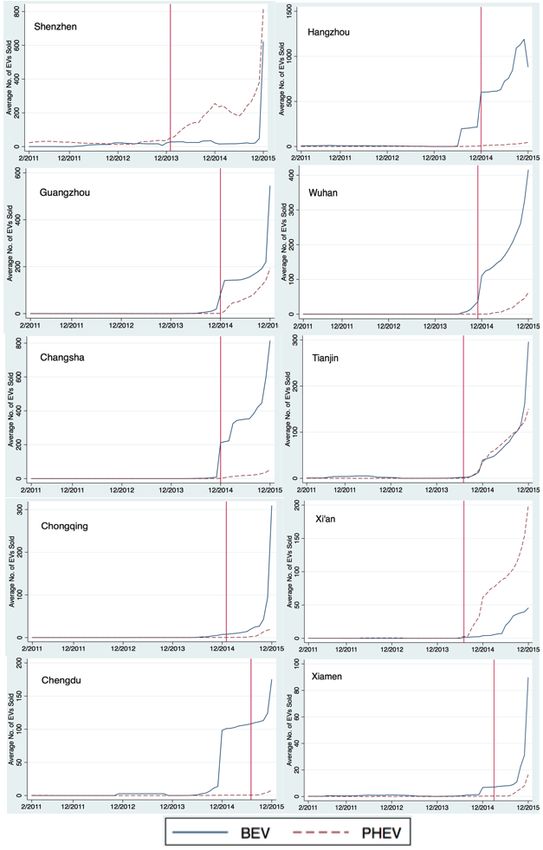
2.2    The Chinese EV Industry
Chinese EV market has experienced an explosive growth since 2014 (Figure 3). In 2017, China
accounted for more than half of the global EV sales and had a market share of 2.2% (Global EV
Outlook 2018). The first two tier cities account for 74.26% of the national EV sales from 2010
to 2015. City-level PHEV and BEV sales are illustrated in Figure 4. We can observe that there
are a lot of variations in sales across both cities and fuel types. In general, BEVs are significantly
preferred than PHEVs in China. However, the popular BEV models are mainly low-end products
with small size, light weight, and small horsepower. Unlike the ICE vehicle industry where joint
ventures (JVs) are the largest producers, the dominate firms in the EV industry are private and
domestic firms, such as BYD, Geely and Zotye.
    Figure 5 illustrates that mini-compact BEVs dominate in the Chinese EV market and more than
50% of the BEVs are mini-compact or subcompact cars. As a result, almost 90% of the BEVs
have a weight less than the average weight of all vehicles on the market (Figure 6). According
to Anderson and Auffhammer (2013), fatality probability increases by 47% when being hit by a
vehicle which is 1,000 pounds heavier, indicating that BEV drivers are exposed to higher fatality
probability in an accident. For PHEVs, their size and weight are larger since they use ICE as a
backup besides electric motor. The above market outcome is quite different from the U.S. market
where the EVs are mainly produced by primary firms. U.S. consumers have high income and view
EVs as a symbol of high social status. The most popular EV model, Tesla Model S with a range
between 398 to 504 km, responded to 22% of all EV sales in 2015.
    There are two major reasons that small and low-quality EV models are popular in the Chinese
EV market. One is that the government subsidies allow the private and domestic firms to quickly
gain profits in the low-end segment under the rapidly expanding market. The other reason is that
inexpensive EV models provide consumers an opportunity to obtain a vehicle plate which is really
difficult to get in some megacities especially Beijing and Shanghai. Although EV buyers can also
get a plate through purchasing an import EV model. Import EV models, such as Tesla S, are still too
expensive for Chinese consumers to afford. Despite the high manufacturing cost, Import models
are also subject to 25% tariff. In addition, the import models are excluded from subsidies and sales
tax exemption. As a result, the market share of import EVs is low. The sales of Tesla in 2015 were
3,692 which accounted for more than 80% of all import EVs, but constituted only about 2% of total
EV sales in China.10 In summary, the Chinese EV market is still dominated by low-end products
while some new firms, such as LVCHI Auto and NIO, have started to focus on developing EVs with
high performance using advanced technologies. NIO introduced a high performance SUV model,
ES8, in 2017. ES8 has a 70kWh battery capacity, a 355 km driving range, a 240kW horsepower,
  10 The
       sales data of Tesla is from autohome website and the percentage of Tesla among all import EVs is from China
Automotive Technology & Research Center (CATARC).

                                                        6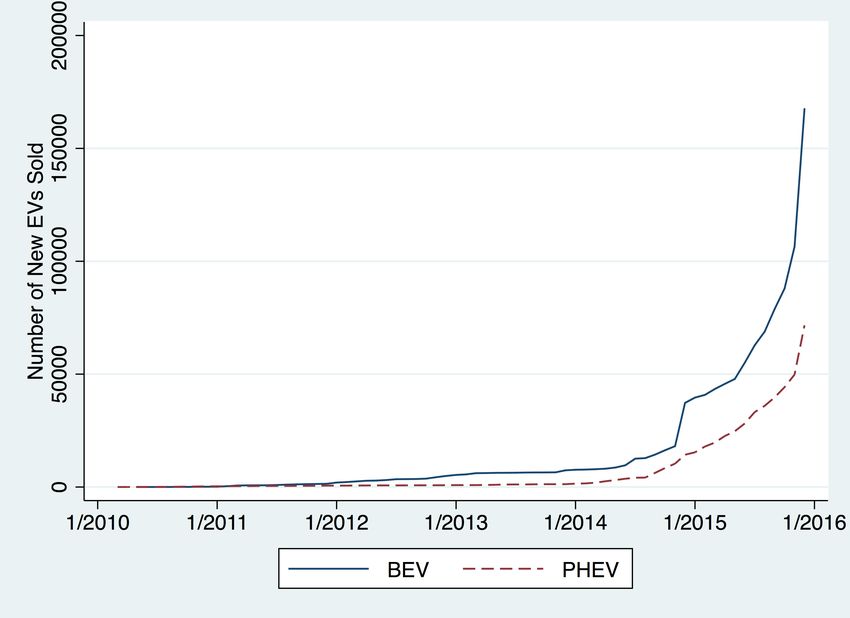
and a fast acceleration (4.4s from 0 to 100km/h).

2.3   Data
The analysis is based on five main data sets: (1) individual vehicle registration data obtained from
the State Administration of Industry and Commerce, (2) model-level attributes from major automo-
tive websites, (3) Government incentives for EVs collected from government and major automotive
websites, (4) household-level car ownership survey data compiled by Ministry of Industry and In-
formation Technology (MIIT), (5) city-level household income data from City Annual Statistical
Yearbook.
     The vehicle registration data contain the universe of car purchases in China from 2010 to 2015.
For each record, we observe the month and county of registration, the owner’s type, and the firm,
brand, and model name of the purchased vehicle. Model is defined by model-fuel type-vehicle
type-transmission type. Engine size and model code are also included to enable the match with
detailed vehicle attribute data. This study focuses on the private purchasing which accounts for
90% of all registration records and excludes import vehicles due to data limitation. In China, the
imports only account for 3.1% of total sales from 2009 to 2011 (Barwick et al. 2017). In addition,
the market share of foreign EV automakers is low (around 2% in 2015). I aggregate the data of the
first two tier cities to the model-quarter-city level.
     The first two tier cities account for 74.26% of the national EV sales from 2010 to 2015. The
number of EV models and sales across years is shown in Table 3. The number of EV models in-
creases significantly, and the largest increase is in 2015. In 2015, EV models accounts for 13%
of all fuel type models. The number of BEV models is larger than that of PHEV models. The
penetration rate of EVs researches 3.6% in 2015 which is more than triple of the national average
rate. These cities also have large variations in EV sales due to the time variations in the implemen-
tation of incentive policies. To translate the aggregated sales into market shares, I compute market
share through dividing sales by market size which is defined as one fourth of the annual number of
households in each city since the observation is at quarter level.
     For each observation in the vehicle attribute data, I include MSRP, horsepower, fuel efficiency,
and size in the analysis. The summary statistics for the 97,765 observations are reported in Table
4. According to Barwick et al. (2017), MSRP which includes value-added tax and consumption
tax is a reasonable approximation of transaction price. Sales tax paid by consumers is on top of
the MSRP, and usually set at 10% but reduced to 7.5% for vehicles with engine displacement no
more than 1.6 liter in 2010. The price consumers pay for gasoline and hybrid vehicles is MSRP
plus sales tax. Approved EVs receive sales tax exemption beginning from September 1, 2014

                                                 7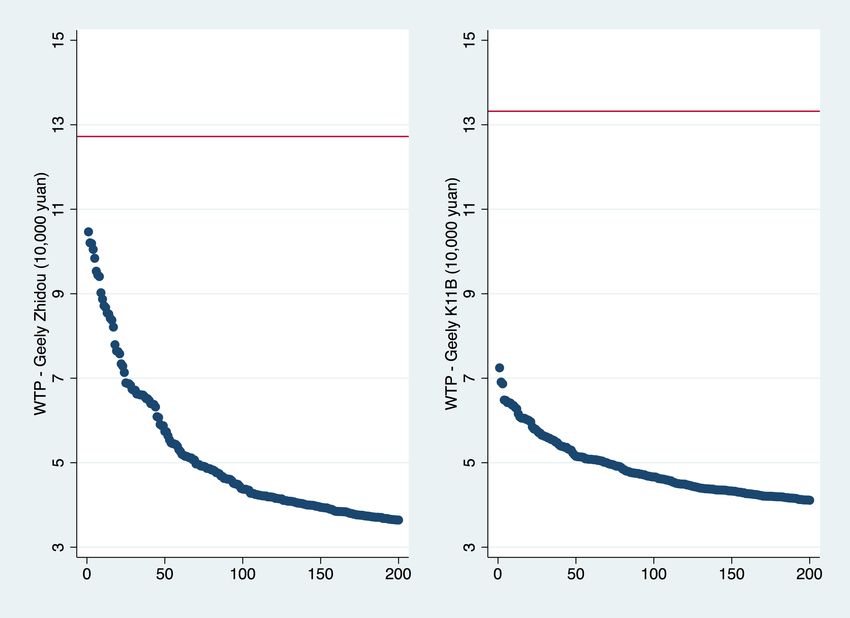
so the price consumers pay for these qualified vehicles is just MSRP11 minus subsidy from then
on. The mean of the real price, deflated to the 2015 level, is 167,566 Yuan ($25,823), and the
mean of the real price of EVs is much lower (about $21,583) due to high subsidies. Fuel cost
of each gasoline or hybrid model is based on the fuel consumption per 100km. I multiply it by
province-year gasoline price to get the average fuel cost (yuan per km). For BEV models, I first
obtain electricity consumption per km through dividing battery capacity by range. Then I multiply
it by nation-year electricity price12 . For PHEV models, I assume 45 percent of miles are driven
on gasoline and 55 percent of miles are driven on electricity based on the formula provided by
the Office of Energy Efficiency and Renewable Energy (EERE). Besides attributes, incentives play
an important role in EV purchase decisions in China. I collect incentives including central and
local subsidies, free license plate, and exemption from driving restrictions at model-city-month
level from government documents and major automotive websites, and then aggregate the data to
model-city-quarter level. The cross-city variations in subsidies are shown in Table 2. For instance,
subsidies for a BEV with driving range no less than 250km vary from 25,000 Yuan ($3,853) to
60,000 Yuan ($9,246).
    The above data sets demonstrate consumer purchase decisions and consumer choices. Since
income is an important factor when making purchasing decisions, I obtain empirical distributions
of household income at the city level from City Annual Statistical Yearbook. The data were col-
lected from anuual city-level household surveys. In the survey, a number of urban households were
randomly drawn and equally divided into 5 groups to get the mean of disposable income per capita
in each group. For each city in each year, I assume a log normal distribution of disposable income
per capita and obtain predicted group means and average mean of whole sample. Then I get the
simulated mean and standard deviation for each city in each year by minimizing the differences
between predicted and observed group means, and the difference between predicted and observed
average sample mean as well. In the demand estimation, the income of pseudo individuals in each
city in each quarter follow the simulated log normal mean and standard deviation in correspond-
ing city and quarter. To convert disposable income per capita into disposable household income, I
multiple the prior number by 3.113 which is the average nationwide average family size in 2015.
    To link the household income and their purchasing decisions, I use a unique household-level
car ownership survey data. The survey was conducted by China National Information Center from
2009 to 2015. It contains household level data on vehicle stocks, vehicle purchasing year, vehicle
attributes, and household demographics, such as household income, family size, and education. I
extract the 19 cities in my study from the survey and only keep new and domestic cars which were
purchased between 2010 and 2015. The total number of households in these 19 cities is 6,097 from
  11 The MSRP for some EV models are subtracted by firm subsidies which only apply to EV models.
  12 The gasoline and electric price are collected from CEIC.
  13 The average family size is obtained from the National Bureau of Statistics.

                                                      8
2010 to 2015. There are 1,617, 1,255, 1,290, 1,072, 625, and 238 households from year 2010 to
2015.
The key variable is household after-tax income in purchasing year. Table 5 shows the income
distribution among all vehicle buyers. About half of the households have annual income no less
than 150,000 Yuan ($23,116). It is quite intuitive that households with high income are more likely
to purchase cars. In addition, we see that the income distribution of household purchasing cars
shifts to the right across years. Table 6 exhibits the fraction of buyers from each income group in
each vehicle segment in 2013. It can be concluded that high income households are more likely to
purchase medium/large cars and SUVs while low income households are more likely to purchase
small cars. In the demand estimation, I match the simulated fraction of buyers from each income
group in each year with the observed fraction in corresponding income group and year. Similarly,
I match the simulated fraction of buyers from each income group in each vehicle segment in each
year with the observed fraction in corresponding income group, vehicle segment, and year.14
2.4 Descriptive Evidence
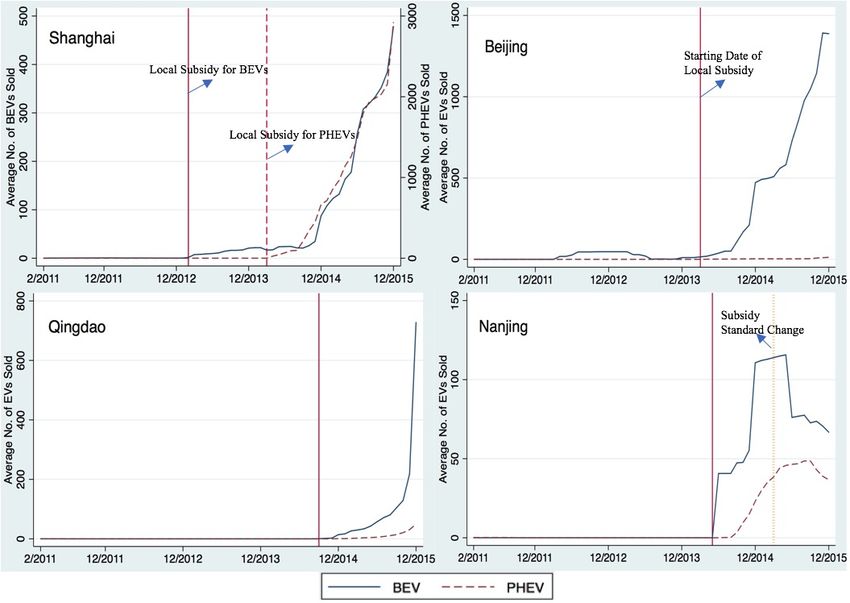
To investigate the impact of subsidies on EV adoption, Figure 7 shows 12-month rolling average of
EV sales in four representative cities. An increase in the sales of EVs is found in all four cities just
after the implementation of local subsidies which are on top of the central subsidy. It seems that
the central subsidy itself introduced in late September, 201315 is not large enough to stimulate EV
sales. The sum of central and local subsidies contributes to the growth of EV sales. The significant
increase in EV sales just after the subsidy is also observed in other cities with EV sales no less than
1,000 from 2010 to 2015 (Appendix Figure 1). The time variation indicates a significantly positive
correlation between subsidies and EV sales.
There are two other variations that help me identify the impact of subsidies on EV sales. We
can see from the top right figure that the sales of BEVs are much higher than those of PHEVs in
Beijing since Beijing doesn’t provide any subsidies for PHEVs, which provides a cross variation.
Another variation comes from the change in the subsidy criterion. Jiangsu provincial government
first provided 25,000 Yuan ($3,853) for purchasing a BEV and 15,000 Yuan ($2,312) for purchas-
ing a PHEV. In March 2015, the provincial government started to subsidize EVs based on their
wheelbase. As a result, we observe a decrease in the sales of BEVs as the subsidies for small
BEVs16 decreases in the bottom right figure.
To control for some confounding factors affecting EV sales, I examine the data by regressing
14 Since the number of total buyers in each segment in 2014 and 2015 is not large enough, I only use the information
from 2011 to 2013 for the vehicle segment match.
15 Shanghai started to get central subsidies from June 2010.
16 In Nanjing, the percentage of mini-compact or subcompact BEVs was one quarter among all EVs in 2014.
9the logarithm of new vehicle registration on the set of EV incentives by controlling for a set of fixed
effects given in regression equation (1).
ln(Salesct j ) = β Subsidyct j + γT Ect j + ∑ Vct je ωe + νt + νc j + νc × νyr + εct j , (1)
e
where the observation is defined by vehicle model j in month t and city c, and all vehicle models are
included. Subsidy and tax exemption (10,000 Yuan) are two financial incentives. Subsidy is the sum
of available central and local subsidies only for EV buyers. Sales tax exemption (T E) is the amount
of sales tax that is exempted which does not only apply to EVs. The rate of sales tax is usually set
at 10% in China, while gasoline and hybrid models with engine displacement smaller than 1.6 liter
were only subject to 7.5% in 2010 and 5% in November and December in 2015. Buyers of eligible
EVs don’t need to pay any sales tax starting from September 2014. Besides financial incentives,
the other EV incentives (V ) include free plate and driving restriction exemption are controlled.
I also include month fixed effects (νt ) to control for seasonality and city-by-model fixed effects
(νc j ) to control for city specific vehicle model preferences, time-invariant city demand shocks, and
time-invariant vehicle model attributes. The OLS regression results are demonstrated in Table 7.
Compared with Column (1), Column (2) further controls for city-by-year fixed effects (νc × νyr )
which provide city specific macroeconomic controls such as GDP, household income, and charging
station expansion. The results of the two specifications are quite robust. Column (2) shows that a
10,000 Yuan ($1,541) increase in the subsidy amount is associated with a 9% increase in EV sales
on average, holding the other control variables constant. Sales tax exemption also has a positive
impact on stimulating EV adoption. The medium value of sales tax exemption for EVs is about
6,600 Yuan ($1,071). If the sales tax exemption incentive is removed, the sales of the EV with
medium exemption amount would decrease by 8.6%. In addition to the financial incentives, we
observe that both free plate and driving restriction exemption have significantly positive impact on
EV adoption. These non-monetary incentives will be controlled in the demand estimation.
3 Empirical Model
In this section, I discuss the structural model and estimation strategy. The model is closely related
to recent empirical literature (e.g., BLP (1995), Petrin (2002), and Barwick et al. (2017)). Firstly, I
model household’s vehicle purchasing decision through a random coefficient discrete choice model.
Then, I model the supply side taking the impact of subsidies into consideration and assuming
Bertrand competition. Under optimal pricing, I can recover the marginal costs of vehicle models.
103.1 Demand
A market is defined as a city. In a given quarter t, household i chooses from Jmt vehicle models and
an outside good to maximize his utility. The indirect utility ν of household i choosing product j in
city m and quarter t is defined as
umti j = ν(pmt j , Xt j , ξmt j , ymti , Dmti ) + εmti j , (2)
where pmt j is the vehicle price households pay which takes taxes and subsidies for electric vehicles
into consideration. The price varies across markets due to the difference in local subsidy amount.
Xt j is a vector of of observed product attributes. ξmt j is the unobserved product attribute. ymti
and Dmti represent for income and other household attributes. Due to the data limitation on the
distribution of observed household attributes other than income, I only include the determinant
factor income in this analysis.
The specification of the indirect utility ν is assumed as
ln(pmt j )
νmti j = −(eᾱ × eσ p νmti ) + ∑ xt jk β̃ mtik + ξmt j , (3)
ymti k
where eᾱ represents the base level of price sensitivity. eσ p νmti captures the consumer heterogeneity
in disutility of price. In this term, νmti has a standard normal distribution, and σ p is the standard
deviation of the normal distribution. xt jk is the kth product attribute of product j. β̃ mtik stands for
consumer heterogeneous taste for attribute k which is defined as
β̃ mtik = β̄ k + σk νmtik (4)
where β̄ k is the mean preference for product attribute k which is constant across all markets and
quarters. νmtik follows a normal distribution and σk is its standard deviation which stands for
household i’s preference for attribute k.
The utility function can be fully written as
umti j = ∑ xt jk β¯k + ∑ Vmt je ωe + Fj + ηt + S j + τm × ηyr + ξmt j
k e
(5)
ᾱ σ p νmti ln(pmt j )
− (e × e ) + ∑ xt jk σk νmtik + εmti j ,
ymti k
In the above equation, the first xt jk includes constant, a dummy for electric vehicles, horsepower,
fuel cost, size, a dummy for automatic transmission. Vmt j represents EV incentives including free
plate and exemption from driving restriction. Fj , ηt , S j , and τm × ηyr are firm dummies, quarter
dummies, vehicle segment dummies, and year by city interaction dummies, respectively. Firm
dummies, month dummies, and vehicle segment dummies control for firm loyalty, seasonality,
11and preference for large cars, respectively. The interaction dummies of year by city absorb time-
variant city attributes such as changes in the city public transportation and macro shocks such as
gasoline price fluctuation. In addition, I include random coefficients for outside good (constant
term), vehicle size, and price which are important attributes when making purchasing decisions.
I denote the parameters to be estimated as θ which equals to (θ1 , θ2 ). θ1 and θ2 represent linear
and nonlinear parameters, respectively. The utility function can be decomposed into a common
utility δ (θ1 ) and a heterogeneous utility µ(θ2 ).
umti j = δmt j + µmti j + εmti j , (6)
δmt j = ∑ xt jk β¯k + ∑ Vmt je ωe + Fj + ηt + S j + τm × ηyr + ξmt j , (7)
k e
ln(pmt j )
µmti j = −(eᾱ × eσ p νmti ) + ∑ xt jk σk νmtik . (8)
ymti k
Household i chooses the vehicle with the highest utility. Let κi be the vector of unobserved
individual attributes. The market share of product j is given by
exp(vmti j )
Z
smt j (p, X, ξ , yi ; θ2 ) = dF(κ). (9)
1 + ∑Jl=1
mt
exp(vmtil )
3.2 Supply
A supply side is needed to back out marginal costs to do counterfactual analysis. I assume a
Bertrand competition and national pricing.17 A firm sets a national optimal price (MSRP) denoted
by p0j for each vehicle model to maximize its annual national profit. In China, the price consumers
pay consists of pre-tax price which includes consumption tax and value-added tax which is based
on the pre-tax price for domestic vehicle models, the unit revenue firm gets is much smaller for
vehicles with a large engine size. For example, the consumption tax for vehicles with a engine size
between 2 to 2.5 liter, 2.5 to 3 liter, and 3 to 4 liter is 9%, 12%, and 25%, respectively. The unit
f
revenue firm gets (pm j ) is (I suppress subscript t for simplicity in this section. m not only represents
cities, but also includes 4 quarters for each city in a given year. Thus, the definition of market is
city by quarter instead of city):
f p0j − bm j
pm j = (1 − tmc j ) + bm j , (10)
1 + t va
j
where p0j is product j’s MSRP which is the same across cities and within a year. bm j is the subsidy
for EV model j which is directly allocated to the firm and not subject to any taxes. For models other
17 National pricing in this paper refers to optimize automakers’ profits in terms of the total profits in the 19 cities.
12than EVs, bm j equals to 0. The price consumers pay for EV models and other models is p0j − bm j
and p0j , respectively. t va c
j is value-added tax which is equal to 17%. t j is consumption tax which
depends on the engine size and is constant within a year for a given model.
For a given year, the annual profit for firm f is
M
πf = ∑ ∑ (pmf j − mc j )Mmsm j
m=1 j∈F
(11)
M
= ∑ ∑ [τ j p0j + (1 − τ j )bm j − mc j ]Mmsm j ,
m=1 j∈F
1−t c
where τ j equals to 1+t vaj which represents the percentage of amount firm f gets among the price
j
consumers pay. Subsidy bm j is directly allocated to the firm and exempted from tax, which is
adjusted by term (1 − τ j )bm j .
Each firm chooses {p0j , j ∈ F } to maximize its total profits. Given this assumption, p0j satisfies
the following first-order condition (FOC):
M M M
∂ smr 0 ∂ smr
τj ∑ Mm sm j + ∑ (1 − τr ) ∑ Mm bmr + ∑ (τr pr − mc r ) ∑ Mm = 0, ∀ j (12)
m =1 r ∈F m =1 ∂ p0j r ∈F m =1 ∂ p0
j
∂ smr
To compute the term ∂ p0j
, I use the price consumers pay (pm j ) to connect the demand and
supply side. The price consumers pay taking subsidy and sales tax into account is
p0j − bm j
pm j = (p0j − bm j ) + t sj , (13)
1 + t va
j
∂ smr ∂ smr ∂ pm j
0
= ×
∂ pj ∂ pm j ∂ p0j
(14)
∂ smr
= t j,
∂ pm j
1+t va s
j +t j
where t j = 1+t jva and t sj is sales tax.
Define the national sales Mm sm j as S j , and ∆ as J by J matrix, whose ( j, r) term is − ∂∂ Spr0 if r
j
and j belong to the same firm, and 0 otherwise. B j represents the second term in equation 12. The
FOC can be organized as:
τP0 − ∆−1 B = mc + ∆−1 (τS) (15)
133.3 Estimation
The key variable to identify the effectiveness of subsidies on the total sales of EVs is price. In
addition to subsidies, EVs are also exempted from purchase and driving restrictions. I control for
these two factors in mean utility δmt j . In this study, I do not distinguish the effects of exemption
from tax and subsidies. Both of them are reflected by price.
Another issue is that price is correlated with unobserved product attributes which are repre-
sented by ξmt j . Besides excluded variables, I use the number of products produced by other firms
in the same vehicle segment and with the same fuel type, the number of products produced by
the same firms in the same vehicle segment and with the same fuel type, and the central subsidy
amount EVs received as the exogenous variables. The first two variables capture the market power
and competition affecting firms’ pricing decision. Central subsidies are for EVs only and based
on the driving range. The subsidy for BEVs ranged from 31,500 Yuan ($4,854) to 54,000 Yuan
($8,322) in 2015. It increases as driving range rises and decreases across years. EVs with a high
driving range (above 250km for BEVs) need more technology and manufacturing investment and
usually have high quality.
The assumption that the instruments are uncorrelated with unobservables provides the first mo-
ment:
E[ξmt j (θ1 , θ2 )|Zmt j ] = 0, (16)
where the unobserved individual attributes have been integrated over in equation (9) and Zmt j in-
cludes all excluded and exogenous instruments.
The second set of moment conditions follow (Barwick et al. (2017)) but have different data
source. Table 5 and Table 6 contain the observed fractions of buyers in each income group, and
the observed fractions of buyers in each income group by vehicle segments from the household-
level car ownership survey data. The estimation requires model predicted fractions to match with
the observed fractions. For example, to compute the predicted fractions of buyers in each income
group in 2015, I multiply the predicted fraction of buyers in each income group in each city-quarter
by the observed total sales in that city-quarter in 2015. Then I aggregate the sales of each group to
the 2015 national level. The fractions of buyers in each income group in 2015 is obtained through
dividing the sales of each group by the 2015 national sales in the certain year. There are 90 micro-
moments in total.
With an initial value of θ2 , I use contraction mapping to recover δmt j . The objective function is
formed by stacking the above two sets of moment conditions. The estimation is carried out using
the identity matrix as the weighting matrix to obtain the optimal weighting matrix. I then estimate
the model using the optimal weighting matrix.
144 Estimation Results
In this section, I first discuss evidence from the reduced-form regressions on the sales impact of
the subsidy policy in the top two tier cities using two basic sets of results. These are a simple
logit specification and an instrumental variables logit specification. Then I present the parameter
estimates from the random coefficient discrete choice model.
4.1 Reduced-form Regressions
To provide evidence on the sales impact of subsidy policy, I estimate the following logit specifica-
tion for the utility function.
lnsmt j − lnsmt0 = xt jk β¯k + Vmt je ωe + Fj + ηt + S j + τm × ηyr + ξmt j ,
∑ ∑ (17)
k e
where the dependent variable is the log market share of product j minus log market share of outside
good in city m and quarter t. xt jk are vehicle attributes including constant, log vehicle price, EV
dummy, horsepower, fuel cost, size, transmission type. Vmt j represents EV incentives including free
plate and exemption from driving restriction. Firm dummies, month dummies, vehicle segment
dummies, and city-by-year interactions are also controlled as I discuss in Section 3.
Column (1) in Table 8 reports the results of OLS applied to the logit specification. Due to the
endogeneity of price, the coefficient of log price is biased towards zero, implying inelastic demands
of the products. To control for unobserved quality which is correlated with price and product market
share, I use instruments for price in Column (2). The coefficient of log price increases a lot in
absolute value. The first F-test of the instruments is 12.35, indicating that the instruments are valid.
The own price elasticity is -4.52, which is plausible. Although we obtain a plausible own elasticity,
the IV logit can not provide plausible cross elasticities. In addition, it does not incorporate income
impact which is an important factor in making purchasing decisions and household heterogeneous
preference for vehicle attributes.
Using the own elasticity, I can compute the EV sales without subsidies. I find that the sales of
PHEVs would reduce from 54,770 to 999, and all BEVs would exit the market in 2015 due to a
extremely high proportion of subsidy to the BEV price. If subsidy is reduced to the half, the sales
of PHEVs would decrease to 9,471, and the sales of BEVs would decline to 271. I will come back
to the estimates for comparison after obtaining parameter estimates from the random coefficient
discrete choice model.
4.2 Parameter Estimates from the Random Coefficient Model
The consumer demand for vehicles derived from the utility function in equation (5) is contained
in Table 9. The first specification is the benchmark specification. I will compare the specification
15with the other three specifications in the next section. The linear parameters are those in the mean
utility function in equation (7) which reveal households’ references for vehicle attributes. The price
coefficient and random coefficients are in the household-specific utility function in equation (8).
The first specification indicates that households prefer vehicle models with large horsepower,
more fuel-efficiency, large size, and automatic transmission. Exemption from purchase and driving
restrictions are the two non-monetary incentives affecting households’ purchasing decisions. The
results confirm that these two factors play a significant role in stimulating EV sales. The channel
is that the price of vehicle plates is significantly larger than that of EV models in megacities such
as Shanghai. In Shanghai, the average bid for a license was more than 92,000 Yuan ($14,178) in
March 2013 (Li, 2014), much higher than the after subsidy price of many low-end EVs. I control for
these two incentives to exclude their positive impact on the EV adoption. The random coefficients
stand for the standard deviation of household preferences from the mean for vehicle attributes. The
random coefficient of constant captures households’ heterogeneous preference for purchasing a
car. The preference parameter on it has a standard normal distribution with mean 0.2 and standard
deviation -6.03, indicating that 95% of the households have a parameter on size in the range of
[-11.62,12.02].
The key variables capturing the effects of subsidies on the sales of EVs are base level price
sensitivity (eᾱ ) and price random coefficient σ p . The term eᾱ /yi represents price sensitivity of
consumers with different income. It is intuitive that consumers with higher income are less price
sensitive. σ p represents dispersion in price disutility indicating that consumers with the same in-
come have different price sensitivity. For example, given two consumers (with price random draw
equals to 1 and -1, respectively) purchasing the same vehicle model in the same market at the same
quarter, the demand elasticity of the former consumer is nearly 2.3 times of the latter one. The price
random coefficient helps to reflect the phenomenon that Chinese consumers have lower income but
are willing to purchase expensive cars compared with the U.S. consumers.
To understand the magnitude of the estimation results in the specification (1), I plot the 2015
own-price elasticities and Lerner index against price for the 305 models in Figure 8 and 9. The
own-price elasticity ranges from -21 to -318 . For vehicle models with the same price, the elasticity
of EV model is smaller than that of the gasoline or hybrid model, indicating households are less
price sensitive to EV models. The sales-weighted elasticity in 2015 is -6.42, while the magnitude
of sales-weighted elasticity of EVs is a bit larger which is -6.86. This is because low-end EVs
dominate the Chinese EV market, and buyers of these models tend to be more price sensitive
compared with buyers of high-end EV models such as Geely S60L and BMW-Brilliance 530Le
which have the lowest elasticities. Figure 8 shows that vehicle models with a higher price tend to
18 The second largest elasticity is -13. The model with the largest elasticity is a low-end EV, Chery QQ3 which has
the lowest price in our data.
16have a lower elasticity. The magnitudes of the own-price elasticities are similar to those estimated
from the U.S. automotive market in Petrin (2002) and Beresteanu and Li (2011). This study focuses
on the first two tier cities where the new car buyers have relatively high income with the mean at
188,076 Yuan ($28,984) and cars have become a necessity for households, though average income
of U.S households is much higher than that of Chinese households. Besides, the sales-weighted
own-price elasticity is between those estimated from the Chinese automotive market in Barwick et
al. (2017) and Li (2014).
In addition to own-price elasticities, I compute the marginal cost for each vehicle model from
f
p j −mc j
firms’ FOC in (12). Based on the marginal cost, the price-cost margins can be computed as f ,
pj
f
where p j is the unit revenue firm gets. The price-cost margins are reported in Figure 9. The sales-
weighted margin in 2015 is 17.46% which is similar to Petrin (2002) (16.7%) and Beresteanu and
Li (2011) (17.72%). For EV models, I observe that some of them with small own-price elasticities
have low margins. The reason is that the marginal costs for EVs are still high especially in early
years due to the high battery cost. According to the world’s largest battery production company
Contemporary Amperex Technology Co. Limited (CATL), a Chinese company, the average selling
price of EV batteries for automakers produced by itself was 2.89 and 2.28 Yuan/wh (0.45 and 0.35
$/wh) in 2014 and 2015, respectively.19 For a BEV with a 20 kwh battery capacity, the average
battery cost was roughly 45,600 to 57,800 Yuan ($7,027 to $8,907) in 2015 given that the battery
supply was from CATL. The battery cost is even larger than the price of low-end gasoline vehicle
models. Since battery accounts for up to half of an EV’s cost of production20 , the estimated lower
bound of the cost of an EV with 20 kwh battery capacity could research 91,200 to 115,600 Yuan
($14,055 to $17,815).
4.3 Robustness Checks
The model fit of specification 1 is shown in Table 10 and 11. From Table 10, the model fit is decent
with the largest prediction error at 3% and the average prediction error at about 1%. For the second
set of Micro-moments, the prediction also fits well, which is demonstrated in Table 11 with the
average prediction error at 2% in 2013. The fit in year 2010 to 2012 is also decent.
Table 9 also shows three robustness checks for the benchmark specification. The robustness
checks show that the benchmark estimation is robust to: (1) the definition of market size; (2)
the distribution of draws for random coefficients; (3) the income group cutoffs to generate micro-
moments. In the bench specification, I assume that all households are potential new car buyers
19 The data is described in an article published by Bloomberg Opinion. The detailed information on CATL can also
be found in the Chinese article.
20 In a article published by China Briefing.
17in the market as is often used in the study on U.S. automotive market since this study focuses on
the first two tier cities where the income of the households is relatively high compared with other
cities, and the demand for cars grows rapidly in China. Specification 2 assumes that half of the
households are potential new car buyers, implying that the market size of a quarter is the number
of annual households divided by 8. The coefficients of the specification 2 are similar to those of
the benchmark specification except that the random coefficient of size is smaller. This implies that
the coefficient of size in the mean utility of the specification 2 is larger than that of the benchmark
specification.
Specification 3 removes the impact of extreme draws for the random coefficients. Instead of
using unbounded random draws in the benchmark specification, this specification drops the bottom
2.5% and top 97.5% draws. The estimates are again close to those in the benchmark specification
and the larger random coefficient of size implies a smaller coefficient of size in the mean utility.
In the specification 1, I group households with annual income less than 60,000 Yuan as the
first group, households with annual income no less than 60,000 Yuan and less than 100,000 as the
second income group, households with annual income no less than 100,000 and less than 150,000
as the third income group, and households with annual income no less than 150,000 as the fourth
income group. The cutoffs are close to the 25th, 50th, and 75th percentile income according to
the city-level income distribution from the demographics data. Another reason is that about 16%
and 12% of the surveyed new car buyers have nominal household income at 100,000 and 150,000,
respectively. setting the cutoffs at 100,000 and 150,000 makes sure that the peaks are included
in the same group across years. In the specification 4, I set the cutoffs at 60,000, 115,000, and
165,000. The estimated coefficients are close to those in the benchmark specification as well. I
will show the simulation results and welfare analysis in the below sections which are similar to the
corresponding results of the benchmark specification.
5 Counterfactuals
The previous sections estimate a random coefficient model and recover the marginal cost for each
vehicle model. In this section, I first conduct a counterfactual scenario to evaluate the subsidy
program based on the driving range (baseline program), especially the effects of the program on
consumer choices. Then I conduct a counterfactual scenario to compare the baseline program with
an alternative program which subsidizes EVs based on their battery capacity in terms of their effects
on consumer choices and social welfare. I use the following methodology. Firstly, I change the
FOC according to different scenarios. Then, I solve the new equilibrium prices and sales using the
demand parameter estimates and product marginal costs. In this study, the product on the market
would stay the same under the different scenarios. To the extent that the baseline program favors
18small and low-quality EVs and therefore induce automakers to offer more such kinds of EVs, the
counterfactual analysis would underestimate the true effects of the program on consumer choices.
The other thing is that Nanjing and Wuxi are excluded in the following counterfactual analysis
since the provincial subsidies for those two cities were based on the wheelbase in 2015.
5.1 Sales without subsidy
To evaluate the impact of the baseline program on prices, I solve for new equilibrium prices and
sales without any subsidies using equation (12) and assuming the second term to be zero. Table
12 shows the changes in sales by fuel type after removing subsidies in 2015. It is not surprising
that 94% of the EV sales were induced by the baseline program. The reduction in the sales of
PHEVs is less than that of BEVs. One reason is that subsidies for BEVs are much higher than
those for PHEVs. Compared with the results using logit IV, we see that the sales of EVs removing
subsidies would be larger using the random coefficient model. One of the reason is that the random
coefficient model incorporates consumer heterogeneity. For example, the random coefficient of
constant is large in Table 9, indicating that some consumers have strong preference to purchase a
car even if the subsidy is removed. The random coefficient model also captures the substitutions
among cars with different fuel types. We can find that about 63% of EV buyers would purchase
gasoline or hybrid models instead.
Regarding to the specific vehicle models, high-end models, Geely S60L and BMW-Brilliance
530Le, would have the least percentage decrease (27% and 38%, respectively) in their sales since
these models have low own-price elasticities. The sales of most of the EVs would decrease by more
than 90%, and some low-end models would even exit the market. Figure 10 shows the distribution
of BEV range without subsidies. It is observed that the percentage of BEVs with driving range
between 150km and 160km would decline significantly, from 55% to only 6%. BEVs with driving
range no less than 360km would be the most popular models in the market. Correspondingly, Figure
11 and 12 illustrate that large and heavy BEVs would dominate the EV market without subsidies.
More specific, the sales of mini-compact BEVs would decline the most from 50,392 to only 102,
followed by subcompact BEVs, while the sales of BEVs belonging to MPV would decline the least
from 3,939 to 437. For PHEVs, the sales of compact cars would decrease the most from 39,253 to
3,313, while the sales of medium or large cars would reduce the least from 668 to 416. On the other
hand, we would see a growth in the sales of gasoline vehicles. The largest increase would be found
in compact and small SUV segments. In addition to performance improvement in driving range,
size, and weight, BEVs with higher horsepower are preferred shown in Figure 13. All results imply
that Chinese households have an underlying preference for BEVs with high performance. However,
the subsidy policy based on the driving range results in distortions in their choices.
19You can also read