Central Coast Destination Management Plan 2017 2021 - DRAFT VERSION 2 May 2017
←
→
Page content transcription
If your browser does not render page correctly, please read the page content below

Central Coast Destination Management Plan
2017 - 2021

DRAFT VERSION 2

                                      May 2017
THE PLAN AT A GLANCE
The purpose of this Destination Management Plan for the Central Coast is to guide tourism development
and destination management for the next five years; to help ensure the long-term viability and
sustainability of this vital sector for the Central Coast economy.

                             2021 VISION
  The natural choice for leisure, business and major events in regional NSW

                                MISSION
 The Visitor Economy on the Central Coast makes a positive contribution to the
community through building local pride, youth employment, and supporting local                ENABLERS OF
                    events and community infrastructure.
                                                                                                SUCCESS
                                                                                         1.    Investment Attraction
                                   GOALS                                                 2.    Accessibility
                                                                                         3.    Connectivity
                                                                                         4.    Community Support
    1. Growing the value of the visitor economy by $70M per annum
    2. Target dispersed growth mid-week, off-peak and across the destination
    3. Leverage natural and built assets to continue to grow core markets
    4. Above NSW average growth in the value and visitation of target markets
    5. Growing community support for the tourism industry

                         PRIORITY PROJECTS
   1. Develop and implement a new Destination Brand and targeted campaign
      activity, in partnership with Council, to deliver a clear single message for the
      destination.
   2. Establish an events strategy program which maintains and grows off-peak,
      multi-day events that attract out of region visitation.
   3. Develop entrepreneur, innovation hubs and mentoring programs
      specifically targeting youth employment in the tourism sector to lift the
      overall visitor experience, product development and investment attraction.

CENTRAL COAST DESTINATION MANAGEMENT PLAN 2017-2021| DRAFT                                        2
Table of Contents:
SETTING THE SCENE ........................................................................................................................ 4
The Central Coast Destination Management Plan ..................................................................................4
Structural and Administrative Change for the Central Coast Region .....................................................5
NSW Regional Tourism Network.............................................................................................................5
About the Central Coast.................................................................................................................. 8
Regional Overview ..................................................................................................................................8
Key Visitor Trends ...................................................................................................................................9
Target Markets & Growth Potential .............................................................................................. 15
Vision, Mission and Goals ............................................................................................................. 20
Strategic Priorities and Projects .................................................................................................... 22
Strategic Priority 1: Drive visitor expenditure through targeted campaigns ........................................23
Strategic Priority 2: Encourage Visitor Dispersal ..................................................................................24
Enablers of Success....................................................................................................................... 28
Investment Attraction ...........................................................................................................................28
Accessibility (Creating Accessible Tourism Experiences) ......................................................................28
Connectivity (Visitor Transport) ............................................................................................................28
Community Support ..............................................................................................................................28
Measures of Success ..................................................................................................................... 30
Appendix 1: Central Coast Tourism Profile ..................................................................................... 32
Appendix 2: Opportunities and Challenges .................................................................................... 40
Appendix 3: Strategies and Plans .................................................................................................. 41
DISCLAIMER
The information and recommendations provided in this document are made on the basis of information available
at the time of preparation and the assumptions outlined throughout the document. While all care has been taken
to check and validate material presented in this report, independent research should be undertaken before any
action or decision is taken on the basis of material contained in this report. This report does not seek to provide
any assurance of project viability and EarthCheck accepts no liability for decisions made or the information
provided in this report.
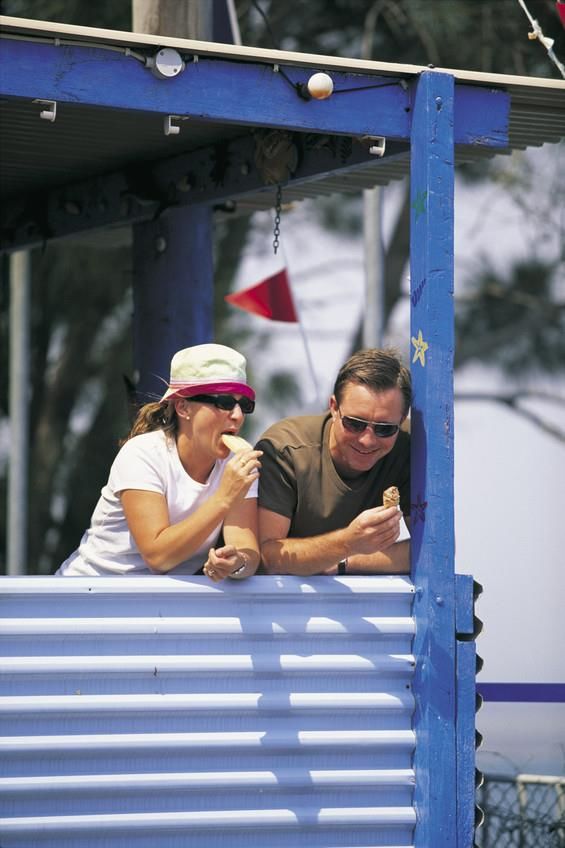
Images courtesy of Destination NSW
Unless otherwise stated, all tourism statistics quoted throughout this report are courtesy of Tourism Research Australia, Year Ending
December 2016
CENTRAL COAST DESTINATION MANAGEMENT PLAN 2017-2021| DRAFT 3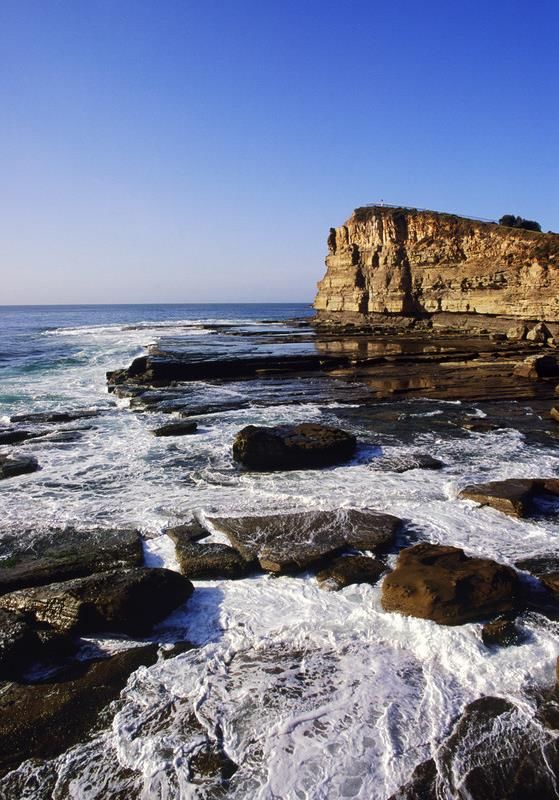
1              SETTING THE SCENE

   The Central Coast Destination Management Plan
   The Central Coast Destination Management Plan is the strategic framework for tourism for the
   destination, owned by all stakeholders. This Plan outlines the vision and goals for the destination and
   provides a clearly evidenced business case for investments, strategies and actions.

   With structural change in NSW’s regional tourism network, amalgamation of Gosford City and Wyong
   Shire Councils and tourism growth challenges facing the region, now represents an ideal opportunity to
   set a new direction for tourism on the Central Coast. This Destination Management Plan is essential for
   the sustainable and profitable growth of the destination’s tourism industry, providing a central reference
   point for the development and delivery of tourism product and services and the implementation of
   marketing strategies.

   Central Coast Council and Central Coast Tourism have commissioned EarthCheck to work with Central
   Coast’s tourism sector to establish this new framework for the sector. This Destination Management
   Paper builds on feedback generated from consultation with industry, community members and other
   stakeholders.

   Figure 1: DMP Process

          RESEARCH                    INFORM                     DEVELOP                     DELIVER

• Policy & Strategy Review    • CCT Executive and      • Directions Paper           • Final Destination Plan
• Documentation & Visitor       Board Discussion       • Draft Plan with actions    • Implementation &
  Market Research and         • Stakeholder              and KPIs                     Partnerships
  Review                        Consultation           • Council & CCT              • Track Performance
• Product and Experience                                 consultation on Draft
  Audit                                                  Plan

   CENTRAL COAST DESTINATION MANAGEMENT PLAN 2017-2021| DRAFT                                        4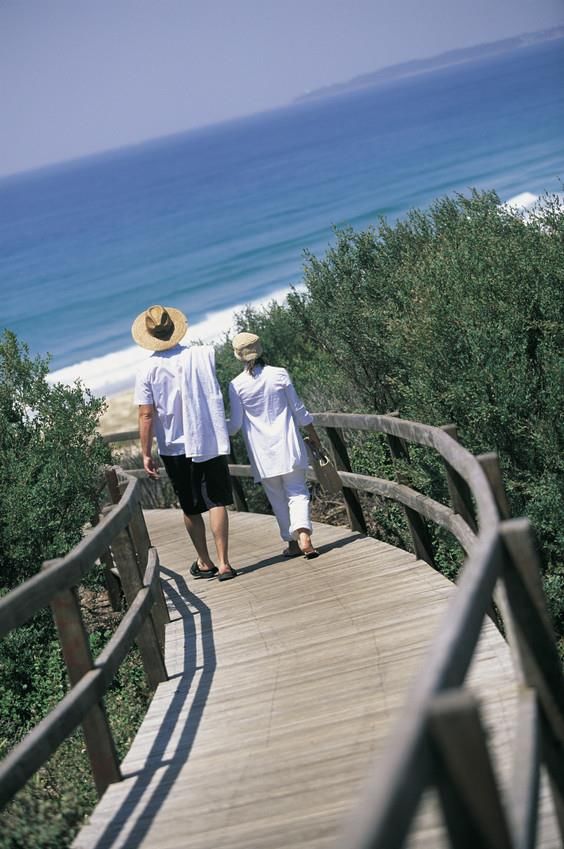
Structural and Administrative Change for the Central Coast Region
2016 has been a year of change in administrative and management structures for two major stakeholder
groups in the region’s visitor economy - in local government and in regional tourism organisations. While
change can be unsettling and result in loss of continuity if not managed appropriately, the opportunities
provided by new governance, management and partnership arrangements need to be embraced as part
of the new destination management plan.
Council Amalgamation
Figure 3: New Central Coast Council Area
In 2016, the NSW Government approved the merger of
former Gosford City and Wyong Shire councils to create the
new Central Coast Council. The new council is comprised of
five wards, as seen in figure 3;
Gosford West Ward
Gosford East Ward
The Entrance Ward
Wyong Ward
Budgewoi Ward
The new Council commenced operations on 12 May 2016,
being managed under interim governance arrangements with
council elections which are scheduled for September 2017.
NSW Regional Tourism Network Figure 4: New NSW Regional Tourism Network
In 2015 the Board of Destination NSW was Boundaries
tasked with reviewing the NSW Regional
Tourism Organisations (RTOs) model. This review
resulted in the implementation of new regional
tourism network structures in 2016.
Six new destination networks were created through
consultation with 931 key industry associations and
stakeholders aiming to improve the Regional NSW
visitor economy, resulting in the following
destinations:
Sydney Surrounds North (Blue Mountains,
Central Coast, Hunter, Hawkesbury, Penrith and
Lake Macquarie)
Riverina Murray
Southern NSW (Snowy Mountains and Far South
Coast)
North Coast (from Mid-Coast to Tweed Heads including Lord Howe Island)
Country and Outback NSW
Sydney Surrounds South (Southern Highlands, Wollongong and Shoalhaven).
The boundaries of the new Destination Networks (DNs) aim to reflect the consumer’s approach to
experiences and visitation patterns, and encourage the development of visitor economy initiatives within
NSW.
1
New Tourism Network for Regional NSW, Stuart Ayres & Tony Grant, 2016, Media Release
CENTRAL COAST DESTINATION MANAGEMENT PLAN 2017-2021| DRAFT 5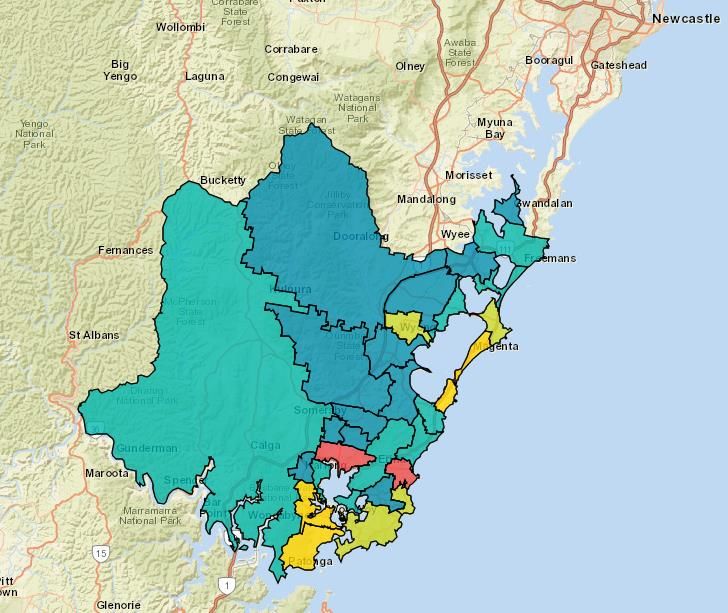
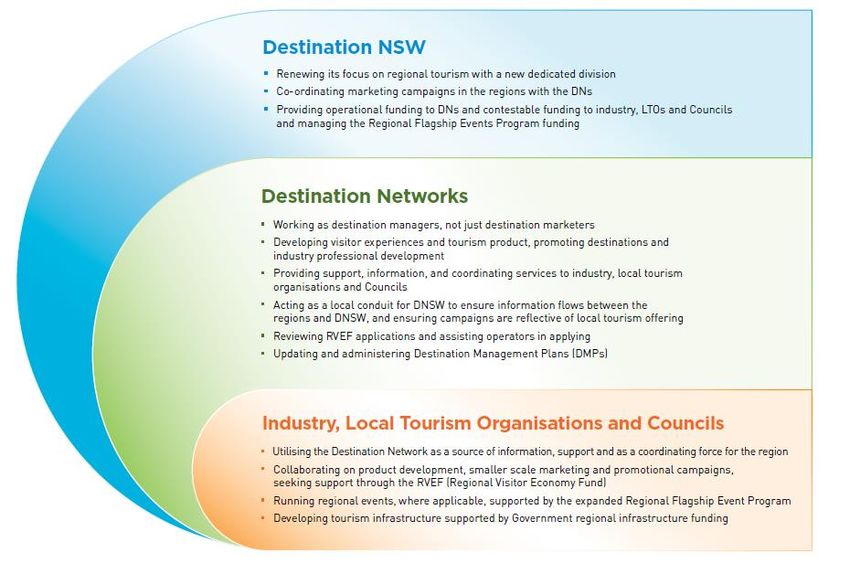
The role of the DNs will be to facilitate visitor economy growth at the local level, through representing and co-ordinating the region’s tourism industry. DNs will predominantly be destination managers. Their core responsibilities will be: Industry Engagement and Industry Development Product Development Training and Education Preliminary Review of Local RVEF (Regional Visitor Economy Fund) Applications to ensure quality/compliance with guidelines. Collaboration with DNSW on industry activities. These activities will be undertaken in alignment with the region’s local tourism industry, Local Tourism Organisations, Local Government, Joint Organisations and other local organisations. Figure 5: Roles and Responsibilities in New NSW Regional Tourism Network. Transitional funding will be provided by DNSW to current Regional Tourism Organisations including Central Coast Tourism to assist in completing current projects in 2016 and transitioning to new arrangements. DNSW’s guidance notes that RTOs may consider evolving their remit to operate as a local tourism organisations in future. This type of arrangement would not receive core funding support from DNSW, with business models being based on revenue generated from provision of services, local government and business support, and other income streams. CENTRAL COAST DESTINATION MANAGEMENT PLAN 2017-2021| DRAFT 6
CENTRAL COAST DESTINATION MANAGEMENT PLAN 2017-2021| DRAFT 7
3              About the Central Coast

Regional Overview
The Central Coast is located in a unique position
                                                          Figure 6 Central Coast Region
midway between Sydney and Newcastle, providing for
a population in excess of 5 million within an
approximate 90 drive time radius.

The Central Coast is well known for its outstanding
natural amenity, with the region itself home to nearly
340,000 residents in 2016. Further growth is forecast,
rising to an estimated population of 415,000 by 2036.
This population boom will require the construction of a
further 40,000 new homes as well as vital
infrastructure to support the growing population.

The National Highway both links and divides the region
and its proximity to Sydney provides easy short break
access while facilitating over 38,000 commuters
travelling for work outside of the region each day.
Creating local employment and retaining young people
(18 – 29 years) remains a key challenge for the region.

Tourism plays an important role in the region’s
economy with the largest sectors being; retail, manufacturing, property and business services, and health
and community services. The tourism industry generates essential expenditure which trickles down and
supports businesses throughout the Central Coast economy.

CENTRAL COAST DESTINATION MANAGEMENT PLAN 2017-2021| DRAFT                                      8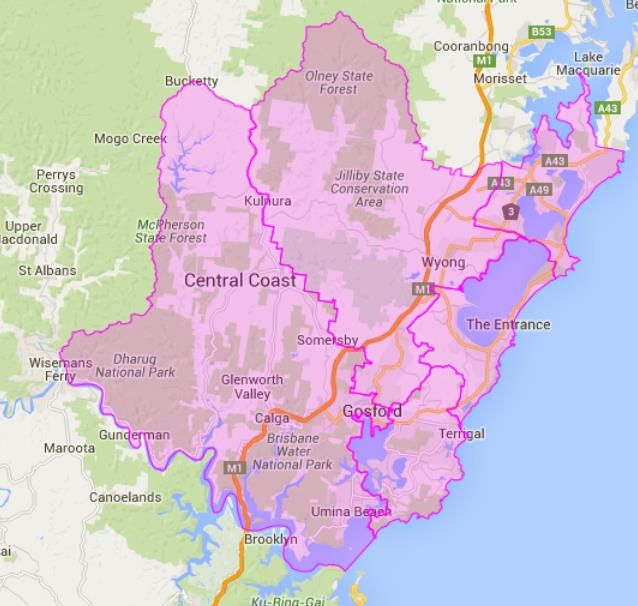
Key Visitor Trends
The following data (see Figure 7) summarizes key visitor trends and profiles for the Central Coast for the
Year Ending December 2016 by Tourism Research Australia. A more detailed visitor analysis is included in
Appendix 2.

Figure 7: Central Coast Visitation Summary

           VISITATION

                        The Central Coast received over                 72% of visitors were
                        4.8 million visitors in 2016,                   domestic day visitors.
                        increasing by 7% p.a. since 2014.

                        Domestic ALOS* is 2.8                          Over 4.34 million
                        nights, while international                    visitor nights in 2016,
                        ALOS is 13 nights                              growing by 1% p.a.
                                                                       since 2010
                        Average spend of day visitors                   Approximately $867
                        is $84, compared with $145                      million expenditure in
                        of domestic overnight                           YE Dec 2016.
                        visitors.
           PURPOSE & TOP ACTIVITIES
                        The main purpose of visit for                  The main purpose of visit
                        international visitors to visit                for domestic visitors was
                        friends and families (53%),                    visit friends and families
                        followed by holidays (36%)                     (47%), followed by
                                                                       holidays (45%)
                      Top activities for day visitors                  Domestic visitors have
                      are eating out (22.7),                           participated in 2.3 activities
                      followed by VFR**                                on average, compared to
                      (20.4%) and sightseeing (9%)                     international visitors’ 9.6
                      Majority of visitors stayed                      activities on average
                      with friends & relatives
                                                                       The most common type of
                      (54%), followed by
                                                                       transport was self-drive
                      hotel/resort/motel or motor
                                                                       vehicles (92.2%)
                      Inn (17%)
           KEY MARKETS

                        66.1% of domestic visitors                    The majority of visitors came
                        came from Sydney and 17%                      UK (19%), followed by NZ
                        from Hunter region                            (18%) while visitors from
                                                                      North America have grown
                                                                      the most since 2012 (21.8%)
                        48% of visitors were 55+                      p.a.). 31% of total visitors
                                                                      While
                        years old, followed by 25-34                  travelled as an adult couple,
                        years old visitors (21%).                     26% travelled as
                                                                      unaccompanied travellers

*Average length of stay
** Visiting Friends and Relatives

CENTRAL COAST DESTINATION MANAGEMENT PLAN 2017-2021| DRAFT                                            9
Visitation
In the Year Ending December 2016, the Central Coast received over 4.85 million visitors in total, of which
the majority (71.9%) were domestic day visitors, followed by domestic overnight visitors (27.1%).
Although international visitors only accounted for about 1% of total visitors, the market had the biggest
average growth rate per annum (10.9% p.a.), compared to domestic overnight visitors’ 1% p.a. and
domestic day visitors’ 2.1% p.a. decrease. Even though both domestic overnight and international
visitation increased over the five year period since 2012, the Central Coast’s average visitation growth
took place at a slower pace than for NSW as a whole (See Figure 8). The Central Coast region received
5.3% of NSW’s total visitation YE December 2016.
NSW Int:
Figure 8: Central Coast and NSW visitation (2010-2016) 9% p.a.
4,500,000 60,000
↓ 2.1% p.a.
4,000,000
50,000
3,500,000
International Visitation
Doemstic Visitation
3,000,000 40,000
↑10.9 % p.a.
2,500,000
30,000
2,000,000
1,500,000 20,000
1,000,000
↑ 1.0% p.a. 10,000
500,000
- -
2012 2013 2014 2015 2016
Domestic Overnight Domestic Day International
Visitor Nights
Central Coast has received over 4.3 million visitor nights (2.3% of NSW’s visitor night share), which has
grown on average by 1% p.a. since 2012. Domestic visitors accounted for approximately 86% of visitor
nights, while international visitors contributed around 14% of visitor nights. International visitors also had
a higher average length of stay (ALOS) compared to domestic visitors, staying for an average of 13 and 2.8
nights respectively.
Main Purpose of Visit
Compared to the other ‘Sydney Surrounds North’ areas of the Blue Mountains and South Coast, the
Central Coast has a distinct visitor profile characterised by a notably larger visiting friends and relatives
(VFR) market, and smaller holiday sector (see Figure 9).
Bleisure Trends 2-
Recent results from Expedia (USA) show that 43% of US business travellers now extend their stays
for Leisure (Dec, 2016)
2
Bleisure travel: 43% of business trips are extended for leisure purposes, December 2016, eTN
CENTRAL COAST DESTINATION MANAGEMENT PLAN 2017-2021| DRAFT 10Figure 9: Central Coast, Blue Mountains and South Coast Visitor Profile (Main Purpose of Visit), 2016 International Visitor Origins The top five international visitor country origins were: Central Coast: NSW: 1. United Kingdom (19%) 1. China (17.6%) 2. New Zealand (18%) 2. New Zealand (11%) 3. USA (13%) 3. USA (11%) 4. Korea (4.9%) 4. United Kingdom (9.6%) 5. France (4.7%) 5. Korea (5.3%) Figure 10 illustrates the relative significance of the New Zealand, UK and Korean international markets to the Central Coast in comparison with NSW. Although Chinese visitors do not register as a significant market for the Central Coast at present, it was the second fastest growing market since 2012, increasing by 23% per annum on average (Figure 11). CENTRAL COAST DESTINATION MANAGEMENT PLAN 2017-2021| DRAFT 11
Figure 10: Central Coast and NSW Top 5 International Visitor Origins, 2016

   25%

   20%

   15%

   10%

    5%

    0%
               China            United States of    New Zealand     United Kingdom     Korea          France
                                    America
                                                    Central Coast        NSW

     In comparison, China has been NSW’s largest visitor market, accounting for 17.6% of the total
     international visitors. Central Coast has also seen the strongest average growth from the Korean market
     (54% p.a.), while visitors from New Zealand and UK have had a rather steady increase since 2012.

     Figure 11: Central Coast and NSW Average % Change per annum International Visitor Origins (2010-2016)

                 France

                  Korea

         United Kingdom

           New Zealand

United States of America

                  China

                           0%         10%          20%        30%        40%     50%      60%      70%         80%

                                              NSW             Central Coast

     CENTRAL COAST DESTINATION MANAGEMENT PLAN 2017-2021| DRAFT                                      12
Expenditure
On average, domestic day visitors to the Central Coast spent $84 on their trip, while international visitors
spent $56 per night, and domestic overnight visitors spent $145 per night, contributing a total of over
$867 million in visitor expenditure to the region. Although domestic day visitors make up just over 72% of
all visitations to the Central Coast, they contribute around 34% of visitor expenditure. In comparison,
international visitors contributed over 4% of expenditure, regardless of their low share in visitors market
(1% of all visitors). Domestic overnight visitors, however, contributed the largest proportion of overall
visitor expenditure, which was approximately 62%.
Figure 12: Visitor Expenditure, YE December 2016
$34,711,884
International
$293,290,043
Domestic O/N
Domestic Day
$539,249,967
CENTRAL COAST DESTINATION MANAGEMENT PLAN 2017-2021| DRAFT 13The Influence of Sydney’s Outbound Market
As can be seen in figure 13, the Central Coast, along with the regions of Blue Mountains, South Coast and
the State as a whole all rely on Sydney’s outbound visitor market as their key source of trade.
Sydneysiders account for 66% of Central Coast’s visitor market.
Figure 13: Top 5 Domestic Origins by Region, YE December 2016
Central Coast South Coast Blue Mountains
NSW
1. Sydney (66.2%) 1. Sydney (50%) 1. Sydney (78.2%)
1. Sydney (38.2%)
2. Hunter (13.5%) 2. Canberra (6.7%) 2. Central NSW (3.7%)
2. Hunter (9.6%)
3. Blue Mountains 3. Capital Country 3. South Coast (3.5%)
3. South Coast (7.7%)
(1.9%) (6.2%)
4. Hunter (1.9 %)
4. North Coast NSW
4. North Coast 4. Melbourne (1.7%)
5. Central Coast (7.3%)
NSW (1.7%)
5. Blue Mountains (1.6%)
5. Canberra (3.6%)
5. Canberra (1.5%) (1.3%)
However, in comparison to the other Sydney surrounding regions of South Coast, Blue Mountains and the
Hunter region, the Central Coast is losing market share of Sydney’s outbound market. The region has
experienced a decline in market share since 2010, while all other regions (except for the Hunter) have
increased in their shares of this market (See Figure 14). This competitive loss of market share may be due
to factors including lack of new flagship attractions, changing consumer trends that preference other
destinations, perception of the range of products and experiences on offer, and/or reduction of
investment in marketing.
Figure 14: Share Shifts of Sydney’s Outbound Market (2010-2016)
Hunter Central Coast
↓1% ↓1%
Blue Mountains
↑2%
South Coast
↑1%
CENTRAL COAST DESTINATION MANAGEMENT PLAN 2017-2021| DRAFT 144 Target Markets & Growth
Potential
In order to continue to grow the value of tourism to 2021 for the Central Coast, a series of target markets
has been identified (Figure 16). These markets have been identified via review of market research and
industry consultation, and selected on the basis of attributes such as; market size, time and length of
travel, yield, and fit with Central Coast’s visitor experience offering.
Figure 16 Central Coast’s Target Markets
PRIMARY GROWTH MARKETS MARKETS TO RETAIN
Sydney Long-Break (4+ nights) Domestic Day Visitors
Leisure, Business & Special Events: Sydney Short-break Market (1-3 nights)
- Weddings (beach wedding capital)
EMERGING AND POTENTIAL MARKETS
- Sporting Events (inc. mountain biking)
Asian leisure and VFR visitors
Young Family Escapes (Regional NSW, VIC and
QLD) Culture & Heritage
Soft adventure Niche Markets (i.e. pet-friendly)
Food (intertwined with other markets)
Caravan & Camping (long and short haul)
If the Central Coast were to follow national growth rates for visitation, nights and expenditure set by the
Tourism Forecasting Committee (TFC), the region would see a forecasted $1.2 billion in visitor
expenditure in 2021 (See Figure 17).
Figure 17: Central Coast’s Visitor Market Forecast
7,000,000 $1,400,000,000
6,000,000 $1,200,000,000
5,000,000 $1,000,000,000
Visitors & Nights
Expenditure
4,000,000 $800,000,000
3,000,000 $600,000,000
2,000,000 $400,000,000
1,000,000 $200,000,000
- $-
2010 2011 2012 2013 2014 2015 2016 2017 2018 2019 2020 2021
EXPENDITURE VISITORS NIGHTS
CENTRAL COAST DESTINATION MANAGEMENT PLAN 2017-2021| DRAFT 15Target Market Growth by 2021
The approach set out in the following section of this report is based on the premise of growing the
economic contribution from a selection of target markets above the ‘business as normal’ TFC forecast by
achieving a shift in Central Coast’s capture of its target markets (referred to as ‘shift share’). Other target
market expenditure and visitation is based on growth continuing at TFC rates.
If the Central Coast achieved the goal share shifts in the Asia, Business and Sporting Events, Culture and
Heritage, and Sydney Long-Break Markets by 2021, the region could attract an additional $74 million of
visitor expenditure above TFC growth rates.
This would contribute to a total of $1.2 billion in total visitor spend on the Central Coast in 2021.
Figure 18 provides a summary of the potential additional value above TFC forecasts which a successful
shift in target markets would achieve.
Figure 18: Target Market Shift Share
2021
Key Target Market 2021 TFC Shift - Additional
2016 Value 2016 Share
Segments Value Share Value (above
TFC)
NATURE, CULTURE &
$64M $94M 3.0% 0.5% $34.5M
HERITAGE
SYDNEY LONG BREAK $121M $160M 7.2% 0.8% $18M
BUSINESS &
$22.7M $31.8M 3.8% 1.0% $17M
SPORTING EVENTS
ASIAN LEISURE AND
$4M $6.8M 0.5% 1.0% $4M
VFR
Sydney Long Break Market:
With approximately 66% of Central Coast’s domestic market originating from Sydney, the region
significantly relies on Sydney’s outbound market due to its size of population and proximity to the
location. However, the aim for Central Coast is to move away from the Sydney short-break market, and
into the Sydney long-break market, through a targeted campaign selling the destination as ‘Sydney’s
Beach Break’, encouraging longer, more relaxed and extended stays.
Targeting the long-break market from Central Coast’s major visitor origin also fills in mid-week and off-
peak occupancies (long-break markets stay for at least 4 nights), and have higher expenditures.
Currently worth approximately $121 million in visitor expenditure, if the Central Coast could increase
its share of the Sydney Long-Break Market from NSW by 0.8% to 2021 (total share goal of 8%), the
region would see an additional $18 million in expenditure above TFC forecasts.
Asian Markets:
Asia is the fastest growing and highest yielding visitor origin region in the world. NSW currently attracts
60% of all Chinese visitors to Australia, and if this market share is maintained, the value of Chinese
inbound tourism alone will double by 2020, contributing more than $2.1 billion in expenditure annually
(directly responsible for 13,900 jobs), and be NSW’s largest international market in terms of arrivals,
nights and expenditure3.
3
Destination NSW China Tourism Strategy 2012-20
CENTRAL COAST DESTINATION MANAGEMENT PLAN 2017-2021| DRAFT 16Although predominately group travel based, free independent travellers (FIT) are now starting to emerge from the Asian market, with Chinese visitors now ranking as Australia’s 3rd largest for dispersed nights3. This, along with Tourism Australia’s and DNSW’s compelling proposition for Australian promotion in China is for ‘accessible nature’ or ‘city plus nature’; the Central Coast is in an ideal position to work with DNSW to leverage the Asian market through Sydney. Currently worth approximately $4 million in visitor expenditure (mainly through education and VFR), if the Central Coast could increase its share of the Asian leisure market from NSW by 1% to 2021 (total share goal of 1.5%), the region would see an additional $4 million in expenditure above TFC forecasts. However, in order for Central Coast to achieve this ambitious goal, the region needs to address concerns regarding product quality, consumer relevance and language needs. This includes the need to work with DNSW to gain a better understanding of the motivations behind Asian visitors, working with DNSW to help expand trade distribution networks, and build packages, ensuring the region is Asia-ready with mandarin speaking staff interpretative resources and promoted retail access and experiences. Business and Sporting Events Market: Event tourism is a growing trend nationally, particularly participation in sports and travel for business. Tourism and events are intrinsically linked, and are an integral part of a region’s proactive approach to tourism, economic and social development. The Central Coast is attracting a growing number of events, with business travel growing by almost 26%p.a. since 2010. Sporting events area also a popular activity in the region, with the destination boasting an array of sporting fields, football, soccer, golf, sail and racing clubs as well as a stadium; offering potential for further growth. Events are an important ‘mid-week’ market to grow, creating a reason to visit and drive visitor expenditure during traditional off-peak periods Currently worth approximately $22.7 million in visitor expenditure, if the Central Coast could increase its share of the Business and Sporting Events market from NSW by 1% to 2021 (total share goal of 4%), the region would see an additional $17 million in expenditure above TFC forecasts. Nature, Culture and Heritage Market: The Cultural and Heritage Market is a broad market which includes theatre, performing arts, museums and art galleries, craft workshops and studios, festivals and fairs, history and heritage sites and buildings, and indigenous sites and experiences. Positive trends at regional, state and national levels indicate a strong and long-lasting interest in cultural tourism. With Laycock Street Community Theatre, Wyong Art House, and Cessnock Performing Arts Centre located just outside of the Central Coast, and the potential for a Performing Arts Centre in Gosford (following final feasibility and location studies), the region has sufficient infrastructure and programs to encourage visitation to the region and increase length of stays by encouraging participation in cultural and arts activities. The Gosford Classic Car Museum is a significant attraction in this market, housing the largest car museum in the Southern Hemisphere, showcasing over 450 cars and motorcycles. The collection is currently valued at over $70 million, with the museum looking to expand into specialised events and packages. Currently worth approximately $64 million in visitor expenditure, if the Central Coast could increase its share of the Cultural and Heritage Market from NSW by 0.5% to 2021 (total share goal of 3%), the region would see an additional $34.5 million in expenditure above Tourism Forecasting Committee (TFC) forecasts. CENTRAL COAST DESTINATION MANAGEMENT PLAN 2017-2021| DRAFT 17
Soft Adventure Market:
Soft adventure encompasses all low-risk adventure tourism activities such as surfing, kayaking,
snorkelling and mountain biking. These activities are largely outdoor-orientated and are more accessible
to key markets such as families, school groups and mature visitors. Australia’s nature-based offerings
contribute significantly to the success of the soft adventure market at regional, state and national levels.

With more waterfront than Sydney Harbour, the Central Coast’s waterways and beaches provide the
region with a critical competitive advantage, especially in addition to its pristine mountains and
hinterland. Encouraging local business and start up innovation in nature-based and soft adventure
opportunities is a growth opportunity, and will keep the already strong industry and infrastructure
growing (i.e. Glenworth Valley, TreeTops).

Weddings
Weddings have also been identified as a target growth market, however, Tourism Research Australia
(TRA) data does not treat weddings as a discrete ‘purpose of travel’ category therefore data isn’t
currently available to determine a shift share target. Nonetheless, the region’s wide range of coastal and
inland venues offers potential for growth.

Developing a niche position, collaborating with industry and government, and successfully promoting it
to market are key enablers in this sector. This could potentially take the form of a beach weddings
program with identified sites for beach and hinterland weddings and marquee receptions.

CENTRAL COAST DESTINATION MANAGEMENT PLAN 2017-2021| DRAFT                                         18
CENTRAL COAST DESTINATION MANAGEMENT PLAN 2017-2021| DRAFT 19
5 Vision, Mission and Goals
ASPIRATION SUPPORTING ACTIONS
In order to achieve this vision, the region needs to
Vision: capitalise its unique selling points or visitor drivers:
The vision for the Central Coast is to be the
Water and natural features
natural choice for leisure, business and special
Central Coast Community, Culture and
events in regional NSW.
History including our beach culture
Connection of the different experiences
available across the region (beach,
hinterland, towns)
The mission will be achieved through:
Mission: A focus on sustainable tourism that
The Visitor Economy on the Central Coast makes a encourages mid-week, off-peak and
positive contribution to the community through dispersed visitation.
building local pride, youth employment, and Community engagement through events
supporting major events and community and new experiences
infrastructure. Brand building campaigns that lift
community pride and drive investment
The visitor economies contribution to
youth employment
Supporting measure of success include (and how
Goals: they will be measured):
The success of the DMP will be measured through: Awareness, Preference and Intention to
visit with a clear destination identity and a
Growing the value of the visitor economy by
shift in perceptions of the range and depth
$70M per annum above growth forecasts
of experiences in key target markets
Target dispersed growth mid-week, off-peak
(primary research)
and across the destination (coast &
Growing Customer satisfaction
hinterland)
Youth Employment (ABS trends)
Above NSW average growth in the value and
Industry and Community awareness of
visitation by identified target markets
the value of the visitor economy (primary
Growing community support for the visitor
research)
economy
Lift number of activities participated in by
visitors (NVS, IVS)
CENTRAL COAST DESTINATION MANAGEMENT PLAN 2017-2021| DRAFT 20CENTRAL COAST DESTINATION MANAGEMENT PLAN 2017-2021| DRAFT 21
6            Strategic Priorities and Projects

To achieve the destination vision and goals, a concise set of strategic priorities and projects are required
to guide collective action and investment. It is recommended that action is categorised under 3 strategic
priorities, with each having at least 1 priority project;

Strategic Priority 1:             Drive visitor expenditure through targeted campaigns
Priority Project 1:               Develop and implement a new Destination Brand and
                                  targeted campaign activity, in partnership with Council, to
                                  deliver a clear single message for the destination.

Strategic Priority 2:             Encourage Visitor Dispersal

Priority Project 2:               Establish an events strategy program which maintains and
                                  grows off-peak, multi-day events.

Strategic Priority 3:             Boost Community Support Through Tourism Employment

Priority Project 3:               Develop entrepreneur, innovation hubs and mentoring
                                  programs specifically targeting youth employment in the
                                  tourism sector to lift the overall visitor experience, product
                                  development and investment attraction

Enablers:                         Create an environment for investment and reinvestment which
                                  drives new product, new stories and new reasons to stay and
                                  spend on the Central Coast.

CENTRAL COAST DESTINATION MANAGEMENT PLAN 2017-2021| DRAFT                                          22
Strategic Priority 1: Drive visitor expenditure through targeted campaigns
The Central Coast faces growing competition in its key target markets (Sydney, Regional NSW) and is
losing market share. While day and international markets are growing above the NSW average, the
challenge remains to lift domestic overnight stays to above the average and regain lost market share.
The reasons identified for a loss of market share include:
Lack of a clear and iconic ‘wow’ experience
Increasing competition from other coastal destinations
Lack of clarity in the sales messages across industry, regional marketing and the State
campaigns
Priority Project #1: Develop and implement a new Destination Brand and targeted campaign activity,
in partnership with Council, to deliver a clear single message for the destination
Supporting Projects:
Visiting Friends and Relatives (VFR) Campaign – linked to messages to Council’s place building
campaign to drive local awareness, pride and visitor participation in activities and events.
Long-Break Sydney Outbound Campaign – targeting longer stays (4-7 nights) from Sydney
residents to regain market share and encourage stays during the off-peak mid-week times.
Supporting Actions and Opportunities:
Partners
Action Timing
(Bold to Lead)
1.1 Work with the Destination Network and DNSW to scope and
deliver a targeted campaign for the Sydney long-stay (4+) CCC, DN, DNSW 2017/18
market seeking a beach and nature-based escape
1.2 A revamped Council website, linked to the destination website,
CCC 2018
to drive local and VFR awareness
1.3 Implement a Regional Signage Strategy following the place
strategy and branding of each village with a clear village and CCC 2019
town centre identity
1.4 A year-round ‘always on’ social media campaign focused on the
CCC, Industry Ongoing
region’s USPs and unexpected experiences
1.5 International product mentoring to increase the range and depth
of experiences on offer at international trade shows such as the CCC Ongoing
Australian Tourism Exchange (ATE)
1.6 Introduce a customer experience monitoring and mentoring
program, measured through analysis of visitor satisfaction CCC Ongoing
ratings such as TripAdvisor (using programs such as ReviewPro)
CENTRAL COAST DESTINATION MANAGEMENT PLAN 2017-2021| DRAFT 23Strategic Priority 2: Encourage Visitor Dispersal
Domestic overnight and day visitation to the Central Coast generally peaks during the summer months of
January and December, with key off-peak months being June through to August (See Figure 6), reflecting
seasonal weather patterns, key regional events and school holidays. The figure below does not include
international overnight and international day seasonality trends.
Figure 19: Domestic Seasonality Trends of Central Coast and NSW (3 Year Averages 2014-2016)
12%
11%
10%
9%
8%
7%
6%
5%
4%
Jan Feb Mar Apr May Jun Jul Aug Sep Oct Nov Dec
Central Coast NSW
Priority Project #2: Establish an events strategy which supports the development and growth of off-
peak, multi-day events across the target markets of nature, culture, special events (e.g. weddings,
conferences), and soft adventure.
Events can play a significant role in encouraging new and repeat visitation to a destination, creating
specific reasons to visit and increased visitor expenditure during traditional off-season. Implementing
strategies such as utilising events to shift peak demand, both by day of the week, and month of travel, is
vital to managing the future visitor experience and sustainable destination.
Supporting Projects:
Conference and Events Promotion – Increase private and public marketing funds for the
promotion of the Central Coast as a conference and events destination to attract off-peak and
multi-day events which drive out-of-region visitation
CENTRAL COAST DESTINATION MANAGEMENT PLAN 2017-2021| DRAFT 24Supporting Actions and Opportunities:
Partners
Action Timing
(Bold to Lead)
2.1 Develop a business case for new mountain bike trails to attract a
CCC, NPWS 2018/19
world-class event to the Central Coast
2.2 Ensure Council Planning guidelines for beach events are
supportive of flexible uses and promote the steps required to CCC, LGA NSW 2018
run beach-based events
2.3 Create an investment platform for new nature-based tourism
projects through an Ecotourism and Rural Tourism CCC, State Govt 2019-2021
Opportunities Study
2.4 Map and develop Management Plans for sacred sites to ensure Indigenous
2021
they are not impacted by future outdoor recreation programs Groups, CCC
2.5 Utilise the new Tuggerah Regional Sporting and Recreation
Complex to host, not only sporting events, but also more
CCC 2019/20
community and social events through the multipurpose indoor
complex.
CENTRAL COAST DESTINATION MANAGEMENT PLAN 2017-2021| DRAFT 25Create investment platforms and incentives for nature-based tourism projects
Being underrepresented in outdoor adventure, nature-based and accommodation products compared
to destination comparators (see ATDW Table 1 and Figure 20 below), the Central Coast has an
opportunity to capitalise on its hinterland and marine visitor growth and encourage visitor dispersal
through increasing its outdoor adventure and nature-based product and accommodation offering.
To sustainably promote hinterland product and visitor dispersal, it is recommended an Ecotourism
and Rural Tourism Opportunities Study be prepared to qualify major market gaps, identify key
opportunities based on recent and forecasted trends, identify potential sites, promote awareness of
opportunities and provide advice on key experience investments. Following this initial detailed study,
Council may then publish an Expression of Interest to encourage investment in additional hinterland
product including the potential for investment incentives such as rate reductions and streamline
planning to encourage private investment.
Table 1: Australian Tourism Data Warehouse Product Listings
ATDW Listed Central Sunshine Mornington Comparator
South Coast
Product Coast Coast Peninsula Average
Tours 18 86 73 20 60
Accommodation 35 296 132 25 151
Attractions 19 115 30 22 56
Food & Wine 14 30 9 22 20
Nature - Based 5 32 14 8 18
Family - Friendly 4 26 11 7 15
Outdoor
5 17 8 6 10
Adventure
Marine - Based 4 17 5 4 9
Arts, Culture &
4 22 13 8 14
Heritage
Aboriginal 0 0 0 0 0
Figure 20: Average Number of Different Activities Participated in by Domestic Visitors
CENTRAL COAST DESTINATION MANAGEMENT PLAN 2017-2021| DRAFT 26Strategic Priority 3: Boost Community Support Through Employment
This strategy presents significant opportunity to capitalize on, and develop, Central Coast’s available
workforce. With a high number of residents journeying outside of the region for employment, and a
significantly high youth unemployment rate of 16.5% (29% above the national average), tourism and
hospitality plays an important role in providing pathways and soft skills for young people in the
community.
The tourism sector provides a valuable source of employment for young people, especially by students
who often undertake part-time or casual work in the industry whilst studying. In fact, as much as 39% of
all tourism related jobs are filled by youth aged between 15 and 24 years old in the Asia-Pacific region4.
Priority Project #3: Develop entrepreneur, innovation hubs and mentoring programs specifically
targeting youth employment in the tourism sector to lift the overall visitor experience, product
development and investment attraction, investigating possible opportunities in partnering with the
Regional Library and Smart Hub.
There are numerous ways in which the tourism industry can provide youth employment for the Central
Coast. Developing youth entrepreneur or start-up programs specifically for the tourism sector can benefit
the region by removing barriers to entry for young persons through the creation of low-cost, shared
business facilities and technology spaces.
Supporting Projects:
Local Ambassadors Program – Develop and implement a Local Ambassadors Program to build
local support for the visitor economy
Supporting Actions and Opportunities:
Action Partners (Bold to Lead) Timing
3.1 Further investigate the opportunity for the Central Coast to
CCT, Industry Long Term
be recognised as a National Surfing Reserve
4
United Nations World Tourism Organisation (UNWTO) 2009, The Tourism Labour Market in the Asia-Pacific Region, http://www.e-
unwto.org/doi/pdf/10.18111/9789284413133
CENTRAL COAST DESTINATION MANAGEMENT PLAN 2017-2021| DRAFT 277 Enablers of Success
The success of this Destination Management Plan and its strategies are underpinned by a series of
enablers outlined below:
Investment Attraction
The region needs investment and reinvestment in new products and experiences, including
accommodation, attractions and experiences (including marine-based, nature based and culinary). To do
this an investor-friendly environment is essential (see case study over the page).
Accessibility (Creating Accessible Tourism Experiences)
With one in five people in Australia having some form of disability (over 4 million people)5, Central
Coast’s tourism industry and community have identified disability tourism as an enabler of success, in
which the Central Coast could comprehensively cater to this market. It is recommended that two
precincts on the Central Coast (each in the Northern and Southern regions) be chosen as pilot and
market-first areas to lead the region in accessible tourism. These precincts would first require detailed
audits to determine the level of disabled friendly infrastructure, product and experiences currently
available that impact the entire visitor experience, then based on this audit, would need to undergo any
infrastructure required to facilitate easy access.
Connectivity (Visitor Transport)
While most visitors travel to the destination by self-drive vehicle, an initial visitor offering gap was
identified through consultation of visitors who are able to arrive in region (via public transport such as
train) but are unable to move between attractions or towards the hinterland due to lack of connecting
public transport routes or lack of information provided on public transport service routes.
By undertaking an initial Pre-feasibility Study and Preliminary Visitor Transport Mapping Model research
(e.g. number of trips required, routes, number of visitors, time of departures, etc.), the region is able to
assess the extent of market gap and potential models for visitor transport. This could include options
such as a mini-bus operated by key attractions whose visitors use the service or a local driver Uber type
service which is packaged and subsidised specifically for visitors.
Community Support
Community support for tourism is vital in providing an overall complete positive visitor experience to all
visitors, and in growing tourism to encourage higher yield, expenditure and in turn, local jobs. The first
step in understanding how communities and residents perceive tourism to help inform decision making
and regional tourism authorities, by undertaking a ‘Have Your Say Platform’ to undertake a Community
Impact Assessment on an agreed set of social indicators that have been used in other regions such as
Queensland. Community attitudes of tourism in the Central Coast can then be compared to other regions
to gain a relative understanding of how tourism is perceived to positively or negatively impact the Central
Coast.
CASE STUDY: Redland City Council, Queensland – Hotel Development Incentives
5Redland City Council established an incentives package to facilitate further development of the
Australian Network on Disability
Cleveland Central Business District (CBD) as well as contribute to jobs and growth across the region.
CENTRAL COAST
Investors DESTINATION
can take advantage MANAGEMENT
of: PLAN 2017-2021| DRAFT 28
75%-100% discount on infrastructure contributions, depending on the development type
20-business day assessment timeframe
Car-parking concessions for complying developmentsCENTRAL COAST DESTINATION MANAGEMENT PLAN 2017-2021| DRAFT 29
8           Measures of Success

Volume and Value Goals
    - Increase the value of the visitor economy by $70M per annum above forecast growth
    - Increase Central Coast’s market share of
          o Sydney long break visitors to NSW by 1.4% by 2021
          o Asian visitors to NSW by 0.8% by 2021
          o Business and Sporting Event Visitors to NSW by 1.2% by 2021
          o Culture and Heritage visitors to NSW by 0.5% by 2021
    - Increase tourism employment locally by 300 jobs by 2021 with a focus on youth employment
    - Diversify Central Coast’s visitor and market mix to reduce seasonality in visitation patterns

Qualitative Goals

    -   Build community satisfaction with tourism on the Central Coast, targeting a 10% improvement
        from 2017 benchmark
    -   Build customer satisfaction with Central Coast tourism experiences, targeting a 10%
        improvement from 2017 benchmark
    -   Improved perception of Central Coast in target markets, as measured by ROI from marketing
        investment

Financial and Investment Goals

    -   Value of new private sector tourism investment by 2021
    -   Value of public sector investment per year , maintained over the course of the DMP
    -   Value of co-operative marketing investment will grow by 5% year on year over the course of the
        DMP

 ANCILLARY EXPERIENCE MIX

CENTRAL COAST DESTINATION MANAGEMENT PLAN 2017-2021| DRAFT                                     30
CENTRAL COAST DESTINATION MANAGEMENT PLAN 2017-2021| DRAFT 31
Appendix 1: Central Coast
                 Tourism Profile
The following section provides an overview of the latest available key visitor trends in the region, sourced
from the National and International Visitor Survey data (for the year ending December 2016) from
Tourism Research Australia.

For the purposes of this Paper, visitation data and trends include the Statistical Areas (level 2) identified
in Figure A6.

Figure A: Tourism Research Australia Statistical Areas Level 2 for the Central Coast region

6
  For the purposes of this Paper, visitation data and trends includes the Statistical Areas (level 2) of: Avoca Beach-Copacabana, Box Head-
MacMasters Beach, Calga - Kulnura, Erina- Green Point, Gosford - Springfield, Kariong, Kincumber -Picketts Valley, Narara, Niagara Park -
Lisarow, Point Clare - Koolewong, Saratoga - Davistown, Terrigal - North Avoca, Umina - Booker Bay - Patonga, Wamberal - Forresters
Beach, Woy Woy - Blackwall, Wyoming, Bateau Bay - Killarney Vale, Blue Haven - San Remo, Budgewoi - Buff Point - Halekulani, Chittaway
Bay - Tumbi Umbi, Gorokan - Kanwal - Charmhaven, Jilliby - Yarramalong, Lake Munmorah - Mennering Park, Ourimbah - Fountaindale,
Summerland Point - Gwandalan, The Entrance, Toukley - Norah Head, Tuggerah - Kangy Angy, Warnervale - Wadalba, Wyong, Central
Coast Region nfd.

CENTRAL COAST DESTINATION MANAGEMENT PLAN 2017-2021| DRAFT                                                                       32
Visitation Growth and Market Share:
In 2016, Central Coast received approximately 4.85 million visitors, of which 71.9% were domestic day
visitors, 27.1% were domestic overnight visitors and 1% were international visitors. These domestic day
(NVS Day) visitors have increased by an average of 0.2% per annum (p.a.) since 2012, while domestic
overnight visitors (NVS O/N) and international (IVS) visitors have grown by an average of 1%p.a. and
911%p.a. since 2012 respectively (See Figure B).
Figure B: Visitation to the Central Coast, 2012-2016
4,500,000 60,000
4,000,000 ↓ 2.1%
50,000
3,500,000
International Visitation
Domestic Visitation
3,000,000 40,000
↑10.9 %
2,500,000
30,000
2,000,000
1,500,000 20,000
1,000,000
↑ 1.0 % 10,000
500,000
- -
2012 2013 2014 2015 2016
DOM O/N DOM DAY INT
Visitor Nights:
Visitors spent over 4.3 million nights in the region in 2016, growing by an average of 1%p.a since 2012. Of
the total overnight visitors to the region, domestic overnight (O/N) and international visitor (IVS) nights
account for 86% and 14% respectively. International visitors also tend to stay longer than domestic
overnight visitors, spending an average of 13 nights compared to domestic visitors’ 2.8 nights.
Furthermore, although international visitors comprise only 1% of the region’s visitor market, they
contributed to 14% of visitor nights in 2016.
Expenditure:
On average, domestic day visitors to the Central Coast spent $84 on their trip, while international visitors
spent $56 per night, and domestic overnight visitors spent $145 per night, contributing a total of over
$867 million in visitor expenditure to the region. Although domestic day visitors make up just over 72% of
all visitations to the Central Coast, they contribute around 34% of visitor expenditure. In comparison,
international visitors contributed 4% of expenditure, regardless of their low share in visitors market (1%
of all visitors). Domestic overnight visitors, however, contributed the largest proportion of overall visitor
expenditure, which was approximately 62%.
CENTRAL COAST DESTINATION MANAGEMENT PLAN 2017-2021| DRAFT 33Figure C: Visitor Expenditure, YE June 2016
$34,711,884
International
$293,290,043
Domestic O/N
Domestic Day
$539,249,967
Purpose of Visit:
The main purpose of visit to the Central Coast by domestic visitors in 2016 was for a holiday (44%),
closely followed by visiting friends and relatives (VFR) (42%). In comparison, VFR was the main purpose of
visit for international visitors (53%), followed by holidays (36%). Visitors travelling to the Central Coast
with the purpose of holiday and VFR have slightly declined since 2012; decreasing by 0.2% and 0.4% p.a.
respectively. Visitors travelling for business to the region have remained steady since 2012.
Figure D: Main Purpose of Visit to Central Coast by international and domestic visitors combined, YE
December 2016
9%
5%
Holiday
44%
VFR
Business
Other
42%
CENTRAL COAST DESTINATION MANAGEMENT PLAN 2017-2021| DRAFT 34Figure E: Main Purpose of Visit to Central Coast for domestic (left) and international visitors (right), YE
December 2016
3%
9% 8%
5%
36%
44%
42%
53%
Visitor Origins:
The majority of international visitors to the region were from the United Kingdom (UK) (19%) and New
Zealand (18%), followed by the United States of America (USA) (13%) and then Korea (4.9%) with France
following closely (4.7%). Whilst Korea and France are the 4th and 5th highest countries of origin, they both
have increased 54% and 67% respectively p.a. since 2012, whereas the UK who has the largest amount of
visitors to Central Coast from its country has only grown 6% p.a. since 2012.
International visitors from Europe comprise 37.2% of the total international visitors, remaining the
largest international visitor market (Figure F).
In 2016 the top five visitor origins by country were:
1. UK (19.1%)
2. New Zealand (17.8%)
3. USA (12.6%)
4. Korea (4.9%)
5. France (4.7%)
CENTRAL COAST DESTINATION MANAGEMENT PLAN 2017-2021| DRAFT 35Figure F: Central Coast International Visitor Origin, YE December 2016
9%
18%
Asia
18%
Europe
North America
New Zealand
18% Other
37%
Figure G: Central Coast International Visitor Origin growth, YE December 2010 – 2016
Other
New Zealand
North America
Europe
Asia
0.0% 5.0% 10.0% 15.0% 20.0% 25.0%
The majority of domestic visitors come from Sydney (66.2%), followed by visitors visiting from the Hunter
region, who make up 13.5% of the total domestic visitation.
Activities:
Eating out at a restaurant was the most popular activity amongst both international and domestic visitors
in the Central Coast. The number of domestic and international visitors participating in sightseeing and
going to the beach were also significant. Apart from these similarities, international visitors were far
more likely to participate in going shopping, whereas domestic visitors were more likely to participate in
visiting friends and relatives (Figure H).
CENTRAL COAST DESTINATION MANAGEMENT PLAN 2017-2021| DRAFT 36Figure H: Top 10 activities by participation rate by international visitors (left) and domestic visitors (right)
Visit wildlife parks / zoos Bushwalking / rainforest
/ aquariums walks
Bushwalking / rainforest
walks Go to markets
Visit botanical or other Visit national parks / state
public gardens parks
Go to markets Picnics or BBQs
Visit national parks /
state parks Pubs, clubs, discos etc
Pubs, clubs, discos etc Go shopping for pleasure
Sightseeing/looking
around Sightseeing/looking around
Go shopping for pleasure Go to the beach
Go to the beach Visit friends & relatives
Eat out / dine at a Eat out / dine at a
restaurant and/or cafe restaurant and/or cafe
0% 20% 40% 60% 80% 100% 0% 10% 20% 30% 40% 50% 60%
Age:
Visitors to Central Coast and NSW as a whole are fairly evenly spread across the age groups, with the
majority of travellers for Central Coast and NSW being between 65+ years (See Figure I).
Figure I: Age Profile of Central Coast and NSW Domestic Visitors, YE December 2016
30%
25%
20%
15% Central Coast
NSW
10%
5%
0%
15-24 25-34 45-54 55-64 65+
CENTRAL COAST DESTINATION MANAGEMENT PLAN 2017-2021| DRAFT 37Travel Party:
The recorded travel parties to the Central Coast were equally distributed amongst adult couples (31%),
unaccompanied traveller (26%), Family group (20%) and friends and/or relatives travelling together (21%)
in 2016. In comparison, business associates and tour groups accounted only for 1% each of the visitors in
2016. (Figure J).
Figure J: Travel Party Profile of Central Coast Visitors, YE December 2016
Business associates Tour group , 1%
, 1%
Friends and/ or
relatives travelling Unaccompanied
together, 21% traveller, 26%
Family group, 20%
Adult couple, 31%
Transport:
In 2016, the dominant mode of transport used to travel to and around the Central Coast was by self-drive
private vehicles at 92.2%. Although aircraft only accounted for 1.7%, it has grown by 16% p.a. since 2012.
Travel by rental car has dropped the most since 2012, decreasing by 16% p.a. on average.
Figure K: Transport Profile of Central Coast Visitors, YE December 2010-2016
1% 2%
4%
Aircraft
Private Vehicle
Charter or tour bus
Other
93%
CENTRAL COAST DESTINATION MANAGEMENT PLAN 2017-2021| DRAFT 38Accommodation:
While more than half (55%) of the visitors to the Central Coast stay on a friends or relatives property,
only 17% of the visitors stay in hotels, resorts and motels. Rented house/apartment/flat or unit and
commercial caravan or camping are also popular accommodation choices amongst the visitors,
accounting for 7% share each respectively.
Figure L: Accommodation Profile of Central Coast Visitors, YE December 2016
3% 2% Hotel/resort/motel or motor Inn
Guest house or Bed & Breakfast
17%
1% Rented house/apartment/flat or unit
Caravan park or commercial camping
7% ground
Own property
7%
55% Friends or relatives property
8% Caravan or camping - non commercial
Other Private Accommodation
CENTRAL COAST DESTINATION MANAGEMENT PLAN 2017-2021| DRAFT 39You can also read