Bay of connections growth strategy
←
→
Page content transcription
If your browser does not render page correctly, please read the page content below
Bay of connections
growth strategy
Bay of Plenty - a world class region
One Region. One Goal. One Future.

Bay of Connections Regional Economic Growth Strategy
A Strategy to generate and encourage growth and employment in sustainable
world class sectors in the Bay of Plenty.

A c ros s th e b ay of plent y o ur many rivers int erlink
a n d c onnec t, and th ey each share a co mmo n go al
– t o re ac h th e s ea.
Like o ur rivers, o ur peo ple
are also co nnect ed
t o wards a co mmo n go al
– gro wt h and develo pmen t
o f o ur regio n and
wellbeing o f o ur peo ple.

One region.
One Goal.
OnE future.
The Bay of Connections actions are high level
                                           and strategic.
       Ac t i o n
                                           The specific detail is applied to each sector strategy.
           plan                            Bay of Connections is about setting the direction
                                           and being a catalyst for local, central, industry, iwi,
                                           research and education partnerships.

  1                                                               2

Maintain Strong                                                Identify opportunities
Governance                                                     and support sector
                                                               strategies
The Bay of Connections Governance Group has been in            Since its launch in 2008, Bay of Connections has supported
place since late 2007. It has been instrumental in providing   a Food and Beverage report for the region, and a feasibility
credibility, industry input and relevance to the Regional      study for the Harbour Central Marine Precinct. Four sector
Strategy. The Bay of Connections Management Group ensures      strategies for the region have also been launched:
the strategies and action plans come alive. Both groups have
Bay of Plenty Regional Council membership, and are supported
by the Regional Council.

ACTION: ONGOING                                                ACTION: work with sectors AS OPPORTUNITIES AND
                                                                       NEEDS ARE IDENTIFIED

                                                                        Aquaculture                       Forestry and Wood
                                                                                                              Processing

                                                                      Freight Logistics                        Energy
During the life of this Strategy, the key actions important to
the success of Bay of Connections are:

   3                                                                4

Monitor and review                                                Communications and
strategy progress                                                 Leadership

Monitoring and evaluation is crucial. It allows us to see         Ongoing collaborative leadership and advocacy at governance
if progress is being achieved in line with expectations.          and operational level is essential for the relevance and
Evaluation is a comprehensive appraisal that looks at the         effectiveness of Bay of Connections.
long-term impacts of the strategy and exposes what worked,
what didn't, and what should be done differently in the future.

ACTION: ANNUAL REPORT TO MONITOR PROGRESS OF                      ACTION: Strong communications plan
        BAY OF CONNECTIONS, WHICH INCLUDES ALL                            - revised annually
        THE SECTOR STRATEGIES AND PROJECTS

                                                                  ACTION: COMMUNICATE STRATEGY DEVELOPMENT
ACTION: REVIEW AND REVISE SECTOR STRATEGIES                               AND REPORT ON PROGRESS AND
        - EVERY 2 YEARS                                                   RESULTS TO STAKEHOLDERS
                                                                          - ANNUALLY

ACTION: REVIEW THE OVERALL STRATEGY FRAMEWORK
        - 2015

“If you don’t care about how well you are doing or about what
impact you are having, why bother to do it at all? Monitoring
and evaluation enable you to assess the quality and impact of
your work, against your action plans and your strategic plan.”

Janet Shapiro
World Alliance for Citizen Participation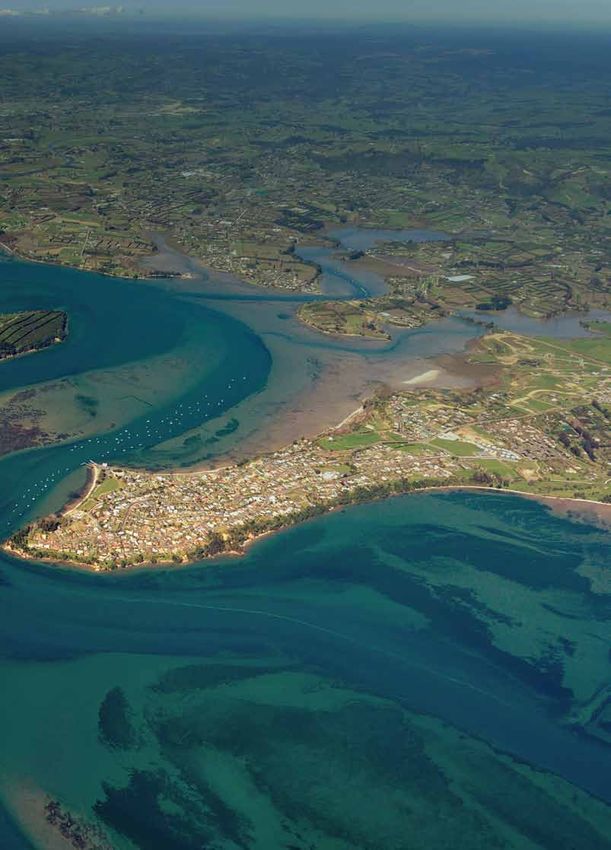
FUTU R E                       WHAT IS THE FUTURE OF BAY OF CONNECTIONS?

It is about constantly
improving.

It is about collaboration
and partnerships.

It is about connections…
Connecting our people to opportunities, connecting         Our world class strategies identify opportunities in
the region together, connecting our region with            our region to integrate technology, infrastructure and
other regions, building national connections, and          communications that will assist businesses in finding
connecting our export sectors offshore.                    collaborative solutions.

Collaboration and partnerships are an increasingly         The result will be a better ability to meet
important part of sustainable and resilient                environmental, growth, development, and
businesses and communities. Bay of Connections is          organisational challenges in our economy.
about creating the right environment for sustainable
development, building key relationships and                We strive to be first movers, identifying new
influencing positive outcomes.                             and exciting opportunities.

                                                       4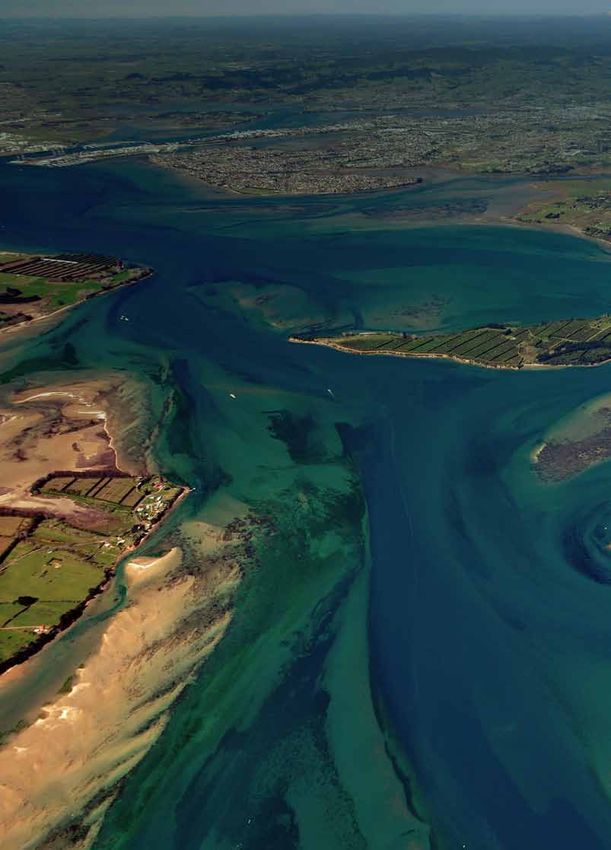
"We are not creatures of
circumstance; we are creators
of circumstance."
– Benjamin Disraeli

"Alone we can do so little;
together we can do so much."
– Helen Keller

                      5
K EY
                              Promoting a prosperous future for the Bay of Plenty
 FA C TS

The Bay of Connections area accounts               The Bay of Connections area
for just over 7 percent of                         generates 6.5 percent of all full-time
New Zealand’s population.                          equivalent jobs in New Zealand.

300,000                                           118,000
                                  people

                                                                                      FTEs

                                           6
co n· ne c·t ion           [ kuh-n ek -s huhn ]
n o un
1. the act or state of connecting.
2. the state of being connected: the connection between cause and effect.
3. anything that connects; connecting part; link; bond.
4. association; relationship
5. a circle of friends or associates or a member of such a circle.

         The Bay of Connections area                  The Bay of Connections area
         contributes just over 6 percent to           accounts for 7 percent of all
         New Zealand’s economy as                     businesses in New Zealand.
         measured by gross domestic product.

         $11.5                                        38,700                          BUSinesses
                              BILLION
                              GDP

                                                  7
Te Puia

Initially established to protect and perpetuate Māori arts and crafts, the New Zealand Māori
Arts and Crafts Institute (NZMACI) has two foci: Te Puia, New Zealand’s largest cultural tourism
                                                                                                         s u cc e s s
entity; and the self-titled New Zealand Māori Arts and Crafts Institute, an Institute responsible for
delivering on the fuller obligations of the New Zealand Māori Arts and Crafts Institute Act (1963).      story
As part of its responsibilities, NZMACI funds and operates the national wood carving, pounamu
carving and weaving schools from Rotorua and will be launching a new canoe building and non-
instrument navigation school in early 2012 in Doubtless Bay, Northland.
– Karl Johnstone, Director, NZMACI

                                                                 8
1. Our Purpose
Our
1.0 Purpose
Page 10
1.1 V ision, M is s io n a n d Valu e s
Page 11
1.2 H igh Lev e l O u tco m e s
91.1
VISION Bay of Plenty - A prosperous region supported by
sustainable sectors
To deliver sector based strategies and action plans
MISSION that generate and encourage additional sustainable
employment for the Bay of Plenty
We will collaborate in our community with integrity,
VALUES respect, and transparency, and in a friendly manner
101.2 High Level Outcomes
1. Our Purpose
The Bay of Connections is a regional economic development framework. it supports
sector strategies that encourage economic growth in the bay of plenty region.
The sectors of focus will: 1.1.2 Outputs
• be based on a regional capability or comparative advantage • Design, implementation and monitoring of
sector strategies
• be aligned with nationally competitive sectors
• Identification of sector/industry opportunities and issues
• have strong sector buy-in, and leadership capability
and commitment • Monitoring, measuring and reviewing of
strategy performance
• have potential for transformational growth and
employment opportunity. • Reporting and information on regional performance
The focus of the strategy framework is on clarity and • Active partnership with the variety of focus sectors –
simplicity, with clear outcomes and a primary measure of especially through the advisory groups
success, which is employment.
• Champion economic growth in the Bay of Plenty region.
1.1.1 Outcomes
1.1.3 Guiding Principles
• An increase in employment beyond a business as
• Commitment to a sustainable economic
usual scenario
development approach
• Growth in sustainable sectors where the Bay of Plenty has a
• Commitment to a collaborative and partnership approach
comparative advantage or regional capability
to strategy implementation
• A strong and vibrant community facilitating wellbeing and
• Recognition that successful economic development
encouraging innovation and leadership
outcomes require the support and contribution of a range
• Enhancement of the environment, underpinning the region of central and local government agencies, community
as the Green Window of New Zealand. organisations and the business sector
• Commitment to encourage innovative development
initiatives throughout the region
• Recognition that the attractive environment within the
region provides a strong foundation for the
Bay of Plenty brand.
employment
growth
Taking a business as usual scenario,
employment in the Bay of Connections
area is projected to grow at 1.5 percent FA C T
per annum, which is 1.5 times the
expected national rate of 0.97 percent
per annum. This level of employment
growth would mean an increase of
almost 2,000 FTEs annually, with the
Bay of Connections area having almost
150,000 FTEs by 2026.
11NEWNHAM PA R K
Newnham Park Horticulture Innovation Centre is a group of companies specialising in
horticulture and food processing. Established by a local group of entrepreneurs, Newnham
Park is a $100 million enterprise comprising synergistic, innovative and export-focused
horticulture and food processing businesses. The companies in the group are experiencing
strong growth:
• The Plus Group has wide interests in the kiwifruit industry through orchard management
(GroPlus), pollination (PollenPlus) and soil and plant testing (BioSoil & Crop). It also has
RoboticsPlus which is trialling a robotic kiwifruit picker in the orchards.
• Southern Produce markets kiwifruit, avocados and related products, and supplies them to s u cc e s s
Australia, Asia and the United States. Team Avocado is the cornerstone of the avocado business,
with a focus on retail supply partnerships throughout Australasia. Southern Produce sells kiwifruit story
on the east coast of the United States under a collaborative marketing arrangement.
• Kiwifruit Processing Company Ltd (Kiwifruitz) takes process grade kiwifruit and turns them into
tasty purees for fruit juices, salad dressings, ice cream, jams and yoghurt. Kiwifruitz has a
global supply focus to the food, beverage and pharmaceutical markets. The company is
both a Bay of Plenty Export and Westpac Business award winner. Subsidiary Kiwicoolz
provides cool storage for fruit and vegetables and dairy products at the
Newnham Rd site.
• Reunion Foods, which markets its products under Heilala Vanilla, exports to Australia,
Singapore, Malaysia and the United States and has won many awards and
accolades since establishment, including the overall runner up award at the Cuisine
2011 Artisan Awards.
- Steve Saunders, Director.
122. Our Region
OU R
2.0 R EGION
Page 14
2.1 Geogra p hy / clim ate
Page 15
2.2 Infrast ru ctu re
Page 16
2.3 E con omy - s iz e
Page 17
2.4 E con omy - p e rf o rm a n ce
Page 18
2.5 E con omy - s tre n g ths a n d o p p o rtu n itie s
132.1 G e o g r a p h y / c l i m at e
Th e Bay o f P le n ty R e gi o n co v e r s 3 4 , 000 square k il om et res of l and and sea, incl udi ng
18 i s la n d s , fr o m L o tti n P o i n t n e a r Ca p e Runaway in t h e east t o t h e sout h ern end of
Hom u n g a Bay n o rth o f Wa i h i B e a ch in t h e West.
Figure 2.1 Bay of Plenty Region
The Region has a land area of around 17,000 square kilometres. Around two thirds of the land is forested, with one fifth of all
There is a 688 kilometre coastal perimeter, 259 kilometres of land in production forest. A further 20 percent of the land is in
open coast and 369 kilometres of estuary, and Lake Taupō pasture. Soils are largely volcanic in origin. There are large areas
covers 616 square kilometres. capable of supporting crops with highly developed production
systems such as kiwifruit, citrus and avocados.
The Region has a climate with warm humid summers and
mild winters. Typical summer daytime temperatures range There are extensive geothermal resources, which provide a
from 22 to 26 degrees centigrade, while in the winter, daytime significant source of energy as well as a base for a cluster of
temperatures drop to between 9 and 16 degrees. The Region industries that re-use downstream geothermal heat.
has one of the sunniest climates in the country, averaging about
2,000 sunshine hours annually.
142.2 Infrastructure
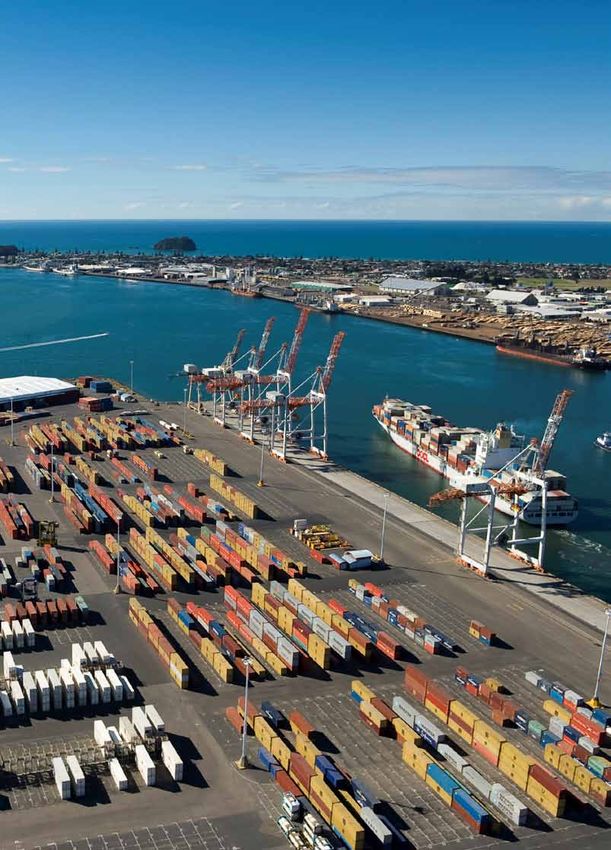
The Bay of Connections region has good infrastructure, 2.2.3 Broadband
with high levels of access by road and rail, a major port
Fewer than 70 percent of households in the Bay of Plenty had
and several airports (Rotorua has international capability).
internet access in 20092. The proportion of these households
Major improvements to the state highway network are either
with broadband access has doubled since 2006 to 54 percent.
underway or planned.
While this still sits below the national average of 63 percent of
There has been significant progress in upgrading the households with broadband access in 2009, both internet access
telecommunications network, particularly around cell-phone and access via broadband have risen faster in the Bay than the
coverage and ultra-fast broadband. national average between 2006 and 2009.
2. Our Region
Main centres in the Bay of Plenty are included in the Ultrafast
Broadband (UFB) initiative3, through either Ultrafast Fibre
2.2.1 Transport
Limited (Tauranga) or Chorus (Rotorua and Whakatāne).
The transport system is critical to enhancing the performance of
The rural areas of the Bay of Plenty are a part of the Rural
the regional (and national) economy as the Bay of Connections
Broadband Initiative (RBI). The Government has reached
region is both a producer of primary and value-added products
agreements with Telecom and Vodafone for a $285 million
and services, and a gateway for international exports and
infrastructure roll out expected to commence in late 2011, which
imports through the Port of Tauranga and Rotorua airport.
will bring increased and faster broadband to rural areas over the
The following are the key features of the Bay of Connections next six years.
transport system:
There are substantial benefits to be gained through further access
• Port of Tauranga to high speed broadband. Some organisations and residents
already have access to fast broadband. For example, GOnet
• State Highway and local road network providing inter and
provides wireless services in Whakatane and FXNetworks put
intra-regional connections and an off-highway network of
in fibre specifically for BOPLASS (Bay of Plenty Local Authority
forestry routes 1
Shared Services) to provide local government agencies with a
• Airports at Rotorua (international), Tauranga, Whakatane shared fast broadband platform.
and Taupō (domestic) The provision of appropriate levels of broadband access to allow
• East Coast Main Trunk rail line linking Auckland, business and community development in the main centres and
Hamilton and Tauranga, and east to forestry hubs in around the Bay of Plenty is a cornerstone to attracting leading
Kawerau and Murupara. businesses and people.
The strategic direction for the Bay of Plenty's land transport A recent study on the benefits of broadband, (BERL, 2011)
system for the next 30 years is set out in the Bay of Plenty identified substantial opportunities and demand for faster
Regional Land Transport Strategy 2011-2041. broadband to lift productivity in several key sectors in the
Bay of Plenty.
2.2.2 Telecommunications
Tauranga is ahead of the national averages for telephone, mobile 1
The Bay of Plenty region has 4,593 km of roads. Taupō has a further 763
km of roads. State Highways account for 747 km, with local roads making
phone, and fax machine access. Of note is the substantial up the remaining 3,846 km.
percentage of households still without any telecommunications
access in the Eastern sub-region, in particular the Ōpōtiki and Statistics New Zealand (2009). Household Use of ICT. Wellington.
2
Kawerau districts (9.5 and 7.1 percent respectively). 3
Crown Fibre Holdings was established to manage the Crown's investment
in ultra-fast broadband (UFB) infrastructure over a ten year period. The
Some parts of Whakatane and Ōpōtiki districts have limited government's objective for the UFB initiative is to accelerate the roll-out
mobile phone cover. of ultra-fast broadband. Fibre optic infrastructure will be deployed to 75
percent of New Zealanders by the end of 2019 across 33 urban centres
("Candidate Areas").
152.3 Ec o n o m y - s i z e
In 2 0 1 0 , t he Bay o f co n n e cti o n s R e g ion h ad an est im at ed p op ul at ion of 303,400,
w hi c h a c c o u n te d f o r 7 . 2 pe r ce n t o f New Zeal and’s p op ul at ion.
In 2010, the Bay of Connections region generated $11.5 billion The Bay of Connections region includes seven districts,
in GDP, or 6.1 percent of New Zealand’s total GDP. With grouped into three sub-regions. These groupings are of shown
118,000 FTEs, it accounts for 6.5 percent of New Zealand’s in Figure 2.1.
employment. There are around 38,700 businesses in the Bay
of Connections region, accounting for seven percent of all
businesses in New Zealand.
Figure 2.1 Regional Structure
Region Sub-Region District
Tauranga
Western
Western Bay of Plenty
Rotorua
Central
Bay of Connections Region Taupō
Whakatane
Eastern Kawerau
Ōpōtiki
While localised issues are relevant and considered within the population; 50 percent of GDP; and 51 percent of its
individual strategy actions, the Bay of Connection’s focus is employment. Central accounts for 33 percent of the Bay of
on the region. For the Bay of Connections region to compete Connection’s population; 35 percent of its GDP; and 34 percent
successfully and grow, it needs to draw on the collective of its employment. The Eastern sub-region accounts for 16
strengths of all the people and resources within the area. percent of the Bay of Connection’s population; 14 percent of its
Of the three sub-regions (see Figure 2.1), the Western sub- GDP; and 15 percent of its employment.
region accounts for 51 percent of the Bay of Connection’s
Figure 2.2 The Bay of Plenty Economy, 2010
POPUL AT ION FTEs
Central Central
99,401 (2%) 40,252(2%)
New Zealand New Zealand
4,204,945 (93%) 1,835,706(94%)
Eastern Eastern
BOC 303,412(7%) 48,755 (1%) BOC 118,015(6%) 17,129(1%)
Western Western
155,256(4%) 60,634(3%)
GDP ($ m) BU SINESSES
Central Central
$4,076(2%) 11,695(2%)
New Zealand New Zealand
$187,802(94%) 505,685(93%)
BOC $11,525(6%) Eastern BOC 38,6945(7%) Eastern
$1,658(1%) 5,354(1%)
Western Western
21,645(4%)
$5,792(3%)
Source: BERL Regional Database 2010
162.4 Ec o n o m y - PE R FO R MAN C E
In general GDP in the Bay of Connections area has performed slightly better than the
national average over the longer term (10 and 15 years). although, overall change has
been relatively consistent with the national outcomes in key economic indicators.
A key driver of growth has been population, which has grown While the region has performed at a rate above the national
at a rate slightly faster than the national average over the last 15 average in the past, this does not guarantee that it will
years. The performance in the Bay of Connections relative to continue to do so into the future. The Bay of Connections is an
2. Our Region
New Zealand in the areas of population, GDP, employment and aspirational growth strategy, where we are aiming to achieve
business growth between 1994 and 2010 is shown in Figure 2.3. growth beyond what would be expected.
Figure 2.3 Population, GDP, Employment and Businesses Growth, 1994 - 2010
P O P UL ATI O N GD P
Index 2000 = 1000 Index 2000 = 1000
1200 1400
Bay of Connections New Zealand 1300 Bay of Connections New Zealand
1100 1200
1100
1000 1000
900
900 800
700
800 600
1994
1995
1996
1997
1998
1999
2000
2001
2002
2003
2004
2005
2006
2007
2008
2009
2010
1994
1995
1996
1997
1998
1999
2000
2001
2002
2003
2004
2005
2006
2007
2008
2009
2010
F TE s BU SI NE SS U NI TS
Index 2000 = 1000 Index 2000 = 1000
1400 1400
1300 Bay of Connections New Zealand 1300 Bay of Connections New Zealand
1200 1200
1100 1100
1000 1000
900 900
800 800
700 700
600 600
1994
1995
1996
1997
1998
1999
2000
2001
2002
2003
2004
2005
2006
2007
2008
2009
2010
1994
1995
1996
1997
1998
1999
2000
2001
2002
2003
2004
2005
2006
2007
2008
2009
2010
Source: BERL Regional Database 2010
P o p u l at i o n
growth
Averaging 1.3 percent per annum growth
over the last 15 years, population in the
FA C T
Bay of Connections area has grown slightly
faster than nationally (1.26 percent per
annum). Most of this growth has occurred in
Tauranga and the Western Bay of Plenty.
172.5 Ec o n o m y - s t r e n g t h s a n d o p p o r t u n i t i e s
The Bay of Connections region is blessed with an attractive This wealth of opportunity within the Bay of Connections
location, diverse resources, and a natural and built region changes the focus from “what can we do?” to “what
environment that gives it a comparative advantage in a should we do?” The focus is on maximising the opportunities
number of sectors. The key strengths and opportunities for the for growth based on both the comparative strengths and the
region are shown in Figure 2.4. potential of the Region.
Figure 2.4 Bay of Plenty Strengths and Opportunities
Strengths Opportunities
•• Growing population •• Become the Green Window for New Zealand via economic growth
from renewable and sustainable resources
•• Proximity and accessibility to major domestic markets (Auckland,
•• Meet sector demand for skilled people through education, training
Waikato) and the Upper North Island
and internal migration
•• A major tourism area •• Aquaculture
•• Excellent infrastructure •• Geothermal development for primary energy and downstream users
•• Attracting foreign investment and manufacturing developments
•• Largest export port in New Zealand with direct rail links to
•• Growth in high-tech manufacturing exports
Auckland, and deep water to cater for new generation ships and
the cruise market •• Harnessing marine resources for future economic development
•• Location/distribution of population growth
•• Rich in natural resources
•• Develop tourism offering beyond main international attractions and
•• A strong base of innovative entrepreneurial action become a hub for inbound tourism
•• Implementation of a tertiary education partnership that includes
•• Major timber growing and processing area University of Waikato, Bay of Plenty Polytechnic and Te Whare
•• Strong brand and recognition in fruit growing especially Kiwifruit Wānanga o Awanuiārangi that provides seamless delivery
and research capability
•• Deep phase volcanic soil and high-tech infrastructure to •• Development opportunities around energy generation, particularly
support horticulture geothermal and clean energy
•• Further processing of primary production
•• Transport infrastructure improvements to assist
Upper North Island linkages
Kajavala Forestry Ltd – KFL
Established in 1972 KFL operates from a site in Kawerau. Since 1998 under Managing
Director Jacob Kajavala they have been specialists in the central processing of logs, optimal
log value recovery and log management including inventory management and coordination of log
s u cc e s s
movement. KFL provides integrated logistics services from computer based inventory tracking to the
best fit machinery to handle the job. These real time web based tracking systems mean information story
can be accessed by forest owners via a website.
As well as central processing yards, KFL service the logistic requirements of saw mills, pulp
mills, ports or any other large scale log management operation.
– Jacob Kajavala, Managing Director.
183. Economic Environment
Ec o n o m i c
3.0 Environment
Page 20
3.1 Int ernatio n a l E co n o m y
Page 20
3.2 Nat ion a l E co n o m y
Page 21
3.3 Upper No rth I s la n d
Page 21
3.4 Gl ob al M e g atre n d s
Page 23
3.5 Sect or P rio ritie s
19Sector strategies and interventions need to be considered in light of the local, regional,
national and international economic environment; and global megatrends that will affect
what is demanded and how it is produced in the future.
The New Zealand economy will continue to focus on export-based sectors, with primary
production being the mainstay, along with continued development of the successful value
added manufacturing sector. The international market will remain uncertain and volatile
over the next decade. In terms of global trends, people are ageing, becoming more
mobile (nationally and internationally) and demanding more in terms of the quality and
quantity of goods and services.
The environment and resources will matter more in terms of increasing demand, as well
as what is demanded. Sustainability is a key concept and it is within this context that the
strategy has been formulated.
3.1 I n t e r n at i o n a l Ec o n o m y
O ve r t he s hort a n d m e di u m te r m , th e int ernat ional env ironm ent wil l be v ol at il e and
c ha r a c t er i s e d b y u n ce rta i n ty a s th e financial sy st em s are re-inv ent ed and t h e h u ge
em e r g i n g g lo b a l m i d d l e - cl a s s e n te rs t h e int ernat ional m ark et.
While the Global Financial Crisis is no longer the main The latest GDP forecasts from the World Bank suggest
dictator of economic activity in developed countries there is global GDP growth will decline slightly over 2011 to 3.2
still on-going fallout. Key challenges are: dealing with high percent before rising again to 3.6 percent in 2012 and 2013.
unemployment and preventing it from becoming entrenched; Growth in developing countries, however, is expected
sustaining growth and avoiding stagnation; progressing fiscal to be around 6.3 percent to 2013. The OECD expects
GDP growth in the OECD area to be 2.3 percent in 2011,
consolidation; and managing global imbalances.
increasing to 2.8 percent in 2012.
More recently, issues around the United States economy and
This Bay of Connections strategy assumes that global GDP
European debt has seen global share market falls similar
growth will average 2.9 percent per annum to 2026. This is
to 2008. consistent with the above forecasts, but slightly down on the
The consensus for the future is for solid growth, which will world historical growth performance.
be led by developing countries – including China and India. The reason a conservative estimate of world growth has been
Downside risks are posed by high food prices, further oil-price applied is the above-mentioned downside risks of the fallout
spikes and lingering post-crisis difficulties in from the global financial crisis, possibility of further spikes in
developed economies. oil prices, and rapidly rising commodity and food prices.
3.2 n at i o n a l Ec o n o m y
Th e t w o key fa cto r s a f f e cti n g N e w Zeal and's g row t h op p ort unit ies are g l obal
g r o w t h a n d a cce s s to m a r k e ts - e s pecial ly because New Zeal and is p rim arily an
ex p o rt- fo c u s e d f o o d - pr o d u ci n g e conom y, rel iant on int ernat ional dem and and
m a r ket a c c e s s f o r gr o w th .
Strong demand for food and commodities is necessary for In terms of New Zealand's economy, the Strategy expects real
higher growth. Exchange rate volatility impacts on GDP growth to average 2.6 percent to 2026. This is slightly
New Zealand’s ability to compete, particularly in the lower than the average growth over the last 15 years of 2.75
price-driven commodity market. percent but is predicated on having to recover from the
recent recession.
Issues arise around sustainability and environmental issues,
with resources such as water, minerals, energy and resource
management being potential opportunities or threats to growth.
203.3 Upper North Island
The Upper North Island of New Zealand accounts for The continued improvement of effective inter-regional
approximately 53 percent of the nation’s population and 52 transport connections, the development of geothermal energy,
percent of New Zealand’s total GDP4. This area has been the establishment of downstream geothermal business clusters,
signalled as important by government and is the focus of a the re-vitalisation of the horticultural industry, and the
range of government policy initiatives that involve growing expansion of the vibrant added value manufacturing base will
the economy and improving, for example, the support regional development in the Bay of Plenty area.
transport infrastructure.
3.4 G l o b a l M e g at r e n d s
Th er e a r e a nu m b e r o f tr e n d s th at are occurring g l obal ly t h at w il l im pact on h ow
3. Economic Environment
thi n g s a r e c u r r e n tly do n e a n d w h at w il l be dem anded by PEOPLE in t h e fut ure. In
se ve r a l c a s e s th e s e tr e n ds s u ppo rt key sect ors in t h e Bay of CONNECTIONS REGION
s u c h a s a q u a cu ltu r e , e n e r gy, a n d F orest ry.
More importantly, these megatrends provide focus for sector There is a continuing trend towards Mega Cities, Regions,
strategies. In particular, the impact of an ageing population, and Corridors; with accelerating technological change and
demand for skilled people, a desire by people to live in areas E-Mobility. With all these changes in technology and the more
of high amenity and have access to the latest technology sophisticated, mobile worker/consumer there is a need for cities
are all matters that require consideration within the Bay of to be smart and connected globally.
Connections strategy. Global megatrends can be summarised
into two areas: The environment matters more
1. People – are ageing, on the move, and demanding more. There are increasingly severe consequences of climate
change and (arguably) an increasing number (or impact
2. Environment – it matters more. due to increasing built environment) of natural disasters
– earthquakes, tsunamis, flooding, volcanic eruptions, etc.
People are ageing, on the move, and There is also an increasing environmental pollution load
demanding more because of increased population, consumption and waste.
The world’s population is getting older, increasing its demand This can create opportunities for the smart use of sustainable
for food and consumables, and becoming more mobile. resources and building materials (such as wood products).
Populations of OECD countries are ageing and experiencing
Globally, natural resources are being used unsustainably, led
lifestyle and diet related health challenges. At the same time
by increasing demand through rapid economic and population
there are high fertility rates and inadequate food supplies for
growth. The coming decades will see an increasing focus on
millions in the developing countries.
efficient resource use. This creates demand for green energy
These factors create issues around how we support an ageing (such as geothermal) and more efficient and innovative food
population, but also provide opportunities in terms of how production such as farmed seafood and traceability.
we interact and benefit from an older population, which
Water is becoming increasingly scarce and will continue
can continue to operate effectively and contribute to a
to be an important commodity. Sustainable water use,
knowledge-based economy.
storage, allocation and application will be important issues
The workforce is becoming increasingly mobile. People are for New Zealand.
changing jobs and careers more often, moving house more
often, commuting further to work and travelling the world
more often5.
Within this is a desire to live in high amenity value
communities where people can enjoy experiences. This is
driven by people becoming increasingly resource rich but time
poor, and where the type of jobs and technologies are enabling
work and life to overlap. Consumers are also becoming more
sophisticated, demanding more personalised products and
services. Growth of the services sector of western economies The upper North Island includes the regions of Northland, Auckland,
4
is being followed by a second wave of innovation aimed at Waikato, the Bay of Plenty and Gisborne. BERL Regional Database 2010
tailoring and targeting services. Commonwealth Scientific and Industrial Research Organisation (CSIRO)
5
2122
od
er fo Emergi
Oth IO N A N D n
AT TECHNO g
LT I V LOG
IE
CU ro c essing
P S
KI W
ism IF
R
ur
UI
T
To
DAI
sp
ICT
Tran ort
RY
structu
fra re
In
ions
nd
tion
Tertiary
icat
MEAT
un
an
S p o rt a
Recrea
m
d
m sk
co ills
Aq
e
ua
rin
cu
Ma
ltu
re
ics
ist Fo
Log ight est r
Fre ry
Energy3.5 S e c t o r Pr i o r i t i e s
A r e vi e w o f s e cto r s a cr o s s th e k e y success crit eria h el p s us t o p riorit ise sect or
s t r at eg i e s . A s s e s s i n g th e s e cto r s a gainst t h e crit eria, wh ere 1 is l ow and 3 is h igh,
pr o vi d es t he f o l l o w i n g r e s u lts :
CURRENT
freight Sport & Tertiary
Aquaculture Forestry Energy Marine ICT TOURISM
Logistics Recreation Education
Building on existing
and collective
regional capability 3 3 3 2 3 2 2 1 2
and or comparative
3. Economic Environment
advantage
Aligned with national
sectors that are 3 3 3 3 3 3 3 2 2
globally competitive
Strong sector buy-in
and leadership 3 3 3 3 2 3 3 3 2
Strategy interventions/
actions can support 3 2 2 2 3 2 3 3 2
transformative growth
Sub-total 12 11 11 10 11 10 11 9 8
Other considerations
Enabling (supports
growth in Y Y Y Y Y
other sectors)
Dependencies (reliant
on minimal external
factors e.g, legislation, Y Y Y Y Y Y Y Y
central government
funding)
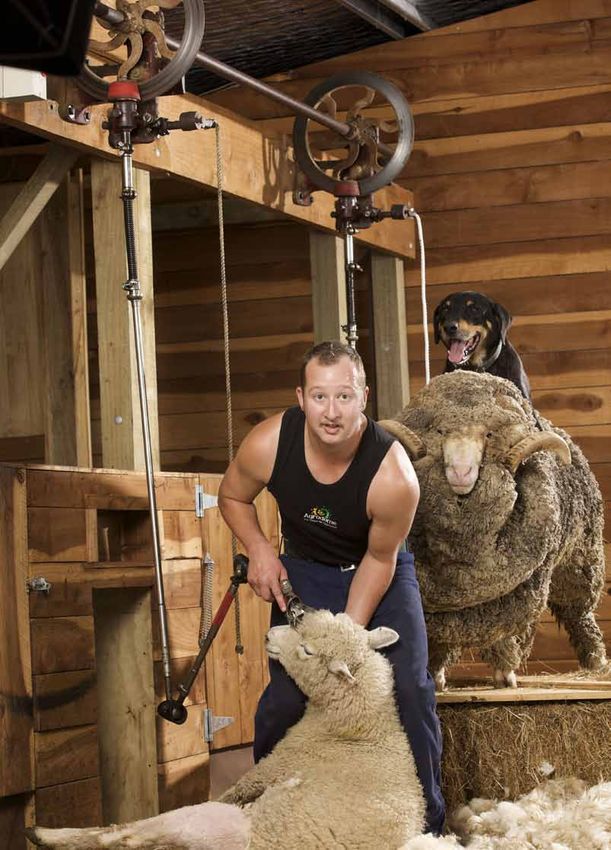
the forestry
sector
Forestry is a key sector in the
Bay of Connections area. If you met
someone who worked in the Bay of
FA C T
Connections area they are three times more
likely to work in the forestry sector than a
worker nationally. If you met someone who
worked in Kawerau District, they are 23
times more likely to work in the Forestry
sector than a worker nationally.
23Agrodome
After forty years and millions of visitors through the farm gate to experience the World Famous
Sheep Show and Organic Farm Tour, you would think the Agrodome has done it all. But we are
just warming up, and although the iconic product will not be tampered with too much, we are now
developing new products that are constantly improving our current offering.
s u cc e s s
The Agrodome’s organic orchard is investigating joint venture export opportunities for organic
Kiwifruit as well as adding complementary off-season produce to showcase. The future will include story
onsite premium food and beverage production and manufacturing for export, primarily to Asia.
There will also be a food and beverage showcase and educational group tour offering.
We are serious about sustainable growth in the Bay of Plenty and look forward to contributing on a
number of fronts that complement the Bay of Connections Strategy.
Grant Kilby, General Manager
244. Bay of Connections Strategy
A B IT OF
4.0 B A C K G R OUND
Page 26
4.1 Backgro u n d
Page 26
4.2 O rgan is atio n a l S tru ctu re
Page 26
4.3 Māori Eco n o m ic D e ve lo p m e n t
Page 27
4.4 F un ding
Page 27
4.5 Alignm e n t a cro s s the re g io n
25The Bay of Connections Strategy is driven by the Bay of Connections Governance Group
in partnership with the Bay of Plenty Regional Council, New Zealand Trade & Enterprise,
and the region's economic development agencies.
4.1 B a ck g r o u n d
A la r g e a m o u n t o f co n s i de r ati o n and consultat ion w ent int o t h e dev el op m ent of
th e i n i t i a l 2 0 08 S tr ate gy.
The Strategy had a clear purpose – a vision, mission, and It was always planned to have the Strategy updated after
values to guide activity. It identified six high level outcomes, three years. Following a review of the existing Strategy
ten economic opportunities, and nine guiding principles in early 2011, BERL was commissioned to update the
for strategy implementation. It revolved around four Bay of Connections.
themes based on globally competitive firms, world class
This new version incorporates the learning and progress over
infrastructure and skills, environmental sustainability and
the last three years, existing and new sector strategies, input
innovation and productivity.
from a regional forum held in Tauranga in September 2011, and
verbal and written feedback received in October 2011.
4.2 Or g a n i s at i o n a l ranga
Roto
Businerua
Tau siness
Structure Bu ss
Eassiness
Bu
DA
tern
Th e Bay o f C o n n e cti o n s G o v e r n a n c e
Toi-E
Gr o u p c o n s i s ts o f n i n e r e pr e s e n tati v es: BAY OF
th r ee r eg i o n a l b u s i n e s s r e pr e s e n tati v es; CONNECTIONS
o n e r e p r es entati v e f r o m e a ch o f th e
Priority 1
Business
GOVERNANCE
Maori
th r ee ec o n o m i c d e v e l o pm e n t a ge n c ies; GROUP
a lo c a l g o ve r n m e n t r e pr e s e n tati v e ; and
two Māo r i b u s i n e s s r e pr e s e n tati v e s .
i ent
m
a c
Bu
p
elo m M sines
DevEconotoru ao s
The Bay of Connections Management Group consists of Ro ri
Government
representatives from the Bay of Plenty Regional Council, Local
New Zealand Trade & Enterprise, and the economic
development agencies. This team implements the decisions
and actions resolved by the Governance Group as well as
providing advice to the Governance Group. The Bay of Plenty Bay of Plenty
Regional
Regional Council facilitates and supports the Governance and Council
Management Groups. po
Ne Tradterprise
au
wZ e&
eT
En
eala
Lak
nd
Great
BAY OF
4.3 M āo r i Ec o n o m i c CONNECTIONS
Development MANAGEMENT
GROUP
1
Toi-E
rity
Prio
DA
Māo r i A r e m ajo r s ta k e h o l d e r s a n d
c o n t r i b u t o r s to e co n o m i c gr o w th in Development
th e Bay o f c o n n e cti o n s r e gi o n . Economic
Rotorua
The value and potential contributions of Māori have been
identified in a number of studies but also in engagement with
the Bay of Connections Strategy to date.
The contribution and role for Māori is across all sectors and
areas of engagement. Ongoing engagement will be assisted by
two new positions - Māori Business Representatives - on the
Governance Group. This will ensure involvement in all aspects
of the Strategy.
264.4 FUNDING
Th e fu n d i n g o f th e a cti o n s i n th i s St rat eg y w il l be crit ical . Funding needs t o come
fr o m a va r i et y o f pu b l i c a n d pr i vate sources.
The region has experience in attracting investors, working with As we progress and work on a variety of sectors, funding
industry clusters and assisting relevant parties to obtain funding sources will differ. The Bay of Plenty Regional Council
form government programmes. To successfully attract funding is committed to continuing its role in regional economic
we will need to demonstrate the need, value and capability. development, and working alongside the economic
development agencies, local and central government, iwi and
Up to this point, funding for Bay of Connections’ work has
industry to ensure Bay of Connections success.
come from New Zealand Trade & Enterprise, Energy Efficiency
and Conservation Authority, and from within the region.
4.5 A l i g n m e n t a cr o s s t h e r e g i o n
Th er e a r e a nu m b e r o f s tr ate gi e s a nd ag encies encourag ing econom ic dev el op m e nt
in t he Bay o f co n n e cti o n s R e gi o n .
4. Bay of Connections Strategy
There are five economic development agencies covering the Toi-EDA
seven districts. Priority One in Tauranga/Western Bay of Plenty, Toi-EDA is the Eastern Bay of Plenty Economic Development
Rotorua Economic Development, Toi EDA in Whakatane, Agency set up by the three territorial authorities (Kawerau,
Kawerau and Ōpōtiki, KEA in Kawerau, and Enterprise Great Ōpōtiki and Whakatane) and the Bay of Plenty Regional
Lake Taupō in Taupō. Council, working together with local iwi.
The Rotorua District and Tauranga / Western Bay of Plenty Toi-EDA has a strong focus on enhancing the Eastern Bay
SmartGrowth economic growth strategies are also currently of Plenty’s economic growth and wealth for its people.
operating within the Bay of Plenty Region. These are focused Toi-EDA plays an important role in the Bay of Plenty
at the district or sub-regional level. The Bay of Connections regional partnership representing the Eastern Bay of
strategy is aligned and consistent with these other strategies. Plenty. The focus is on projects relating to energy, forestry,
Care has been taken in this update to ensure that the Bay of aquaculture, transport and logistics, and marine industry.
Connections strategy does not undermine or replicate what is
already being done but rather supports and complements these KEA
other strategies. There are both governance and management KEA is the Kawerau Enterprise Agency. It has a focus on
arrangements in place to assist with this. enhancing the Kawerau community’s wealth through:
maximising the use of resources; growing existing, and attracting
new businesses; youth development; governance; and viability.
4.5.1 Economic Development Agencies
Destination Rotorua
Priority One Rotorua Economic Development is a Council business unit
Priority One is the Western Bay of Plenty’s economic that works to encourage and stimulate economic growth in the
development organisation. It was established in 2001 by the Rotorua district:
Tauranga and Western Bay of Plenty business community in
• providing relevant economic and business information
partnership with the sub-region's local authorities. Priority One
is unique because it was initiated by the business community • facilitating interaction between businesses and Government
and run along business principles of action and results. • marketing the benefits of living, working, investing and
Priority One’s job is to grow the economy of the Western doing business in Rotorua
Bay of Plenty. It works with local authorities to ensure local • managing strategic level economic development projects.
government and business needs and aspirations are aligned. It
actively encourages Bay of Plenty businesses to grow through Enterprise Great Lake Taupō
removing roadblocks, ensuring the skills and experience
Enterprise Great Lake Taupō is the economic development
required by industry are available locally, and actively targeting
agency for the Taupō district. Its role is to develop new
offshore businesses into the Western Bay of Plenty market.
businesses and support existing businesses to provide
Priority One has built up strong networks and valuable employment and opportunities for its district’s people.
experience dealing with business migration and investment.
274.5.2 Sub-Regional Growth Strategies Great Lake Taupō
There are three sub-regional growth strategies and a fourth Taupō District has an economic development strategy that
regional strategy being developed. aims to grow the economy and create more employment.
The key sectors are energy, forestry, tourism, agriculture and
people - and the intersections between these. Great Lake Taupō
SmartEconomy
is focused on building strong partnerships with the private
SmartEconomy is the Western Bay of Plenty sub-region’s and public sector through collaborating with international,
economic development strategy. The sub-region includes national, regional and local interests. Taupō District has close
Tauranga City and Western Bay of Plenty District. working relationships with the Bay of Plenty Region and shares
The Strategy aims to make the sub-region the business location economic resources.
of choice, resulting in a highly productive, competitive and
export-based economy. It recognises the growing importance of Toi-EDA Economic Development Strategy
work/life balance and an evolving business environment which The Toi-EDA area of Whakatane, Ōpōtiki and Kawerau has
respects the natural values of its location. an economic development strategy that is currently being
reviewed. The reviewed strategy will be aligned to the Bay of
Rotorua Sustainable Economic Growth Strategy Connections Strategy.
Rotorua has recently refreshed its economic growth strategy
and approach to regional development. The Strategy aims to
lift the economic performance of the Rotorua District through
a range of principles, drivers and focus areas. These are
compatible with those applied and identified through the Bay of
Connections Strategy.
The Strategy is underpinned by a focus on the four main drivers
of the Rotorua economy – forest and wood processing, tourism,
geothermal, and agriculture.
Figure 4.1 EDAs and Bay of Plenty Regional Council in the Bay of Connections Region
28S t r at e g y
5.0 Fr a m e w o rk
5. Strategy Framework
Page 30
5.1 I den t ify, I m p le m e n t a n d S u p p o rt s e cto r s trategi e s
Page 31
5.2 Set Aspir atio n a l Targ e ts
Page 32
5.3 Mon it or a n d R e vie w P ro g re s s o f S trate g ie s
29The Bay of Connections Strategy provides a framework that is simple, aspirational and
measurable strategy framework.
Simple
The Strategy framework is simple in that it has a sector focus and employment is the
primary measure of success.
Aspirational
The Strategy framework is aspirational in that it sets a stretch target for economic growth
in the region.
Measurable
The Strategy is measurable in that it identifies a benchmark and sets targets based on
employment that can be collated and measured annually.
5.1 I d e n t i f y, I m p l e m e n t a n d S u p p o r t
s e c t o r s t r at e g i e s
Th e Bay o f C o n n e cti o n s f r a m e w o r k Why Employment as the measure?
id en t i fi e s a n d s u ppo rts r e gi o n a l
s e c t o r s t r at e gi e s . Employment is the most relevant measure of economic
progress at a regional level.
Strategies that have already been launched include Aquaculture, For a region to grow and prosper it needs to provide
Forestry and Wood Processing, Energy, Freight Logistics, a employment to attract and retain residents.
feasibility study for the Harbour Central Marine Precinct, and a
As a measure, it allows for consistent comparison and
Food and Beverage report.
aggregation across sectors and across regions and can
Other sectors, including Tertiary Education, the Māori Asset also be converted to incomes and GDP if necessary.
Base in the Waiariki region, Sport and Recreation, and ICT, are
Employment is a publicly collected measure. This ensures
in various stages of development. They will be developed and
that quality data will always be available in a timely
assessed based on the success criteria, and the ability of Bay of
fashion and to a high level of accuracy.
Connections to support them.
EM p l o y m e n t
growth
'Business as usual' employment in the
Bay of Connections key sectors is FA C T
forecast to grow by 1.8% per annum
to 2026. This is 1.4 times faster than
forecast employment growth in the
non-key sectors. GDP growth in the key
sectors is forecast to grow 1.8 times
faster than the other sectors.
305.2 S e t A s p i r at i o n a l Ta r g e t s
A b u s i n es s a s u s u a l pr o j e cti o n o f e mp l oy m ent g rowt h is set for each of t h e sector
s t r at eg i e s i n th e Bay o f C o n n e cti o ns reg ion.
A projection of national employment growth by sector to 2026 Based on the actions and the vision of sector strategies, an
has been calculated with long term growth assumptions based aspirational target in terms of employment is agreed. For
on the earlier environmental analysis. The Strategy then uses example, if the aquaculture strategy met its goal, it would
industry employment growth in the region's districts relative account for a quarter of all aquaculture exports and employ
to New Zealand over the last 15 years to project employment 2000 people by 2025.
growth to 2026 in the Bay of Connections sectors.
Employment likely to be generated by each action and
Thus the business as usual (BAU) estimate of projected approximate timeframes can also be estimated. This is
employment growth by sector in the Bay of Connections region represented in Figure 5.2 below.
assumes that the relative growth in the past will be consistent
into the future. This is shown in Figure 5.1 below. Figure 5.2 Aquaculture Strategy Employment Target
and Projections
Figure 5.1 Business as Usual Sector
Employment Projections Employment (FTEs)
2500
% PA Increase Vision Target
8% 2000 Strategy Target
Emerging Technologies BAU
7% 1500
6% 1000
5% 500
Aquaculture
4% 0
1994
1996
1998
2000
2002
2004
2006
2008
2010
2012
2014
2016
2018
2020
2022
2024
2026
& Logistics
Other Food Cultivation
Transport
3%
Marine & Processing
Kiwifruit
2%
Average growth rate of non-key industries 1.34% Dairy
The stretch target is the expected employment if the vision were
1% Energy
Sports & Recreation to be achieved. The 'business as usual' target is the expected
Meat Forestry
Tourism
Tertiary Education employment in the absence of the Strategy. The Strategy target
0% ICT
is the expected employment based on the Strategy actions.
0
500
1000
1500
2000
2500
5. Strategy Framework
% Additional FTEs to 2026
Source: BERL CGE Forecast to 2026
The goal of the Strategy is to grow employment at a faster
rate than what would be achieved without a strategy. This
aspirational rate is determined by the vision and actions linked
to the Strategy, and is set in consultation with the sector
and stakeholders.
Each sector strategy has a set of actions aimed at achieving
the vision for that sector. For example, the vision for the
Bay of Plenty Aquaculture Strategy is to contribute a
quarter of New Zealand’s aquaculture exports by 2025. This
is achieved through eight specific sets of actions delivered
over a defined time frame.
• Action1 Implementation
• Action2 Partnerships and Integration
• Action3 Research and Development
• Action4 Education and Training
• Action5 Infrastructure
• Action6 Regulatory Regime
• Action7 Market Development
• Action8 Māori Development
315.3 Monitor and Review Progress of Strategies
Th e Bay o f C o n n e cti o n s s tr ate gy w i l l m onit or and rev iew t h e p rog ress of sect or
s t r at eg i e s o n th e i r d e l i v e ry o f a cti ons and t h e m easurem ent of em p l oy m ent g rowth
in t hat s ec t or .
Individual sector strategies are aggregated to identify the net Figure 5.3 Projected Business as Usual and Strategy
contribution of the Bay of Connections Strategy to employment Employment Growth in Key Sectors
growth in the Bay of Plenty region. Actual growth will be
collected and measured against both the BAU estimate and Employment (FTEs) Thousands
70
strategy targets to determine the success of the Strategy.
60 Strategy Target
Individual sector strategies will be reviewed one to two yearly 50
BAU
against their actions to identify their deliverables and relate 40
this to actual employment growth in the sector. Actions and 30
expected growth targets can be revised accordingly. 20
As employment does not differentiate between the type or 10
quality of jobs created, the Bay of Connections Strategy will 0
1994
1996
1998
2000
2002
2004
2006
2008
2010
2012
2014
2016
2018
2020
2022
2024
2026
also monitor a range of other key performance indicators
including GDP (value added) and GDP per FTE (a measure of FTEs
labour productivity). These indicators can identify the value of
the employment as well as productivity improvements. Where
possible, these will be collected at the key sector level.
A l l i e d I n d u s t r i a l E n g i n e e r i n g Lt d
Allied Industrial Engineering Ltd is a privately owned company offering a complete range of
engineering services both nationally and internationally for various heavy industries.
We specialise in heavy machining, manufacturing, repair and refurbishment for many industries. s u cc e s s
Our services include: machining, balancing, fabrication, fitting, design, project management, and
maintenance work.
story
Our world class workshops are equipped with modern machinery and innovative technology.
Our Quality Management System meets the requirements of ISO 9001:2008 and we place a
high emphasis on documented systems and procedures. This means we are able to guarantee
high quality products and services at all times.
Stephen Hayes, General Manager
32Sector
6.0 S t r at e g i e s
Page 34
6.1 Sect or S e le ctio n C rite ria
6. Sector Strategies
Page 34
6.2 P riorit y S e cto rs
33Based on the Bay of Connections vision, functions, resources, and sphere of influence, the
sector level is where the Strategy can have the greatest impact on economic growth.
6.1 Sector Selection Criteria
The Bay of Connections Strategy applies a sector-based To ensure that engagement results in economic growth, sectors
approach. There are four criteria required for a successful engaged by the Strategy are assessed in relation to
regional sector strategy. These criteria are shown in Figure 6.1. these criteria.
Figure 6.1 Sector Selection Criteria
2. Alig
/or ned
ty and e are with
bili tag glo na
pa dvan ba t
ll
a
ion ompe
par ca
yc
e
al s titive
com ional
ativ
ecto
g
1. Re
rs tha
SUCCESSFUL
t
REGIONAL SECTOR
STRATEGY
tions th
can
row
tion ative g
3. S
c
and ng se
s/a
e rm
tro
lea
fo
ns de
n
r t tra terv cto rship
o rb
supp gy in uy-i
ate n
4. Str
6.2 Pr i o r i t y S e c t o r s
T h i r t e e n s e c t o r s h av e b e e n i d e n t i f i e d t h at m e e t t h e s u c c e s s c r i t e r i a .
It is across these sectors that the Bay of Connections will focus Similarly, the order of sectors is not a clockwise progression of
its efforts. As resourcing allows, the Strategy will explore these the thirteen sectors. It will be driven by need, the availability of
sectors to determine the appropriate approach to maximising resources and an understanding of what is achievable.
employment opportunities and growth potential to the Bay of
The process is that, as the Bay of Connections Strategy
Connections region.
progresses, additional sector strategies will be developed and
The Strategy now has an inner wheel for enabling areas – these existing strategies will be reviewed.
are areas that cut across all or most of the 13 key sectors.
As each sector strategy has its own set of outcomes and
The defining of priority sectors does not suggest that sectors action plans, the role of Bay of Connections in that strategy
outside the thirteen will not be considered as the Strategy will change, with sector strategy outcomes and actions being
progresses. If other sectors meet the criteria, have issues that redefined, or sectors graduated out of the process when support
can be addressed within the Bay of Connections framework, from the Bay of Connections is no longer required.
and can realise significant growth outcomes, then they could
also be explored. The Bay of Connections Management Team
will recommend appropriate actions to the Governance Group
should the need arise.
3435
od
6. Sector Strategies
er fo Emergi
Oth IO N A N D n
AT TECHNO g
LT I V LOG
IE
CU ro c essing
P S
KI W
ism IF
R
ur
UI
T
To
DAI
sp
ICT
Tran ort
RY
structu
fra re
In
ions
nd
tion
Tertiary
icat
MEAT
un
an
S p o rt a
Recrea
m
d
m sk
co ills
Aq
e
ua
rin
cu
Ma
ltu
re
ics
ist Fo
Log ight est r
Fre ry
EnergyP o r t o f Ta u r a n g a
Port of Tauranga is the natural gateway to and from international markets for many of
New Zealand's businesses.
The Port's location is central to key export commodity sources. We have direct and dedicated
access to New Zealand's largest import market, the capacity to expand our infrastructure, and
unrivalled sea, road
and rail connections.
s u cc e s s
The Port of Tauranga is no longer striving simply to be New Zealand's preferred cargo gateway.
We aim to be recognised as New Zealand's port for the future by offering a range of services and story
shipping solutions that include and transcend the boundaries of our historic base in the Bay of Plenty.
The Port's key strength lies in its ability to grow to meet customer requirements and market demands.
We have the land holdings to expand, and the integrity, innovation and commitment to meet our
customers' future needs.
The key to this success is a focus on maintaining our core business at Tauranga, while
also expanding into new ventures that are reshaping the traditions of service delivery in
New Zealand's port sector.
Graeme Marshall, Commercial Manager
36C u rr e n t
7.0 sector
s t r at e g i e s
Page 38
7.1 Aquacultu re
Page 39
7.2 F orest ry a n d W o o d P ro ce s s in g
Page 40
7.3 E n ergy
7. Current Sector Strategies
Page 41
7.4 m arine
Page 42
7.5 F reight L o g is tics
37The five current sector strategies are – Aquaculture, Forestry and Wood Processing,
Energy, Harbour Central Marine Precinct, and Freight Logistics. As the Bay of Connections
economic strategy progresses, additional sector strategies will be developed, and existing
sector strategies will be reviewed.
This section provides an overview of five sector strategies supported by the Bay of
Connections. Detailed strategy documents have been developed for each of these sectors and
are available at www.bayofconnections.com
NZ Exports (Dec 2010) Aquaculture - $274.6m; green lipped
mussels - $171.4m; Oysters - $17.5m;
Salmon - $85.7m
Employment (2010) BOP/NZ 228/3,214
7.1 Employment Location Quotient (2010) 1.8
GDP (2010) BOP/NZ $27m/354m
Aq u a c u lt u r e GDP Location Quotient 1.2
Number of businesses (2010) 23
Growth 2000 - 2010 (FTEs) BOP/NZ 4.1%/-0.8% (average annual)
Growth 2000 - 2010 (GDP) BOP/NZ 4.2%/-1.4% (average annual)
th e b ay o f p le n ty i s po i s e d to b e a m ajor 4,009 hectare farm located in Otamarakau is also in the process
pl ay er i n t he a q u a cu ltu r e i n du s try in of being approved. When fully operational, these two farms
n e w ze a la n d . would represent around a third of total aquaculture space in
New Zealand.
Growth in aquaculture will be driven by world population
In November 2009, Bay of Connections released the Bay of
increases and a growing preference for seafood as a protein
Plenty Aquaculture Strategy where the mission is:
source. The aquaculture share of the seafood market is likely
to increase given that there is already considerable pressure on
wild fisheries and so the global market will be dependent on
To grow an integrated and sustainable aquaculture industry in
aquaculture to supply greater amounts of seafood.
the Bay of Plenty with export sales of $250 million by 2025.
Research has found that the Bay of Plenty’s water are among
the best in New Zealand for aquaculture purposes. Given low
competition for water space in the eastern Bay of Plenty, the This is influenced by the New Zealand Aquaculture Strategy,
region is in a prime position to take advantage of its which has a goal of $1 billion exports by 2025. So, the Bay of
natural resources. Plenty is aiming to be responsible for around a quarter of the
aquaculture industry’s sales by 2025.
Aquaculture export species are currently greenshell mussels,
salmon and oysters. In the year to December 2010, the
aquaculture industry brought in $275 million in export
earnings. Of this, mussels accounted for 64 percent; salmon
accounted for 31 percent, and oysters five percent (Ministry of
Fisheries, 2011).
The industry in the Bay of Plenty Region currently revolves
around North Island Mussel Processors Limited, which boasts
the world’s largest capacity for half-shell production.
The largest aquaculture water space in New Zealand has
recently been approved in the Bay of Plenty Region. Eastern
Seafarms Limited, a joint venture between Te Whakatōhea
Māori Trust Board, Sealord and New Zealand Seafarms
Limited, holds resource consent to farm greenshell mussels over
3,900 hectares of water space, off the Ōpōtiki coast. A second,
38You can also read