Atmospheric corrosivity of the Bay of Plenty region - BRANZ
←
→
Page content transcription
If your browser does not render page correctly, please read the page content below
Study Report   SR458 [2021]

               Atmospheric corrosivity of
               the Bay of Plenty region
               Zhengwei Li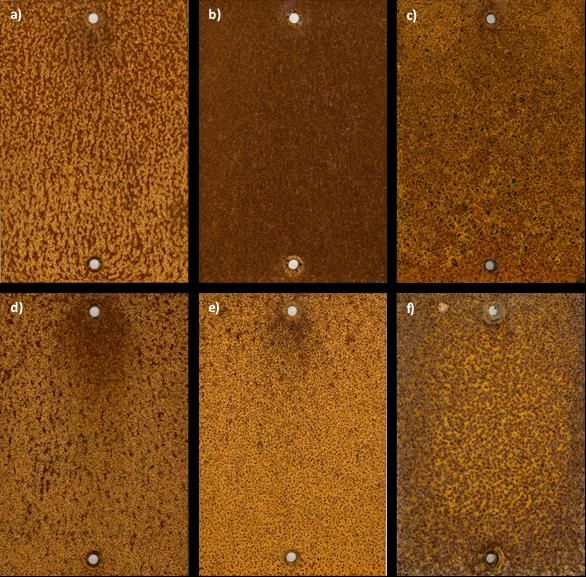
1222 Moonshine Rd, RD1, Porirua 5381    © BRANZ 2021
Private Bag 50 908, Porirua 5240       ISSN: 1179-6197
New Zealand
branz.nz
Study Report SR458 Atmospheric corrosivity of the Bay of Plenty region

Preface
This is the first of a series of reports prepared during a research into the airborne
contaminants in the Bay of Plenty region and their influences on the atmospheric
corrosivity and degradation and performance of typical building materials.

Acknowledgements
We would like to thank the Building Research Levy for financial support.

We would like to thank the following for allowing the installation of monitoring
equipment and exposure racks on their premises:

•   Ballance Agri-Nutrients Ltd
•   Bay of Plenty Regional Council
•   Galatea School
•   Kawarau South School
•   Lakes Ranch, Rotorua
•   Ōpōtiki Primary School
•   Rotorua Airport
•   Raukokore School
•   Taupō Airport
•   Tauranga Airport
•   Tauranga City Council
•   Wairākei Primary School
•   Waitangi Soda Springs
•   Western Bay of Plenty District Council
•   Whakatāne Airport
•   Several private property owners

We would like to thank the following for their technical assistance and contributions to
the various experimental requirements of this study:

•   Bryan Keen
•   Katy Stokes
•   Nigel Kell
•   Roger Stanford
•   Sheng-Huei Huang

We would also like to thank Shane Iremonger, Science Team Leader – Air, Coastal and
Land, Bay of Plenty Regional Council, for technically reviewing this report.

                                                    i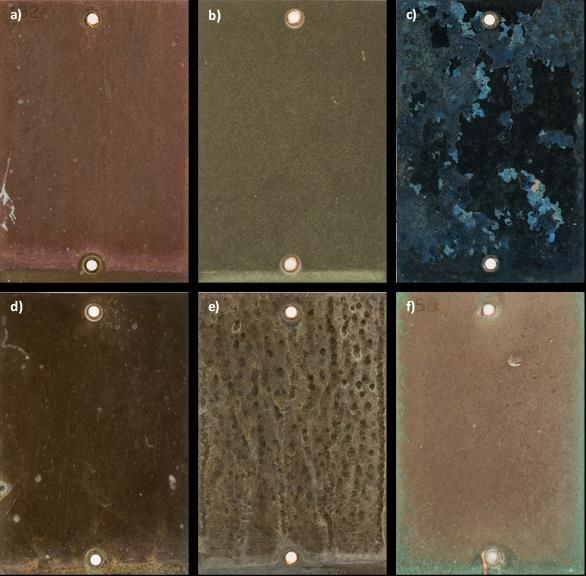
Study Report SR458 Atmospheric corrosivity of the Bay of Plenty region

Atmospheric corrosivity of the Bay
of Plenty region
BRANZ Study Report SR458
Author
Zhengwei Li

Reference
Li, Z. W. (2021). Atmospheric corrosivity of the Bay of Plenty region. BRANZ Study
Report SR458. Judgeford, New Zealand: BRANZ Ltd.

Abstract
This study report summarises the key findings from a recent BRANZ investigation into
the atmospheric corrosivity of the Bay of Plenty region including:

•   a survey of major airborne pollutants, such as ammonia, hydrogen sulphide and
    sulphur dioxide
•   information collected about the first-year atmospheric corrosion rates of mild steel,
    zinc and copper at representative exposure sites across the region
•   an update of the region’s atmospheric corrosivity map.

This study may help refine the New Zealand atmospheric corrosivity map. This map is
a key component of the material specification scheme used by New Zealand Building
Code Acceptable Solution E2/AS1 and NZS 3604:2011 Timber-framed buildings.

Keywords
Atmospheric corrosivity, geothermal, industrial, marine, hydrogen sulphide, sulphur
dioxide, mild steel, copper, zinc, map.

                                                   ii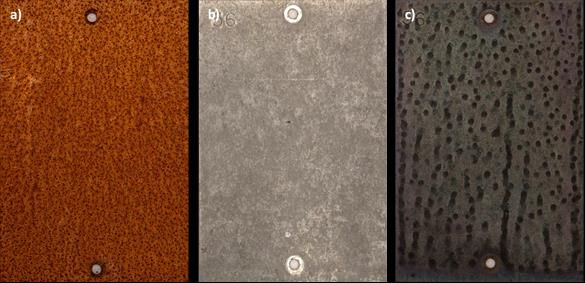
Study Report SR458 Atmospheric corrosivity of the Bay of Plenty region
Contents
EXECUTIVE SUMMARY.................................................................................... 5
1. INTRODUCTION ..................................................................................... 7
2. BAY OF PLENTY ENVIRONMENT ............................................................. 8
Basic facts ............................................................................................8
Geothermal/volcanic influences ..............................................................8
Air monitoring ..................................................................................... 10
2.3.1 Hydrogen sulphide concentrations .............................................. 10
2.3.2 Sulphur dioxide concentrations .................................................. 12
2.3.3 Particulate matter ..................................................................... 13
3. OBJECTIVE ........................................................................................... 14
4. EXPERIMENTAL .................................................................................... 15
Methodology ....................................................................................... 15
Exposure sites..................................................................................... 15
Environmental monitoring .................................................................... 18
Metallic coupons.................................................................................. 19
Exposure racks.................................................................................... 20
Exposure scheme ................................................................................ 21
Sample testing .................................................................................... 21
Atmospheric corrosivity category .......................................................... 21
5. RESULTS AND DISCUSSION ................................................................. 23
Climate............................................................................................... 23
Airborne pollution ................................................................................ 23
5.2.1 Hydrogen sulphide .................................................................... 24
5.2.2 Sulphur dioxide ........................................................................ 26
5.2.3 Ammonia ................................................................................. 28
5.2.4 Summary ................................................................................. 28
Atmospheric corrosion morphology ....................................................... 28
Atmospheric corrosion rate .................................................................. 34
Atmospheric corrosion rate comparison ................................................. 36
Atmospheric corrosivity classification..................................................... 38
6. UPDATED REGIONAL ATMOSPHERIC CORROSIVITY MAP ................... 43
REFERENCES ................................................................................................ 46
Figures
Figure 1. Atmospheric corrosivity map suggested for the Bay of Plenty region. ............6
Figure 2. Exposure sites established in the Bay of Plenty region and Taupō district. ... 16
Figure 3. Reference exposure sites established in the greater Wellington region. ....... 16
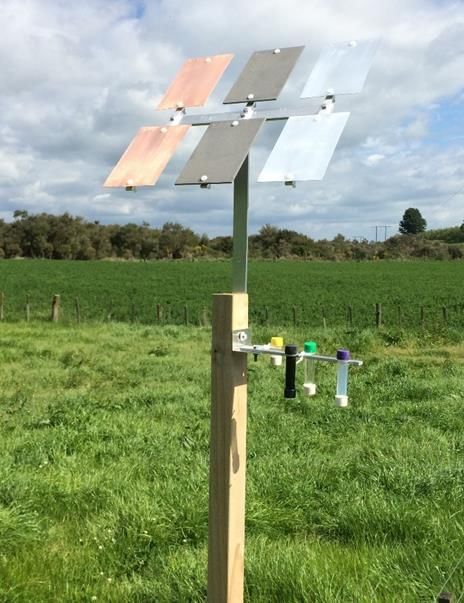
Figure 4. A typical exposure rack with a selection of passive tube sensors................. 20
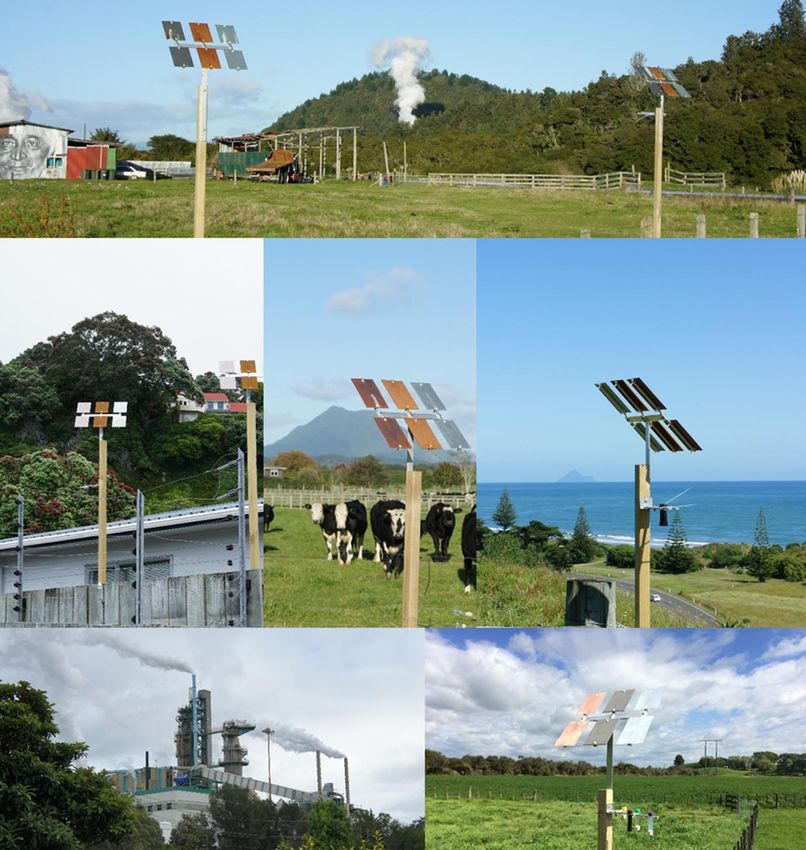
Figure 5. Mild steel coupons exposed for 1 year (July 2017 to July 2018) – a) Galatea –
rural, b) Hewletts Road, Tauranga – industrial and marine, c) 3xx SH30, Tikitere
– strong geothermal, d) Lakes Ranch, Rotorua – weak geothermal, e) Kawerau
– geothermal and paper/pulp manufacturing, f) Waihau Bay – severe marine. 29
iii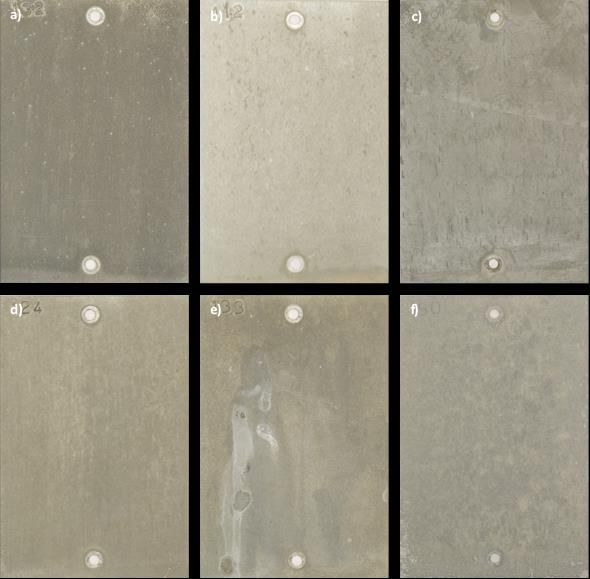
Study Report SR458 Atmospheric corrosivity of the Bay of Plenty region

Figure 6. Zinc coupons exposed for 1 year (July 2017 to July 2018) – a) Galatea –
       rural, b) Hewletts Road, Tauranga – industrial and marine, c) 3xx, SH30,
       Tikitere – strong geothermal, d) Lakes Ranch, Rotorua – weak geothermal, e)
       Kawerau – geothermal and paper/pulp manufacturing, f) Waihau Bay – severe
       marine. ..................................................................................................... 30
Figure 7. Copper coupons exposed for 1 year (July 2017 to July 2018) – a) Galatea –
       rural, b) Hewletts Road, Tauranga – industrial and marine, c) 3xx SH30, Tikitere
       – strong geothermal, d) Lakes Ranch, Rotorua – weak geothermal, e) Kawerau
       – geothermal and paper/pulp manufacturing, f) Waihau Bay – severe marine. 31
Figure 8. Coupons exposed for 1 year (July 2017 to July 2018) at Oteranga Bay,
       Wellington (severe marine) – a) mild steel, b) zinc, c) copper. ....................... 32
Figure 9. Coupons exposed for 1 year (November 2016 to November 2017) at Onepu
       Spring Road, Kawerau (geothermal and paper/pulp manufacturing) – a) mild
       steel, b) zinc, c) copper. ............................................................................. 34
Figure 10. Atmospheric corrosivity map suggested for the Bay of Plenty region. ........ 45

Tables
Table 1. Location and characteristics of exposure sites established for this study. ...... 17
Table 2. Chemical compositions of metals (wt.%). .................................................. 19
Table 3. Atmospheric corrosion classification based on 1-year corrosion rates. .......... 21
Table 4. Weather at some exposure sites. .............................................................. 23
Table 5. Airborne pollution monitoring results (ppb). ............................................... 24
Table 6. First-year atmospheric corrosion rates of mild steel, zinc and copper. .......... 35
Table 7. Comparison of first-year metal atmospheric corrosion rates between previous
       and present BRANZ studies. ........................................................................ 37
Table 8. Atmospheric corrosivity category. ............................................................. 41

                                                          iv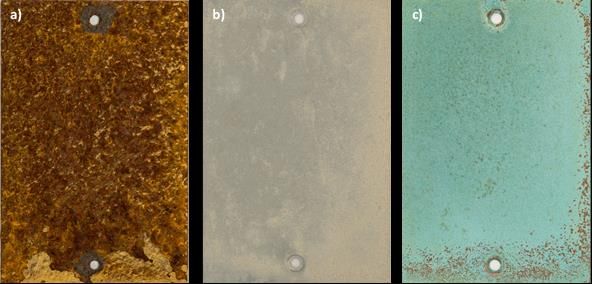
Study Report SR458 Atmospheric corrosivity of the Bay of Plenty region

Executive summary
New Zealand Building Code Acceptable Solution E2/AS1 and relevant standards, such
as NZS 3604:2011 Timber-framed buildings, use an atmospheric corrosivity zone
micro-environment scheme to specify materials and protective measures for durability
compliance. An atmospheric corrosivity map has been experimentally developed and
incorporated into NZS 3604:2011 to support this practice. It is important that the
credibility of this map is maintained, particularly when considering the potential
influences of changes in climate, industrial emission and/or urban development.

The atmospheric environment of the Bay of Plenty region is influenced by human-
related activity emissions and natural sources (such as geothermal, marine and
volcanic). These may pose various challenges for the durability of materials,
components, buildings and associated infrastructure assets in this region.

BRANZ has completed a study on atmospheric environmental conditions of the Bay of
Plenty region. This involved:

•   reviewing air monitoring results derived from previous studies carried out by Bay of
    Plenty Regional Council, BRANZ and other organisations
•   conducting two runs of short-term monitoring of major air pollutants – ammonia,
    hydrogen sulphide and sulphur dioxide – at 31 sites across the region
•   measuring the first-year atmospheric corrosion rates of mild steel, zinc and copper,
    at 31 sites across the region within two 1-year periods
•   analysing and comparing the present and previous atmospheric corrosion rate data
•   updating the region’s atmospheric corrosivity map using the present air pollution
    and atmospheric corrosion rate data.

This experimental study found the following:

•   Sulphur-containing gaseous species were detected with high concentrations in
    areas with geothermal and/or industrial emissions. The highest was 5.27 parts per
    billion (ppb) for hydrogen sulphide and 29.81 ppb for sulphur dioxide.
•   Ammonia was detected with a typical average concentration of approximately 3–5
    ppb in most areas. High concentrations (up to 26.28 ppb) were measured in areas
    very close to wastewater treatment plants.
•   A large number of geothermal sources could combine to affect a much larger area
    than a single, isolated geothermal source, possibly through synergistic effects.
•   Metallic materials showed varying atmospheric corrosion processes and responses
    when exposed to the diverse atmospheric environments in the region.
•   At 11 sites, the newly measured metal atmospheric corrosion rates were higher
    than those measured in the 1980s. The percentage increase typically ranged from
    17% to 377% for zinc and from 8% to 68% for mild steel.
•   At 17 sites, the atmospheric corrosivity category determined by the present data
    was higher than that defined by the NZS 3604:2011 exposure zone map.

The following is then recommended:

•   In areas from Waihī Beach to Te Puke, the zone C boundary would not be affected
    by the atmospheric corrosivity category defined by the present data.
•   In areas from Te Puke to Whakatāne, the zone C boundary should be slightly
    widened inland. This is evident after consideration of the corrosion rate data

                                                   5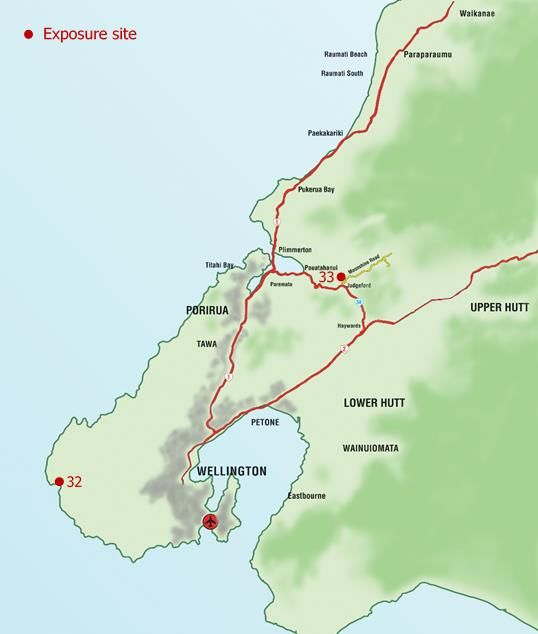
Study Report SR458 Atmospheric corrosivity of the Bay of Plenty region

    derived at Te Puke, Maketū, Edgecumbe and Whakatāne and the prevailing winds
    (northwesterly and southwesterly).
•   In areas from Ōpōtiki to Waihau Bay, the zone C boundary should be slightly
    widened inland. This is necessary after consideration of the corrosion rate data
    derived at Ōpōtiki and Waihau Bay and the potential influences of the
    volcanic/geothermal emissions from Whakaari/White Island.
•   In areas including Rotorua, Tikitere, Rotomā, Kawerau, Te Teko and Edgecumbe,
    the atmospheric corrosivity category should be increased from zone B to zone C
    after consideration of the following:
     - These areas have multiple active geothermal sources and also industrial
        activities that can emit various gases and/or particulate matter into the air.
     - Hydrogen sulphide and/or sulphur dioxide concentrations in these areas were
        higher than those in other non-geothermal, non-industrial, natural areas.
     - Winds from the south and west are common in these areas.
     - Relatively high rainfall levels were recorded in these areas.
     - First-year corrosion rates of mild steel, zinc and copper indicated a corrosivity
        category, zone C (C3 – Medium in ISO 9223:2012 Corrosion of metals and
        alloys – Corrosivity of atmospheres – Classification, determination and
        estimation) or even higher in some cases.
•   Within those areas subject to geothermal influences, the microclimatic conditions
    defined by NZS 3604:2011 should still be applied. However, it would be appropriate
    to increase the current boundary from 50 m to 500 m. This is to align with SNZ TS
    3404:2018 Durability requirements for steel structures and components.

Based on these, the atmospheric corrosivity map for the Bay of Plenty region has been
updated and shown in Figure 1.

Figure 1. Atmospheric corrosivity map suggested for the Bay of Plenty region.

Key technical findings of this study may better support the specification of materials for
buildings and associated infrastructure assets in the Bay of Plenty region. The updated
regional map may help refine the atmospheric corrosivity map used in NZS 3604:2011.
                                            6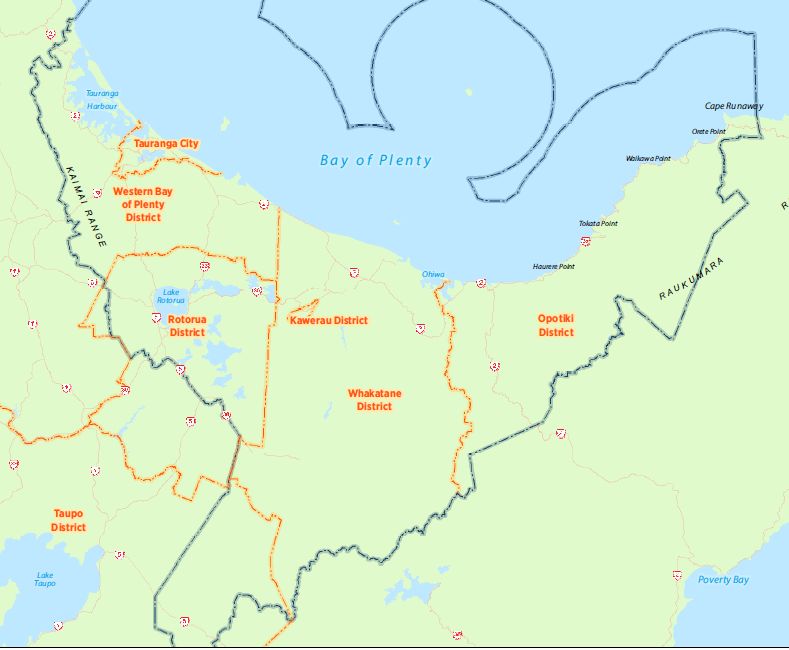
Study Report SR458 Atmospheric corrosivity of the Bay of Plenty region

1.           Introduction
Any functional building components, when chosen as Acceptable or Alternative
Solutions, must meet or exceed the minimum durability requirements of the New
Zealand Building Code, such as 5, 15 or 50 years. An atmospheric corrosivity zone
micro-environment approach has been established and used to guide the specification
of materials (particularly metals and alloys) and their protective measures (such as
coatings and paints). These may include E2/AS1, NZS 3604:2011 and SNZ TS
3404:2018. It is necessary to accurately define the atmospheric corrosivity category of
a specific geographic location for building using reliable approaches.

The atmospheric corrosivity map shown in NZS 3604:2011 can serve this purpose. This
map was established by using metal atmospheric corrosion rate data experimentally
derived by BRANZ in the 1980s and 1990s. The ongoing credibility of this map was
evaluated by BRANZ in the early 2010s. This repeat study revealed significant changes
in corrosion rates in some areas. Thorough analyses further indicated that, in some
areas, the map has some limitations in its definition of atmospheric corrosivity zone
boundaries.

BRANZ’s interaction with the industry found that there was a need for information on
atmospheric corrosivity and materials environmental degradation in fast-growing
regions such as the Bay of Plenty.

The atmospheric environment of the Bay of Plenty region is affected by human-related
activity emissions (such as agricultural, domestic heating, industry and vehicles) and
natural sources (such as geothermal, marine and volcanic). Materials, buildings and
associated infrastructure assets can be attacked simultaneously by sea salt, ammonia
and/or sulphur-containing species in some areas. This complexity is not seen in other
New Zealand regions as they normally have only one of those respective pollutants.
This unique and challenging environment may lead to abnormal material degradation
problems. BRANZ’s previous inspection of small commercial buildings found that the
premature deterioration of exterior claddings on commercial buildings was common
and potentially serious in this region. However, the mechanisms behind these
observations were not well understood.

A characterisation of the Bay of Plenty atmospheric environment and an update of its
atmospheric corrosivity map is necessary. This is particularly evident when considering
its fast population growth, strong demand for buildings and active infrastructure
investments and development.

                                                   7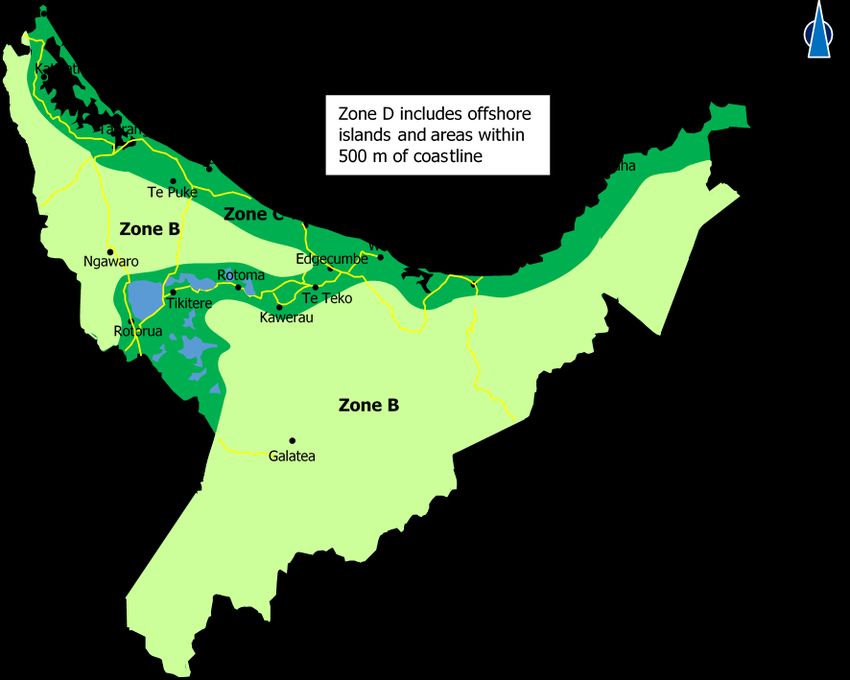
Study Report SR458 Atmospheric corrosivity of the Bay of Plenty region

2.           Bay of Plenty environment
             Basic facts
The Bay of Plenty region is sheltered in the west, east and south and is one of the
least windy areas in New Zealand (Chappell, 2013). It has two climate zones –
Northern New Zealand and Central North Island, as defined by NIWA.1

•    Northern New Zealand – this subtropical climate zone has warm humid summers
     and mild winters. Typical maximum daytime air temperatures are 22–26°C and 12–
     17°C for summer and winter respectively. Annual average sunshine hours are
     approximately 2,000, while Tauranga has more than 2,200 hours. Prevailing winds
     are from the southwest. Winter in this climate zone is usually unsettled and has
     more rain. Tropical storms may bring strong winds and heavy rainfall from the east
     or northeast during summer and autumn.
•    Central North Island – this inland region, sheltered by high country to the south
     and east, has warm, dry and settled summers and cool, unsettled winters. Typical
     maximum daytime air temperatures are 21–26°C and 10–14°C for summer and
     winter respectively. Annual average sunshine hours are approximately 2,000–2,100
     in most areas. Prevailing winds are from the southwest.

The atmospheric environment of the Bay of Plenty region is affected by agricultural,
industrial, marine, geothermal and/or volcanic activities.

•    It has a coastline approximately 260 km in length, extending east from Orokawa
     Bay (east of Waihī) towards East Cape ending near Lottin Point. It also has
     approximately 9,500 km2 of coastal marine area (Bay of Plenty Regional Council,
     2014).
•    It has several areas with intensive industrial activities, such as primary and
     secondary timber processing in Rotorua, pulp and paper manufacturing and
     geothermal power generation in Kawerau and fertiliser manufacturing, speciality
     chemicals and asphalt processing in Tauranga.
•    It has approximately 10 significant geothermal areas, including Kawerau, Rotorua,
     Tauranga and Waimangu.
•    It has New Zealand’s most active andesite stratovolcano, Whakaari/White Island.
     The island has been continuously releasing volcanic gases and has erupted in 2012,
     2016 and 2019.

             Geothermal/volcanic influences
Numerous geothermal systems with highly variable sizes and features have been
identified in the Bay of Plenty region (Scott, 2010; Newson, 2010).

•    Rotorua geothermal field (RGF) – this is at the southern margin of the Rotorua
     caldera in the active Taupō volcanic zone (TVZ). It underlies much of Rotorua city
     (Mroczek, Graham & Scott, 2011). This field has an area of approximately 18–28
     km2, and surface geothermal activity is mainly confined to three areas:
         o Whakarewarewa/Arikikapakapa in the south.
         o Kuirau Park/Ōhinemutu (on the shore of Lake Rotorua) to the northwest.

1
 New Zealand’s climate is complex and variable. NIWA has grouped selected locations into 12
broad climate zones based on statistical data of average rainfall and temperature – see
https://niwa.co.nz/education-and-training/schools/resources/climate/overview
                                                   8
Study Report SR458 Atmospheric corrosivity of the Bay of Plenty region
o Government Gardens/Ngāpuna/Sulphur Bay to the northeast, which is also
on the shore of Lake Rotorua (Gordon, Scott & Mroczek, 2005; Ratouis,
O’Sullivan & O’Sullivan, 2014).
This field has approximately 1,200–1,500 known and recorded geothermal
features. Reported surface expressions are highly variable and may include:
o geysers
o neutral to alkaline hot springs and pools
o fumaroles
o turbid acid pools and lakelets
o mud pools and mud cones
o warm or hot grounds and solfatara
o dolines and craters (collapse and eruption).
Whakarewarewa has the largest concentration of geysers, which is recognised to
be of regional, national and international significance.
• Kawerau – this geothermal field is near Kawerau township and located within
eastern side of the TVZ. It is centred on the flood plains of the Tarawera River
between Pūtauaki/Mount Edgecumbe and the Onepū Hills, covering an area of 19–
35 km2. It lies between the northeast-trending normal faults of the Taupō fault belt
on its west and the northward-striking strike-slip faults of the North Island dextral
fault belt to the east (Clarke, Townend, Savage & Bannister, 2009). Its basement
surface is buried by volcanic materials and sediments to a depth of approximately 1
km and dips northward. The hydrothermal features in Kawerau are not as
spectacular as those in Rotorua, but the temperature of geothermal fluids may still
exceed 310°C (Milicich, Clark, Wong & Askari, 2016).
• Lake Tarawera – there are hot springs and warm seeps on the lake shore and
fumaroles in the bush above.
• Lake Okataina Springs – several small warm seepages are identified on the lake
shore.
• Lake Rotoiti – high heat flow has been recognised on the lake floor towards the
eastern end.
• Tikitere (Hell’s Gate) – it is approximately 16 km south of Rotorua and has an
extensive area containing hot grounds, fumaroles, mud pools and springs.
• Taheke – this system features a moderate-size area of hot grounds, fumaroles and
warm to hot springs.
• Lake Rotokawa – it has a few sinter-depositing springs and is the largest
geothermal lake in New Zealand.
• Rotomā-Soda Springs – this area has warm-hot ground and springs, with lakeside
seeps.2
• Waimangu-Rotomahana – it has large hot crater lakes, hot springs and grounds.
• Tauranga geothermal system – this system, extending approximately 60 km from
Waihī Beach to Paengaroa, is a large-scale, low-temperature geothermal system
(30–70°C).
• Whakaari/White Island – it lies approximately 48 km off the Bay of Plenty coastline
and is an active andesitic stratovolcano with eruptions throughout the 20th
century. It has active hot springs, steaming fumaroles and boiling muds. Yellow
elemental sulphur precipitates could easily be found due to oxidation of H2S gas
expelled into the air from fumarole vents (composed of opaline silica).
2
A geothermal seep is any natural spring producing water that has been heated by geothermal
processes to a temperature of more than 30°C (Keam, Luketina & Pipe, 2005).
9Study Report SR458 Atmospheric corrosivity of the Bay of Plenty region
These geothermal systems, particularly the high-temperature systems in the RGF, can
emit large volumes of gases into the air. These may include (Lichti et al., 1996; Lee,
Yang, Lan, Song & Tsao, 2005; Luketina, 2007):
• ammonia (NH3)
• argon (Ar)
• carbon dioxide (CO2)
• hydrogen (H2)
• hydrogen chloride (HCl)
• hydrogen fluoride (HF)
• hydrogen sulphide (H2S)
• methane (CH4)
• nitrogen (N2)
• steam (water vapour)
• sulphur dioxide (SO2).
Air monitoring
Bay of Plenty Regional Council undertakes air monitoring activities as part of its
statutory responsibilities. The current natural environmental regional monitoring
network (NERMN) is a combination of a regional network of sites for environment
monitoring, documentation and reporting and source-specific monitoring in targeted
areas (Iremonger & Mackay, 2020). Meanwhile, other organisations, including ESR, the
Ministry for the Environment and NIWA, have also performed monitoring activities in
specific areas within the Bay of Plenty region.
2.3.1 Hydrogen sulphide concentrations
The RGF has numerous high-temperature geothermal systems that can emit high
concentrations of sulphur-containing gases. These species, particularly H2S, may have
significant influences on human health and materials performance.
The Department of Health, in the 1970s, monitored H2S levels within the Rotorua
geothermal areas (Rolfe, 1980; Graham & Narsey, 1994). The highest concentration
measured in the air was approximately 690 parts per billion (ppb) or above. A 3-month
monitoring in 1978 gave a median concentration of approximately 20 ppb.
NIWA, in the 1990s, monitored H2S concentrations within periods of 1–3 months at
seven sites, including Whakarewarewa Village, Sunset Road, Te Ngae Road, Ōwhata,
Jervis Street, Arawa Street and the lakefront. The highest H2S concentration was found
at the Te Ngae Road site close to Ti Street. The half-hour average concentration was
approximately 72–108 ppb. H2S concentrations measured at Whakarewarewa Village
and Arawa Street were 66–100 ppb and 7–54 ppb respectively. At the other four sites,
H2S concentrations were 0.3–4 ppb (Iremonger, 2012a).
H2S concentrations within short periods (10–60 minutes) along the shore of Lake
Rotorua have been measured (Seigel, Penny, Seigel & Penny, 1986). The average
concentration north of Ōhinemutu was approximately 5 ppb. H2S concentrations at
most sites from Ōhinemutu to the north tip of Sulphur Bay were 3–115 ppb. The lower
Sulphur Bay sites had much higher concentrations of 1,200–2,700 ppb.
Bay of Plenty Regional Council performed long-term H2S monitoring at Ti Street and
Arawa Street sites from 1997/98 to 2005. The highest hourly concentration was
approximately 2,800 ppb, while annual average concentrations were approximately
10Study Report SR458 Atmospheric corrosivity of the Bay of Plenty region
50–100 ppb. Monitoring at Te Ngae Road site showed that the annual average
concentrations were approximately 90 ppb and 76 ppb in 2010 and 2011 respectively.
These previous studies revealed that high concentrations of airborne H2S were
normally found in the areas close to active, large-sized geothermal sources, such as
Sulphur Bay in the central city.
These monitoring activities also revealed that H2S concentration had a clear daily
diurnal pattern. It started to increase during the late afternoon and early evening,
remained high during the night, started to decrease during the morning and remained
low during the day. In the yearly scale, H2S concentrations during autumn and winter
were higher than those during summer and spring. This pattern appeared to be related
to meteorological factors such as wind speed and direction, atmospheric stability and
rainfall (Iremonger, 2012a, 2012b).
However, these monitoring activities are not able to analyse the long-term trends of
airborne H2S concentration in Rotorua, such as whether there is an overall
concentration increase or decrease with time. The data is not always comparable due
to differences in monitoring instruments, location and period.
H2S concentration maps had been developed for Rotorua using various techniques,
roughly dividing the city into three regions (Horwell, Patterson, Gamble & Allen, 2005;
Hinz, 2011). The central city (the corridor in the Mamaku ignimbrite to the east of the
rhyolite domes following the northeast-southwest trending Ngāpuna and Roto-a-
tamaheke faults) had high concentrations. West and east sides showed significantly
lower concentrations. This agreed well with recent BRANZ measurements at six sites
across the city (Li, Marston & Stokes, 2018).
In Kawerau, there are some paper and pulp manufacturing and geothermal power
generation activities that can release H2S from their processes and affect some areas
nearby.
Ambient total reduced sulphur compounds (TRS) had been monitored at Kawerau,
Edgecumbe and Te Teko by various organisations in the 1990s. Short-term (10–15
minute average) H2S concentrations were approximately 640, 80, 50 and 20 ppb at the
Tasman Mill site, the Kawerau site, the Edgecumbe site and the Te Teko site
respectively. Annual H2S average concentrations at these sites were approximately 4.8,
2.6, 0.6 and 0.2 ppb respectively (Iremonger, 2012a). These indicated a clear
concentration dependence on the distance from the source.
In the period of August 2012 to June 2014, monitoring had been done to measure
ambient H2S in Kawerau and areas nearby. The highest hourly average H2S
concentration at Kawerau was approximately 210 ppb, which was approximately three
times and six times higher than those at Edgecumbe and Te Teko respectively
(Graham, 2014). This monitoring also found that H2S concentrations had marked
fluctuations from hour to hour, day to day and throughout the year due mainly to
weather variations. In Edgecumbe and Te Teko, there was no obvious seasonal
variations in H2S concentrations. A small degree of seasonal variation was noticed in
Kawerau during winter seasons. This is somewhat different to the observations in
Rotorua.
Airborne H2S concentrations had been monitored briefly at Rotomā in 1995 and ranged
from approximately 5–15 ppb (Iremonger, 2012a).
11Study Report SR458 Atmospheric corrosivity of the Bay of Plenty region
Bay of Plenty Regional Council monitored airborne H2S concentrations within Tauranga
Harbour. The source may include industrial processes nearby and decomposing organic
materials, such as sea lettuce. Extremely high H2S concentrations (192,000 ppb peak
concentration) were measured with organic decomposition in the early 2010s
(Iremonger, 2012a). During the monitoring period of 2015–2020, the maximum hourly
concentration was approximately 24 ppb (Iremonger & Mackay, 2020).
H2S has a density of 1.36 kg/m3 and is heavier than air. It tends to collect on the
ground or in low-lying poorly ventilated areas. The dependence of airborne H2S
concentration on height above the ground has been investigated (Smid, Howe &
Lynne, 2010). The concentration was found to be 0–100 parts per million (ppm), 0–57
ppm and 0–20 ppm at the feature entry at a height of 0.5 m above surface/entry and
at 1 m above surface/entry respectively. This indicated an obvious decrease with
height. BRANZ used passive tube sensors to measure airborne H2S concentrations at
three heights from the ground – 1 m, 2 m and 3 m – located next to a small-scale
fumarole in Whakarewarewa. Average H2S concentration in a 3-week period at 3 m
was approximately 22 times lower than that at 1 m height (2.5 ppb versus 54.7 ppb)
(Li, Marston & Stokes, 2018).
2.3.2 Sulphur dioxide concentrations
BRANZ measured airborne SO2 concentrations at 10 sites in Rotorua (Li, Marston &
Stokes, 2018). Monitoring was done within a 3-week period started on 21 June 2015
using passive tube sensors. At the six sites across the city from the west to the east,
the highest concentration, approximately 37.8 ppb, was measured at the wastewater
treatment plant site south of Sulphur Bay. Meanwhile, the west city area (Malfroy
Road) appeared to have lower SO2 concentrations than the east city area (Lynmore).
Measurements taken within Scion’s campus in Whakarewarewa showed that SO2
concentration had an obvious dependence on the distance from the geothermal
source. Concentrations measured at the two locations approximately 50–60 m away
from a small-scale fumarole were approximately 3–4 times lower than those close to
the source.
Ambient SO2 has been monitored around the Mount Maunganui industrial area with
fertiliser production, specialised chemicals and asphalt manufacturing and processing
and shipping activities (Iremonger, 2010a).
ESR’s short-term monitoring (from 14 October to 15 December 1994) in Totara Street,
Tauranga showed that the 1-hour average and daily average SO2 concentrations were
approximately 86 ppb and 16 ppb respectively.
In the 2000s, three sites, including Totara Street, Maru Street and Chevron, were
developed by Bay of Plenty Regional Council and Ballance Agri-Nutrients to map
airborne SO2 concentration and distribution. The highest maximum 1-hour SO2
concentration was measured at the Totara Street site, approximately 260 ppb. The
maximum 1-hour SO2 concentrations at the Maru Street site and Chevron site were
approximately 90 ppb and 100 ppb respectively. The maximum daily SO2
concentrations were approximately 73 ppb, 24 ppb and 32 ppb at the Totara Street
site, the Maru Street site and Chevron site respectively.
The data indicated that fertiliser manufacturing process and shipping activity had a
dominating influence on the SO2 profile within the southern Mount Maunganui area.
Encouragingly, airborne SO2 concentrations are showing reductions, probably due to
12Study Report SR458 Atmospheric corrosivity of the Bay of Plenty region
regulations with fuels and production process optimisation (Iremonger& Mackay,
2020).
As New Zealand’s most active andesitic stratovolcano, Whakaari/White Island releases
SO2 with its activity (Wardell, Kyle, Dunbar & Christenson, 2001). The emission rate
has been monitored since 2000s. It is estimated that approximately 162 tonnes of SO2
are being released daily into the atmosphere (Iremonger, 2010a).
2.3.3 Particulate matter
Particulate matter is a type of air pollutant that is comprised of suspended particles in
air with varying composition and size. It can arise from anthropogenic, industrial
and/or natural activities. It can play an important role in eliciting health responses and
effects (Anderson, Thundiyil & Stolbach, 2012; Kim, Kabir & Kabir, 2015). It can cause
damage to building and construction materials, depending on the chemical composition
and physical state. This is because it can be corrosive or it can absorb or interact with
corrosive chemicals to accelerate degradation processes (Button & Simm, 1985; Ferm,
Watt, O’Hanlon, De Santis & Varotsos, 2006; Saha, Pandya, Singh, Paswan & Singh.,
2016).
The major sources for particulate matter in the Bay of Plenty region are domestic
heating, transportation, shipping and industrial process. In certain periods, marine
aerosols could also contribute. Particulate matter (PM10 and PM2.5)3 has been monitored
by Bay of Plenty Regional Council continuously at a number of sites across the region
from the 1990s (Iremonger, 2010b, 2012b; Iremonger & Mackay, 2020). These sites
are mainly located in Mount Maunganui, Otūmoetai (Tauranga), Whakatāne and
Rotorua.
High concentrations of particulate matter were observed at some sites. For example, in
Rotorua, the maximum daily concentrations of PM10 were 162 µg/m3 and 72 µg/m3 at
Edmund Road and Ngāpuna respectively (Iremonger, 2009, 2010b, 2012b). These
were higher than the National Environmental Standards for Air Quality of 50 µg/m3 for
short-term exposure. Daily mean values of PM10 that closely approached or exceeded
the standard value were observed in the Mount Maunganui industrial area (Iremonger
& Mackay, 2020). These were supposedly related to anthropogenic and natural sources
and overarching weather patterns. Encouragingly, long-term monitoring has shown a
steady reduction both in number of exceedances and concentrations.
At most sites (for example, Edmund Road in Rotorua), there was a seasonal pattern
with a wintertime increase observed, which was probably related to domestic heating
(Iremonger & Mackay, 2020).
3
PM10 is particulate matter 10 micrometres or less in diameter. PM2.5 is particulate matter 2.5
micrometres or less in diameter.
13Study Report SR458 Atmospheric corrosivity of the Bay of Plenty region
3. Objective
The Bay of Plenty region has various agricultural, geothermal and industrial activities.
According to the results of previous air quality monitoring performed by different
organisations, H2S, SO2 and particulate matter were present in the air. Their
concentrations were highly location dependent. In particular, H2S released from active
geothermal sources within the TVZ and SO2 from industrial activities can affect
relatively large areas. These gaseous and solid species may have profound health
effects on people living nearby. Therefore, they have been monitored by the regional
council.
These airborne pollutant species are known to be corrosive and can significantly
influence the environmental performance and durability of susceptible materials and
components used for buildings and their associated infrastructure assets. Atmospheric
corrosion rates of some metals had been experimentally measured at several sites
within this region by BRANZ in the 1980s and 1990s. However, the effects of airborne
pollution on regional atmospheric corrosivity have not been thoroughly investigated.
This study aimed to deliver a better understanding of the Bay of Plenty environment,
particularly to map the corrosivity of the atmosphere in this region. This was achieved
by undertaking:
• a survey of concentrations of major airborne pollutants, including H2S, SO2 and
NH3, across the Bay of Plenty region
• a collection of first-year corrosion rates of standard metals when exposed to the
Bay of Plenty atmospheric environments
• an analysis and comparison of BRANZ’s present and previous atmospheric corrosion
rate data
• an update of the atmospheric corrosivity map for the Bay of Plenty region.
The findings will support the refinement of material specification schemes for design,
construction and maintenance of new and existing buildings and infrastructure assets
in the Bay of Plenty region. This region is demonstrating rapid economic and
population growth and increasing spending in transportation.
14Study Report SR458 Atmospheric corrosivity of the Bay of Plenty region
4. Experimental
Methodology
The presence, concentration and distribution of multiple airborne pollutants in the Bay
of Plenty region are highly variable. They pose various risks to materials, buildings and
infrastructure assets. Accordingly, this study had two interconnected research
components to deliver its objectives: environmental condition characterisation and
atmospheric corrosivity classification.
Effective state-of-the-art instruments such as passive diffusion tube sensors were
deployed to monitor airborne pollutants. This was complemented by collecting
meteorological data from the National Climate Database.
Atmospheric corrosivity categorisation was achieved by using internationally accepted
methodologies to measure the first-year corrosion rates of standard metallic coupons
at selected exposure sites (Knotkova, Boschek & Kreislova, 1995; Dong, Han & Ke,
2007). This method was used in BRANZ’s studies in the 1980s and 2010s (Cordner,
1990; Duncan & Cordner, 1991; Li, Marston & Jones, 2013, 2015).
The environmental and corrosion rate data was reconciled to interpret environment-
material interactions and to map the Bay of Plenty region’s atmospheric corrosivity.
Exposure sites
In order to deliver representative environmental monitoring and atmospheric corrosion
data, 31 exposure sites were established for the present study (Figure 2). Most of
them were located within the wide Bay of Plenty region, and several were situated
within the Taupō district (south end of the TVZ). Open and secure locations such as
airports, farmland and wastewater treatment plants were chosen wherever possible. In
some areas with geothermal, industrial or marine influences, a group of exposure sites
(3–4 sites in close proximity to each other) were established. This was to investigate
the effects of distance on atmospheric corrosivity and metal corrosion.
Two reference exposure sites have been established in the greater Wellington region
(Figure 3). One is located within the BRANZ campus at Judgeford, Porirua, and the
other at Oteranga Bay on the southwest coast of Wellington. The Judgeford site is in a
sheltered semi-rural environment separated by approximately 3 km from the nearest
saltwater, a tidal estuary, and further protected by gently rolling hills. It lies within
zone C of the atmospheric corrosivity map in NZS 3604:2011. However, it is a fairly
benign example of this classification as demonstrated by previous tests using mild steel
and zinc (hot-dip galvanised steel and pure zinc). The Oteranga Bay site is
approximately 60 m away from the sea, which passes through Cook Strait. It is a
(very) severe marine environment with (very) strong westerly winds in some seasons.
Its atmospheric corrosivity can be classified as ISO 9223:2012 C5 – Very high or C4 –
High based on the first-year corrosion rates of mild steel and zinc.
A full list of the exposure sites is given in Table 1.
15Study Report SR458 Atmospheric corrosivity of the Bay of Plenty region
Map sourced from Bay of Plenty Local Council Boundaries Map Book.
https://maps.boprc.govt.nz/datasets/704c9b9594454c03ba615837167e0a01. Licensed under
the Creative Commons Attribution 3.0 New Zealand Licence.
Figure 2. Exposure sites established in the Bay of Plenty region and Taupō district.
Figure 3. Reference exposure sites established in the greater Wellington region.
16Study Report SR458 Atmospheric corrosivity of the Bay of Plenty region
Table 1. Location and characteristics of exposure sites established for this study.
No Site Location Environmental characteristics
Latitude Longitude
Rural + marine
1 Waihī Beach -37.43 175.94
Approximately 1.95 km west of the coastline
Pukakura Road, Rural + marine
2 -37.55 175.94
Katikati Approximately 0.22 km south of the coastline
Rural + marine + wastewater treatment
3 Katikati -37.56 175.93
Approximately 0.13 km north of the coastline
Urban + marine + wastewater treatment
Chapel Street,
4 -37.67 176.16 Approximately 0.02 km southeast of the
Tauranga
coastline
Hewletts Road, Industrial + marine
5 -37.67 176.18
Tauranga Close to the port
Urban + industrial + air transportation
6 Tauranga Airport -37.67 176.20 Seawater relatively close at its west and south
sides
Rural + wastewater treatment
7 Te Puke -37.78 176.34
Approximately 6.6 km southwest of the coastline
Rural + marine + wastewater treatment
8 Maketū -37.77 176.47
Approximately 0.3 km west of the Waihī Estuary
Forest
TECT All Terrain
9 -37.95 176.15 Approximately 22 km northwest of the RGF and
Park, Ngawaro
approximately 31 km southwest of the coastline
10 Rotorua Airport -38.11 176.32 Urban + air transportation + geothermal
Rural + geothermal
2xx SH30,
11 -38.07 176.35 Approximately 1.4 km southwest of the Hell’s
Tikitere
Gate geothermal field
Rural + strong geothermal
3xx SH30,
12 -38.07 176.36 Approximately 0.2 km southwest of the Hell’s
Tikitere
Gate geothermal park
Lake Rotokawau Rural + strong geothermal
13 Road, -38.07 176.36 Approximately 0.12 km southeast of the Hell’s
Tikitere Gate geothermal park
Rural + geothermal
Lakes Ranch,
14 -38.07 176.37 Approximately 1 km southeast of the Hell’s Gate
Rotorua
geothermal park
Rural + geothermal
15 Rotomā -38.04 176.55
Close to Lake Rotoehu and Lake Rotomā
Rural + geothermal
16 Lake Okaro -38.30 176.39 Approximately 1.3 km south of Waimangu
volcanic valley
Rural + geothermal
17 Wai-O-Tapu -38.36 176.36 Approximately 0.7 km west of Wai-O-Tapu
geothermal area
Rural + geothermal
18 Wairākei -38.62 176.10 Close to the Wairākei Power Station and
Wairākei thermal valley
19 Taupō Airport -38.74 176.08 Rural + air transportation + geothermal
Rural
20 Galatea -38.41 176.74
Inland
17Study Report SR458 Atmospheric corrosivity of the Bay of Plenty region
No Site Location Environmental characteristics
Latitude Longitude
Urban + geothermal
Approximately 2.7 km southwest of industrial
21 Kawerau South -38.10 176.70
area (pulp and paper mill and geothermal power
station)
Tamarangi
22 -38.08 176.72 Industrial + geothermal + transportation
Drive, Kawerau
Onepu Spring Rural + industrial + geothermal
Road, Approximately 0.8 km northeast of industrial
23 -38.06 176.73
area (pulp and paper mill and geothermal power
Kawerau
station)
24 Te Teko -38.03 176.85 Rural
25 Edgecumbe -37.98 176.83 Urban
Whakatāne Marine + air transportation
26 -37.92 176.92
Airport Approximately 1 km southwest of the coastline
Urban
Taroa Street, Approximately 0.9 km southwest of the coastline
27 -37.95 177.00
Whakatāne and approximately 0.17 km southwest of
Whakatāne River
Urban + marine
28 Ōpōtiki -38.01 177.28
Approximately 1.9 km south of the coastline
4xx SH35, Rural + marine
29 -37.99 177.32
Ōpōtiki Approximately 0.3 km south of the coastline
1xxxx SH35, Marine
30 -37.63 177.89
Waihau Bay Approximately 0.06 km east of the coastline
Orete Forest
Rural
31 Road, Waihau -37.63 177.90
Approximately 1.6 km southeast of the coastline
Bay
Oteranga Bay, Severe marine
32 -41.29 174.63
Wellington Approximately 0.06 km north of the coastline
Judgeford, Semi-rural
33 -41.11 174.95 Approximately 3.2 km southeast of Porirua
Porirua
Harbour
Environmental monitoring
Atmospheric environmental data, including ambient temperature, relative humidity,
rainfall and wind speed, was downloaded directly from the National Climate Database,
CliFlo, NIWA. Only some exposure sites established in the present study have
meteorological stations nearby in operation. These include Rotorua Airport, Tauranga
Airport, Whakatāne Airport, Taupō Airport, Te Puke and Galatea. However, not all
atmospheric data needed for analysis was available for downloading.
Passive tube sensors were used to measure the concentrations of airborne H2S, SO2
and NH3 at exposure sites. These sensors were supplied and analysed by Gradko
Environmental, Hampshire, UK. They were installed approximately 2 m above ground
level, and the typical monitoring period was 3–4 weeks. Airborne pollutants were
chemically adsorbed and transformed into a stable compound in the tube. The
concentrations were quantitatively determined by UV/visible spectrophotometry and/or
ion chromatography with reference to calibration curves derived from the analysis of
18Study Report SR458 Atmospheric corrosivity of the Bay of Plenty region
standard solutions (UKAS accredited methods). This provided the averaged
concentration of specific airborne pollutant during the exposure period.
Metallic coupons
Three types of metals – mild steel, copper and zinc – were used in the present study.
They are commonly used for atmospheric corrosivity classification according to national
and international standards. Zinc-based coatings, particularly hot-dip galvanised zinc
coatings, are widely used in New Zealand for building and construction to protect steel-
based components such as claddings and fastenings. Their chemical compositions are
given in Table 2.
Table 2. Chemical compositions of metals (wt.%).
Metal Element
C Al Si P S Ti V Nb
0.08 0.039 0.02 0.016 0.024Study Report SR458 Atmospheric corrosivity of the Bay of Plenty region
Surface finish has an important role to play in atmospheric corrosion of metals (Hägg
Mameng et al., 2016). In the present study, the surface finish of metallic coupons
strictly followed BRANZ’s previous practice. The surface of the mild steel coupon (~150
× 100 × 3 mm) was grit blasted to SA2.5 grade. The surfaces of copper (~150 × 100
× 3 mm) and zinc (~150 × 100 × 3 mm) were finished with 800 grit silicon carbon
paper.
The coupons were numbered, and the dimensions of each coupon were measured.
Prior to exposure, they were cleaned with acetone, dried with hot air and weighed to
0.001 g. The coupons were then sealed in separate plastic bags, shipped to exposure
sites and mounted onto exposure racks using nylon fasteners immediately prior to rack
installation.
Exposure racks
Exposure racks were fabricated with aluminium extrusions to support coupons and
sensors (Figure 4).
Figure 4. A typical exposure rack with a selection of passive tube sensors.
Large separation distances were made between individual coupons to minimise
potential cross-contamination and/or galvanic corrosion risk from corrosion products
formed on mild steel, copper and zinc.
Nylon bolts, nuts and washers were used to fix the metallic coupons onto the racks to
avoid potential galvanic corrosion risks between testing materials and aluminium
extrusions. Washers of 12 mm thickness were also used to increase the gaps between
the underside of the coupons and the aluminium supporting arms. This was to
minimise water ponding and dirt accumulation in these sheltered areas and gaps.
20Study Report SR458 Atmospheric corrosivity of the Bay of Plenty region
The exposure racks were normally installed approximately 2 m above the ground and
oriented towards north at an angle of 45°. At sites with (very) high levels of
environmental pollution such as severe marine, the exposure racks were then
positioned towards the pollution source.
Exposure scheme
Metallic coupons were exposed at selected sites according to the schedules below:
• November 2016 to November 2017: 1-year exposure (first exposure).
• November 2016 to November 2018: 2-year exposure.
• July 2017 to July 2018: 1-year exposure (second exposure).
A small number of coupons were also installed at additional sites (No. 15, 17 and 18 in
Table 1) in November 2017 and retrieved in November 2018 (i.e. the third exposure).
Sample testing
After the designated exposure periods, metallic coupons were retrieved for lab
analysis. Their surface morphology was examined visually and microscopically.
The corrosion products remaining on the coupon surface were then cleaned thoroughly
following the procedures recommended by ASTM G1 Standard practice for preparing,
cleaning, and evaluating corrosion test specimens to determine corrosion rates.
• Mild steel – 0.5 L/L hydrochloric acid (HCl, specific gravity = 1.19) + 3.5 g/L
hexamethylenetetramine (C6H12N4) at 20–25°C.
• Zinc – 100 g/L ammonium chloride (NH4Cl) at 70°C.
• Copper – 0.1 L/L sulphuric acid (H2SO4, specific gravity: 1.84, 98%) at 20–25°C.
The chemically cleaned coupons were rinsed with flowing water, dried with hot air and
reweighed to determine their mass losses due to atmospheric exposure. Several clean,
unexposed metal coupons were also immersed into these chemical solutions for the
same period as the cleaning process. Their mass losses were recorded for corrosion
rate measurement correction.
Atmospheric corrosivity category
The classification of atmospheric corrosivity follows the definition of ISO 9223:2012
and uses the first-year metal corrosion rates (Table 3).
Table 3. Atmospheric corrosion classification based on 1-year corrosion rates.
ISO 9223:2012 NZS 3604:2011 First-year corrosion rate (g/m2/year)
Description
category exposure zone Mild steel Zinc Copper
C1 Very low 10 0.7 0.9
C2 Low B 10–200 0.7–5 0.9–5
C3 Medium C 200–400 5–15 5–12
C4 High D 400–650 15–30 12–25
C5 Very high E 650–1,500 30–60 25–50
CX Extreme 1,500–5,500 60–180 50–90
21Study Report SR458 Atmospheric corrosivity of the Bay of Plenty region
Atmospheric corrosivity classification was mainly done using the first-year corrosion
rates of mild steel and zinc. The corrosion rate of copper was used as a reference for
classification in the present study. This was because previous BRANZ studies found
that copper had a higher sensitivity to low concentrations of sulphur-containing
geothermal emissions when compared to mild steel and zinc. Even in areas with trace
quantities of sulphur-containing species, copper may still show a corrosion rate much
higher than that in areas without geothermal influences.
22Study Report SR458 Atmospheric corrosivity of the Bay of Plenty region
5. Results and discussion
Climate
Climate data for selected exposure sites was directly downloaded from the National
Climate Database, CliFlo. Climate factors analysed in the present study included
ambient temperature, relative humidity (RH), rainfall and wind speed. Since field
exposures were performed mainly within two periods (November 2016 to November
2017 and July 2017 to July 2018), weather data was also processed for these two
periods separately. The 12-month average values are presented in Table 4.
Table 4. Weather at some exposure sites.
Exposure site
Climate
Period Rotorua Tauranga Whakatāne Taupō
factor Te Puke Edgecumbe Galatea
Airport Airport Airport Airport
Nov 16–
13.0 15.5 14.6 12.3 15.0 - 13.3
Temp Nov 17
(°C)
Jul 17–
13.5 16.0 15.1 12.7 ~15.6* - 13.7
Jul 18
Nov 16–
85.6 80.5 85.1 84.2 - - 81.2
Nov 17
RH (%)
Jul 17–
86.5 81.5 84.9 85.5 - - 82.6
Jul 18
Nov 16–
>1,712* 1,731 1,492 1,281 2,504 1,780 >1,235*
Rain Nov 17
(mm) Jul 17–
>1,451* 1,466 >1,380* >1074* >1,841* 1,701 >577*
Jul 18
Nov 16–
Wind 3.7 3.9 3.4 3.7 1.5 - 2.2
Nov 17
speed
(m/s) Jul 17–
3.6 3.6 3.3 3.4 1.4 - 2.2
Jul 18
* Data was incomplete during the monitoring period.
These exposure sites had some differences in their climate.
• In general, those areas close to the coast, such as Tauranga, Whakatāne and Te
Puke, had ambient temperatures higher than inland areas, such as Rotorua, Taupō
and Galatea.
• Most areas in the Bay of Plenty region had relatively high annual rainfall. For
example, Te Puke had an annual rainfall of approximately 2,500 mm.
• Wind speed was normally low as per NIWA’s analysis.
• Tauranga Airport had the highest average ambient temperatures and wind speed
but the lowest RH.
• Te Puke had a high average ambient temperature and the lowest wind speed.
Airborne pollution
Two airborne pollution monitorings were completed in the Bay of Plenty region. The
BRANZ campus at Judgeford was used as the reference location.
• First monitoring – 28 November 2016 to 21 December 2016 – H2S (25 sites), SO2
(three sites) and NH3 (seven sites).
23Study Report SR458 Atmospheric corrosivity of the Bay of Plenty region
• Second monitoring – 31 October 2017 to 28 November 2017 – H2S (32 sites), SO2
(32 sites) and NH3 (31 sites).
The average concentrations of H2S, SO2 and NH3 for an approximately 3-week
exposure period are shown in Table 5.
Table 5. Airborne pollution monitoring results (ppb).
H2S SO2 NH3
No Site
1st 2nd 1st 2nd 1st 2nd
1 Waihī Beach 0.07Study Report SR458 Atmospheric corrosivity of the Bay of Plenty region
• Rotorua Airport
• 2xx SH30, Tikitere
• 3xx SH30, Tikitere
• Lake Rotokawau Road, Tikitere
• Lakes Ranch, Rotorua
• Wai-O-Tapu
• Kawerau South
• Tamarangi Drive, Kawerau
• Onepu Spring Road, Kawerau.
H2S was detected in low concentrations at some sites that were relatively far away
from active geothermal sources or where the geothermal sources nearby were not very
active, particularly in gas emission. They included
• TECT All Terrain Park, Ngawaro – approximately 27 km northwest of Rotorua
• Rotomā, close to the Waitangi Soda Springs
• Lake Okaro – approximately 1.5 km south of the Waimangu volcanic valley which
has numerous hot springs, steaming vents and geysers powered by a large magma
dome (molten lava) approximately 2 km below the Earth’s surface
• Wairākei – the exposure site is within the Wairākei geothermal field, which resides
within volcanic strata of the TVZ, and the current surface features include steam-
heated ground, thermal micro-climates (Hall of Fame Stream, Te Rautehia Stream,
Wairākei Stream, Waipouwerawera) and thermal surface waters (Alum Lakes)
• Hewletts Road, Tauranga – the site is within the Mount Maunganui industrial area
with shipping, fertiliser manufacturing and the airport.
At some exposure sites, the H2S concentrations measured in the two monitoring
periods were different, and it was difficult to determine the presence of H2S in the air.
These sites included:
• Waihī Beach
• Katikati
• Chapel Street, Tauranga
• Tauranga Airport
• Te Puke
• Maketū
• Taupō Airport
• Galatea
• Te Teko
• Edgecumbe
• Whakatāne Airport
• Taroa Street, Whakatāne
• Ōpōtiki
• 4xx SH35, Ōpōtiki
• 1xxxx SH35, Waihau Bay
• Orete Forest Road, Waihau Bay.
Special attention should be paid to the following sites:
• Taupō Airport – H2S was detected with a concentration of approximately 0.10 ppb
in the first monitoring period. Very low concentrations were measured in the
second period. This exposure site is at the south end of the TVZ and is close to
25You can also read