The burden and cost of excess body mass in Western Australian adults and children - WA Health
←
→
Page content transcription
If your browser does not render page correctly, please read the page content below

The burden and cost of excess body mass in Western Australian adults and children
The burden and cost of excess body mass in Western Australian adults and
children

Acknowledgements
This project was conducted by the Chronic Disease Prevention Directorate and Epidemiology
Branch, at the Western Australian Department of Health. Project support and advice was
received from the Australian Institute of Health and Welfare.
Data on hospitalisations in Western Australia for renal dialysis used in this analysis have been
supplied by the Australia and New Zealand Dialysis and Transplant Registry (ANZDATA). The
interpretation and reporting of these data are the responsibility of the authors and in no way
should be seen as an official policy or interpretation of the Australia and New Zealand Dialysis
and Transplant Registry.

Thank you to the following people for their assistance and contributions:

Ms Vanessa Prescott, Australian Institute for Health and Welfare
Dr Jennifer Girschik, Mr Jag Atrie and Dr Alex Xiao, Epidemiology Branch, WA Department of
Health
Ms Julia Stone and Ms Brooke Holroyd, WA Clinical Coding Authority, WA Department of
Health

Funding
This project was funded by the WA Department of Health.

Suggested citation
Beswick AZ, Ambrosini GL, Radomiljac A, Tomlin S, Chapman AM, Maticevic J, Winstanley M,
Kirkland L. The burden and cost of excess body mass in Western Australian adults and
children. Perth, Western Australian Department of Health; 2020
Contents

Executive Summary 1
Introduction 4
 Magnitude of the problem 5
 Inequities in overweight and obesity 6
 Aims of this study 6
Background 7
 Burden of disease studies 7
 Cost of illness studies 9
Methods 10
 Overview 10
 Linked diseases 11
 Determining population attributable fractions 14
 Quantifying attributable burden in 2016 18
 Quantifying attributable burden in 2026 19
 Comparisons with other studies 22
Results 24
 Burden due to excess body mass in 2016 24
 Projected burden due to excess body mass in 2026 32
Discussion 37
 Summary of findings 37
 Implications 38
 Areas for future focus 38
 Study limitations 40
 Study strengths 41
 Conclusions 41
References 42
Appendix A: Additional methods 48
Appendix B: Additional tables 53
Glossary 55
List of Tables
Table 1. Classification of adult body weight according to body mass index (BMI) ....................... 4
Table 2. Summary of data used to calculate population attributable fractions in adults and
children. ..................................................................................................................................... 18
Table 3. Proportion of hospitalisations for a principal diagnosis of a linked disease attributable
to excess body mass in 2016. .................................................................................................... 25
Table 4. Number of attributable hospitalisations and deaths in 2015/2016 and 2026 for adults
and children under three scenarios. ........................................................................................... 26
Table 5. Attributable hospitalisation costs in Australian dollars in 2016 and 2026 for adults and
children under three scenarios. .................................................................................................. 29
Table 6. Hospitalisation costs attributable to excess body mass and ranking of linked diseases
in 2016 and 2026 for adults and children (trend scenario). ........................................................ 35

List of Figures
Figure 1.Trends in overweight and obesity in adults and children in Western Australia .............. 5
Figure 2. Chronic disease burden attributable to excess body mass, Western Australia 2011 ... 8
Figure 3. Linked diseases included in study. ............................................................................. 12
Figure 4. Weight status by age group and sex, Western Australian adults, 2016. .................... 14
Figure 5. Weight status by age group and sex, Western Australian children, 2016. ................. 15
Figure 6. Hospitalisations attributable to excess body mass by age and sex, 2016. ................. 24
Figure 7. Hospitalisation costs attributable to excess body mass by age and sex, 2016. ......... 28
Figure 8. Adult deaths attributable to excess body mass by age and sex, 2015. ...................... 31
Figure 9. Hospitalisations attributable to excess body mass in 2016 and 2026 for adults and
children under three scenarios. .................................................................................................. 33
Figure 10. Estimated hospitalisation costs attributable to excess body mass in 2016 and 2026
for adults and children under three scenarios (2015/2016 AUD). .............................................. 34
Figure 11. Adult deaths attributable to excess body mass in 2015 and 2026 under three
scenarios.................................................................................................................................... 36

List of Boxes
Box 1. Example of TMRED estimation for adults. ...................................................................... 17
Box 2. Summary of methodological developments and updated data used in this study. ......... 23
Abbreviations

ABD Australian Burden of Disease
AUD Australian dollars
AIHW Australian Institute of Health and Welfare
BMI Body mass index
DALY Disability adjusted life year
DRG Diagnosis related group
GBD Global Burden of Disease
HWSS Health and Wellbeing Surveillance System
ICD International Classification of Diseases
ICD10-AM International Classification of Diseases, 10th edition Australian modification
LCI Lower confidence interval
PAF Population attributable fraction
RR Relative risk
RSE Relative standard error
TMRED Theoretical minimum risk exposure distribution
UCI Upper confidence interval
YLD Years lost to disability
YLL Years of life lost
WA Western Australia
WHO World Health Organization
Executive Summary
Introduction
In 2018, just over 70 per cent of Western Australian adults were estimated to be living with
overweight or obesity.1 One in four Western Australian children were overweight or obese,2
placing them at an increased risk of obesity in adulthood.3, 4

Adult obesity in Western Australia (WA) has risen steadily from 21 per cent in 2002 to 32 per
cent in 2018.1 Nationally, the number of adults living with very severe obesity has increased by
nearly one-third since 2014–15.5

Excess body mass resulting from the excess accumulation of body fat increases the risk of a
range of chronic diseases and is an important cause of preventable illness and premature
death.6, 7 Excess body mass therefore incurs significant personal and societal costs. In 2011, it
was estimated that excess body mass was responsible for 5.3 per cent of the total health
burden in WA due to disability and years of life lost due to premature disease.8

To guide policy decisions for health services and public health planning, up-to-date estimates of
the burden and cost of excess body mass to the WA health system are essential.

This report applies a methodological approach based on the Global Burden of Disease Study6
and the Australian Burden of Disease Study7, 9 to describe the burden and cost of
hospitalisations in WA in 2016 and mortality in 2015 that is attributable to excess body mass.
The potential impacts of excess body mass in a decade’s time are also predicted, and an
estimate of the burden and costs that could be avoided if the prevalence of excess body mass
were to stabilise or to reduce, in comparison to the current increasing trend continuing.

This study advances the methods applied in a previous analysis of WA hospitalisation costs in
201110 by counting the impact of a greater number of diseases attributable to excess body mass
and applying updated information on the risk of chronic diseases due to excess body mass to
WA population health data. It is the first study to estimate the impact of excess body mass on
hospitalisations among both children and adults living in WA.

The costs provided in this report provide a robust estimate of direct inpatient admission costs
only. Costs from emergency department presentations, pharmaceutical costs, and outpatient
health care costs are not included. The costs estimated in this study represent a portion of the
total health system costs and do not include personal costs to individuals or costs to the
community and economy, such as labour and productivity losses.

 1
Key findings
• In 2016, 9.3 per cent of all hospitalisations for adults and children in WA were attributable to
 excess body mass and cost the WA health system $338.7 million ($AUD 2015–2016) or 6.1
 per cent of all hospitalisation costs.

• More males were hospitalised due to conditions linked with excess body mass than females
 in 2016.

• The greatest number of hospitalisations attributable to excess body mass in 2016 were for
 chronic kidney disease due to diabetes mellitus, glomerulonephritis, hypertension, and other
 causes, totalling 70,203 hospitalisations or 70.4 per cent of all hospitalisations attributable to
 excess body mass.

• The linked diseases responsible for the greatest hospitalisation costs attributable to excess
 body mass were (in decreasing order): ischaemic heart disease; obesity; osteoarthritis of the
 knee; chronic kidney disease (all causes combined); gall bladder and biliary disease; and
 diabetes mellitus, totalling $242.7 million or 72 per cent of hospitalisation costs attributable to
 excess body mass in 2016. These are predicted to remain the costliest conditions
 attributable to excess body mass in 2026, whether current trends in overweight and obesity
 remain stable, are halted, or are reduced.

• In 2015, there were 1,174 deaths attributable to excess body mass, making up 8.1 per cent
 of all deaths in WA (no deaths in children were attributable to excess body mass in 2015).

• Adult males were more likely to die at a younger age (40 to 69 years) due to conditions
 linked with excess body mass than females, in 2015.

• The majority (63.9%) of deaths attributable to excess body mass in 2015 were due to
 ischaemic heart disease (29.9%), Alzheimer’s disease and other dementias (13.1%),
 diabetes mellitus (11.2%), and chronic kidney disease due to diabetes mellitus, hypertension
 and other causes excluding glomerulonephritis (9.6%) as principal causes of death.

• If current trends in child and adult overweight and obesity continue, the number of
 hospitalisations attributable to excess body mass in 2026 is predicted to increase by 54 per
 cent. Hospitalisation costs will rise by 80 per cent, to $610.1 million.

• If current trends in child and adult overweight and obesity continue, chronic kidney disease
 (all causes combined), diabetes mellitus, osteoarthritis of the hip, liver cancer, atrial
 fibrillation and flutter, Alzheimer's disease and other dementias, and gout are each predicted
 to incur more than 100 per cent growth in hospitalisation costs attributable to excess body
 mass between 2016 and 2026. Chronic kidney disease (all causes combined) and obesity
 (as a principal diagnosis) will overtake ischaemic heart disease to incur the greatest
 hospitalisation costs attributable to excess body mass.

 2
• If the World Health Organization (WHO) target of halting the rise in overweight and obesity
 were to be achieved in WA, there would be a cost saving of $40.5 million (12%) in costs for
 associated hospitalisations in 2026 compared to costs if current trends in overweight and
 obesity continue.

• Applying a scenario whereby all adults with overweight or obesity in WA in 2016 reduced
 their body mass index (BMI) by 1 kg/m2 would translate to a cost saving of $95.6 million (or
 28%) in 2026 compared to current trends in excess body mass continuing.

• The number of adult deaths attributable to excess body mass are projected to increase by
 32 per cent (376) in 2026 from 1,174 deaths in 2015, if current trends in overweight and
 obesity continue.

• Twelve per cent (146) fewer adult deaths attributable to excess body mass are predicted to
 occur in 2026 if rises in overweight and obesity were to be halted.

• Thirty per cent (352) fewer adult deaths attributable to excess body mass are predicted in
 2026 if all adults who were overweight or obese in 2016 were to reduce their BMI by 1
 kg/m2.

Conclusions
Excess body mass is a significant contributor to hospitalisation costs and mortality in WA. If
population levels of overweight and obesity continue to climb, it is projected that the cost to the
WA health system will increase by 80 per cent in the decade between 2016 ($338.7 million) and
2026 ($610.1 million). This is an under representation of the full costs of excess body mass to
the WA health system and to individuals, communities, and the WA economy. By comparison,
significant cost savings could be made if the population prevalence of overweight and obesity
were to stabilise or reduce.

The projected burden and costs of excess body mass indicate a strong potential for return on
investments in publicly funded obesity prevention and early intervention programs, backed by
robust policies and regulatory options to support Western Australians to achieve and maintain a
healthy weight.

 3
Introduction
Excess body mass resulting from the accumulation of fat mass increases the risk of a range of
chronic diseases, including heart disease, stroke, type 2 diabetes, several types of cancer, and
is an important cause of preventable illness and premature death.6, 7 Excess body mass
therefore causes significant personal, health care, and societal costs.

Excess body mass results from sustained energy intake that exceeds the body’s requirements.
An inter-play of lifestyle, environmental, psychological, metabolic, and genetic factors
determines individual energy intake. Obesogenic environments, in which highly palatable,
energy-dense, nutrient-poor, ultra-processed foods are inexpensive, readily accessible and
heavily promoted, are a major factor in driving the rising levels of obesity in Australia and
globally.11 Owing to their ubiquitous nature, obesogenic environments promote weight gain and
make maintenance of a healthy weight challenging for whole populations.

Body mass indexi (BMI) is used to identify excess body mass in adults and children and is a
valid measure for monitoring population levels of overweight and obesity.12, 13 BMI is classified
into underweight, healthy weight, overweight, and obese categories, based on associated
comorbidity risk (Table 1).

 Table 1. Classification of adult body weight according to body mass index (BMI).
 Weight Category Adult BMI Risk of comorbidities
 Underweight
obesity as a health concern; stimulate healthcare investment in obesity management options;
improve public health efforts to prevent obesity; and increase resources allocated to obesity
management and prevention research.

Magnitude of the problem
In 2017, just over 70 per cent of Western Australian adults were estimated to be either
overweight (38.5%) or obese (32.1%).1 The prevalence of adults with obesity has risen steadily
in Western Australia (WA) from 21 per cent in 2002 to 32 per cent in 2018 (Figure 1).1
Although the prevalence of childhood overweight and obesity has not changed significantly in
WA since 2004, one in four WA children aged 5–15 years were estimated to be living with
overweight (17.6%) or obesity (6.7%) in 2018,2 placing them at an increased risk of obesity and
premature chronic disease in adulthood 3, 4 (Figure 1).

Figure 1.Trends in overweight and obesity in adults and children in Western Australia.
 100 100
 Adults 90 Children
 90
 80 80
 70.0%
 70 61.5% 70
 60 60
 50 50
 40 31.9% 40
 26.1% 24.3%
 30 21.3% 30
 20 20
 7.0% 6.7%
 10 10
 0 0
 2002 2018 2004 2018
 Obese Overweight or Obese Obese Overweight or Obese

Source: Western Australian Health and Wellbeing Surveillance Systemiii.

Across Australia, the prevalence of overweight and obesity is similar. In 2017–18, 67 per cent of
Australian adults were above a healthy weight (12.5 million people), up from 56 per cent in
1995.5 Most of this increase is due to growth in the number of adults who are obese, which has
increased from 19 per cent in 1995 to 31 per cent in 2017.5, 11 Australia-wide, at least 5.8 million
adults are estimated to be living with obesity.5, 11 The national statistics for children are similar to
those for WA, and have been relatively stable for the past decade, with approximately one in
four children aged 2 to 17 years in Australia identified as overweight (16.8%) or obese (8.1%) in
2017.11 However, the proportion of 2 to 17 year olds living with obesity grew from 7 per cent in
2011–12 to 8.1 per cent in 2017–18, equivalent to an additional 24,500 children per year.15
Nationally, the prevalence of excess body mass is highest in older age groups. In 2017-18,
78 per cent of 65 to 74 year olds were overweight or obese, placing an additional burden on the
health status and care of Australia’s aging population.5

iii
 Data sourced from successive reports from the WA Health and Wellbeing Surveillance System. Available from:
https://ww2.health.wa.gov.au/Reports-and-publications/Population-surveys

 5
Concerningly, the number of adults living with very severe obesity (BMI of 40+) is estimated to
have increased by nearly one-third since 2014–15, from 570,000 to 740,000 adults.5 The health
care costs associated with very severe obesity are estimated to be more than double that of
class I obesity (BMI 30 to 34.9).16 This includes increased demand for specialist bariatric
equipment and surgery. The number of adults undergoing bariatric surgery in WA increased
from 1,736 in 2005-6 to 3,995 in 2010–11.17 While the majority of bariatric surgery was
performed in private hospitals, the number performed in WA’s public hospitals tripled during this
period.17

Inequities in overweight and obesity
Overweight and obesity disproportionately affect the socioeconomically disadvantaged, people
living outside metropolitan areas, and Aboriginal and Torres Strait Islander Australians.5
Australians living in outer regional and remote areas have higher rates of overweight and
obesity than those living in inner regional areas and major cities.18 Australians living in areas of
greatest socioeconomic disadvantage are more likely to be overweight or obese than those
living in areas of less socioeconomic disadvantage.18 These geographical and socioeconomic
disparities in overweight and obesity prevalence are more marked among children and
adolescents.

According to the 2018-2019 National Aboriginal and Torres Strait Islander Health Survey,
Aboriginal and Torres Strait Islander adults were 1.2 times more likely to be overweight or
obese and 1.6 times more likely to be obese, than non-Indigenous adults.5, 19 Aboriginal and
Torres Strait Islander children aged 2 to 14 years were more likely to be overweight or obese
(37%) than their non-Indigenous counterparts (25%). There were even greater disparities seen
in adolescents aged 15 to 17 years, with 42 per cent of Aboriginal and Torres Strait Islander
adolescents identified as overweight or obese, including 18 per cent living with obesity,
compared to 27 per cent and 9 per cent respectively, in their non-Indigenous counterparts.5, 19

Aims of this study
The Final Report of the WA Sustainable Health Review (2019)iv observed that obesity is having
an increasing impact on Western Australians and undermining the long-term sustainability of the
State’s health system due to its contribution to chronic diseases.20 In addition to hospital and
broader health care costs, the burden of illness and premature death caused by overweight and
obesity affects quality of life for individuals, families and carers, and workplace productivity.
Given the relapsing nature of obesity and the range of chronic diseases linked with it,
monitoring its burden and associated costs is critical.

The Western Australian Department of Health (the Department) is responsible for the overall
management and strategic direction of the WA health system, and in ensuring the delivery of

iv
 The Sustainable Health Review was announced by the Government of Western Australia in June 2017. The purpose of the
Review, which published its final report in April 2019, was to inform future decisions about the way that health is managed and
delivered to ensure that Western Australians are receiving quality healthcare that can be sustained for our future generations
(page 48). (https://www.mediastatements.
wa.gov.au/Pages/McGowan/2017/06/Sustainable-Health-Review-to-position-WA-health-system-for-the-future.aspx)

 6
high quality, safe and timely health services. The Department also has a fundamental role in
disease prevention at the population level, setting strategic vision and state-wide policy, funding
population health promotion programs, and developing and strengthening partnerships for
prevention. To guide the Department’s policy decisions for obesity prevention, obesity
management and health service planning and funding, up-to-date estimates of the burden and
costs of excess body mass to the WA health system, are essential.

The aim of this study was to generate comprehensive, up-to-date estimates and projections of
the burden of excess body mass in Western Australian adults and children and its cost to the
WA health system, to help guide the Department’s policy decisions for obesity prevention and
service planning.

Background
Burden of disease studies
Burden of disease studies are used to assess and compare the fatal and non-fatal impacts of
different diseases, injuries, and risk factors on a population, using several indicators. These
indicators can be used to monitor population health, guide health planning, and estimate the
proportion of disease burden that could be prevented through the reduction of associated risk
factors (attributable burden), including excess body mass.8

Years of life lost (YLL) is a measure of premature death (fatal burden) quantified as the number
of years that death occurred before the expected lifespan calculated at the time of birth. Years
lost to disability (YLD) is the number of healthy years lost to disability (non-fatal burden) through
living with ill health due to illness or injury, weighted for disability severity.9 Disability adjusted
life years (DALYs) combines the burden from YLL and YLD, with one DALY equivalent to one
year of healthy life lost.

Comparative risk assessment methodology is used to evaluate the predicted changes in
population health which may result from modifying the population distribution of exposure to a
risk factor or a group of risk factors. This methodology has been used in the Global Burden of
Disease (GBD) Study6 and the Australian Burden of Disease (ABD) Study.7, 9

The 2016 GBD Study examined 84 behavioural, environmental and occupational factors and
clusters of risk factors including excess body mass (i.e. high BMI defined as BMI greater than
25 kg/m2), to provide a comprehensive assessment of global risk factor exposure and
attributable burden of disease between 1990 and 2016.6 It estimated that high BMI was
accountable for approximately 4.5 million (2.9 million to 6.4 million) deaths and 135.4 million
(88.6 million to 187.4 million) DALYs globally in 2016. High BMI ranked fifth among risk factors
for mortality, primarily due to the effect of high BMI on cardiovascular disease.

The Australian Institute for Health and Welfare (AIHW) ABD Study estimated that 7 per cent of
the total burden of disease and injuries (calculated in DALYs) in Australia was attributable to
overweight and obesity in 2011.7 This included disease burden attributable to excess body

 7
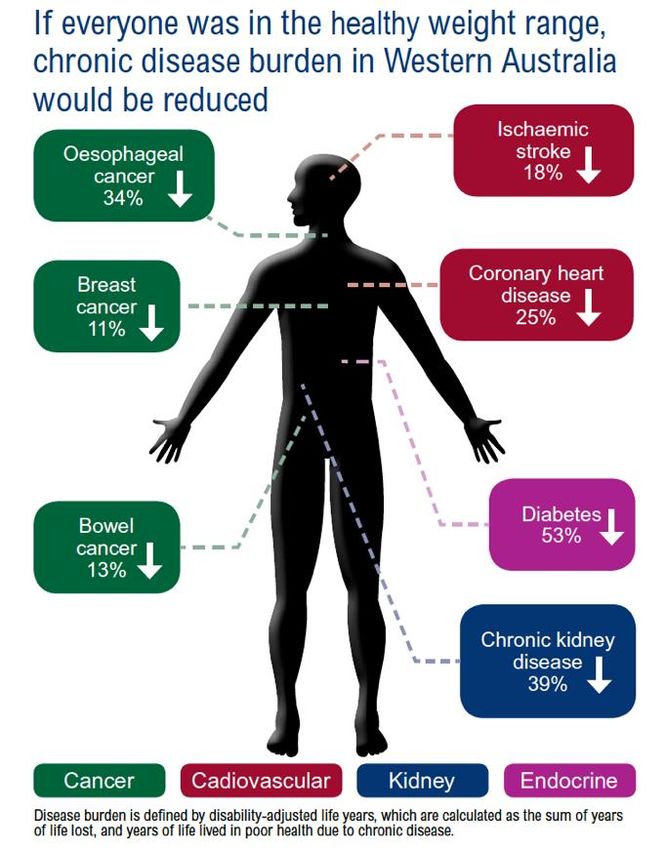
mass for 22 conditions in adults and for one condition (asthma) in children. DALYs due to
excess body mass among people living in the poorest socioeconomic circumstances were 2.3
times higher than those in the living in the highest socioeconomic group. It was estimated that 6
per cent of future disease burden due to excess body mass in adults and children in 2020 could
be avoided if there were no increases in overweight and obesity in the population and the 2011
prevalence was maintained.7

Applying the 2011 ABD Study methodology to WA, excess body mass was estimated to be
responsible for 5.3 per cent (22,998 DALYs) of the total health burden, ranked third behind
tobacco (7.9%) and alcohol (5.6%) use in 2011.8 Over half (53%) of the burden from diabetes
(types 1 and 2), 49 per cent of the burden from hypertensive (ischaemic and coronary) heart
disease, 39 per cent of chronic kidney disease burden, and 34 per cent of oesophageal cancer
burden could be avoided if everyone in WA had a healthy weight (Figure 2).

Figure 2. Chronic disease burden attributable to excess body mass, Western Australia 2011.

Source: WA Department of Health; Australian Burden of Disease Study (2011) unpublished data
supplied by the Australian Institute of Health and Welfare.

 8
Cost of illness studies
Cost of illness studies aim to evaluate and measure the economic burden of health problems on
society. These studies build on burden of disease studies and can assist more directly with
healthcare planning and in providing financial justifications for preventive interventions and thus,
are critical tools for planning and guiding health policy. Costs of illness studies are usually
limited to direct healthcare related costs such as medical costs associated with physician visits,
diagnostic tests, hospitalisations and rehabilitation. However, they can also include
comprehensive estimates of direct non-healthcare costs (e.g. costs associated with patient
transport, informal care and relocation) and indirect costs (e.g. productivity losses due to
morbidity and/or early mortality).

Based on the type of epidemiological data used, cost of illness studies can be prevalence-
based (‘top-down’ approach or population-based) or incidence-based (‘bottom-up’ approach or
person-based). Both methods have been used to estimate healthcare costs associated with
excess body mass.21 In the top-down approach, using data on the prevalence and relative risks
of obesity-associated health conditions, population attributable fractions (PAFs) are first
estimated for each health condition; these PAFS are then applied to the overall costs for these
conditions to calculate costs attributable to obesity.22 In the bottom-up approach, cross-sectional
or longitudinal datasets are used wherein individual level BMI measurements are linked to
health-related outcome datasets and/or other illness-related measures such as absenteeism;
these input units are then multiplied by the unit costs of each health input.22 The top-down
approach provides policy makers with the overall magnitude of the economic impact of the
illness to society and therefore, highlights the importance for prevention. The bottom-up
approach is a more robust method to identify individual drivers of costs, but it is more resource
intensive than the top-down approach. More recently, modelling studies have been used to
predict the projected preventable burden and costs for medical conditions attributed to excess
body mass costs for hypothetical cohorts of individuals over time.23

Several cost of overweight and/or obesity studies have been carried out in Australia. Due to
differences in the methodological approaches, including differences in the type of health status,
health outcomes and costs being evaluated, there is considerable heterogeneity in the costs
estimated in each of the studies. For example, using the top-down approach, a study conducted
by Access Economics for Diabetes Australia estimated the total direct and indirect cost of
obesity to be AUD $3.8 billion in 2005, of which AUD $873 million was borne directly by the
health system.24 Colagiuri and colleagues used the bottom-up approach and estimated that in
2005, the total direct costs (mainly hospitalisation, medication, and ambulatory services costs)
in Australia were AUD $6.5 billion and AUD $14.5 billion for overweight and obesity
respectively, among adults aged ≥30 years.25 In 2008, using updated prevalence data and a
revised methodology, Access Economics estimated total obesity-related costs to be AUD $8.3
billion in Australia with an estimated AUD $833 million in Western Australia.26 In 2015,
combining the bottom-up approach with linear modelling, Black and colleagues demonstrated
that among children aged 6 to 13 years, non-hospital Medicare costs were 28 per cent more per

 9
year per child in children who were overweight or obese compared to children with a healthy
BMI.27 It was estimated that the total cost incurred by the Australian Government was AUD $43
million per year in 2015.27

In Western Australia, using the top-down approach, the direct costs to the health care system
was estimated to be AUD $241 million (valued in 2011/2012 AUD) or 5.4 per cent of all acute
hospital expenditure in 2011.10 Through regression modelling, Scalley et al predicted that if
trends in costs, hospital admissions, and population body weight were to continue unchanged,
then acute hospital costs attributable to excess body mass would double from $241 million in
2011 to $488.4 million in 2021, an increase of 102.6 per cent.10 However, the study included
only adults aged over 30 years and the burden of excess body mass among children was not
estimated.

This study aims to estimate the burden and cost of excess body mass in Western Australian
adults and children. This study builds on the previous Western Australian study by using
updated prevalence data, inclusion of an additional 18 health conditions partially or wholly
attributable to excess body mass and using scenario modelling, to estimate a range of future
trends. The specific objectives of this study are to:

 1. Determine the hospital admissions and hospitalisation costs attributable to excess body
 mass in adults and children in Western Australia in 2016, and deaths attributable to
 excess body mass in 2015. Cause of death data were not available for 2016 at the time
 of this study.
 2. Use scenario modelling to estimate the hospital admissions, hospitalisation costs, and
 deaths attributable to excess body mass in 2026.

Methods
Overview
Hospitalisations and deaths attributed to excess body mass in adults and children in WA were
estimated in this study using an updated comparative risk assessment methodology. Scenario
modelling was used to estimate hospital admissions, hospitalisation costs, and deaths
attributable to excess body mass in 2026 under three scenarios:

 • Trend scenario: the current trend in prevalence of excess body mass in adults and
 children continues unchanged.
 • Stable rate scenario: the rise in prevalence of excess body mass in adults and children
 is halted, with the prevalence of excess body mass in 2026 remaining the same as 2016.
 • Reduced scenario: the adult population with excess body mass in 2016 reduced their
 BMI by 1.0 and these rates are maintained in 2026.

 10
The following steps were undertaken:

 1. Identification of medical conditions linked to excess body mass (linked diseases).
 2. Estimation of the population-level distribution of excess body mass (risk factor exposure)
 in the WA population for 2016.
 3. Sourcing of estimates of the effect size for the relationship between excess body mass
 and each linked disease (relative risks).
 4. Definition of the counterfactual, the theoretical minimum risk exposure distribution
 (TMRED) for excess body mass (TMRED is explained below).
 5. Calculation of the population attributable fractions (PAFs) for excess body mass for 2016,
 the study reference year. The PAF is defined as the fraction of all cases of a particular
 disease or other adverse condition in a population that is attributable to a specific risk
 factor exposure.28
 6. Application of PAFs to hospitalisations and hospitalisation costs for 2016 and to deaths
 for 2015.
 7. Projection of risk factor exposure in the WA population for 2026 for three different
 scenarios.
 8. Calculation of PAFs for 2026 for three different scenarios using projected 2026 risk factor
 exposure.
 9. Projection of hospitalisations, deaths and hospitalisation costs for 2026 and application of
 2026 PAFs to these projections for the three different scenarios.

Ethical approval for this study was granted by the WA Department of Health’s Human Research
Ethics Committee (reference number 2016/52) and the Western Australian Aboriginal Health
Ethics Committee (reference number 741), as part of the WA Burden of Disease Study ethics
application.

Linked diseases
Linked disease is the collective term used in this study to identify diseases for which there is
evidence that the probability of its occurrence is increased from exposure to excess body mass
i.e. the disease can be attributed to excess body mass. Linked diseases were included in this
study where they were partially or wholly attributed to excess body mass. The full list of linked
diseases used in this study is given in Figure 3.

 11
Figure 3. Linked diseases included in study.

 Cancer Cardiovascular
 Breast cancer Atrial fibrillation and flutter

 Colon and rectum cancer Haemorrhagic stroke
 Gallbladder and biliary tract cancer Hypertensive heart disease
 Kidney cancer Ischaemic heart disease
 Liver cancer Ischaemic stroke
 Leukaemia (various)
 Multiple myeloma Musculoskeletal
 Non-Hodgkin's lymphoma Gout
 Oesophageal cancer Low back pain
 Ovarian cancer Osteoarthritis of the hip
 Pancreatic cancer Osteoarthritis of the knee
 Thyroid cancer
 Uterine cancer

 Other
 Asthma

 Alzheimer's disease and other dementia's
 Cataract
 Chronic kidney disease (various)

 Diabetes mellitus
 Gallbladder and biliary diseases

All thirty-five diseases linked to excess body mass in the 2016 GBD Study were analysed in this
study.6 This included medical conditions for which there was convincing or probable evidence of
a causal relation between a risk factor and a health outcome according to World Cancer
Research Fund grades of evidence.6 In addition, hospitalisations and deaths where ‘obesity’
was the principal diagnosis or cause of death were included in the present study.
Hospitalisations for ‘drug induced obesity’ were excluded.

Hospitalisations with a principal diagnosis for a linked disease in 2016 were identified using the
International Classification of Disease Australian Modification (ICD-AM) 9th edition. The 2016
GBD Study used ICD-10 codes and these were adapted to the ICD-10-AM 9th edition by the WA
Clinical Coding Authority. Additional checks were completed to ensure the appropriateness of
each code and to ensure no codes for linked diseases were omitted. For the purpose of
modelling projections, the ICD-10-AM 9th to 5th editions were used to identify hospitalisations
between 2007 and 2016. To identify deaths caused by a linked disease, ICD-10 codes used by

 12
2016 GBD Study were used as there is no specific Australian modification for cause of death.
Full lists of the ICD-10 and ICD-10-AM codes used in this study are given in Table A.2.

Several other medical conditions and diseases have been linked to excess body mass, such as
infertility, depression and sleep apnoea. Relative risks for these conditions were unavailable at
the time of this study. Excess body mass is also known to increase the rates of complications
for a number of surgical procedures and medical treatments however, established methodology
on how to include this burden was not available at the time of this study and so these outcomes
are not included.

Adjustments for specific linked diseases
Renal dialysis hospitalisations were assigned to four subgroups according to their underlying
cause of chronic kidney disease (diabetes, hypertension, glomerulonephritis, and other causes),
using rates from the Western Australian subset of the Australia and New Zealand Dialysis and
Transplant Registry for 2015v. Rates of each underlying condition in those who present to
hospital and satellite dialysis-based services were determined by age and gender groups.
Condition- and age-specific relative risks for chronic kidney disease due to these four underlying
causes were then used to calculate PAFs.

Congestive heart failure is known to be increased in those with excess body mass however, in
this study it is not considered a separate disease but rather included as a consequence of other
cardiovascular diseases such as hypertensive heart disease and ischaemic heart disease.
Similarly, endometrial cancer is not included as a separate disease but is combined with the
linked disease ovarian cancer.

The 2016 GBD Study used adjusted relative risks for oesophageal cancer and included an ICD-
10 code that does not differentiate oesophageal carcinoma by morphology; this study uses the
same method.6

Evidence suggests that overweight in pre-menopausal women may be a protective factor for
breast cancer, however high BMI has been significantly associated with larger tumour size,
increased vascular infiltration, and increased risk of metastasis to axillary lymph nodes.29 In
view of the uncertainty around the impact of high BMIs on the incidence and prognosis of breast
cancer in pre-menopausal women, this study focuses on breast cancer in the post-menopausal
age group.

In this study, age groups were restricted to those 65 years and above for Alzheimer's disease
and other dementias, as in the ABD Study.7

v
 ANZ Dialysis and Transplant Registry (ANZDATA). About ANZDATA. Available from:
http://www.anzdata.org.au/v1/structure.html [accessed 20/05/2019].

 13
Determining population attributable fractions
Prevalence of excess body mass in the Western Australian population
Except for individuals with a very high muscle mass (e.g. elite athletes, body builders), BMI is a
reliable proxy for excess body fat in adults 13 and children.30

Excess body mass in adults (18 years +) was defined in this study as having a BMI of 25 or
more (Table 1).12, 16 In healthy children and adolescents, BMI changes substantially with growth
and exhibits sexual dimorphism during puberty. Age- and sex-specific BMI cut-off points were
therefore applied to enable comparisons of trends of excess body mass in children.30 Excess
body mass was defined in this study as having a BMI above the age- and sex-specific cut-off for
a healthy BMI in children (up to the age of 18 years).

The prevalence and distribution of excess body mass in adults and children in the WA
population was sourced from the Department of Health’s Health and Wellbeing Surveillance
System (HWSS), a continuous survey that has monitored the health and wellbeing of the WA
population since 2002.31, 32 Interviews are conducted via Computer Assisted Telephone
Interviews (CATI) with households selected at random from the 2013 White Pages by a
stratified random process with over-sampling representative of the population in rural and
remote areas. The HWSS is weighted to the WA population to ensure the representativeness of
survey results.31, 32 The average participation rate in 2016 for adults and children was over 90
per cent.31, 32 Adult prevalence estimates of BMI in the HWSS are calculated using self-reported
height and weight. The HWSS applies an adjustment factor to account for limitations due to self-
reporting, as described by Hayes et al.33 The prevalence of healthy weight, overweight and
obesity for WA adults in 2016 is shown in Figure 4.

Figure 4. Weight status by age group and sex, Western Australian adults, 2016.

 Healthy Overweight Obese

 16-44 years
 Female

 45-64 years

 65+ years

 16-44 years
 Male

 45-64 years

 65+ years

 0 20 40 60 80 100
 Prevalence (%)

Source: Western Australian Health and Wellbeing Surveillance System31

 14
For estimates of the prevalence of excess body mass in children, parents/carers were asked to
provide their child’s height (without shoes) and weight (without clothes or shoes). BMI was
derived from these data and individual age- and sex-specific BMI cut-offs determined by Cole et
al30 were applied to categorise children into healthy weight, overweight, or obese. Figure 5
shows the prevalence of healthy weight, overweight, and obesity in WA children in 2016, by age
group and gender.

Figure 5. Weight status by age group and sex, Western Australian children, 2016.

 Healthy
 Healthy Overweight
 Overweight Obese
 Obese

 5-9 years
 Age
 Age

 10-15 years
 10-15 years

 Boys
 Gender

 Boys
 Gender

 Girls
 Girls
 0 20 40 60 80 100
 0 20 40
 Prevalence (%) 60 80 100
 Prevalence (%)

Source: Western Australian Health and Wellbeing Surveillance System32

For the purposes of this analysis, 13 categories or increments of adult BMI were created for
each adult age and sex group. The categories were determined in the finest possible
increments from the data source. To reduce the impact of survey error, data were extracted at a
level where the majority of Relative Standard Errors (RSEs) were 25 per cent or less for each
age- and sex-specific BMI category. However, this was not always possible, and some
categories had RSEs of 25–50 per cent. Prevalence data required pooling of three years of
HWSS survey data (2015–2017) to obtain relative standard errors within an acceptable range
(
broken down further by site and subtype e.g. hip and knee osteoarthritis. Sex-specific relative
risks were available for some conditions. The availability of age-specific relative risks differed by
condition. For the majority of linked diseases, relative risks were available for 5-year age groups
starting from 20 years and up to 95+ years of age. However, for chronic kidney disease, relative
risks were only available for the age groups: 30-59, 60-69, 70-79, and 80+ years. The only
relative risk available for children at the time of this study was for asthma, and this is consistent
with other studies that have estimated the burden of excess body mass in children.7

Relative risks for adults were reported as continuous variables, so that risk could be assigned
according to graduating levels of exposure, i.e. per 5kg/m2 increase in BMI. For children,
relative risks for only two categories were used; obese and overweight.

Theoretical minimum risk exposure distribution
In this study the estimated contribution of excess body mass to hospitalisations and deaths was
calculated by comparing the observed risk factor distribution with an alternative, hypothetical
distribution (the counterfactual scenario). In their most recent studies, GBD and ABD Studies
both use a theoretical minimum risk exposure distribution (TMRED) scenario.6, 7 The TMRED is
the risk factor exposure distribution that will lead to the lowest conceivable disease burden for a
population and reflects the level of exposure where risk commences for each linked disease.7

This study focuses on attributable burden from excess body mass only and does not include
burden from low body mass, which is known to be linked to a number of diseases and medical
conditions. In this study a TMRED of 20–24.99 kg/m2 was applied. This is the exposure range at
which a person can be said to have a healthy BMI and is not at increased risk of developing
related disease.6, 34

An updated model was used to estimate the appropriate TMRED value from within this range
for each person, as used in the ABD Study.7 This model takes into account the placement of a
person’s actual BMI within the BMI distribution of the WA population. Each person’s lowest
TMRED value depends on the placement of their actual BMI within the BMI distribution of the
WA population, starting at 20 kg/m2, as this is the lowest TMRED possible.

This model assumes that a healthy BMI is a range, as opposed to a single value for the entire
population. The level of actual BMI compared to the TMRED value from within the range is used
to calculate the level of risk of hospitalisation or death for each person in the population. An
example of how TMRED is estimated, from the AIHW, is given in Box 1.7

The TMRED is used to determine which relative risks and prevalence data are used to calculate
the PAFs for adults only. A TMRED is not applied to relative risk and prevalence data for
children as only two categories are used which are assumed to be outside the healthy BMI
range.

 16
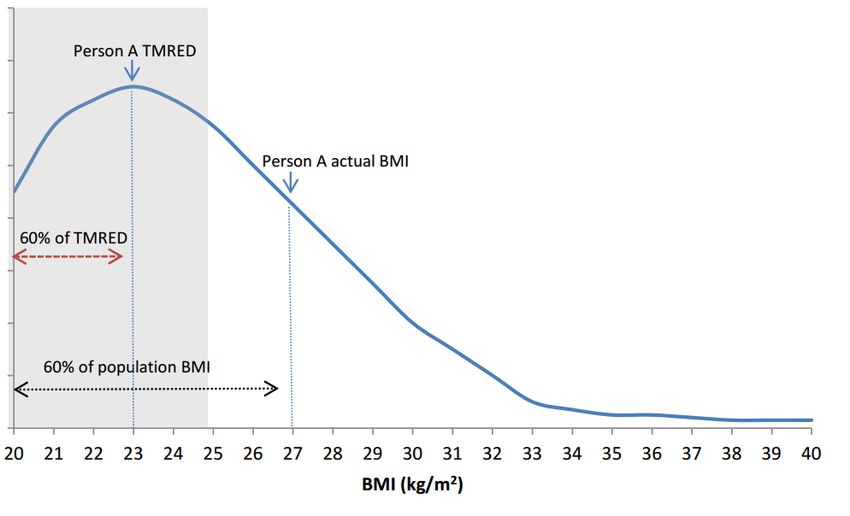
Box 1. Example of TMRED estimation for adults.

 1. Person A has a BMI of 27 kg/m 2 and this BMI is greater than 60 per cent of the population’s BMI.
 2. The TMRED value for Person A is equal to 60 per cent of the possible TMRED values from within this
 range (20–25 kg/m2) (TMRED distribution is assumed to be uniform).
 3. The TMRED for person A is then a BMI of 23.
 4. TMRED is then included as a value in the PAF calculation.

 Shaded area in figure represents the TMRED, 20–25kg/m2

Source: AIHW, 20177 (reproduced with permission from AIHW)

Calculation of population attributable fractions
The PAF is defined as ‘the fraction of all cases of a particular disease or other adverse condition
in a population that is attributable to a specific risk factor exposure’.28 PAFs can be applied to
estimates of disease burden, which may be quantified as DALYs, or as in this study, as
hospitalisations and deaths. When applied to an estimated burden, it can be used to estimate
the percentage of burden that would occur in a population due to that risk factor.

The components used to calculate PAFs for excess body mass in this study include:

 • prevalence of excess body mass in the population (P)
 • effect size, or relative risk (RR) of excess body mass on the linked disease of interest
 • theoretical minimum risk exposure distribution (TMRED)

 17
The following formula was used for the calculation of PAFs for children, where categorical data
(overweight, obese) were available:
 ( − 1)
 = x 100
 ( − 1) + 1

The following formula was used for the calculation of PAFs for adults, where continuous BMI
data were available:
 ∑ ( − 1)
 = x 100
 ∑ ( − 1) + 1

 Where: ∑ = the sum across all BMI categories and c = index for BMI category

The PAF for the linked disease ‘obesity’ was assumed to be 100 per cent. The sources used to
calculate PAFs in this study are shown in Table 2.

Table 2. Summary of data used to calculate population attributable fractions in adults and
children.
 Age group Prevalence data source Relative risk source TMRED source

 Adults Health and Wellbeing The Global Burden of Impact of overweight and
 (20–85+ Surveillance System Adults Diseases, Injuries, obesity as a risk factor
 years) 2015–2017 with 2016 as and Risk Factors for chronic conditions,
 midpoint31, 35, 36 Study 20166 AIHW 20177

 Children Health and Wellbeing Not applicable
 (5–19 Surveillance System
 years) Children 2015–2017 with
 2016 as the midpoint3, 32, 37

Quantifying attributable burden in 2016
The burden attributable to excess body mass was estimated by applying the calculated PAF for
each linked disease to the number of hospitalisations or deaths for that disease. The following
formula was used:
 =
Where:

AB = attributable burden (hospitalisation or death)
PAF = population attributable fraction for a specific linked disease
T = the total burden (total number of hospitalisations or deaths) for a specific linked disease

Attributable burden was calculated by sex and 5-year age-group for each linked disease.

 18
Hospitalisations
The number of hospitalisations for each of the linked diseases for 2016 was identified from the
WA Hospital Morbidity Data System (HMDS). This includes hospital separations (formal and
statisticalvi) from all private and public hospitals in WA. Hospital separations are referred to as
hospitalisations in this report and include hospitalisations for WA residents only. Formal and
statistical separations were not combined in this study.

Hospitalisation costs
Hospitalisation costs for linked diseases were sourced from the HMDS. Cost data included in
this dataset was estimated using Diagnostic Related Group (DRG) costs assigned to each
hospitalisation for all hospitals in WA. Hospitalisation costs for 2016 were estimated using a
constant price index for 2016 as published by the AIHW.38 For hospitals, the government final
consumption expenditure index is used.38 Indexes used for 2016 are given a value of 100 per
cent for 2015–2016 as the 2016–2017 total health price index was not available at the time of
this study.38 All costs in this report are referenced to the 2015–2016 financial year and are in
Australian dollars.

Deaths
The number of deaths for each of the linked diseases in 2015 were identified from the WA
Death Registrations database. This database includes all reported deaths in WA by calendar
year and ICD-10 code. Cause of death data were not available for 2016 at the time of this study.

Not all linked diseases result in death as an outcome. The following linked diseases were not
used in attributable death calculations: low back pain, osteoarthritis of knee, osteoarthritis of hip,
and gout. As for hospitalisations, only two linked diseases (asthma and obesity) were used to
identify deaths attributable to excess body mass in children.

Quantifying attributable burden in 2026
The projected WA population in 2026 was identified using WA Department of Planning
estimates.39 At the time of this study and following adjustments according to the 2016 Census,
band C projections (median population forecasts) were deemed to best fit the likely population
for WA in 2026.39 A number of assumptions are made in calculating these projections, including
that the current fertility, mortality, and migration trends will continue.

Hospitalisations
Hospitalisation data from 2007–2016 were used to project hospitalisations for each linked
disease by sex and 5-year age-group to the projected 2026 population using the exponential

vi
 Formal separation: The administrative process by which a hospital records the cessation of
treatment and/or care and/or accommodation of a patient. Statistical separation: The administrative process by
which a hospital records the cessation of an episode of care for a patient within the one hospital stay (AIHW).

 19
weighted moving average method.40 This technique places greatest weighting on the most
recent years of data to guide projections.

Changes to ICD-10-AM coding of diabetes mellitus in mid-2010 decreased the scope of
diabetes surveillance in WA. This decrease in surveillance was not a true reflection of diabetes
occurrence in the WA population, but rather a change to the way it was coded in the
hospitalisation data. To avoid a potential artefact, projections for diabetes mellitus were limited
to using hospitalisations from 2011 to 2016 rather than a ten-year period as for other linked
diseases.

Where the number of hospitalisations for subtypes of linked diseases was less than 5, these
were combined to increase the numbers for the calculation of hospitalisations and costs (and
deaths) where appropriate. Hospitalisations due to leukaemia were projected using all types
grouped together (acute myeloid, chronic myeloid, acute lymphoid, chronic lymphoid, and other
types) due to small numbers. This was possible as the relative risks for different types of
leukaemia were the same.

Projections to 2026 were only calculated for linked diseases with 20 or more hospitalisations a
year, to reduce instability from projecting small numbers.

Hospitalisation costs
In order to compare estimates of expenditure in different time periods (2016 and 2026), inflation
needs to be compensated for in a process known as ‘deflation’. Deflators or ‘price indexes’ can
be calculated in a number of different ways depending on the scope of the cost estimates, the
area of health care, and the analytical purposes of the estimates.

Hospitalisation costs for 2026 were estimated using cost data from 2007–2016, which was
adjusted for deflation using the government final consumption expenditure index published by
AIHW.38 As there has been positive health inflation in most years, prices in the years preceding
the reference year are assumed to be lower than those applied in the reference year, 2016.

Hospitalisation costs for 2026 were estimated using a multiple linear regression model, with
average costs modelled separately for each linked disease by sex and 5-year age group. A
number of assumptions are made using this method for cost modelling, including:

 • That the hospitalisation cost trends seen between 2007–2016 will continue.
 • That the rate of hospitalisations will continue as seen between 2007–2016.
 • That policy and economic factors stay the same.

Deaths
Death data for linked diseases from 2006–2015 were used to project deaths for linked diseases
by sex and 5-year age groups using the same methods as described for hospitalisations.
Deaths were not projected for a linked disease if there were less than 20 deaths across all age
groups for either males or females in this time period, due to the instability of projecting such

 20
small numbers. For this reason, death projections are not given in this report for: gallbladder
and biliary tract disease; asthma; thyroid cancer; chronic kidney disease due to
glomerulonephritis and hypertension; obesity; and gallbladder and biliary tract cancer. As there
were less than 20 deaths from asthma or obesity between 2006-2015 in all child age groups, no
projections were made for deaths attributable to excess body mass in children.

Projection Scenarios
Hospitalisations, hospitalisation costs, and deaths due to excess body mass were estimated for
the year 2026 under three scenarios based on varying population prevalence of excess body
mass. These scenarios were chosen to demonstrate the potential burden and cost to the WA
health system that may be avoided if the increasing prevalence of excess body mass was
halted or reduced, in comparison to if current trends continue. The projected burden and cost
for 2026 was compared with the burden and costs calculated for 2016.

Trend scenario: the current trend in prevalence of excess body mass in adults and
children continues unchanged. For this scenario, excess body mass prevalence data was
projected to 2026 using linear regression of 10 years of historical data (six years of historical
data for diabetes mellitus) and the projected population for 2026. This projection assumed that
increases in excess body mass prevalence continue at the same rate to 2026 as over the
previous ten years (2017-2016), and that current behaviours and public health interventions to
reduce excess body mass do not change and will have the same impact on the population.

Stable rate scenario: the rise in prevalence of excess body mass in adults and children is
halted, with the prevalence of excess body mass in 2026 remaining the same as 2016.
This scenario meets the World Health Organization’s Global Action Plan for the Prevention and
Control of Non-communicable Diseases target for 2025 of halting the rise in obesity 41 (extending
to those who are overweight) and aligns with the WA Sustainable Health Review target to halt
the rise in obesity in WA by July 2024.20 Under this scenario, the prevalence of excess body
mass in 2016 was applied to the projected population of 2026 to represent the effect of
maintaining the prevalence of excess body mass at 2016 levels.

Reduced scenario: if the adult population with excess body mass in 2016 reduced their
BMI by 1.0 kg/m2 and this was maintained to 2026. Under this scenario, the prevalence of
excess body mass in 2026 was estimated after reducing the BMI of every adult in 2016 who
was overweight or obese, by 1 kg/m2 and applying this to the projected population for 2026.
Children were excluded from this scenario as reductions in BMI are generally not recommended
during periods of growth.42

For each scenario, the same linked diseases were used for 2026 as for 2016 and it was
assumed that relative risks would remain unchanged between 2016 and 2026 to create PAFs
for 2026.

 21
Comparisons with other studies
There have been a number of developments in the methodology used in burden of disease
estimations for risk factors such as excess body mass. Improvements in the evidence base for
causal relationships between excess body mass and a number of diseases also means that a
more accurate estimation of disease burden can be made.

The present study uses an updated technique used in the latest GBD6 and ABD7, 9 Studies for
calculating the distribution in the population of those with the lowest risk from excess body mass
– the theoretical minimum risk exposure distribution (TMRED).7 However, the present study
differs from the GBD and ABD Studies in that:

 • PAFs were applied to linked disease hospitalisations and deaths rather than DALYs.
 • An estimation of cost of the burden of disease attributed to excess body mass was made
 using DRG hospitalisation cost data.

The methods used in the present study also differ to those applied in the 2011 analysis by
Scalley et al,10 which analysed attributable hospitalisations, including emergency department
presentations, for fewer linked diseases (18) and only in adults aged 30+ years.10

This study concentrates on direct inpatient admission costs and does not take into account
costs from emergency department presentations, pharmaceutical costs, or outpatient health
care costs.

The methodological updates applied in this study are summarised in Box 2. These variations in
methodology mean that the estimates of attributable burden from excess body mass determined
in this study are not directly comparable to the previous WA study by Scalley et al 9 or with the
GBD Study6 or ABD Studies.6, 7, 10

 22
You can also read