Minimizing the cost of integrating wind and solar power in Japan - ANALYSIS Insights for Japanese power system transformation up to 2030
←
→
Page content transcription
If your browser does not render page correctly, please read the page content below
Minimizing the cost
of integrating wind
and solar power
in Japan
Insights for Japanese power system
transformation up to 2030

ANALYSIS
Minimizing the cost of
integrating wind and
solar power in Japan

IMPRINT
ANALYSIS                                          ACKNOWLEDGEMENTS
Minimizing the cost of integrating                We would like to extend special thanks to
wind and solar power in Japan                     Keiji KIMURA (REI), Pr. Hiroshi TAKAHASHI (Tsuru
                                                  University), Craig Morris (Agora Energiewende)
WRITTEN BY                                        and Jesse Scott (Agora Energiewende) for
Agora Energiewende                                reviewing and providing valuable feedback.
Anna-Louisa-Karsch-Straße 2 | 10178 Berlin
T +49 (0)30 700 14 35-000
F +49 (0)30 700 14 35-129
www.agora-energiewende.de
info@agora-energiewende.de

IN COOPERATION WITH
Renewable Energy Institute                                       This publication is available for
11F KDX Toranomon 1-Chome                                        download under this QR code.
1-10-5 Toranomon, Minato-ku
Tokyo 105-0001, Japan
https://www.renewable-ei.org/                     Please cite as:
                                                  Agora Energiewende (2020): Minimizing the cost
AUTHOR                                            of integrating wind and solar power in Japan.
Dimitri Pescia
dimitri.pescia@agora-energiewende.de              www.agora-energiewende.de

WITH THE COOPERATION OF
Murielle Gagnebin (Agora Energiewende)
Keiji Kimura (Renewable Energy Institute Japan)
Tetsuo Saitou (Renewable Energy Insitute Japan)

Open-source modelling of
the Japanese power system:
Georg Thomaßen, Thomas Kouroughli,
Samarth Kumar (Agora Energiewende)

Proofreading: Craig Morris (Agora Energiewende)
Cover image: stra74 / Fotolia

198/07-A-2020/EN
Version 1.0, December 2020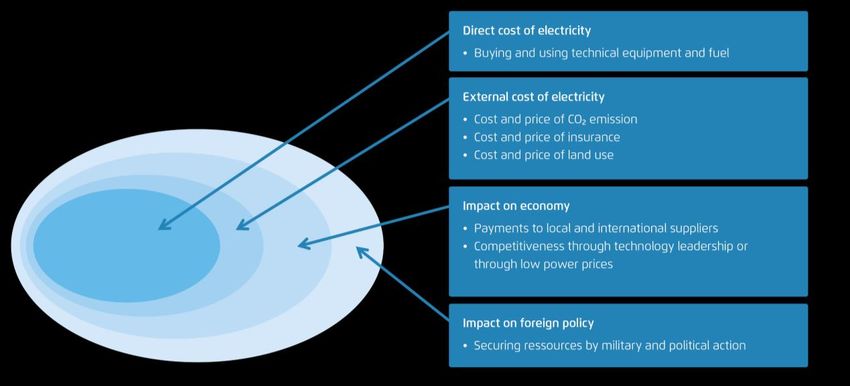
Agora Energiewende | Minimizing the cost of integrating wind and solar power in Japan

Dear reader,                                                 Yet, wind and solar power are different than con-
                                                             ventional power. They may induce additional sys-
Japan has committed to reduce its greenhouse gas
                                                             tem costs, such as for reinforcing the grid, balancing,
emissions to net zero by 2050. This pledge is a game
                                                             and variability.
changer for an industrialized nation such as Japan
and a fantastic opportunity to fundamentally change          These system costs of variable renewables some-
the Japanese energy system, which still relies heav-                                           are a hotly debated
ily on fossil fuels.                                         subject in academic and policymaking circles. With
                                                             this paper, we shed light on those controversies. We
While in Japan the costs of renewable energy are still       also offer some insights on how to quantify those in-
high compared to international standards, they are           tegration costs in Japan, and more importantly on
expected to continue their decrease. By 2025, the            how to minimize them.
generation costs of solar PV and wind energy are ex-
pected to be close to or even lower than any other           We hope to make a positive contribution to informed
sources of electricity generation. With these sharply        debate towards a renewable-based transformation
declining costs of solar PV, wind power and storage          of the Japanese energy system.
units, the transformation towards a low carbon
                                                             Yours,
economy in Japan can be massively based on renew-
                                                             Markus Steigenberger
ables and electrification.
                                                             Managing Director, Agora Energiewende

Key findings at a glance:

               Between 2025 and 2030, the cost of generating electricity (LCOE) from solar PV and wind power
               in Japan expected to be lower than from any other technologies. In 2025, the LCOE of utility-
       1       scale PV should reach about 6.3 ¥/kWh            /kWh). Onshore wind could reach those levels in
               2030. Those costs will be significantly lower than those of new fossil-fuelled power plants, com-
               parable to lifetime extensions of nuclear and far below new nuclear and CCS projects.

               Adding the                     costs for grid, balancing, and variability) on top of the LCOEs does
               not fundamentally change the competitiveness of variable renewables in 2030. Japan can reach
      2        a share of at least 45% renewables in 2030 (corresponding to a share of 35% wind and solar
               power) with integration costs below 1.5 ¥/kWh. Integrating 66% renewables (corresponding to
               50% wind and solar power) would come only at a slightly higher cost of 2 ¥/kWh.

               Integration costs for grids and balancing are well defined and rather low. These costs are esti-
               mated at below 1 ¥/kWh for Japan. Various measures exist to minimize those costs, in particular
      3        through optimal grid planning, optimised grid operation, and well-functioning and non-discrimi-
               natory intraday and balancing markets.

               Integration costs for compensating the variability of renewables are much more disputed. The
               calculation of those costs can vary tremendously depending on the assumptions. A total system
               cost approach would circumvent some of the uncertainties, in particular the controversial attrib-
               ution of system effects to specific technologies. Rather than to speak about integration costs,
      4        we should speak about interaction costs. If the system adapts to renewables (reducing baseload
               power plants), the cost of variability for integrating 50% PV and wind energy in Japan is esti-
               mated at about 1.25 ¥/kWh. If not, the costs of variability could be much higher. This finding calls
               for a refinement of energy markets design, so as to incentivize rather than to hamper flexibility.

                                                                                                                      3
Agora Energiewende | Minimizing the cost of integrating wind and solar power in Japan
1 Introduction 5
The challenge of calculating integration costs 7
2.1 Grid cost 8
2.2 Balancing cost 12
2.3 13
3 Conclusion towards a total system cost approach 18
4Agora Energiewende | Minimizing the cost of integrating wind and solar power in Japan
1 Introduction (VRE) units are more regionally distributed and sub-
ject to weather forecast errors.
Japan has committed to reduce its greenhouse gas
emissions to net zero by 2050. This pledge repre- In Japan, solar PV uptake has risen rapidly over the
sents a fundamental transformation away from fos- last seven years (62 GW installed at the end of 2019),
sil fuels over the next three decades. making the country one of the most dynamic PV
markets outside China. While the proportion of vari-
As the power system in Japan enters into a phase of able renewable energy sources (VRE) in Japan is in-
transitioning to higher shares of variable renewa- creasing it remains rather low, however, at around
bles, system planners are faced with the complexi- 10% of total electricity production. In particular, the
ties of shifting gears from a system powered by dis- development of wind energy remains very slow (4
patchable fossil-fuel or nuclear power plants to a GW installed by the end of 2019).
new system that is more environmentally friendly,
but whose output also fluctuates according to In Japan, renewables costs are still high compared to
weather conditions (as opposed to power demand). international levels, but costs are expected to con-
tinue to decrease rapidly, bringing them close to or
Figure 1: Current and future costs of electricity generation (LCOE) in Japan for various technologies
¥/kWh Other low-carbon options
35
40
30
35
25
30
20 Wind and solar 2020 2025
Fossil generation
15
10
5
0
PV 2020 PV 2025 Wind Wind 2025 Nuclear New Coal CCS CCGT gas Coal
2020 lifetime nuclear turbine power
extension plant
Source: LUT-REI-Agora (2021), REI (2020), RTS (2020), Reuters (2016), METI (2015).
The graph represents the Levelized Cost of Electricity, a metric used to compare the generation costs (¥/kWh) of different technologies,
taking into account fixed and variable costs, as well as cost of capital (WACC). The upper and lower ranges correspond to the following:
• for PV: upper range is for roof-top PV, lower range for utility scale (both 2020 and 2025);
• for wind: upper range is for offshore, lower range for onshore (both 2020 and 2025);
• for nuclear lifetime extension: the range depends on some exemplary retrofit project (upper range: Tokai-2, lower range: Mihama-3),
not taking into account plants damaged by the Fukushima accident (such as Onagawa-2, which retrofit cost is significantly higher);
• for new nuclear: upper range of costs estimates worldwide, lower range from costs evaluation by METI (2015);
• for coal CCS: upper range in 2020, lower range in 2025;
• for CCGT and coal: upper range with CO2 price of 2000 ¥/tCO2 (2025), lower range for a CO2 price of 265 ¥/tCO2 (2020).
5Agora Energiewende | Minimizing the cost of integrating wind and solar power in Japan
even below other sources of energy generation Despite this important progress, these generation
within the next few years. costs do not tell the whole story as they do not in-
clude system costs of renewables, such as the cost of
The declining costs of solar PV, wind power and the grid, variability and balancing. The question is to
storage units offer many opportunities for a low- what extent these integration costs change the
carbon transformation based entirely on renewables. equation. This paper investigates that issue, includ-
ing ways to lower those costs, with a focus on Japan.
Today, the cost of generating electricity (known as
) from Germany and several other European and North
ground-mounted solar PV in Japan is already below American grid regions have already incorporated
the cost of some nuclear lifetime extensions (such as very large shares of variable renewables in their
the LCOE for the retrofit of the Mihama-3 and To- power systems. Several challenges related to the
kai-2 power plants1), as shown in Figure 1. The costs costs of integrating variable renewables have been
are also far below those of new nuclear power plants solved in this way.
and new coal power plants with CCS. In addition, the
generation costs of onshore wind and solar power In Japan, a set of measures has also been introduced
(utility-scale as well as roof-top) should be compa- to promote renewable energy development, with
rable to or lower than those of all nuclear lifetime ex- particular emphasis on the rapid expansion of PV.
tension projects and outcompete new coal and gas
power plants somewhere around 2025, as can be In this short paper, Agora Energiewende offers some
seen in Figure 1. insights for the Japanese power system transfor-
Figure 2: Overview of possible system boundaries and types of costs and benefits
Adapted from Nuclear Energy Agency (2012): Nuclear Energy and Renewables. System Effects in Low-Carbon Electricity Systems, commis-
sioned by the Organisation for Economic Co-operation and Development.
1 REI 2019. Reuters 2016.
6Agora Energiewende | Minimizing the cost of integrating wind and solar power in Japan
mation. Emphasis is given to the feasibility of inte- nomics to compare the generation costs of different
grating at least 35% of VRE in Japan in 2030, corre- technologies. It allows a seemingly neat comparison
sponding to a share of 45% of renewables2. The im- of technologies. According to this metric, wind and
pact of higher shares (more than 50% variable solar PV have become the cheapest technologies in
renewables, corresponding to about 70% renewables several countries. Yet, LCOE does not capture system
in total) are also assessed. Some calculations per- effects and does not value the time and place of elec-
formed for this analysis rely on an open-source tricity generation two aspects that are increasingly
power system model developed and calibrated spe- important in the transition to decarbonised energy
cifically for Japan, based on the free software toolbox systems.
PyPSA. The source code as well as input and output
data can be provided on demand by the authors. There is no perfect answer for how best to compare
the costs of different power generation technologies
from an overall system perspective. The concept of
2 The challenge of calculating integration costs is one method for capturing those
integration costs specific effects and comparing different technologies
systematically.
The levelized cost of electricity generation (LCOE) is
a widely used metric in the analysis of energy eco-
Costs Grid Balancing Costs of variability*
[¥/kWh] costs costs (interaction between VRE
and other power plants)
0 2.5
¥/kWh
0.5 1.25
¥/kWh
Depending on system
adaptation, CO2 pricing
and perspective
LCOE
Cost of electricity Undisputed integration costs Disputed integration costs
2 Including hydropower, geothermal- and biomass-based
power production.
7Agora Energiewende | Minimizing the cost of integrating wind and solar power in Japan
While all power plants come with integration costs, controversies here arise from the value given to ex-
the definition and the range of those costs are con- isting power plants (value of past investments) and
tested. Different calculations yield substantially dif- from the cost attributed to externalities (healthcare
ferent results, depending not only on the specific and environment costs, cost of adapting to climate
power system and its share of renewable energy, but change, cost of a nuclear accident, etc.).
also, and perhaps more crucially, on what costs are
included, which methodology is applied and whose Under realistic assumptions, the additional costs of
perspective is considered. integrating 50 percent wind and solar PV into the
Japanese power system could be below 2 yen4 per
The most controversial element of integration costs kWh. Adding those integration costs on top of the
comes from the variability of renewables: as the out- LCOEs does not fundamentally change the competi-
put of wind and solar energy depends on the time of tiveness of variable renewables technologies, even at
day and the season, the power they generate re- very high penetration shares.
quires a more flexible operation of conventional
power plants. In short, they make baseload operation To meaningfully quantify the integration costs, the
obsolete. Existing power plants, most notably gas boundaries of the system in question need to be de-
power plants and to a lesser extent coal and nuclear fined. Most analysis consider only the direct costs of
power plants, can provide much of the needed flexi- electricity (Figure 2, inner circle) and the external
bility at low cost. Well-designed markets can costs only to the extent they are internalized
properly remunerate this flexibility. But the intro- (through, say, CO2 prices). Broader analyses consider
duction of variable renewables fundamentally external effects, macro-economic impacts, and
changes energy systems and ultimately impacts other, more far-reaching effects of power generation
their economics. But while integration costs do exist, on policy dossiers and thus on society as a whole,
one should be careful not to inflate them. such as the impact on securing foreign resources by
military and political action.
There is still no generally accepted definition of in-
tegration costs; nevertheless, they are typically de- After describing the three elements of integration
scribed as being the sum of three elements costs and recommending some pragmatic measures
(see Figure 3): to lower individual costs in transitioning to higher
1. Grid costs; shares of variable renewables in Japan, the paper will
2. Balancing costs; close by pointing towards the total system costs ap-
3. Cost of variability3. proach as a way to circumvent some methodological
challenges.
While grid and balancing costs are relatively easy to
define and determine, the effect of renewables on
variability is the sub-
ject of much debate. It seeks to put a price on the
economic effect of introducing more variable re-
newables on conventional power plants. The greatest
3 4 2020)
bles have on the other plants still needed in the system;
-up
8Agora Energiewende | Minimizing the cost of integrating wind and solar power in Japan
2.1 Grid costs Situation in Japan
Cost perimeter In Japan, the current grid management regulations
and practices are rather restrictive, leading to a low
Grid costs are the transmission and distribution net- utilization rate of grid infrastructure. Today, only
work costs related to the construction of a new 50% of the total physical capacity of the transmis-
power plant. Grid costs include investment costs, sion grid is utilized on average. The margin corre-
power losses and expenses for ancillary services. sponds to security of supply and N-1 constraints. On
This definition applies no matter what type of power some lines, such as the one from Kansai to Chugoku,
plant is connected to the system, be it a coal power this average utilization rate can fall as low as to 17%.
This situation, which could be avoided with better
plant, offshore wind farms or a rooftop solar PV sys- management measures, discriminates against new
tem. While a small rooftop PV unit in an industrial (renewables) generators that must carry a dispropor-
building that makes use of existing infrastructure tionate burden for reinforcing the grid. Furthermore,
may cause barely any costs for the grid, connecting grid reinforcement is slow, and the planning of the
an offshore wind park requires an offshore grid con- grid infrastructure is insufficiently coordinated. To
nection as well as an expansion of the transmission address this problem, the Organization for Cross-re-
grid onshore. In most cases, wind farms and ground- gional Coordination of Transmission Operators Japan
mounted solar power plants are directly connected to (OCCTO) launched a program in August 2020 to de-
the distribution grid, but a reinforcement of the velop a mid- to long-term power grid master plan.6
transmission grid (above 220 kV) may be needed in In addition, OCCTO developed the Connect and Man-
some cases5. age framework to increase the use of the existing
grid infrastructure.7
5 Several challenges remain when calculating grid costs: 7 This framework covers three main initiatives. First, a
• A distinction between grid costs and generation or probabilistic power flow modelling should help re-allocate
balancing cost is not always clear-cut; grid capacity to the various power sources, based on their
• grid costs caused by the integration of vRES must be real utilization of the grid. Second, the introduction of N-1
dissociated from grid upgrading costs that would have intertripping measures that allow grid operators to cut the
been necessary anyway; output of generators (especially renewables) in case of a
• optimised grid planning approaches and new techno- violation of the N-1 criteria. This option in return better
logical development must be taken into account; and utilizes infrastructure in normal situations without the
• average grid costs are hard to calculate as each system need to double the capacity of the lines. The benefit is ex-
and project tends to be different. The need for grid re- pected to provide about 40 GW of additional transmission
inforcement depends on the distance between renew- capacity nationwide. Third, renewable generators could be
able resources and consumption centres, as well as on -
the level of existing grid infrastructure and cross- with an excess production level of variable renewables.
border interconnection. Those new initiatives are currently being tested in some
6 The objective of the program is to identify the need for regions and are to be rolled-out in the whole of Japan by
grid reinforcement and expansion while optimising the
costs and benefits through a diversification of power sup- REI
ply, offering an opportunity to discuss the transformation (2020c).
of power grids in a future sustainable power system.
9Agora Energiewende | Minimizing the cost of integrating wind and solar power in Japan
Evaluation of current and future grid costs 1. Best case: through better management of the
grid, the average utilization rate of infra-
The cost of reinforcing transmission grid infrastruc- structure increases from the current 50% to
ture has been estimated based on modelling of the 75% in 2025 (equivalent to the EU target).
Japanese power system performed by LUT, REI and 2. Worst case: the utilization rate of the infra-
Agora Energiewende8 with higher shares of renewa- structure remains unchanged (about 50% on
bles (more than 40% in 2030, 70% in 2035 and 90% average).
in 2040) and deep electrification (to decarbonize the
heating and transport sectors). Starting from the re-
sults of this study9, an estimation has been per-
formed under two different main assumptions:
Figure 4: Transmission grid costs in high RES and electrification scenarios for Japan 2025 2050
1.0
0.9
0.8
0.7 ~40% RES
0.6
¥/kWh
0.5
0.4
~25% RES
0.3
100% RES
0.2
~70% RES
0.1 ~ 90% RES ~90% RES
0.0
2025 2030 2035 2040 2045 2050
autarcy - low grid utilization
autarcy - higher grid utilization
interconnection with mainland
interconnection with mainland and synthetic fuel imports
LUT, REI, Agora Energiewende (2021)
8 REI, LUT, Agora (2021) upcoming. costs are defined in the model based on the distance be-
tween the biggest consumption centers in each region,
9 The model considers nine Japanese regions that are inter- connection cost per GW*km and the overall line capacity
connected with a power transmission network based on For HVDC lines the costs of the AC-DC converters are also
the existing grid structure. The model considers the possi- included. It does not take into account the grids within the
bility to build additional grid interconnections, such as AC regions.
interconnection between adjacent regions, a direct sea ca- For additional information, see also Agora Energiewende
ble connection between Hokkaido and Tokyo region, or (2015), section 3.3.
DC connection from Tohoku to Hokuriku. Connection
10Agora Energiewende | Minimizing the cost of integrating wind and solar power in Japan
In addition, two variants have been investigated in and the methodology applied10. While the costs differ
the best-case scenario for 2040 to 2050: in each case, they typically amount to approxima-
Autarky: Japan is self-sufficient and all of its tively 0.15 (0.18 ¥/kWh) for solar PV and
energy demand, including synthetic fuels, is 0.5 cts/kWh (0.6 ¥/kWh) for wind power.
met by local resources.
Interconnection: 50% of synthetic fuels are In total and assuming optimized grid utilization
imported, and Japan is electrically intercon- we estimate the costs for grid reinforcement (trans-
nected with Korea and Russia. mission and distribution) at between 0.35 and 1
¥/kWh of additional wind and solar power from
The main takeaways are (see Figure 4): 2030 2045.
Reinforcing the transmission grid in Japan costs
between 0.15 and 0.65 ¥/kWh per additional
kWh of VRE from 2020 to 2050 if transmission Measures to minimize grid costs
grid utilization increases to 75% on average from
2025 onwards; Based on the experience of countries such as Ger-
Without optimized grid utilization, those costs many, a number of recommendations for Japan can
would peak at 0.9 ¥/kWh in 2030; be made to lower grid costs:
After 2030, transmission grid costs decline, as
new transmission capacities are made available, Joint grid and resource planning helps mitigate
with coal and nuclear phasing down. Early in- the impact of wind and solar PV deployment on
vestments therefore promote the integration of intraregional and interregional load flows. In-
RES up to 2045, thereby reducing RES grid costs creasing the proportion of vRES in the mix is ex-
despite an increase in the RES share; pected to reduce power line loading in some re-
From 2045-2050, the deep decarbonization of gions and increase it elsewehere. The impact of
the Japanese system induces a new increase in vRES distribution on the grid must therefore be
grid costs, especially related to the development systematically taken into account in future grid
of wind energy to the north; development plans, in order to avoid creating
International grid integration and more imports line-loading hotspots.
of synthetic fuel minimize the need for grid rein- Optimal grid planning considers punctual cur-
forcement and costs in Japan. tailment of RES. As shown in Figure 5, the cur-
tailment of about 2 3% of the annual generation
No analysis has been found for distribution grid output of a solar PV plant can reduce grid costs by
costs in Japan. However, a review of several grid ex- around 25%11;
pansion studies in Germany and in Europe reveals Incentivize investments in wind and solar PV
various estimates of distribution grid costs depend- where grids have spare capacity or can be up-
ing on the power systems, the shares of renewables, graded at moderate costs.
10 See Agora Energiewende (2015). small share is lost for the sake of lower grid costs. Figure 5
shows such an optimisation based on the feed-in data of
11 Grids that connect wind and solar PV power plants do not an individual power plant. In this specific case, curtailing
necessarily need to be designed to transport the maximum solar feed-in at 75 percent of rated capacity leads to a
power output because there is no guarantee that the plant curtailment of only 3 percent of potential generation.
would actually produce at maximum output during the Thus, while grid costs may be reduced by 25 percent, gen-
hour of highest demand. A cost-optimal grid design for eration costs are increased by only 3 percent.
wind and solar PV power plants might look at the total
costs of generation and grid connection and accept that a
11Agora Energiewende | Minimizing the cost of integrating wind and solar power in Japan
Figure 5: Cost effects of curtailing maximum in-feed of solar power
*Based on data of a solar power plant located in southern Germany, provided by EEG TU Wien and available at:
http://portal.tugraz.at/portal/page/portal/Files/i4340/eninnov2014/files/lf/LF_Hartner.pdf
Grid planning and operation should follow the also help minimize grid congestions. Costs for re-
so-called GORE principle: Grid Optimisation dispatch and curtailment should be socialized
prior to grid Reinforcement prior to grid Expan- among electricity consumers.
sion. Several short-term and mid-term measures Encourage wide consultation around grid plan-
safely optimize or reinforce the capacity of exist- ning, as well as independent power system stud-
ing lines, in particular the use of dynamic line ies on topics such as congestion management,
rating and the introduction of high temperature, adequacy, market integration, operational plan-
low sag power line conductors (HTLS). In addi- ning adaptation, connection requirements, and
tion, preventing overloads on specific lines may system defense.
be achieved by means of active power flow con- Design grid codes to enable high shares of wind
trol (such as phase shifting transformers)12. and solar power and fault ride-through capability
Where infrastructure development lags behind and voltage support.
the growth of renewables, curtailment of renew- Improve grid operation using regulated distribu-
ables in system operation should be used only as tion transformers that improve distribution grid
a measure of last resort. In case of congestion, voltage support and allow for larger feed-in
conventional power plants should be redis- without exceeding voltage limits.
patched first. Grid-relevant storage units can The right incentives encourage innovation and
awarding smart technologies and cost-efficient
investments.
12 For a review of existing technical solutions, see Agora En-
ergiewende (2018).
12Agora Energiewende | Minimizing the cost of integrating wind and solar power in Japan
2.2 Balancing costs Evaluation of current and future costs
Cost perimeter No analysis has been found for balancing costs in Ja-
pan. However, many studies have assessed the bal-
Balancing costs concern deviations between actual ancing costs for integrating wind and solar power in
generation and forecast generation. Balancing power other power systems.15 Those results are sufficiently
is used to keep the demand-supply balance at any robust and could also be applied to the Japanese situ-
given moment to ensure frequency stability (50 Hz ation. In power systems with mostly thermal power
in East Japan or 60 Hz in West Japan). Unbalanced plants, balancing costs are estimated to be between 0
frequency deviations can cause severe damage de- and 0.6 cts/kWh (0.75 ¥/kWh) per kWh of VRE,
stroying, say, rotating machines such as generators. even at wind penetration rates of up to 40 percent. In
Germany, they are currently around 0.2 cts/kWh
Wind and solar power production depends on the (0.25 ¥/kWh). In power systems with significant
weather and, unlike conventional generation, can shares of flexible generation, such as the Nordic re-
only be forecast, not controlled (save by means of gion, balancing costs can be even lower.
curtailment). Reserves are thus required to offset the
errors incurred in forecasting. The costs of activat- A closer look at the balancing market development in
ing reserves are borne by the producers, sellers and Germany reveals that several factors may have a
consumers that cause the imbalance. Obviously, the significantly larger impact on balancing cost than
occurrence of such deviations depends on the level the integration of renewable energy. Indeed, as can
of renewables, the quality of the forecast and the be seen in Figure 6, combined wind and solar power
time horizon for which the forecast is made.13 doubled from 2011 to 2017, but the amount of capac-
ity reserved for balancing power has declined by 50
percent.
Situation in Japan
Besides better forecasts, several market design fac-
Japan has gradually introduced market mechanisms tors might have driven this development:
to balance supply and demand at lower costs.14 A full balancing markets have become more competi-
market-based balancing mechanism is due to com- tive, which encouraged more actors to provide
mence operation in 2021. Ahead of this schedule, the balancing power, thus lowering prices;
regions Kansai, Chubu and Hokuriku have already cooperation between transmission system oper-
started a cross-regional balancing mechanism for ators has improved, increasing the size of the
tertiary reserves in 2020. balancing area;
the liquidity of the intraday market has in-
creased; and
margins on spot markets have decreased, chang-
ing opportunity costs for thermal plants.
13 While forecast errors are likely to be significant when 14 Balancing mechanism based on planned generation, de-
made over a period of several hours or a day, they are mand levels, and the hourly intraday market.
likely to be close to zero if made over a period less than an
hour. 15 For a review of some studies, see Agora Energiewende
(2015).
13Agora Energiewende | Minimizing the cost of integrating wind and solar power in Japan
Measures to minimize balancing costs in Japan
Figure 6: Balancing reserve development in
Designing an efficient market framework enabling Germany since 2011
flexibility will be key to minimize the balancing
costs in Japan. +110%
Wind & solar
Some key design elements of intraday and bal- generation
(69TWh)
ancing markets risk distorting wholesale power
price signals, as do imbalance settlement rules,
-50%
thereby increasing the cost of providing flexibil- Ex-post sizing
ity. Key market design elements therefore need to FRR (8000MW)
-
be adjusted in all market segments, requiring -55%
continuous political momentum to coordinate ef- -Balancing
energy
forts regionally. On balancing markets, small (750GWh)
minimum bid sizes and short contracting periods 2011 2012 2013 2014 2015 2016 2017
would be required.
Source: Hirth & Koch (2019)
In addition, the market design must allow de-
mand side response and renewables to partici-
pate. A regulatory framework enabling inde-
pendent aggregation should also be implemented 2.3 Effects of renewables on conventional
to fully tap the flexibility potential. power plant use (
Intraday markets are critical for integrating wind
and solar, as they allow for trades responding to Cost perimeter
updated generation forecasts. As in Europe, re-
newables generators should have balance re- The most controversial and complex aspect of dis-
sponsibility (potentially through third-party ag- cussions surrounding integration costs is the effect
gregators). This requirement provides a strong of wind and solar power on the remaining power
incentive to develop better forecasts and increase plant fleet.
liquidity significantly on the intraday market.
Cross-regional intraday trading also needs to im- When introducing additional capacity (whatever the
prove efficiency and enhance liquidity. Thus, technology), the output and revenues of other power
harmonized rules within Japan and improved im- plants tend to decline. However, because wind and
plicit cross-border allocation methods are solar power depend on the weather, their output is
needed, such as improved continuous trading or neither constant nor specifically tailored to electric-
intraday auctions. ity demand. Consequently, other power plants and
storage units still need to provide capacity when
there is no wind or sun to ensure the adequacy of the
system. Wind and solar power also alter the struc-
ture of remaining demand (the residual load 16),
16 The residual load is defined as the total demand minus the
generation of variable renewables during each hour of the
year.
14Agora Energiewende | Minimizing the cost of integrating wind and solar power in Japan
which now follows different temporal patterns over this effect is framed ultimately reflects a political
the day and year. choice.
As a result, the remaining conventional power fleet From a technical point of view, most conventional
will be used differently and less frequently. In other power plants can be operated flexibly. Gas power
words, a power system featuring high shares of vari- plants are typically the most cost-effective flexible
able renewables incentivizes a different cost-effec- power plant technologies. But even nuclear and coal
tive portfolio of power plants: power plants running power plants, usually considered for baseload pur-
fewer hours per year (so-called mid-merit and peak poses only, can be operated flexibly without costly
load capacities) will be of greater value to the overall redesign and significant losses in efficiency (see An-
system than baseload power plants. Furthermore, nex 1 Flexible operation of conventional power
conventional power plants will need to adjust their plants). In Japan, however, nuclear power is not al-
output more dynamically and provide more opera- lowed to modulate; in period of high renewables in-
tional flexibility,17 responding to the changes in var- feed, it usually runs at full output, leading to higher
iable energy production. The effects of renewable RES curtailment.
variability can also be captured from the perspective
of a drop in the market value of renewables18. It then From an economic point of view, however, existing
represents the opportunity costs of matching varia- capital-intensive power plants (designed for a world
ble generation and load profiles through storage. without renewables) are at a disadvantage once re-
newables are introduced into the system. Power
We are witnessing a paradigm shift from an energy plants run fewer hours, leading to higher specific
system that puts a premium on baseload capacity to costs of invested capital and higher average genera-
one that values flexibility. tion costs. Earnings are reduced, and investors may
no longer recover their investment costs a typical
This aspect of economic efficiency is just one lens s. On the other
through which to look at the reduced use of existing hand, the economics of existing mid-merit or peak-
assets, however. It is also possible to assess the re- ing power plants may remain practically unaffected
duced utilization through the lens of greenhouse gas by increasing shares of renewables.
emissions: more renewables results in CO2-emitting
conventional power plants running fewer hours per The increase in specific generation costs [¥/kWh] of
year. Depending on whether one takes the point of residual generation (i.e. the non-renewable genera-
view of the environmentally concerned citizen or the tion) of the system is sometimes used as a metric to
disadvantaged investor, the reduced utilization can calculate the cost of variability. But this approach is
be regarded either as positive or negative. The way disputed by experts because it attributes some cost
components specifically to renewables. In addition,
17 Operational flexibility is defined by the overall bandwidth lowering remuneration from the market. When the re-
of operation from minimal to maximum load. The ramp newables resources are scarce (night, low wind), however,
rate indicates the speed by which net power feed-in can prices spike on the market, but renewables cannot benefit
be adjusted; the start-up time is needed to attain stable from those high prices, as they usually do not produce
operation from standstill. during those hours. Overall, the remuneration of variable
renewables is therefore lower than average market prices.
18 - -NEA This market-value approach reflects the marginal value of
(2020). During windy and sunny hours, variable renewa- electricity at different moments in time. In a system at
bles power plants produce simultaneously at zero mar-
ginal costs, thereby reducing wholesale market prices and of value can be proven to be equivalent.
15Agora Energiewende | Minimizing the cost of integrating wind and solar power in Japan
integration costs vary significantly from one system well as with the potential growth of wind power, the
to another depending on the existing power plant rest of the power system requires demand response,
structure, storage capacities, the flexibility of the flexible generation capacities, smart grids and stor-
demand and renewable resources. They also depend age technologies reflecting the need for enhanced
on the way externalities (such as CO2 costs) are in- flexibility. Electricity markets must be designed to
ternalized. support market actors that provide flexibility op-
tions by means of shorter-term electricity markets
Within research and policymaking circles, there has and products (such as intraday trading) and by ad-
been debate whether or not those integration costs justing balancing power arrangements. These
can and should be attributed to new capacities (such changes facilitate the efficient integration of renew-
as wind and solar power plants). While some argue ables into the power system and help avoid wasteful
that the costs for system adaptation are caused by renewable energy curtailment.
the technologies that necessitate the adaptation,
others argue that system adaptation inherently oc- Japan has made some encouraging progress in this
curs in power systems and thus cannot be directly regard, with the introduction of day-ahead and in-
attributed to specific technologies. The basic ques- traday markets. Those market segments have gained
tion is whether the reduced profitability of existing relevance, in particular since the introduction of
power plants is the fault of new entrants or of a spe- gross bidding in 2017. Today, about 35% of total elec-
cific power plant inflexibility . tricity sales are traded on the day-ahead and intra-
day markets.19
The power system will not be transformed overnight.
Renewables are integrated at a rate of a few percent In 2019 and 2020, new market segments were de-
20
each year; the rest of the power system has time to ,
adapt. The integration will occur in the context of a capacity remuneration mechanism, and an elec-
other developments such as power-plant closures (or tricity futures market. However, those market seg-
reinvestment needs) and structural changes in the ments were not designed to provide more system
demand for more electrification (such as electric ve-
hicles and heat pumps). suggest that Japan is still far from the needed para-
digm shift. Discussions are also ongoing for the in-
troduction of a balancing market in 2021.
Situation in Japan
The economics of flexible power system operation is
significantly influenced by market design and re-
muneration options. If Japan is to achieve a low car-
bon, competitive and secure power system, a refined
market design that stresses increased system flexi-
bility is essential.
With the rapid increase of solar power all over the
country, and especially in areas such as Kyushu, as
19 REI (2020c), p.26 20 The baseload market forces incumbents to sell part of their
nuclear, coal and hydro production at fixed prices re-
flecting historic costs - to the new entrants.
16Agora Energiewende | Minimizing the cost of integrating wind and solar power in Japan
Figure 7: Cost of variability (¥/kWh) for different evolution of the Japanese power system
4
3.5
3
cost of variability (¥/kWh)
Legacy coal and nuclear restart - 0
EUR/tCO2
2.5
Legacy coal and nuclear restart -
50 EUR/tCO2
2
Power mix adaptation - 0
1.5
Legacy coal and nuclear capped -
1 0 EUR/tCO2
Power mix adaptation - 80
0.5
0
0% 10% 20% 30% 40% 50% 60%
Share of variable renewables (wind and solar power)
Agora Energiewende, 2020
Evaluation of the cost of variability in Japan Several CO2-price levels were also investigated: 80
2 (~10 ¥/tCO2 2 (~6 300 ¥/tCO2)
We calculated the cost of variability in Japan using 2 .
the PyPSA open-source model, that we calibrated for
Japan (dispatch and investment model up to hourly
resolution for the 9 grid regions of Japan)21. Differ-
ent scenarios were investigated:
Legacy coal and nuclear restart: existing coal
power plants that are profitable are kept in the
system. The whole nuclear fleet restarts;
Legacy coal and nuclear capped: existing coal
power plants that are profitable are kept in the
system. Only the nuclear power plants already
running (or about to restart) are kept in the sys-
tem;
Power mix adaptation: coal and nuclear power
are phased-out by 2030.
21 The python scripts, as well as the input and output data
can be obtained upon request.
17Agora Energiewende | Minimizing the cost of integrating wind and solar power in Japan
As described above, the cost of variability22 is an at- Lower or
tempt to measure how renewables affect the eco- efits could result if there were more flexible
nomics of the remaining part of power systems: with system adaptation, lower capital costs or a high
VRE, the utilisation of thermal generators declines, valuation of external costs imperfectly reflected
but they are still needed to guarantee adequacy. in market prices.
The main findings are:
The cost of variability depends strongly on how Measures to minimize the cost of variability in
the power system adapts to renewables, as well as Japan
on how externalities (CO2) are priced;
A calculation based on the Japanese power sys- The Japanese power markets must be refined to
tem shows that the cost of variability of integrat- maximize the provision of flexibility and facilitate a
ing 50% variable renewables23 in Japan reaches shift towards less baseload and capital-intensive
about 1.25 ¥/kWh if the power system adapts to technologies and more mid-merit and peaking
renewables (no more baseload power plants coal plants.
and nuclear - shift to gas power plants) and if ex- The priority should be to refine market rules,
ternalities are priced at ¥/tCO2 at least; structure and governance in order to provide
If the power system does not adapt and baseload flexibility at lower cost. Indeed, despite good pro-
technologies remain in the system (high coal and gress in the liberalization process in Japan, oli-
nuclear restart), the cost of variability could be gopolistic structures prevail, and several barriers
much higher, reaching up to 3.5 ¥/kWh for the exist that still hamper proper competition and
same share of variable RES. This is also true for flexibility provision24;
systems with no pricing of externalities A reformed energy-only market is a no-regret
(0¥/tCO2); option. Making the energy-only market faster
The difference between those scenarios shows (shorter products, trading closer to real-time) and
that the cost of variability is not inherently larger (cross-regional integration) is crucial to
caused by renewables, but rather is a conse- meeting flexibility challenges;
quence of how renewables interact with the rest Further integrating short-term markets across
of the power system. Rather than to speak about regions and vertically linking the different seg-
integration costs, we should speak about interac- ments (day-ahead, intraday and balancing mar-
tion costs; kets) can reduce flexibility requirements, allow-
These calculations exclude flexibility in demand ing markets to better reflect the real-time value
patterns and new electrification uses, which of energy and balancing resources.
lower the cost of variability;
22 The cost of variability is defined here as the increased 23 Corresponding to a share of about 60% renewables, in-
specific generation cost of the non-renewables part of the cluding hydro, geothermal and bioenergy.
system due to higher shares of renewables. The cost dif-
ference (with VRE and without VRE) is divided by the 24 For an in-depth assessment of the current power markets
added VRE. Mathematically, it can be expressed as follow: structure in Japan and recommendations for its restructu-
(Cost of conventional power with high VRE shares Cost ration, see REI (2020c)
of conventional power without VRE shares) / added VRE.
For an in-depth discussion about this methodology, see
Agora (2015), in particular section 2.4.
18Agora Energiewende | Minimizing the cost of integrating wind and solar power in Japan
Baseload and capacity markets should be re- through new market design practices and state-of-
formed to reduce inflexibilities and ensure com- the art grid planning.
pliance with decarbonization objectives. While
the baseload market was introduced to improve This short analysis found that the additional cost of
competition, its attractiveness is low. integrating 35 percent wind energy and solar PV into
The capacity remuneration mechanism was in- the Japanese power system (corresponding to more
troduced to guarantee resource adequacy (the re- than 45% renewables in 2030) could reach about 1.5
sults of the first pilot central auction were an- ¥/kWh. Integrating 50% wind energy and solar PV,
nounced in September 2020). With increasing corresponding to a share of about 66% renewables in
shares of variable renewables, security of supply 2035, would come only at a slightly higher cost of 2
will increasingly become a dynamic issue. Future ¥/kWh.
capacity mechanisms if any - will need to focus
not only on the quantity of capacity, but also on Once again, the costs of integrating renewables into
operational capabilities. This change would min- a power system depend on several issues, including
imize price spillover effects of capacity mecha- not only the specifics of a given power system, but
nisms to energy-only markets while also foster- also, and perhaps more crucially, on the perspective
ing greater reliability at lower costs. In addition, considered, the applied methodology, the future de-
the mechanism should be compliant with decar- velopment of the power system and the underlying
bonization objectives: CO2 emission performance market design.
standards (or similar mechanisms) should there-
fore be introduced into the auction design. Finally, the concept of integration costs poses meth-
In the upcoming evaluation and refinements of odological challenges, including a clear delineation
those market segments, legislators and regulators between the elements that constitute it. A total sys-
should perform flexibility and decarbonization tem costs approach, assessing the total costs of the
compliance checks to abate inflexibilities wher- power system under different scenarios, would cir-
ever possible and promote instruments in line cumvent some, though not all, of the uncertainties
with decarbonization objectives. associated with integration costs. In particular, this
total system cost approach avoids the controversial
attribution of system effects to specific technologies
3 Conclusion towards a total system (cost causation). The approach could be better suited
costs approach to support political decision-making, which needs to
consider big-picture issues rather than cost alloca-
Thanks to decreasing technology costs, wind and so- tions within a particular energy mix.
lar power are becoming the most affordable ways to
generate electricity even in Japan and thus will in- Beyond being a neat methodological solution to some
evitably play a major role in the decarbonization of of the problems described above, a total system costs
the energy system. One question is, however, still approach acknowledges that society as a whole must
raised frequently: what about the integration costs of bear the costs of the power system, regardless of the
wind and solar power? Germany has reached a share definition of elements or the form of redistribution.
of about 25% wind and solar power in 2019, and the The total system approach is also open to ex-ante
integration costs have so far been negligible. Inte- considerations, such as stipulations that the energy
gration costs can be kept low while the power plant be
fleet and the demand pattern are gradually adapted treated as a must-have. Further steps towards this
goal can then be identified.
19Agora Energiewende | Minimizing the cost of integrating wind and solar power in Japan
20Agora Energiewende | Minimizing the cost of integrating wind and solar power in Japan
The flexible operation of conventional power plants suitable design, regular maintenance and sound op-
is a major source of flexibility in all power systems. eration skills. But safety concerns and technical is-
sues prevent a high degree of flexibility in the last
From a technical point of view, most conventional phase of each fuel cycle.
power plants can be operated flexibly. Gas power
plants are typically the most cost-effective flexible Experience in both Denmark and Germany shows
power plants. But even nuclear and coal power that aging hard-coal fired power plants as well as
plants, usually considered for baseload purposes some lignite-fired power plants can provide signifi-
only, can be operated flexibly without costly rede- cant operational flexibility, as can be seen in Figure
sign and significant losses in efficiency. 6. They can adjust their output every 15 minutes, and
even every 5 minutes, to compete on intraday and
In the case of nuclear power, the French power sys- balancing markets.
tem shows that modern reactors can follow loads,
thereby provide significant operational flexibility A state-of-the-art hard coal power plant can oper-
for the system. For instance, the Civaux reactor, in ate at minimum load levels of 25 40 percent of nom-
operation since 1997, can decrease its output to 20 inal load. There are numerous technical ways to in-
percent of its maximum load, up to twice a day. More crease the flexibility of existing coal power plants
flexibility can be created for new reactors through
Figure 8: Power generation from nuclear, hard coal and lignite power plants and demand in
Germany, 23 to 30 March 2016
Agora Energiewende (2017): Flexibility in thermal power plants, with a focus on existing coal-fired power plants.
21Agora Energiewende | Minimizing the cost of integrating wind and solar power in Japan
even further25; in Germany, for example, minimum But this operational flexibility puts greater strain on
load levels of 12 percent have been achieved. Tar- power plant components, resulting in shorter life-
geted retrofit measures have been implemented in times and higher operation and maintenance costs.
practice on existing power plants, leading to higher Because coal is and will remain the least climate-
ramp rates, lower minimum loads, and shorter start- friendly energy source, the flexible operation of coal
up times. Other important enabling factors include power plants can only be a temporary solution any-
the adoption of alternate operation practices along way one that enables countries with high shares of
with rigorous inspection and training programs. coal to add more wind and solar power to the system.
In these systems, however, carbon pricing will still
be necessary to achieve a substantial net CO2 reduc-
tion.
25 See Agora Energiewende (2017): Flexibility in thermal
power plants, with a focus on existing coal-fired power
plants.
22Agora Energiewende | Minimizing the cost of integrating wind and solar power in Japan
Agora Energiewende (2015). The integration costs of Reuters (2016). Japan agrees second nuclear reactor
wind and solar power. An overview of the debate on life extension since Fukushima. November 2016.
the effects of adding wind and solar photovoltaic Reuters.
into power systems.
RTS (2020). Japan's carbon neutral pledge and PV
Agora Energiewende (2018). Toolbox für die Strom- market forecast 2030/2050. webinar material. Sep-
netze. Agora Energiewende, Januar 2018. tember 2020. RTS corporation.
Hirth & Koch (2019). Short-term electricity trading
for system balancing: An empirical analysis of the
role of intraday trading in balancing Germany's elec-
tricity system. Christopher Koch, Lion Hirth. 2019.
IEA, NEA (2020). Projected Costs of Generating
Electricity 2020. International Energy Agency and
Nuclear Energy Agency.
LUT, REI, Agora (2021).
system. January 2021. LUT University. Renewable
Energy Institute, Agora Energewiende.
METI (2015). Report on Analysis of Generation
Costs, Etc. for Subcommittee on Long-term Energy
Supply-Demand Outlook (May 2015). Ministry of
Economy, Trade and Industry.
REI (2020). Nuclear Power Decline in Japan. Romain
Zissler, Masaya Ishida (July 2020). Renewable En-
ergy Institute Japan.
REI (2020b). Proposal for 2030 Energy Mix in Japan.
Summary (September 2020). Renewable Energy In-
stitute Japan.
REI (2020c). Recommendations for Power System
Restructuring. October 2020. Renewable Energy In-
stitute Japan.
23Publications by Agora Energiewende
IN ENGLISH
Breakthrough Strategies for Climate-Neutral Industry in Europe (Summary)
Policy and Technology Pathways for Raising EU Climate Ambition
A Clean Industry Package for the EU
Making sure the European Green Deal kick-starts the transition to climate-neutral industry
Towards a Climate-Neutral Germany (Executive Summary)
Three Steps for Achieving Climate Neutrality by 2050 and an Intermediate Target
of -65% in 2030 as Part of the EU Green Deal
#1 COVID-19 China Energy Impact Tracker
How is the pandemic reshaping China’s energy sector?
How to Raise Europe’s Climate Ambitions for 2030
Implementing a -55% Target in EU Policy Architecture
Recovering Better!
Climate Safeguards for the proposed EU’s Proposed 1.85 trillion Euro 85-Trillion-Euro Budget
EU-China Dialogue on Green Stimulus Packages
Summary of a High-Level Discussion on 23 June 2020
Dual-Benefit Stimulus for Germany
A Proposal for a Targeted 100 Billion Euro Growth and Investment Initiative
Making the Most of Offshore Wind
Re-Evaluating the Potential of Offshore Wind in the German North Sea
Supporting the Energy Transition in the Western Balkans
The German Power Market: State of Affairs in 2019
State of Affairs in 2019
The Liberalisation of Electricity Markets in Germany
History, Development and Current Status
A Word on Low Cost Renewables
The R
enewables Breakthrough: How to Secure Low Cost Renewables
24Publications by Agora Energiewende
IN GERMAN
Sofortprogramm Windenergie an Land
Was jetzt zu tun ist, um die Blockaden zu überwinden
Klimaneutrales Deutschland (Vollversion)
In drei Schritten zu null Treibhausgasen bis 2050 über ein Zwischenziel
von -65% im Jahr 2030 als Teil des EU-Green-Deals
Wie passen Mieterschutz und Klimaschutz unter einen Hut?
Wie weiter nach der EEG-Förderung?
Solaranlagen zwischen Eigenverbrauch und Volleinspeisung
Akzeptanz und lokale Teilhabe in der Energiewende
Handlungsempfehlungen für eine umfassende Akzeptanzpolitik
Zwischen Rekordhoch und Abschaffung: Die EEG-Umlage 2021 in Zeiten
der Corona-Krise
Der Doppelte Booster
Vorschlag für ein zielgerichtetes 100-Milliarden-Wachstums- und Investitionsprogramm
Auswirkungen der Corona-Krise auf die Klimabilanz Deutschlands
Eine Abschätzung der Emissionen 2020
Die Ökostromlücke, ihre Strommarkteffekte und wie die Lücke gestopft werden kann
Effekte der Windkraftkrise auf Strompreise und CO2-Emissionen sowie Optionen, um das 65-Prozent-Erneu-
erbare-Ziel 2030 noch zu erreichen
Die Energiewende im Stromsektor: Stand der Dinge 2019
Rückblick auf die wesentlichen Entwicklungen sowie Ausblick auf 2020
Klimaneutrale Industrie
Schlüsseltechnologien und Politikoptionen für Stahl, Chemie und Zement
Charta für eine Energiewende- Industriepolitik
Ein Diskussionsvorschlag von Agora Energiewende und Roland Berger
Dialog „Energiewende und Industriepolitik“
Abschlussbericht
All publications are available on our website: www.agora-energiewende.de
25198/07-A-2020/EN
Agora Energiewende develops evidence-based
and politically viable strategies for ensuring
the success of the clean energy transition in
Germany, Europe and the rest of the world.
As a think tank and policy laboratory we aim
to share knowledge with stakeholders in the
worlds of politics, business and academia while
enabling a productive exchange of ideas. Our
scientifically rigorous research highlights prac-
tical policy solutions while eschewing an ide-
ological agenda. As a non-profit foundation
primarily financed through philanthropic dona-
tions, we are not beholden to narrow corporate
or political interests, but rather to our commit-
ment to confronting climate change.
This publication is available for
download under this QR code.
Agora Energiewende
Anna-Louisa-Karsch-Straße 2 | 10178 Berlin
P +49 (0)30 700 14 35-000
F +49 (0)30 700 14 35-129
www.agora-energiewende.de
info@agora-energiewende.de
Agora Energiewende is a joint initiative of the Mercator Foundation and the European Climate Foundation.You can also read