ECAMED: a Technical Feasibility Study for the Implementation of an Emission Control Area (ECA) in the Mediterranean Sea - Ministère de la ...
←
→
Page content transcription
If your browser does not render page correctly, please read the page content below
ECAMED: a Technical Feasibility Study for
the Implementation of an Emission Control
                Area (ECA)
        in the Mediterranean Sea

                 synthesis report – January 11 t h , 2019

                                 Ineris,
    French national institute for industrial environment and risks,
        with contributions from Cerema, Citepa and Plan Bleu
Authors:
      •     Laurence Rouïl (Ineris)
      •     Catherine Ratsivalaka (Cerema)
      •     Jean-Marc André (Citepa)
      •     Nadine Allemand (Citepa)

With the   contribution from:
       •    Florian Couvidat (Ineris)
       •    Alicia Gressent (Ineris)
       •    Elsa Réal (Ineris)
       •    Simone Schucht (Ineris)
       •    Irving Tapia-Villarreal (Citepa)
       •    Thamara Vieira-da-Rocha (Citepa)
       •    Renaud Martin (Cerema)
       •    Antoine Lafitte (Plan Bleu)

DRC-19-168862-00408A                           3 | 90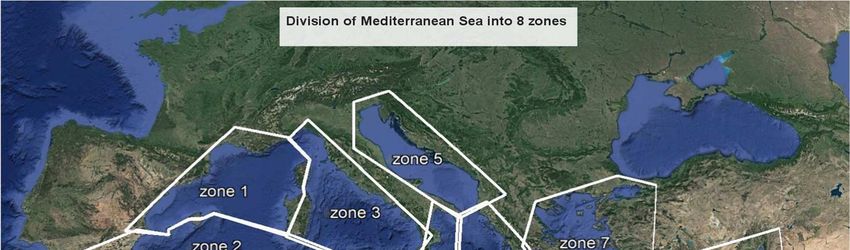
Table of content
1     Executive Summary ....................................................................................................................... 10
2     Introduction and context............................................................................................................... 17
    2.1      Background............................................................................................................................ 17
    2.2      ECAMED Project Set-up ......................................................................................................... 19
    2.3      Structure of the report .......................................................................................................... 21
3     Detailed description of maritime shipping traffic in the Mediterranean Sea ............................... 22
    3.1      Input data .............................................................................................................................. 22
    3.2      Methodology ......................................................................................................................... 22
    3.3      Results ................................................................................................................................... 25
4     Emission calculations..................................................................................................................... 27
    4.1      Methodology ......................................................................................................................... 27
      4.1.1         Mathematical generic functions to determine emissions............................................. 27
      4.1.2         Application to the Mediterranean Sea .......................................................................... 27
      4.1.3         Scenarios proposed ....................................................................................................... 28
    4.2      Emissions results ................................................................................................................... 30
5     Impact on air pollutant concentrations......................................................................................... 32
    5.1      Input data .............................................................................................................................. 32
      5.1.1         Emissions ....................................................................................................................... 32
      5.1.3         Meteorology .................................................................................................................. 34
      5.1.4         Boundary conditions...................................................................................................... 34
    5.2      Methodology ......................................................................................................................... 34
    5.3      Modelling results ................................................................................................................... 34
      5.3.1         Maps of differences of concentrations ......................................................................... 35
      5.3.2         Focus on city areas ........................................................................................................ 39
      5.3.3         Deposition ..................................................................................................................... 41
      5.3.4         Conclusions .................................................................................................................... 42
6     Cost-benefits analysis .................................................................................................................... 44
    6.1      Costs assessment................................................................................................................... 44
      6.1.1         Cost calculation methodology ....................................................................................... 44
      6.1.2         Cost results .................................................................................................................... 55
    6.2      Health impact assessment and benefits ............................................................................... 60

DRC-19-168862-00408A                                                                                                                        4 | 90
6.2.1          Methodology ................................................................................................................. 60
      6.2.2          Results ........................................................................................................................... 63
    6.3      Cost-benefits analysis ............................................................................................................ 75
7     References ..................................................................................................................................... 76

DRC-19-168862-00408A                                                                                                                        5 | 90
Table of Tables
Table 1 Compilation of information gathered and built-up to describe the maritime traffic in the
Mediterranean Sea ................................................................................................... 25
Table 2 Fuel consumption and pollutants and GHG emissions for the different scenarios. ............ 30
Table 3 Fuel prices used in the cost calculations for each scenario........................................ 47
Table 4 Input parameters for the cost calculation of the SCR ............................................... 50
Table 5 Time of presence in the Mediterranean Sea according to the processing of ship tracking data
.......................................................................................................................... 51
Table 6 Economic impacts of the NOx emissions reduction on the fuel price by annual average times
spent in NECA ........................................................................................................ 52
Table 7 Presence times in the Mediterranean NECA zone used in the calculations ..................... 53
Table 8 Investment and operating costs of SCR for a type tanker/cargo ship with a 12 MW engine . 53
Table 9 Investment and operating costs of SCR for a passenger-type vessel with an 8-MW engine .. 54
Table 10 Investment and operating costs of SCR for other types of vessels .............................. 54
Table 11 Input data for annual cost calculations .............................................................. 55
Table 12 Avoided SOx emissions by scenarios and associated avoided emissions of NOx, PM10, PM2.5 and
BC ....................................................................................................................... 55
Table 13 Costs of reducing SOx emissions for scenario and price hypothesis with an average price for
HFO 1.5%S ............................................................................................................. 56
Table 14 Costs of reducing SOx emissions per scenario and price hypothesis with high price for HFO
1.5%S ................................................................................................................... 57
Table 15 Annual costs by hypotheses in terms of annual average time spent in the NECA and life time
(T1V1, T1V2, T2V1, T2V2, T3V1, T3V2) .......................................................................... 58
Table 16 Synthesis of health impacts (mortality and morbidity) considered in the ECAMED HIA and
their monetary unit values ......................................................................................... 60
Table 17 Population data used in the ECAMED health impact assessment (UN, 2017) .................. 62
Table 18 Health benefits – low and high estimate – ECAMED domain per country ....................... 71
Table 19 Specific fuel oil consumption for the different engines, fuel and navigation phases. ....... 80
Table 20 NOx emission factors for the different engines, engine years, fuel types and navigation
phases.................................................................................................................. 80
Table 21 TSP emission factors for the different engines, fuel types and navigation phases. .......... 83
Table 22 Reduction factors to obtain TSP emission factors for different Sulphur content. ............ 83
Table 23 GHG emission factors for different engines, fuel types and navigation phases. .............. 84
Table 24 AEP emission factors for different engines, fuel types and navigation phases................ 84
Table 25 POPs emission factors for different engines, fuel types and navigation phases. ............. 85

DRC-19-168862-00408A                                                                                             6 | 90
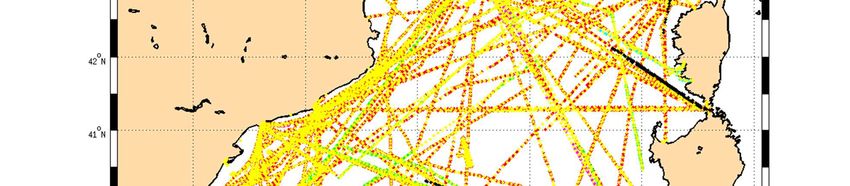
Table of Figures
Figure 1 Relative NO2 annual mean concentration differences between SN100 and REF_MGO scenarios
(in %). Focus on land territories .................................................................................. 13
Figure 2 Relative nitrogen annual differences between SN100 and REF_MGO scenarios (in %). Focus
on land territories ................................................................................................... 13
Figure 3 Reduction in PM2.5 mortality (premature deaths) – overall ECAMED domain ................... 14
Figure 4 Reduction in PM2.5 mortality (premature deaths) – ECAMED domain per country ............. 14
Figure 5 Aggregated Monetised benefits associated with the implementation of a SECA/NECA in the
Mediterranean Sea (Low and High values estimates).......................................................... 15
Figure 6 Final results of the cost-benefits analysis ............................................................ 16
Figure 7 In-land and maritime NOx emissions estimations and projections in 2000, 2010, 2020 and 2030
(Source: EEA 2013) .................................................................................................. 18
Figure 8 ECAMED project set-up .................................................................................. 20
Figure 9 ECAMED geographical scope ............................................................................ 20
Figure 10 Division of the Mediterranean Sea into 8 zones .................................................... 23
Figure 11 Example on zone 1 for one day: trajectories rebuilt in yellow, in green and red, initial
trajectories and in black, trajectories that couldn’t have been interpolated............................ 26
Figure 12 Traffic density map with all AIS data used for the ECAMED study .............................. 26
Figure 13 Pollutants emissions evolutions compared to 2015/2016 emissions ............................ 31
Figure 14 Synthetic representation of input datasets required to feed air quality model ............. 32
Figure 15 Gridded NOx emissions for REF1516 (top) and SN100 (bottom) scenarios..................... 33
Figure 16 Absolute SO2 annual mean concentration differences between SN100 and REF_MGO scenarios
(in µg/m3) ............................................................................................................. 35
Figure 17 Relative SO2 annual mean concentration differences between SN100 and REF_MGO scenarios
(in %). Focus on land territories .................................................................................. 35
Figure 18 Absolute NO2 annual mean concentration differences between SN100 and REF_MGO scenarios
(in µg/m3) ............................................................................................................. 36
Figure 19 Relative NO2 annual mean concentration differences between SN100 and REF_MGO scenarios
(in %). Focus on land territories .................................................................................. 36
Figure 20 Absolute PM2.5 annual mean concentration differences between SN100 and REF_MGO
scenarios (in µg/m3). Focus on land territories ............................................................... 37
Figure 21 Relative PM2.5 annual mean concentration differences between SN100 and REF_MGO
scenarios (in %). Focus on land territories ...................................................................... 37
Figure 22 Absolute O3 summer mean concentration differences between SN100 and REF_MGO scenarios
(in µg/m3). Focus on land territories ............................................................................. 38
Figure 23 Relative O3 summer mean concentration differences between SN100 and REF_MGO scenarios
(in %). Focus on land territories .................................................................................. 39
Figure 24 Differences between Air pollutant annual concentrations for various scenarios over city
areas: Marseille (left) and Bastia (right). The grey bar refers to the difference between REF_1516 and
REF_MGO while the others refers to differences between REF_MGO and SECA/ NECA scenarios ..... 40
Figure 25 Differences between Air pollutant annual concentrations for various scenarios over city
areas: Naples (left) and Tunis (right). The grey bar refers to the difference between REF_1516 and
REF_MGO while the others refers to differences between REF_MGO and SECA/ NECA scenarios ..... 40
Figure 26 Time series of differences in PM2.5 concentrations between REF_1516 and REF_MGO and
REF_MGO and SN100 for Marseille ................................................................................ 40
Figure 27 Time series of differences in PM2.5 concentrations between REF_1516 and REF_MGO and
REF_MGO and SN100 for Bastia .................................................................................... 40

DRC-19-168862-00408A                                                                                           7 | 90
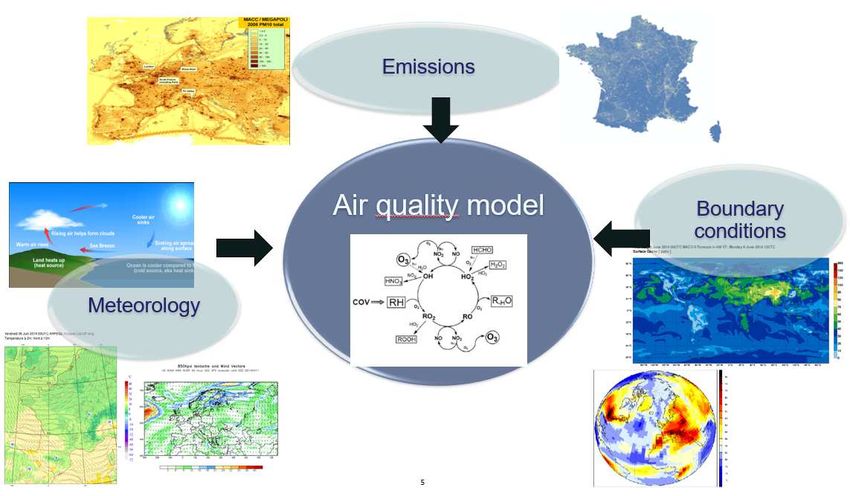
Figure 28 Time series of differences in PM2.5 concentrations between REF_1516 and REF_MGO and REF_MGO and SN100 for Naples ................................................................................... 41 Figure 29 Time series of differences in PM2.5 concentrations between REF_1516 and REF_MGO and REF_MGO and SN100 for Tunis..................................................................................... 41 Figure 30 Relative nitrogen annual annual differences between SN100 and REF_MGO scenarios (in %). Focus on land territories ........................................................................................... 41 Figure 31 Relative Sulphur annual deposition differences between SN100 and REF_MGO scenarios (in %). Focus on land territories ..................................................................................... 42 Figure 32 Price trends for LSMGO Max 0.10% Sulphur Distillate (USD$ per metric ton) in 2015 ....... 45 Figure 33 Price trends for MGO Max 1.50% S (USD$ per metric ton) in 2015 .............................. 45 Figure 34 Price trends for IFO380 Max 3.5% Sulphur Bunkers (USD$ per metric ton) in 2015 .......... 46 Figure 35 Price trends for IFO180 Max 3.5% Sulphur Bunkers (USD$ per metric ton) in 2015 .......... 46 Figure 36 Scenarios of evolution of marine fuel prices from .............................................. 47 Figure 37 Impact of SCR on the price of fuel MGO 0.1% S (€/t fuel) for different annual average times spent in the NECA zone ............................................................................................. 51 Figure 38 Cost-effectiveness ratio of the SCR (€/Avoided t NOx) for different annual average times spent in the NECA zone ............................................................................................. 52 Figure 39 Marine fuel costs for scenarios and price assumptions with an average price for HFO 1.5%S .......................................................................................................................... 56 Figure 40 Marine fuel costs for scenarios and price assumptions with high price for HFO 1.5% S ..... 57 Figure 41 Total annual costs per hypotheses for calculating the annual costs of NOx emission reductions ............................................................................................................. 59 Figure 42 Cost/efficiency ratio per hypotheses for calculating the annual costs of NOX emission reductions ............................................................................................................. 59 Figure 43 Reduction in PM2.5 mortality (life years) – overall ECAMED domain ............................ 63 Figure 44 Reduction in PM2.5 mortality (life years) – ECAMED domain per country ...................... 64 Figure 45 Reduction in PM2.5 mortality (premature deaths) – overall ECAMED domain.................. 64 Figure 46 Reduction in PM2.5 mortality (premature deaths) – ECAMED domain per country ............ 65 Figure 47 Reduction in working days lost from PM2.5 – ECAMED domain ................................... 65 Figure 48 Reduction in working days lost from PM2.5 – ECAMED domain per country .................... 66 Figure 49 Reduction in chronic bronchitis from PM2.5 – ECAMED domain .................................. 66 Figure 50 Reduction in chronic bronchitis from PM2.5 – ECAMED domain per country ................... 67 Figure 51 Avoided premature deaths – benefits from reduced exposure to PM2.5 in the ECAMED domain .......................................................................................................................... 67 Figure 52 Avoided cases of chronic bronchitis – benefits from reduced exposure to PM2.5 in the ECAMED domain ................................................................................................................. 68 Figure 53 Aggregate health benefits – overall ECAMED domain ............................................. 68 Figure 54 Health benefits – low estimate – ECAMED domain per country .................................. 72 Figure 55 Health benefits – high estimate – ECAMED domain per country ................................. 72 Figure 56 Health benefits per capita – low estimate – ECAMED domain per country .................... 73 Figure 57 Health benefits per capita – high estimate – ECAMED domain per country ................... 73 Figure 58 Health benefits of the implementation of the SECA/NECA compared to 2020 legislation (Meuros/year) ........................................................................................................ 74 Figure 59 Health benefits per capita of the implementation of the SECA/NECA compared to 2020 legislation (euros/capita/year) ................................................................................... 74 Figure 60 Final results of the cost-benefits analysis .......................................................... 75 Figure 61 IMO NOx emission standards. .......................................................................... 82 DRC-19-168862-00408A 8 | 90
Acronyms and abbreviations
AIS               Automatic Identification System
BC                Black Carbon
CLRTAP            Convention on Long Range Transboundary Air Pollution
CO2               Carbon Dioxide
ECA               Emission Control Area
EEA               European Environment Agency
EU-EEZ            European Union Exclusive Economic Zone
HIA               Health Impact Assessment
HFO               Heavy Fuel Oil
IMO               International Maritime Organisation
LNG               Liquefied Natural Gas
MARPOL VI         IMO International Convention for the Prevention of Pollution from
                  Ships, Annex VI (Global fuel-sulphur limit of 0.5% S)
MDO               Marine Distillate Oil
MGO               Marine Gas Oil
MTES              French Ministry for the Ecological and Inclusive Transition
NECA              NOx Emission Control Area (in this report referred to generally as NECA)
NOx               Nitrogen Oxides
PM (PM2.5)        Particulate Matter (Particulate Matter 2.5µm or smaller)
POPs              Persistent Organic Pollutants
REMPEC            Regional Marine Pollution Emergency Response Centre for the
                  Mediterranean Sea
SECA              SOx Emission Control Area (in this report referred to generally as SECA)
SOx               Sulphur oxides
UNECE             United Nations Economic Commission for Europe
VOLY              Value Of Life Year
VSL               Value of a Statistical Life (or monetary value to reduce risk of a
                  statistical premature death)
WHO               World Health Organisation

DRC-19-168862-00408A                                                             9 | 90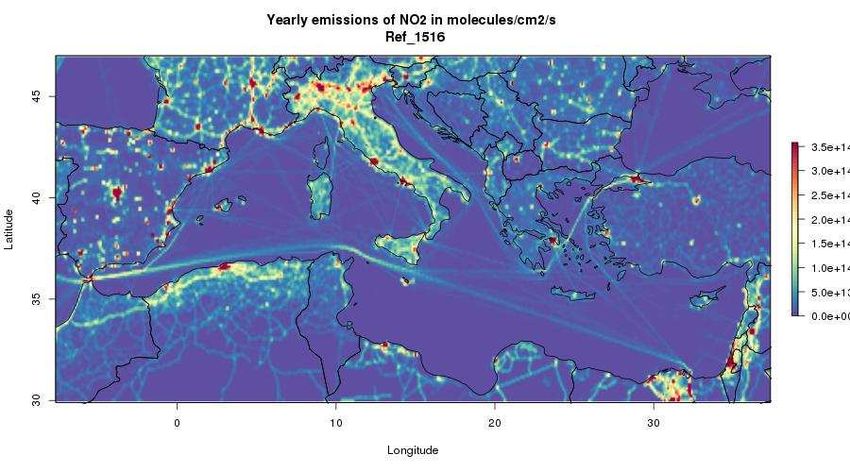
1 Executive Summary

To this day, despite the regulations to combat air pollution that have been implemented for
several years in many countries, air pollution remains one of the most sensitive and harmful
environmental concerns. According to a recent report1 published by the World health
Organisation (WHO) and the Organisation for Economic Co-operation and Development
(OECD), in 2010, ambient air pollution was still responsible for about 500 000 premature
deaths in Europe. This number represents a decrease by 11 % compared to 2005 and gives an
indication of the efficiency of air pollution control policies that have been implemented in
Europe for several decades, but it is still too high.
In Europe, one of the most important text that bears air pollution management is the so-
called National Emission Ceilings Directive revised in December 2016 (2016/2284/EU). This
Directive sets country specific emission reduction commitments to be respected by the
European countries in 2020 and 2030. To meet these objectives, emission control strategies
must be implemented in various activity sectors: industry, road and off-road transport,
residential heating, agriculture … It is worth noting that despite international maritime
shipping being an important source of emissions of air pollutants, this sector is not targeted
by this legislation. However, it obviously causes important impacts on air quality in port
cities, and because of the long-range transport and complex chemistry, emissions from
shipping can also degrade inland air quality.
In 2007, an epidemiological study published by (Corbett et al)2 pointed out that about 60 000
premature deaths occurring near coastlines in Europe, East Asia, and South Asia could be
attributable to increase exposure to PM resulting from shipping air pollutants emissions.
Despite this, several studies show that shipping emissions in European seas may remain stable
from 2000 to 2030 and might be as large as in-land European emissions in 2030.

The French National Reduction Plan of Atmospheric Pollutants Emissions (also called PREPA)
adopted in 2017 in the French law3, envisages the implementation of new low emission zones
in the Mediterranean Sea. In that perspective, The French Ministry for the Ecological and
Inclusive Transition (MTES) was interested in assessing the feasibility and the potential
benefits of the implementation of a NECA (NOx emissions control area) or/and SECA
(SOx emissions control Area) in the Mediterranean Sea.
In this context, INERIS, CITEPA, CEREMA and Plan Bleu set-up a partnership project,
coordinated by INERIS, to carry out this feasibility study based on scientific information. Its
objectives were to assess the cost and the benefits for air quality of the implementation of
an Emissions Control Area (ECA) in the Mediterranean Sea. This is the ECAMED project.
Emissions and air quality modelling tools have been used to elaborate such a diagnostic, with
respect with the project set-up synthesised by the scheme below.

1
  WHO Regional Office for Europe, OECD (2015). Economic cost of the health impact of air pollution in Europe:
Clean air, health and wealth. Copenhagen: WHO Regional Office for Europe
2
  J J . Corbett , J . J . Winebrake , E. Green , P. Kasibhatla, V . Eyring , and A. Lauer, Mortality from shipping
emissions: a global assessment, Environ. Sci. Technol. 2007, 41, 8512–8518
3
  Arrêté du 10 mai 2017 établissant le Plan national de réduction des polluants atmosphériques

DRC-19-168862-00408A                                                                                   10 | 90
The purpose of the study is to document and quantify benefits on air quality in the
Mediterranean countries associated with emission reduction scenarios. These scenarios are
characterized by the following reductions in emission factors associated to maritime shipping
that could be achieved in the future:
Reduction of the Sulphur content in fuels used from 0.5% (this rate will be mandatory
according to the MARPOL regulation in 2020) to 0.1%. This will reduce SOx and PM
emissions from ships, and this is the definition of the SECA scenario;
Reduction of NOx emissions by equipping a certain amount (50% or 100%) of engines
with SCR or other techniques (to comply with TIER III cleaner technologies). This is
the NECA scenario.
These assumptions were applied to the shipping activity data established for the current
years (2015-2016). No projection about future traffic activity, content of the fleet, or
engine renewal rates has been established.
Therefore, the net impact of emission reduction strategies on air pollution and its harmful
effects is assessed in this cost-benefits analysis, without the influence of the future evolution
of shipping activity and the influence of meteorology.
The first step was to elaborate a detailed description maritime traffic in the Mediterranean
Sea, with the inventory of shipping routes, and for each vessel spotted, its location with a
high temporal frequency (15 min), and its characteristics (ship type and age, engine type
and age, motor power, fuel used, engine load factor, navigation phase). Databases gathering
the information retrieved from the Automatic Identification System (AIS) crossed with the
Lloyd’s register FAirplay allowed us to re-build with a very high resolution about 85% of the
trajectories of high tonnage vessels cruising in the Mediterranean Sea for the years 2015 and
2016. Note that those years where targeted in the project because most updated and recent
data about maritime traffic was available at the time of the project.
DRC-19-168862-00408A 11 | 90Air pollutant emission factors are associated with each vessel/engines/fuel used/loading
factors/navigation phase and the second step was consisting in coupling shipping activity
data with emission factors to estimate air pollutant emissions associated with shipping traffic
built-up for the years 2015 and 2016. By this way a reference shipping emission inventory
was elaborated for 2015 and 2016 (called REF_1516), which is representative of the current
situation. Applying emission factors representative of the emission control scenarios
targeted in the project allowed to create emission inventories for each of those scenarios.
Five scenarios were quantified:
1- The IMO Global Sulphur Cap 2020 named REF_MGO will reduce the emissions
(compared to REF_1516) as described below:
• SOx by 80%
• Paticulate Matter by 72%
• Black Carbon by 30%
• NOx by 5%
2- The implementation of a SECA will reduce the emissions (compared to REF_1516) as
follows:
• SOx by 95%
• Paticulate Matter by 80%
• Black Carbon by 51%
• NOx by 5%
3- The implementation of a NECA will reduce the emissions (compared to REF_1516) of
NOx:
• by 38% when 50% of ships will be TIER III
• by 77% when 100% of ships will be TIER III
4- The combination of SECA and NECA reduction assuming:
• 100% of vessels were equipped with TIER III engines (SN100)
• 50% of vessels were equipped with TIER III engines (SN50)
To simulate the impact of emission reduction scenarios on air quality (which means on
ambient air pollutant concentrations) a chemistry-transport model (CTM) must be run. CTMs
are complex three-dimensional numerical models which resolve dynamics, chemistry and
loss processes (deposition) that drive air pollutant dispersion and transformation in ambient
air. INERIS develops in collaboration with the National Research Centre (CNRS) the CHIMERE
air quality model for more than 15 years.
CHIMERE was run by INERIS to simulate all scenarios envisaged in ECAMED and assess their
impact compared to the current situation (2015) or to the Global sulphur Cap 2020.
Legislation in 2020 (use of fuel with 0.5% sulphur content) will reduce significantly sulphur
dioxide and in some areas PM ambient concentrations in the Mediterranean countries. But
the simulation shows that implementation of a SECA/NECA (with 100% of vessels equipped
with clean engines) will bring further significant improvements with a reduction by up to
1µg/m3 (11%) of annual average of fine particulate matter concentrations (PM2.5) compared
to the 2020 legislation, and reduction of annual average of nitrogen dioxide (NO2) by up to
15 µg/m3 (70%) compared to 2020 legislation.
DRC-19-168862-00408A 12 | 90Figure 1 Relative NO2 annual mean concentration differences between SN100 and REF_MGO scenarios (in %). Focus on land territories Nitrogen and sulphur deposition in response to emission reduction scenarios has been simulated by CHIMERE as well. Sulfur and nitrogen deposition has harmful effects on vegetation and ecosystems such as acidification and eutrophication, which can result in loss of biodiversity. Eutrophying deposition fluxes are directly correlated to nitrogen oxides emissions, and the simulations show that on the environmental point of view, implementation of an ECA leads to benefits, with nitrogen deposition on coastal ecosystems reduced by up to 40% compared to 2020 legislation. Differences of deposition between both situations is displayed on the map below. Figure 2 Relative nitrogen annual differences between SN100 and REF_MGO scenarios (in %). Focus on land territories Reduction of air pollutant concentrations are translated in terms of health impact using concentrations-response functions linking levels of pollutant exposure to specific health impacts (also called “end-points” in terms of mortality and morbidity), as well as monetary indicators and values associated with those end-points. The methodology implemented to perform the health impact assessment of the scenario studied was the one adopted by the Europeans Commission for the setting air quality regulations. The impacts of the scenarios on each mortality and morbidity end-point were assessed by the methodology leading to the kind of result presented below: implementation of a SECA/NECA brings additional benefits with about 40% additional avoided premature deaths compared to the impact of the 2020 legislation. Algeria, Egypt, Italy, Greece, Turkey are the main beneficiaries. DRC-19-168862-00408A 13 | 90
Figure 3 Reduction in PM2.5 mortality (premature deaths) – overall ECAMED domain

                   Avoided premature deaths in 2015 owing to the reduction in PM2.5 population exposure
1 600

1 400

1 200

1 000

 800

 600
                                                                                                SECA NECA rel. to Reference 2020
                                                                                                Reference 2020 rel. to reference 2015
 400

 200

   0
                          Spain

            Russian Federation

                    Switzerland

                      Lebanon
                         Cyprus
                       Bulgaria
                        Croatia

                         France
                        Greece

                       Slovenia

        Bosnia and Herzegovina

                      Palestine

                           Syria
                        Tunisia
        Serbia and Montenegro

                          Israel

                      Morocco
                         Jordan
                        Austria

                      Romania

                        Albania

               TFYR Macedonia
                      Moldova

                        Ukraine

                         Algeria

                   Saudi Arabia
                            Italy

                         Turkey

                             Iraq
                          Egypt
                          Malta

                        Georgia

                           Libya
                       Hungary

Figure 4 Reduction in PM2.5 mortality (premature deaths) – ECAMED domain per country

DRC-19-168862-00408A                                                                                                  14 | 90
Figure 5 illustrates the monetized benefits (health impact associate with monetary value)
results aggregated over all health end-points and the entire ECAMED domain. High and low
estimates are proposed: low estimate uses the reduction of life expectancy as mortality end-
point, while high estimate uses the number of premature death as mortality indicator. The
conclusions are robust for both indicators:
Additional benefits attributed to the implementation of a SECA/NECA are
very significant,
In monetary terms, they are of the same order as the benefits expected from
the implementation of the Global Sulphur Cap in 2020.
Such encouraging results can be explained by several reasons:
Additional reduction of PM2.5 exposure due not only to SOx emissions
reductions but also NOX emissions reductions, since NOX are precursors of PM
formation as well,
Additional benefits due to a reduction in exposure to NO2 and to ozone.
These results highlight the essential need to develop combined SECA and NECA strategies to
maximise achievable health benefits.
Figure 5 Aggregated Monetised benefits associated with the implementation of a SECA/NECA in the Mediterranean
Sea (Low and High values estimates)
Those figures must be put in perspective with the cost of the scenarios (implementation of
a SECA/NECA) to estimate objectively net benefices of the emission reduction measures.
This work has been performed thanks to an in-depth analysis of the costs associated to
changes in fuel used by the shipping sector (towards 0.1% sulphur content fuel) on one hand,
and transition to cleaner engines which limit NOx emissions with Selective Catalytic
Reduction technologies on the other hand. For each scenario, a sensitivity study was
necessary to account for the uncertainties in this evaluation.
The conclusions of this cost study are illustrated by the histogram graph below, which also
includes the monetarized health benefits (on the right) for comparison. For costs (three first
couple of bars) as for benefits, low and high estimates are given.
DRC-19-168862-00408A 15 | 90We conclude that in the worst-case health benefits of implementing a SECA/NECA in the Mediterranean Sea are 3 times higher than the costs, demonstrating the relevance of this strategy for protecting health of citizens in the Mediterranean countries. Figure 6 Final results of the cost-benefits analysis DRC-19-168862-00408A 16 | 90
2 Introduction and context

2.1 Background

To this day, despite the regulations to combat air pollution that have been implemented for
several years in many countries, air pollution remains one of the most sensitive and harmful
environmental concerns. According to a recent report4 published by the World health
Organisation (WHO) and the Organisation for Economic Co-operation and Development
(OECD), in 2010, ambient air pollution was still responsible for about 500 000 premature
deaths in Europe. This number represents a decrease by 11 % compared to 2005 and gives an
indication of the efficiency of air pollution control policies that have been implemented in
Europe for several decades, but it is still too high.
Harmful, air pollution effects on health are driven by a number of targeted pollutants:
Particulate matter (PM10 and PM2.5 for particles with diameter lower than 10 and 2.5 microns,
respectively), Ozone (O3), nitrogen dioxide (NO2) and Sulphur dioxide (SO2). Ecosystems are
impacted by air pollution as well, and in particular, by acidifying and eutrofying effects of
Sulphur and nitrogen compounds deposition, and by ground level ozone which puts a
constraint on vegetation growth.
In Europe, air quality is monitored and regulated by the air quality Directives
(2004/107/EC and 2008/50/EC) and controlled by the so-called National Emission Ceilings
Directive revised in December 2016 (2016/2284/EU). This Directive sets country specific
emission reduction commitments to be respected by the European countries in 2020 and
2030. To meet these objectives, emission control strategies must be implemented in various
activity sectors: industry, road and off-road transport, residential heating, agriculture … It
is worth noting that despite international maritime shipping being an important source of
emissions of air pollutants, this sector is not targeted by the above cited legislation. This
obviously causes important impacts on air quality in port cities, but because of the long-
range transport and complex chemistry, emissions from shipping can also degrade inland air
quality.
Moving approximately 80% of world’s goods, international shipping is an active and growing
economic sector. In 2007, an epidemiological study published by (Corbett, 2007) pointed out
that about 60 000 premature deaths occurring near coastlines in Europe, East Asia, and South
Asia could be attributable to to increase exposure to PM resulting from shipping air pollutants
emissions. Despite this, several studies show that shipping emissions in European seas may
remain stable from 2000 to 2030 and might be as large as in-land EU emissions in 20305
(Figure 7).

In 1997, the IMO Marine Pollution Convention (MARPOL 73/78) adopted the Annex VI which
sets out various emission limit values for atmospheric pollutants emitted by shipping
activities and forbids releases of substances likely to weaken the ozone layer. Appendix 3 of
Annex VI of the MARPOL Convention gives the possibility to define Emission Control Areas
(ECA) where Sulphur oxides (SOx) and nitrogen oxides (NOx) emitted by maritime traffic
should be reduced.

4
  WHO Regional Office for Europe, OECD (2015). Economic cost of the health impact of air pollution in Europe:
Clean air, health and wealth. Copenhagen: WHO Regional Office for Europe
5
  EEA technical report n°4/2013 : The impact of international shipping on European air quality and climate forcing
(https://www.eea.europa.eu/publications/the-impact-of-international-shipping/file)

DRC-19-168862-00408A                                                                                   17 | 90
Figure 7 Comparison of estimations and projections in 2000, 2010, 2020 and 2030 between EU in-land and shipping
NOx emissions in European areas (Source: EEA 2013)

According to this text, SOx Emissions Control Areas (SOx-ECAs or SECA) were established in
the Baltic Sea, the North Sea and the English Channel, setting a limit on the sulphur content
in marine fuels of no more than 0.10 percent as of 1/1/2015.
In October 2016, the IMO decided to lower the global sulphur limit in marine fuels to 0.50
percent by 2020 for ships sailing outside the ECAs, and to designate the Baltic Sea, the North
Sea and the English Channel as NOx –Emission Control Areas (NOx-ECAs or NECA) as of 2021,
introducing strict (Tier III) NOx emission standards for new ships.
The French National Reduction Plan of Atmospheric Pollutants Emissions (also called PREPA)
adopted in 2017 in the French law6, envisages the implementation of new low emission zones
in the Mediterranean Sea. In that perspective, The French Ministry for the Ecological and
Inclusive Transition (MTES) was interested in assessing the feasibility and the potential
benefits of the implementation of a NECA or/and SECA in the Mediterranean Sea.
In this context, INERIS, CITEPA, CEREMA and Plan Bleu set-up a partnership project,
coordinated by INERIS, to carry out this feasibility study based on scientific information. Its
objectives were to assess the cost and the benefits for air quality of the implementation of
an Emissions Control Area in the Mediterranean Sea. Emissions and air quality modelling tools
have been used to elaborate such a diagnostic. They are presented in this report, together
with the results and conclusions from the feasibility study.

6
    Arrêté du 10 mai 2017 établissant le Plan national de réduction des polluants atmosphériques

DRC-19-168862-00408A                                                                                18 | 90
2.2 ECAMED Project Set-up
The project assembled the skills and competences from 4 organisations with long-standing
experience in the field of air pollution and/or maritime issues:
INERIS (Institut national de l’Environnement Industriel et des Risques) is the project
coordinator. INERIS has a long experience in the field of air quality monitoring,
modelling and management. It has supported the Ministry in charge of the
Environment in the definition and implementation of related regulations for more
than 20 years. Within this project, INERIS performed all the modelling runs and the
benefits analysis.
CITEPA (Centre Interprofessionnel Technique d’Etudes de la Pollution
Atmosphérique) is mandated by the Ministry in charge of the Environment for
building-up official and regulatory national emission inventories for greenhouse gases
and atmospheric pollutants. In the project, CITEPA was responsible for the emissions
and projections estimations and for the cost analysis.
CEREMA (Centre d'études et d'expertise sur les risques, l'environnement, la mobilité
et l'aménagement) is a public Institute focused on infrastrutures and mobility,
sustainable territories and cities. In the project, CEREMA was responsible for the
analysis of activity data in the shipping sector throughout the Mediterranean Sea and
provided necessary and consolidated datasets to describe emissions.
Plan Bleu is one of the Regional Activity Centres of the Mediterranean Action Plan
(MAP) of the United Nations Environment Programme (UNEP), put in place by France
since 1977. Its program of work is approved by the Contracting parties to the
Barcelona Convention. In the project, Plan Bleu was responsible for the
communication part.
The various steps of the project can be simply illustrated by the Figure 8. Five steps are
identified:
1. Detailed description of maritime shipping traffic in the Mediterranean Sea (CEREMA)
2. Calculation of current emissions and scenarios (CITEPA)
3. Simulation of air pollutant concentrations and deposition (INERIS)
4. Cost-benefits analysis (CITEPA and INERIS)
5. Communication and networking with stakeholders (Plan Bleu)
The methodology applied for each technical step will be described in detail in the following
sections. The purpose of the study is to document and quantify benefits on air quality in the
Mediterranean countries associated with emission reduction scenarios. These scenarios are
characterized by the following reductions in emission factors associated to maritime shipping
that could be achieved in the future:
Reduction of the Sulphur content in fuels used from 0.5% (this rate will be mandatory
according to the MARPOL regulation in 2020) to 0.1%. This will reduce SOx and PM
emissions from ships;
Reduction of NOx emissions by equipping a certain amount (50% or 100%) of engines
with SCR or other techniques (to comply with TIER III cleaner technologies).
These assumptions are applied to the shipping activity data established for the current years
(2015-2016) by the CEREMA. No projection about future traffic activity, content of the
fleet, or engine renewal rates has been established. Therefore, the net impact of
DRC-19-168862-00408A 19 | 90emission reduction strategies on air pollution and its harmful effects is assessed in this cost-benefits analysis, taking out the influence of the future evolution of shipping activity and the influence of meteorology. Figure 8 ECAMED project set-up The targeted domain is illustrated by Figure 9 below. It has been defined to encompass the entire Mediterranean Sea which is the target of the study. For modelling purposes, the domain should be a bit larger, to account for the influence of in-land sources that could impact the simulation and boundary numerical effects. Figure 9 ECAMED geographical scope DRC-19-168862-00408A 20 | 90
Terrestrial emissions (for the years 2015-2016) are taken into account in the simulations.
They are issued from official emission inventories reported by the neighbouring countries in
the framework of the Protocols of the Convention on Long Range Transboundary Air Pollution
from the United Nations Economic Commission for Europe.

2.3 Structure of the report
The next 4 sections describe in detail the steps 1 to 4 previously mentioned. Methodologies
and assumptions are described and a selection of results presented for each part.
Complementary information is available in the annexes.
The final section is the conclusion of the ECAMED study and provides some recommendations
for next steps.

DRC-19-168862-00408A                                                               21 | 90
3 Detailed description of maritime shipping traffic in the
Mediterranean Sea
3.1 Input data
For the calculation of sulphur oxide, PM (including PM10 and PM2.5)7 and nitrogen oxide
exhaust emissions from ships due to traffic in the Mediterranean Sea, the following data for
each vessel is requested:
1. Age of the ship / engine
2. Ship type (Liquid Bulk Ship, Dry Bulk Carrier, Container, General Cargo, Ro Ro Cargo,
Passenger, Fishing, Other, Tugs)
3. Engine type (slow-, medium-, high-speed diesel, gas turbine, steam turbine)
4. Rated motor power (kW)
5. Fuel used (bunker fuel oil, marine diesel oil / marine gas oil, gasoline)
6. Use of main engine or auxiliary engine
7. Engine load factor (%)
8. Vessel navigation phase: cruising, manoeuvring, at berth or anchorage
9. Vessel position (latitude and longitude) as a function of time (date and time)
10. Instantaneous speed (km/h) as a function of time (date and time)
The first five data categories are extracted from the Fairplay database, the last two from
AIS data and the others calculated (use of engine, load factor, navigation phase).
The Fairplay database of IHS Markit contains the database of all ships sailing around the
world with an IMO number (for International Maritime Organization). This is a unique number
that identifies a vessel. Associated with the hull, it is invariant no matter the changes of
owner, flag or name of the ship. Commercial vessels of more than 100 gross registered tons
do have an IMO number by construction.
The Automatic Identification System (AIS) provides automatic updates of the vessel locations
and its instantaneous speeds at regular intervals. The ships are identified by their MMSI
number in the AIS database along with the ship’s name and the IMO number if it exists.
We used the AIS messages received by the terrestrial AIS network and provided by the
European Maritime Safety Agency (EMSA) for the years 2015 and 2016. To complete the EMSA
dataset, we bought to Orbcomm AIS data collected by satellite to get the coverage of the
south-east Mediterranean Sea.
3.2 Methodology
Describing dynamically shipping emissions requires to know for each ship in 15-minute steps:
• its position and its instantaneous speed,
• its navigation phase,
• the load factor of the main engine and auxiliary engines.
Compilation of these sets of information requires data management of more than 1 billion
archived AIS messages. To process this large amount of data (around 500MB and 1GB per
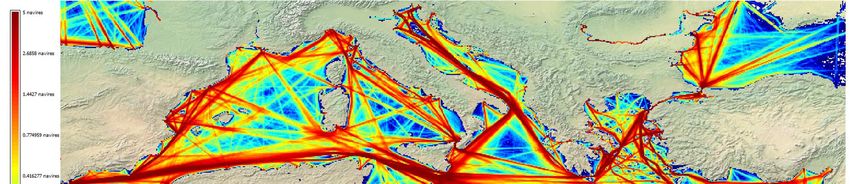
day), the work has been divided in 8 zones covering the Mediterranean Sea (Figure 10).
7
Particles with diameter lower than 10 and 2.5 µm respectively
DRC-19-168862-00408A 22 | 90Figure 10 Division of the Mediterranean Sea into 8 zones
The navigation phase is defined by the instantaneous speed, as:
Either a cruising phase if the speed is more than 4 nm per hour (knots)
Or a manoeuvring phase if the speed is between 1 et 4 nm per hour (knots)
Or a berth/anchor phase if the speed is less than 1 nm per hour (knot)
If there is a gap larger than 2 hours between two positions of the same vessel, it is assumed
that:
the vessel may have stopped at the port (or anchorage) or may leave the port (or
anchorage) if the two points are located within less than 1NM and recorded speeds
are lower than 0.5 knot;
it can be due to a poor geographical coverage of the data: in this case, we interpolate
between the two points if they keep the same heading at + - 45;
the vessel may go out of the study area and then come back: this assumption has not
been implemented (concerns less than 20 cases in 2015, negligible impact).
The load factor of the engines (ratio between the power needed and the maximum or
nominal power) depends mainly on the conditions of navigation (speed of the ship, weather
conditions, etc.), the loading (draft and attitude), the condition of the hull (state of
cleanliness, in particular) and the type of operation of the ship, especially the part of the
power not used for propulsion (electricity, hydraulic...).
This power can be provided by the main engine (in case of auxiliaries coupled to propulsion)
or by auxiliary engines (generators, hydraulic units...).
The formula used to determine the load factor for propulsion is the same one as in the third
IMO study on greenhouse gases (2014) presented to MEPC 67 / INF.3:
DRC-19-168862-00408A 23 | 90 Pt, Vt and tt are respectively the instantaneous power, the speed and the draft
at time t, Pref is the reference power at the reference speed Vref and the
reference’s draft, tref (all three provided by Fairplay). If the draft at time t is
not given, we propose to take a load corresponding to 70% of the reference draft
(or maximum draft if not given) given by the Fairplay base.
n is an index that represents the relationship between power and speed. As for
the IMO study, we took n = 3. This value is generally used for displacement hulls.
ŋw represents the influence of the weather conditions (wave and wind) on the
speed and ŋf represents the forward resistance due to the state of the hull. We
assume them equal to 1.
To calculate the load factor, AIS data and ships characteristics from the Fairplay database
should be crossed. This is quite easy when the IMO number is known. When it is not the case,
we used the Maritime Mobile Service Identity (MMSI), with ship’s name and call sign instead.
Approximately 88.06% of the vessels recorded in the AIS database are registered in the
Fairplay database. The remaining 11.98% are small vessels under 24 m.
Using the Fairplay database we have been able to retrieve relevant information for:
99 % of main engines
55 % of auxiliary engines
95 % of reference's speeds
no indication for boilers
The vessels, for which no information on main engines and/or reference's speed is
documented have not been taken into account.
To estimate the power used by auxiliary engine, we assumed that:
for cruise, ROPax and Ferries, the load factor is about 55 % of maximum power of
auxiliary engines whatever the navigation phase;
for other vessels, load factor is about 60 % when manoevring, 40 % at berth or
anchored and 30 % in cruising phase;
If the auxiliary engines value does not exist, the methodology applied in the third
IMO study on greenhouse gases (2014) has been used. The estimation of the power
used by the auxiliary engines and boilers depends on ship’s type (bulk, chemical
tanker, cruise, oil tanker, general cargo, container, refrigerated cargo), ship’s
length, ship’s weight and navigation phase.
DRC-19-168862-00408A 24 | 90For the boilers, the same methodology as the one developed in the Third IMO study on
greenhouse gases (2014)8 has been used.
3.3 Results
The Table 1 below summarises the results achieved in terms of percentage of data we
managed to consolidate with the methodology described above. They are given for each
geographical zone of the domain and as a total throughout the domain.
Table 1 Compilation of information gathered and built-up to describe the maritime traffic in the Mediterranean
Sea
Zone 1 Zone 2 Zone3 Zone 4 Zone 5 Zone 6 Zone 7 Zone 8 Total
Percentage of IMO 57,85 74,16 64,73 70,34 50,73 87,76 85,10 93,75 73,05
tracked / all ships
Percentage of 83,16 87,16 84,75 85,97 87,02 83,13 85,30 87,14 85,46
trajectories
consolidated/IMO
ships
Percentage of No 42,15 25,84 35,27 29,66 49,27 12,24 14,90 6,25 26,94
IMO ships/all ships
The first row gives the percentages of ships that have been correctly characterized for
calculation of emissions. Globally, all ships referred by the IMO have been documented: the
last row gives the percentage of Non-IMO ships in data reported which corresponds to the
difference. As an average over the domain, 73% of ships have been documented. This
percentage is the lowest in zone 1 (along the French and Spanish coast) and in zone 5
(Adriatic Sea) where more pleasure yachts and small vessels (with tonnage lower than
100 GT) cruise compared to the other zones. It is expected that air emissions from those
categories are rather limited (they do not use heavy fuel oil) and that they can be negligible
in the feasibility study.
We also learn from these figures that almost ¾ of daily traffic in the Mediterranean Sea
come from cargos, tankers and passenger vessels with tonnage above 100UMS.
For these large ships, the second row gives the percentage of trajectories we have managed
to describe or to rebuild (Figure 11 and Figure 12).
8
http://www.iadc.org/wp-content/uploads/2014/02/MEPC-67-6-INF3-2014-Final-Report-
complete.pdf
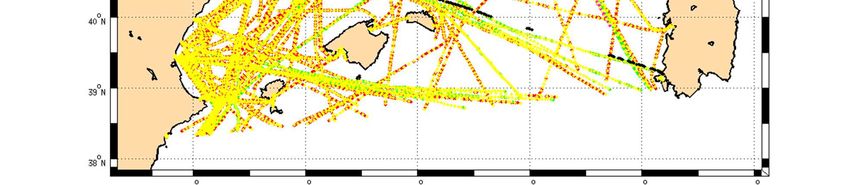
DRC-19-168862-00408A 25 | 90Figure 11 Example on zone 1 for one day: trajectories rebuilt in yellow, in green and red, initial trajectories and in black, trajectories that couldn’t have been interpolated Figure 12 Traffic density map with all AIS data used for the ECAMED study DRC-19-168862-00408A 26 | 90
4 Emission calculations
4.1 Methodology

4.1.1 Mathematical generic functions to determine emissions

The methodology to estimate shipping emissions in the framework of the ECAMED project is
the one recommended by European expert groups handled by official reporting frameworks
for the implementation of the EU national emission ceilings directive and protocols of the
UNECE Convention on Long Range Transboundary Air Pollution. Those groups publish
guidelines and reference documents that were used for ECAMED9.
According to these guidelines, the equation used to calculate emissions based on AIS data
from ships is:

                     ,   ,       ,    =               ∆         .        ,      , .    ,, , ,

in which:

    •  E = emission (tonnes),
    •  i = pollutant (NOx, NMVOC, PM, etc.)
    •  lon = ship's longitude
    •  lat = ship's latitude
    •  t= date and time of the ship on each lat/lon location data.
    •  j = engine type (slow-, medium-, and high-speed diesel, gas turbine and steam
       turbine).
    • m = fuel type (bunker fuel oil, marine diesel oil/marine gas oil),
    • p = the different phase of trip (cruise, hoteling, manoeuvring).
    • ∆t = duration since the last geographical position
    • e = engine category (main, auxiliary)
    • LF = engine load factor (%) at each geographical position
    • P = engine nominal power (kW)
    • EF = emission factor (kg/kWh) depending on type of vessel.
The input files provided by the CEREMA (see previous section and annex 1) allow to apply
this equation.

4.1.2 Application to the Mediterranean Sea

In the Mediterranean Sea, according to the MARPOL Convention, ships must use fuels with
different sulphur contents with respect to the ship types and the phases of the trip. The
following assumption were made to simulate emissions.

9
    EMEP/EEA   air   pollutant       emission   inventory   guidebook   2016.    1.A.3.d   Navigation   (shipping).
https://www.eea.europa.eu/publications/emep-eea-guidebook-2016/part-b-sectoral-guidance-chapters/1-
energy/1-a-combustion/1-a-3-d-navigation/at_download/file

DRC-19-168862-00408A                                                                                    27 | 90
4.1.2.1 Ships at berth more than 2 hours in EU-EEZ
If the ship (independently of its category) stays more than 2 hours in the EU-EEZ10, it must
use a fuel with a sulphur content of 0.1% maximum.
From the dataset, ships located at berth more than 2 hours in UE-EEZ, are selected if the
number of geographical location points for the trip at berth in UE-EEZ recorded is higher
than 8 per day (1 location every 15 minutes).
4.1.2.2 Cruise of passenger ships in EU-EEZ
Up to the beginning of 2020, the passenger type ships must use a fuel with a sulphur content
of 1.5% maximum for the cruise navigation phase and the berth phase less than 2 hours in
EU-EEZ.
From 2020, the fuel sulphur content must be at maximum 0.5%.
If a sulphur ECA (SECA) is adopted, the fuel sulphur content must not exceed 0.1% max.
To identify the passenger ships in cruise in UE-EEZ (except those staying more than 2 hours
at berth in UE-EEZ), the ships with the flag “ShiptypeLevel5” containing “passenger” have
been selected.
4.1.2.3 Other cases
Before 2020, in other cases, the ships (whatever their category) use fuels with sulphur
content limited to 3.5% (according to the emissions factors and activity data used for the
calculations performed in the study it is rather 2.7%).
After 2020, the fuel sulphur content must be at maximum 0.5%.
If a sulphur ECA (SECA) is adopted, the fuel sulphur content must not exceed 0.1% max.
The ships considered in this category are all other cases non-selected in the 2 previous cases.
4.1.3 Scenarios proposed
Different scenarios have been proposed.
4.1.3.1 Reference situation (2015/2016) (1516)
The reference scenario corresponds to the pollutant emissions estimated with the current
maritime traffic recorded in 2015 and 2016 and the current characteristics of engines and
fuels.
For information, in 2015/2016, data provided by CEREMA shows that ~ 50% of vessels are
categorised as Tier 0 and Tier I for NOx emissions and therefore ~ 50% of vessels are in the
Tier II category.
The fuels used for the scenario ref_1516 are therefore:
• Distilled fuel oil (MGO / MDO type) at 0.1% sulphur for ships staying more than 2 hours
at berth in the EU-EEZ;
• Heavy fuel oil (HFO) at 1.5% sulphur for passenger ships (excluding stops longer than
2 hours at berth) in EU-EEZ;
10
European Union – Exclusive Economic Zone
DRC-19-168862-00408A 28 | 90You can also read