What Humans Contribute to Atmospheric CO2: Comparison of Carbon Cycle Models with Observations
←
→
Page content transcription
If your browser does not render page correctly, please read the page content below
Earth Sciences
2019; 8(3): 139-159
http://www.sciencepublishinggroup.com/j/earth
doi: 10.11648/j.earth.20190803.13
ISSN: 2328-5974 (Print); ISSN: 2328-5982 (Online)

What Humans Contribute to Atmospheric CO2: Comparison
of Carbon Cycle Models with Observations
Hermann Harde
Experimental Physics and Materials Science, Helmut-Schmidt-University, Hamburg, Germany

Email address:

To cite this article:
Hermann Harde. What Humans Contribute to Atmospheric CO2: Comparison of Carbon Cycle Models with Observations. Earth Sciences.
Vol. 8, No. 3, 2019, pp. 139-159. doi: 10.11648/j.earth.20190803.13

Received: April 3, 2019; Accepted: May 11, 2019; Published: June 12, 2019

Abstract: The Intergovernmental Panel on Climate Change assumes that the inclining atmospheric CO2 concentration over
recent years was almost exclusively determined by anthropogenic emissions, and this increase is made responsible for the rising
temperature over the Industrial Era. Due to the far reaching consequences of this assertion, in this contribution we critically
scrutinize different carbon cycle models and compare them with observations. We further contrast them with an alternative
concept, which also includes temperature dependent natural emission and absorption with an uptake rate scaling proportional
with the CO2 concentration. We show that this approach is in agreement with all observations, and under this premise not really
human activities are responsible for the observed CO2 increase and the expected temperature rise in the atmosphere, but just
opposite the temperature itself dominantly controls the CO2 increase. Therefore, not CO2 but primarily native impacts are
responsible for any observed climate changes.
Keywords: Carbon Cycle, Atmospheric CO2 Concentration, CO2 Residence Time, Anthropogenic Emissions,
               Fossil Fuel Combustion, Land Use Change, Climate Change

                                                                    [2]; CICERO [3]) and the Fossil Fuel Emissions (FFE)
1. Introduction                                                     (CDIAC [4]), while environmental effects are supposed to
   Following the interpretation of the Intergovernmental            have been constant over the last 270 yr. We show that the
Panel on Climate Change (IPCC) the inclining atmospheric            main consequence of isolating the anthropogenic carbon
CO2 concentration over recent years is assumed to result            cycle from the natural cycle is to introduce a new time scale,
almost exclusively from anthropogenic emissions, and as a           the adjustment time, which differs significantly from the
consequence of the greenhouse effect this increase is made          residence time, the latter characterizing the natural uptake of
responsible for the rising temperature over the Industrial Era      CO2 from the atmosphere by extraneous reservoirs.
(see, 5th Assessment Report, AR5 [1]). These predictions are           We compare respective simulations of these approaches
based on more or less refined theoretical models of the             with actual observations at Mauna Loa (Keeling et al. [5];
carbon cycle and their comparison with observations. But            AR5 [1] Chap.6-Fig.6.3, p. 476), and we contrast them with
good agreement between calculations and observations is             our alternative description of the atmospheric carbon cycle
only a necessary, not sufficient prerequisite for reliable          (Harde [6]), which is based on a first order absorption pro-
simulations, they must also be in conformity with all natural       cess for the full cycle with only one time scale, the residence
causalities. Because of the expected far reaching                   time, and additionally including temperature dependent
consequences of anthropogenic carbon on future climate              natural variations of the emission and uptake of CO2.
changes this was motivation enough to critically scrutinize            We do not model carbon in the complete Earth-Atmos-
the main assumptions used in these carbon cycle models.             phere System, we only focus upon CO2 in the atmosphere,
   In this contribution we consider three theoretical               which is controlled by the governing Conservation Law.
approaches, which find favor with the IPCC and                         Based on this fundamental relation of mass conservation
predominantly focus on the influence of human activities            and a first order absorption process, we show that human
caused by Land Use Change (LUC) (see e.g., Le Quéré et al.          activities have a minor influence on the CO2 increase in the
                                                                    atmosphere, while the main contribution has to be explained
Earth Sciences 2019; 8(3): 139-159 140
by natural effects, particularly the temperature, which is this equation has to be solved numerically.
responsible for more than 85% of the CO2 increase since the
Industrial Revolution. Therefore, not CO2 but primarily
native impacts control any observed climate changes.
2. Physical Concept
The basis of our considerations is the balance for the influx
of CO2 into the atmosphere and the outflux from the
atmosphere to extraneous reservoirs, by which the CO2
concentration C in the atmosphere is controlled. This can well
be compared with a swimming pool (see also Salby [7]) with
an influx fin and an outflux fout, for which the changing amount
of water dmW in the pool over the time interval dt is given by
the difference of these fluxes:
dmW
= f in − f out . (1)
dt
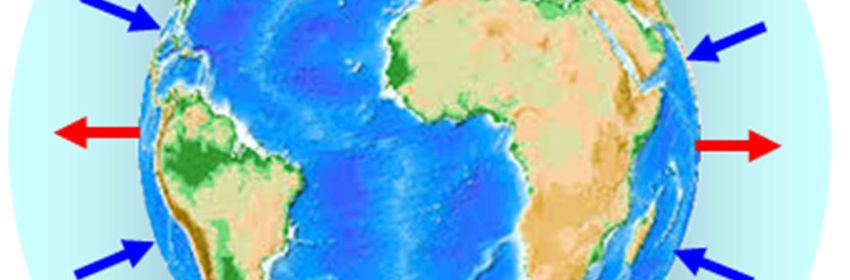
From a simple flux consideration we get the average Figure 1. Emissions of CO2 from the surface to the atmosphere (Red Arrows)
turnover or residence time τR it takes to completely exchange and absorption of CO2 by the surface (Blue Arrows).
the water in the pool. Under steady state conditions for fin = fout
then the total amount of water in the pool mW is exchanged In analogy to the pool example it follows that an exchange
within of CO2 in the atmosphere takes the time
C ( t ) C (t ) , (5)
τR =
mW mW ,
= (2) τR = =
f in f out eT (t ) aT (t )
and the other way round is this an important measure for the the so called residence time of CO2 in the atmosphere, and the
outflux rate absorption rate is
mW . C (t ) . (6)
fout = (3) aT (t ) =
τR τR
In the same way as for the pool we can consider the balance With (4) we do not model the carbon cycle in the complete
for atmospheric CO2 with a total emission rate eT(t) of CO2 Earth-Atmosphere System (EASy). That would require a
from the surface to the atmosphere, and reversely a total wider analysis, accounting for processes within extraneous
absorption rate aT(t) of the extraneous reservoirs (Figure 1). systems and exchanges between them. Our analysis focuses
Generally the influx can be split into natural emissions with a upon CO2 in the atmosphere, which is controlled by the
rate eN(t) and an additional anthropogenic emission rate eA(t), governing conservation law. Incidentally this physical law is
which on its part results from fossil fuel emissions and land characterized as a flawed one-box description (see e.g., Köh-
use changes. The outflux is determined by temporary or con- ler et al. [8]), because a single balance equation - so the
tinuing absorption of CO2 by oceans and the land. Incidentally argument - does not account for details in other reservoirs,
the total absorption rate aT(t) is also separated into a fraction systems that are extraneous to the atmosphere. As will be
aN(t), characterizing an uptake that can be addressed to the shown, such interpretation is confused. With the inclusion of
amount of natural emissions, and another contribution, aA(t), surface fluxes eT and aT, which account for influences on the
caused by the additional anthropogenic emissions. This results atmosphere, the balance equation (4) entirely determines the
in a total mass balance, the Conservation Law: evolution of CO2. Details of extraneous systems, which are
largely unobservable, are then irrelevant.
dC(t ) dCN (t ) dC A (t ) Atmospheric CO2 is fully described by this single equation
= + = eT (t ) − aT (t ) , (4)
dt dt dt for a reason. It follows from the 3-dimensional continuity
= e N ( t ) + e A ( t ) − a N (t ) − a A (t ) equation, the physical law that governs the global distribution
of atmospheric CO2. In flux form, the continuity equation is
which governs the atmospheric CO2 concentration. given by
Generally all these fluxes are changing with time and also
∂c
depend on the actual concentration C(t), which virtually may + ∇ ⋅ (v c) = c ∇ ⋅ v , (7)
be considered to consist of a time dependent fraction CN(t), ∂t
caused by native emissions, and of a time dependent anthro-
where the local CO2 concentration c is transported with
pogenic portion CA(t), with C(t) = CN(t) + CA(t). Thus, usually
141 Hermann Harde: What Humans Contribute to Atmospheric CO2: Comparison of Carbon Cycle Models with Observations
velocity v. When integrated over the volume of the fossil fuel emissions and temperature anomaly looks to be a
atmosphere and subjected to the divergence theorem, (7) strong indicator for the human influence as the driving force
reduces to the governing balance equation (4) for globally for a globally increasing temperature. But a closer look
averaged CO2. already reveals some systematic discrepancies, particularly
If this would be flawed, then so would be the fundamental between 1940 and 1970, where the emissions are further
physical law from which it follows. increasing, while the temperature stagnates or even slightly
The anthropogenic emissions eA(t) as the sum of the Land decreases. This has to be considered in some more detail, in
Use Change (LUC) (see e.g., Le Quéré et al. [2]; CICERO [3]) particular by directly comparing model calculations of the
and the Fossil Fuel Emissions (FFE) (CDIAC [4]) are CO2 increase, based on the fossil fuel emissions and land use
displayed in Figure 2. While LUC (Red-Brown) almost stays change, with the actual observations at Mauna Loa since 1958
constant over the last 170 years, FFE (Blue) is rapidly (Keeling et al. [5]; AR5 [1] Chap.6-Fig.6.3, p. 476).
increasing over recent years. Therefore, in this contribution we first investigate the
carbon cycle based on the IPCC's assumptions that the human
6
Fossil Fuel emissions are the dominant cause of the CO2 increase, before
Anthropogenic Emissions eA (ppm/yr)
Land Use Change
5 we extend the balance to the full carbon cycle also including
natural variations with their temperature dependence (see
4 also: Harde [6]; Salby [7, 10, 11]).
3
3. Anthropogenic Carbon Cycles
2
To explain the CO2 increase over recent years and to predict
1 its further progression, the IPCC assessment reports emanate
from equation (4), but they are using some restricting
0
1850 1880 1910 1940 1970 2000
assumptions (see AR5 [1] Chap.6), which can be summarized
Year
by the following statements:
Figure 2. Total anthropogenic emissions eA(t) due to land use change (Red- 1. Before 1750 and in first approximation also before 1850
Brown) and fossil fuel emissions (Blue). Data from Le Quéré et al. [2] and steady state conditions are presupposed with a CO2
CDIAC [4] displayed as stacked representation. concentration of CN0(1750) ≈ 280 ppm, which is
determined by constant natural emission and absorption
Figure 3 shows again the total anthropogenic emissions rates eN0 = aN0 of about 93 ppm/yr (AR5 [1]
(Red Squares) together with the temperature anomaly ∆T(t) Chap.6-Fig.6.1).
(Blue Triangles) of the global annual station temperature data
2. At this concentration and with these fluxes it follows
from the Goddard Institute for Space Studies (GISS) [9].
from (5) an average residence time τR (at pre-industrial
1.2
times: τR0) of CO2 in the atmosphere of
T-Anomaly
Anthrop. Emission 8
CN 0 CN 0
Anthrop. Emission eA (ppm/yr)
τ R0 = = = 3.0 yr . (9)
0.8 Fit Anthrop. Emission
T-Anomaly ∆T (°C)
6 eN 0 aN 0
0.4
0
4
Note: The same result is found from (4) for the in- and
-0.4
outfluxes in equilibrium and with an absorption rate
2
equivalent to (6), which is scaling proportional to the
-0.8 concentration CN0:
-1.2 0
dCN 0 C
1850 1880 1910 1940 1970 2000
= eN 0 − a N 0 = eN 0 − α R 0 ⋅ C N 0 = eN 0 − N 0 , (10)
Year dt τ R0
Figure 3. Anthropogenic emissions eA(t) (Red Squares) with exponential fit
(Green Graph) and global temperature anomaly (GISS-data, Blue Triangles). with αR0 = 1/τR0 as the absorptivity and τR0 now as the
e-folding residence time.
The anthropogenic emissions can be well approximated by 3. It is assumed that an increasing CO2 concentration over
an exponential of the form the last 170 years is almost exclusively caused by
anthropogenic emissions from fossil fuel combustion
e A ( t ) = e A0 ⋅ ( e ( t − t0 ) / τ e + b ) (8)
and land use change, while the natural emissions over
with parameters: eA0 = 0.026 ppm/yr, τe = 50 yr, t0 = 1750 yr this period are supposed to have been the same as in pre-
and b = 4. The integral over the emission rate agrees within a industrial times.
few ‰ with the integral of the estimated observations. The increasing concentration is attributed to only partial
On first glance the almost synchronous evolution of the re-absorption of the anthropogenic emissions, from
which a fraction, the so-called Airborne Fraction AF =Earth Sciences 2019; 8(3): 139-159 142
∆eA/eA, is assumed to remain in the atmosphere. Then airborne fraction of 48% (Green Crosses), 6% larger than the
average fraction over the Industrial Era. The smooth shape of
∆e A (t ) = AF ⋅ e A (t ) (11) the fits is the result of an integration over the full
anthropogenic emissions since 1750, where the soft increase
is the non-absorbed portion, which cumulates in the
of the curves is dominated by the 'average' emission rate,
atmosphere and
while even larger emission events are strongly flattened.
a A (t ) = e A (t ) − ∆e A (t ) = e A (t ) ⋅ (1 − AF ) (12)
7
400 Mauna Loa
AF = 42 %
Anthrop. Emission eA (ppm/yr)
6
represents the absorbed fraction of the anthropogenic
CO2 Concentration C (ppm)
AF = 48 %; e_A - 0.21 ppm/yr
370 Anthrop. Emission
emissions. Actually the IPCC emanates from an airborne 5
fraction of AF = 44% (AR5 [1] Chap.6, p. 495; Le Quéré 340 4
et al. [12]). 3
310
4. To account for a changing uptake of extraneous
2
reservoirs with increasing atmospheric concentration the 280
1
absorption is supposed to consist of a series of different
exponential decay terms representing the uptake of the 250 0
1850 1880 1910 1940 1970 2000
different reservoirs with different time constants. This Year
absorption is considered to be proportional to the human Figure 4. Calculated CO2 concentration with an airborne fraction of 42%
emissions, not the actual concentration C (see (12)). (Green Line) compared with observations at Mauna Loa (Blue Diamonds). A
Based on these assumptions more or less sophisticated simulation with AF = 48% and reduced emissions is plotted as Green Crosses.
approaches are known to explain the increasing CO2 Also shown are the anthropogenic emissions eA(t) (Red Squares).
concentration in the atmosphere. Three of them will be briefly
characterized and discussed in this contribution. They all 3.2. Bern Model
emanate from the same basic concept to isolate the natural A more advanced approach to describe the carbon cycle, is
carbon exchange between atmosphere and extraneous the so-called Bern Model of CO2 absorption (e.g., Joos et al.
reservoirs and only to consider the anthropogenic cycle. [14]), a prototype of similar treatments in other models. It
3.1. Constant Airborne Fraction distinguishes between different sinks on different time scales
and assumes a multi-exponential decay to re-equilibrate after a
With a constant natural emission and absorption rate over perturbation, e.g., caused by a transient spike of CO2 added to
the Industrial Era (eN0 = aN0) and also a constant airborne the atmosphere. Using the five-term fit to the Bern carbon
fraction over this period the balance equation (4) reduces to cycle model (Joos et al. [14]; Hansen et al. [15, 16]) the
the simple form adjustment following a δ-pulse perturbation ∆eP from
equilibrium emission eeq is supposed to be:
dC (t )
= ∆e A (t ) = AF ⋅ e A (t ) (13)
dt R (t ) = ( e(t ) − eeq ) / ∆e P
. (15)
= 0.18 + 0.14 ⋅ e −t / 420 + 0.18 ⋅ e −t / 70
and changes synchronously with eA(t). The concentration as a
function of time is found by simply integrating (13) over the + 0.24 ⋅ e −t / 21 + 0.26 ⋅ e −t / 3.4
Industrial Era:
1
t
C (t ) = C (1750) + AF ⋅ ∫
Relative ∆ 14 CO 2 , Perturbation
e A (t ' ) dt' . (14) 0.8
1750
From the carbon budget over the last 270 years we derive an 0.6
airborne fraction of AF = 42% (see Le Quéré et al. [2], Table
0.4
9). Then, with an initial concentration of C(1750) = CN0 = 280
ppm this results in a progression as shown in Figure 4 (Green Bern Model
0.2
Line), which for the last 60 yr can directly be compared with Meas. C14 Vermunt
Meas. C14 Schauinsland
measurements (Blue Diamonds) at Mauna Loa (Tans & 0
Exponential: tau = 15 yr
Keeling [13]). This comparison shows generally too high 1964 2014 2064 2114 2164
concentrations, particularly for past periods. This might be Year
caused by a too large initial concentration in 1750, but also the Figure 5. Decay of perturbation predicted by the Bern Model (Red Graph) as
slope does not fit very well. More likely is a too large emission calculated from (15). Also shown is the observed 14C decay (Circles and
rate, especially due to LUC, which anyway is only known Triangles) and an exponential fit with a decay time τ = 15 yr (Dashed Blue).
with an accuracy of about ± 50%.
Figure 5 shows the adjustment of the relative perturbation
A surprisingly good agreement can be found with an
R(t) over 200 yr (Red). Also displayed is the observed 14CO2
anthropogenic emission rate e'A(t), which as average over the
decay at Vermunt and Schauinsland (Levin et al. [17]) after the
considered period is reduced by 0.21 ppm/yr, and using an
stop of the atomic bomb tests, shown as relative143 Hermann Harde: What Humans Contribute to Atmospheric CO2: Comparison of Carbon Cycle Models with Observations
fractionation-corrected ‰-deviation ∆14CO2 from the Oxalic The calculated atmospheric CO2 concentration as given by
Acid standard. This decay is well represented by a single (16) is displayed in Figure 6 (Solid Green). The Bern Model
exponential with a decay constant of only 15 yr (Dashed shows the same tendency of too large calculated
Blue). Almost identical ∆14CO2 decays of 16.5 yr can be found concentrations as this was already found for the much simpler
from the data of Hua et al. [18] and Turnbull et al. [19]. model of constant airborne fraction (AF Model).
For calculating the atmospheric CO2 concentration by the With a reduced average anthropogenic emission rate, in this
Bern Model (e.g., Joos [14]), the emission of anthropogenic case of 0.18 ppm/yr, again a very good agreement with the
CO2 into the atmosphere is considered as a series of Mauna Loa data can be observed.
consecutive pulse inputs. Then the atmospheric CO2 But from basic causalities there exist some fundamental
concentration C(t) at time t is assumed to be the sum of earlier problems with the AF and the Bern Model:
emissions eA(t') at time t' multiplied by the fraction, now a 1. Additional emissions to the atmosphere even at a
time dependent airborne fraction, which is still available in the constant rate will never attain a new equilibrium.
atmosphere after the time t - t' and which is given by the pulse
2. These emissions will further accumulate in the
response function R(t - t') of (15). With an anthropogenic
atmosphere, in the Bern Model 18%, in the simple AF
emission rate, which can well be approximated by (8) (see
Model even 48%, emissions which will stay for ever in
Figure 3), it follows:
the atmosphere.
t
3. This is a consequence of the defect, that these models
C(t ) = C(t0 ) + ∫ eA (t' ) ⋅ R(t − t' ) ⋅ dt'
t0
essentially add up additional emissions deviating from
(16)
[
= C(t0 ) + eA0 ⋅ ce ⋅ e( t −t0 ) /τ e − c0 − c1 ⋅ e−( t −t0 ) /τ1
pre-industrial times, and they only consider partial
uptake, which is scaling proportional with the emission
− c2 ⋅ e−( t −t0 ) /τ 2 − c3 ⋅ e−( t −t0 ) /τ 3 rate – and not with the concentration.
− c4 ⋅ e−( t −t0 ) /τ 4 + 0.18⋅ b ⋅ (t − t0 ) ] 4. The Bern Model uses different time scales for the uptake,
although the 14C-decay shows a single exponential decay
with: of only 15 yr or shorter.
ce = 0.18 ⋅ τ e + 0.14 ⋅ τ e1 + 0.18 ⋅ τ e 2 + 0.24 ⋅ τ e 3 + 0.26 ⋅ τ e 4 ; 5. Even natural year-to-year variations of only 1%, El
Niños and volcanic activities comparable or even larger
c0 = 0.18 ⋅τ e − b ⋅ (0.14 ⋅τ 1 + 0.18 ⋅τ 2 + 0.24 ⋅τ 3 + 0.26 ⋅τ 4 ) ; than the human emissions, will cumulate in the
atmosphere, since only additional emissions but not
c1 = 0 .14 ⋅ (τ e1 + b ⋅ τ 1 ); c 2 = 0.18 ⋅ (τ e 2 + b ⋅ τ 2 ) ; adequate sinks are considered in these models.
To avoid some of these deficits another class of models uses
c 3 = 0.24 ⋅ (τ e 3 + b ⋅ τ 3 ); c 4 = 0.26 ⋅ (τ e 4 + b ⋅ τ 4 ) ; a first order absorption process, but applies this only to
concentration changes CA(t) caused by anthropogenic
τ ei = τ e ⋅ τ i /(τ e + τ i ); τ e = 50 yr ; τ 1 = 420 yr ; emissions.
τ 2 = 70 yr ; τ 3 = 21 yr ; τ 4 = 3.4 yr ; b = 4 ; 3.3. Absorption Scales with Concentration
This approach also presupposes an equilibrium CO2 Since the anthropogenic absorption rate aA(t), by
concentration Ceq in 1750 of Ceq = 280 ppm, and it excludes any presumption, is proportional to the man-made emission rate
further variations in the natural emission rate over the Industrial eA(t) (see Eq.(12)) and this rate on its part directly determines
Era. the anthropogenically induced fraction of the CO2
concentration CA(t), in analogy to (6) or (10) we infer:
7
400 Mauna Loa C A (t ) , (17)
Bern Model 6 a A (t ) = e A (t ) ⋅ (1 − AF ) ⇒
τA
Anthrop. Emission eA (ppm/yr)
CO 2 Concentration C (ppm)
B-M: e_A - 0.18 ppm/yr
370
Anthrop. Emission 5
340 4 which converts the absorption term in (4) to a first order
3 process scaling proportional to the anthropogenic fraction
310
2
CA(t) of the concentration (for a similar approach see e.g.:
280 Siegenthaler & Sarmiento [20]; Dietze [21]; Cawley [22];
1
Lüdecke & Weiss [23]). For eN0 = aN0 this results in the
250
1850 1880 1910 1940 1970 2000
0
balance equation:
Year
dC(t ) dCA (t ) C (t ) C (t ) − C N 0 (18)
Figure 6. Comparison of the Bern Model (Green Graph) with the Mauna Loa = = eA (t ) − A = eA (t ) −
data (Blue Diamonds). A simulation with reduced emission eA(t) - 0.18 ppm/yr
dt dt τA τA
is displayed as Green Crosses. Also shown are the original data of
anthropogenic emissions eA(t) (Red Squares). with τA as the respective absorption time of molecules in the
atmosphere, which in the IPCC terminology controls theEarth Sciences 2019; 8(3): 139-159 144
'adjustment' of the atmosphere only due to anthropogenic exchange as a closed cycle, which happened in this way
emissions. From Figure 4 and with (17) we can estimate this unaffected over thousands of years without larger variations.
'adjustment' time, which for CA = (393-280) ppm = 113 ppm, But when looking to the glacial and interglacial periods or
eA = 4.7 ppm/yr (all values averaged over 10 years from only to the Holocene we have to recognize that the
2007-2016, see Le Quéré et al. [2], Table 7) and the fitted AF atmospheric CO2 concentration was always varying over
= 48% from Figure 4 gives longer and shorter periods. Slow variations per se are no sign
of non-equilibrium, they can also result from varying emission
C A (t )
τA = = 46 yr . (19) strengths over time. But an adaptation to such natural
e A (t )(1 − AF ) variations is not possible, when emissions are only
cumulating, as this is assumed in the AF and Bern Models for
Numerical integration of (18) with this 'adjustment' time,
anthropogenic emissions, which never come to equilibrium.
with the given emission rate eA(t) and a native concentration
Thus, an adaptation to volcanic activities, temperature
CN0 = 280 ppm is shown in Figure 7 (Green Line). For a
variations or even to the seasonal variations requires an
corrected emission rate e'A(t) = eA(t) - 0.3 ppm/yr and the
absorption process for the native cycle, which behaves more
'adjustment' time from (19) also this accounting scheme
or less proportional to the respective concentration CP(t) at
(Green Crosses) gives good agreement with the observations
pre-industrial times, in a similar way as considered in the 3rd
at Mauna Loa (Blue Diamonds). This absorption time is
model for the anthropogenic emissions.
almost identical with an adjustment time of 48 yr as derived
So, it is close by to presuppose also a first order process for
from a simple flux calculation presented in Harde [6], Eq. (9).
the native cycle, and the respective balance equation for
7 pre-industrial times then assumes the form, analogous to (10):
400 Mauna Loa
tau = 46 yr
Anthrop. Emission eA (ppm/yr)
6 dCP (t ) C (t ) (20)
= eP ( t ) − P
CO 2 Concentration C (ppm)
tau = 46 yr, e_A - 0.3 ppm/yr
τ RP
Anthrop. Emission
370 dt
5
340 4
with eP(t) as the emission rate and τRP as the residence time at
3 pre-industrial times. Equilibrium is achieved when the left
310
2
side of (20) is zero. Then the residence time becomes τRP =
280 CP(t)/eP(t).
1
The same relation was found from the simple flux model
250 0 with a residence time τR0 = 3 yr at 1750. Such a residence or
1850 1880 1910 1940 1970 2000
Year
absorption time for the natural cycle is in good agreement with
the observed seasonal variations and is also supported by the
Figure 7. Calculation of the CO2 concentration for an adjustment time τA = 14
46 yr (Green Line) and comparison with observations at Mauna Loa (Blue
C-decay as will be discussed in detail in subsection 5.7.3.
Diamonds). A simulation with reduced emissions is displayed as Green When CO2 concentrations were continuously changing in
Crosses. Also shown are the anthropogenic emissions eA(t) (Red Squares). pre-industrial times we also have to inquire:
2. Can the natural cycle really be assumed to have been
3.4. Influence of Native Effects
constant over the last 270 yr?
So, with the right parameters all investigated approaches Almost every day we recognize natural phenomena and
can reproduce the observations at Mauna Loa very well. But processes in form of significant perturbations or variations,
all these models are based on different hypotheses and e.g., volcanic eruptions, earthquakes, El Niño - La Niña
boundary conditions, some of them are even in contradiction events, internal and external oscillations, global warming or
to each other. Therefore, only one or none of them may be seasonal variations.
right. Good conformity with observations alone is not a All these phenomena have a direct influence on the
sufficient criterion for testing the validity of a model, it must naturally caused fraction CN(t) of CO2 in the atmosphere.
also be in agreement with basic physical principles. They Therefore, the balance for the natural cycle also over the
alone can give us the physically consistent explanations for a Industrial Era has to be expressed explicitly by a time
carbon cycle, which is dominated by more than 95% of native dependent emission rate eN(t) and also a time dependent
emissions and underlies continuous environmental impacts. It residence time τR(t). The latter can slightly be affected by
is also evident that this cycle is governed by the same internal or external variations, but should not significantly
principles at paleoclimatic times as today with human deviate from pre-industrial times or 1750. Otherwise the
emissions. balance must obey the same principal relation as in
Thus, for the further considerations it seems reasonable first pre-industrial times with:
to concentrate on three basic questions:
dCN (t ) C (t )
1. How could nature be in equilibrium before the Industrial = e N (t ) − N . (21)
dt τ R (t )
Era?
Some climate scientists consider the natural carbon Finally we have to ask:145 Hermann Harde: What Humans Contribute to Atmospheric CO2: Comparison of Carbon Cycle Models with Observations
3. Can the anthropogenic cycle be considered separately 4. There exists no evidence that the absorption was
from a natural cycle? suddenly saturating and the residence time τR jumping up
From the preceding discussion one may conclude that the by one or two orders of magnitude from τR0 to τA, when
total balance equation for the respective models looks like the atmospheric concentration exceeded a level of 280
ppm. τR can only have changed continuously from
dC(t ) dCN (t ) dCA (t) pre-industrial to present times from 3 to 4 yr,
= +
dt dt dt synchronously with the atmospheric concentration and in
(22)
eA (t ) ⋅ AF AF Model agreement with (5) and (9).
C (t ) 5. The observed exponential decay of 14C in the atmosphere
= eN (t ) − N + eA (t ) ⋅ R(t'−t) Bern Model
τ R (t) after the stop of the atomic bomb tests in 1963 is a strong
eA (t ) − CA / τ A 1. Order Mod.
indication for a first order absorption process of CO2 by
In all cases is this equation controlled by two or more land and oceans with a unique time constant determined
independent time scales, a fast scale with τR ≈ 3 yr for the by the gross flux of CO2 from the atmosphere to the
absorption of natural emissions and a slow scale with an reservoirs (see Figure 5). Only such an absorption
infinite decay for 48% of emissions in the AF Model, with 5 ensures that the carbon cycle can stabilize and react
decay times for different sinks in the Bern Model, and an adequately on any temporal perturbations like seasonal
adjustment time of 46 yr in the 3rd model, all for the variations or volcanic activities.
adaptation of the atmosphere to additional anthropogenic 6. For parallel absorption processes by the oceans, by the
emissions. biosphere or rock weathering the absorptivity α is given
At least here it gets obvious that naturally and human as the sum of the individual channels αi with αR = α1 +
emitted molecules cannot be treated differently. As long as no α2 +.. + αN and τR = 1/αR. The uptake is not restricted by
saturation in the uptake is observed, which is not the case (see the slowest process as assumed in the Bern Model, but by
Appendix A), an additional emission by humans must underlie the sum of all processes with one unique absorptivity αR
the same absorption process as the natural emissions. A sepa- for all molecules. The reciprocal of αR is the residence
ration is in startling contradiction to the Equivalence time τR of CO2 in the atmosphere.
Principle, and as a consequence of this principle only one These principles are incorporated in a balance equation, the
absorption time, τR, with the same absorption behavior for General Conservation Law, which on the one side includes
human and native emissions must exist. temperature dependent and, thus, time dependent natural and
anthropogenic emissions, and on the other side considers a
4. Complete Carbon Cycle temperature dependent unique residence time τR, which
describes the collective or net absorption of all molecules. It
The preceding considerations show that a realistic analysis does not differentiate between a residence or adjustment time:
of the CO2 exchange between the atmosphere and its adjacent
reservoirs has also to include natural variations due to tempe- dC (t ) C (t ) . (23)
= eN (T (t )) + eA (t ) −
rature effects or temporal events. It has also to consider a com- dt τ R (T (t ))
mon absorption of all natural and human contributions, which
are scaling proportional to the apparent CO2 concentration and In first order the natural emission rate and the residence
which are represented by one unique decay time (see also: time can be assumed to increase linearly with the temperature
Essenhigh [24]; Salby [7, 10]; Harde [6]; Berry [25]). anomaly ∆T:
We summarize the main deviations from the previously
e N (T (t )) = eN 0 + β e ⋅ ∆T (t ) . (24)
discussed accounting schemes by the following fundamental
principles: τ R (T (t )) = τ R 0 + βτ ⋅ ∆T (t )
1. Changes in the natural carbon cycle, which are due to a
βe and βτ are the temperature coefficients of the natural
continuous temperature increase over the Industrial Era,
emission and the absorption time. In the general case of a
are included in the balance equation (4) by a temperature
saturating uptake by the extraneous reservoirs τR will
dependent term for the natural emissions and also a term
additionally change with C. But up to now any unequivocal
for the temperature dependent absorption.
saturation effects cannot be identified (see Appendix A).
2. Perturbations from an equilibrium concentration Ceq due
With the temperature anomaly ∆T(t) and the anthropogenic
to natural changes or additional anthropogenic emissions
emissions eA(t) as represented in Figure 3, Eq.(23) can be
are compensated for or controlled in the carbon cycle by
solved numerically.
an absorption rate, which changes proportional to the
Figure 8 shows the simulated CO2 concentration in the
actual concentration C (first order process, see Eq. (6)).
atmosphere (Green Graph) over a time period 1880 - 2016, for
3. Molecules emitted to the atmosphere can have a number
which reliable temperature data are available (GISS [9]),
of different sources, natural and man-made sources, but
whereas the direct CO2 measurements at Mauna Loa (Blue
(up to now) they have only common natural sinks in
Diamonds) started not before 1958. The temperature data
form of the oceans and continents, which do not
were used as moving average over ±5 yr. We achieve good
differentiate between the native or anthropogenic origin.Earth Sciences 2019; 8(3): 139-159 146
agreement with the observations for a natural emission rate eN0 evolution at Mauna Loa could also be reproduced without
= 93.3 ppm/yr, τR0 = 3 yr (both in agreement with (9)) and involvement of eA(t), contrary to the IPCC interpretations.
temperature coefficients βe = 10 ppm/yr/°C and βτ = 0.37 Up to now we were only considering the seasonally
yr/°C. Similar good results are obtained with larger βe (up to averaged CO2 measurements, but it is also worthwhile to look
24 ppm/yr/°C) and smaller βτ (→ 0) or vice versa with βτ (up closer to the monthly data at Mauna Loa (see Keeling et al.
to 0.74 yr/°C) and smaller βe (→ 0). Thus, we have to assert [5]; AR5 [1] Chap.6-Fig.6.3, p. 476) as displayed in Figure 9
that as long as the natural and anthropogenic emission rates (Magenta Diamonds). The “sawtooth” curve is an obvious
and at least one of the temperature coefficients are not more indication for the direct variation of the CO2 emission and
accurately known, we can only determine a combination of uptake rates, driven by the solar activity and the temperature
these parameters, not their absolute values. over the seasons. Generally this modulation is attributed to the
Figure 8 also displays a simulation for which the greater land mass on the Northern Hemisphere, where the
anthropogenic emissions were set to zero (Magenta). uptake by photosynthesis predominantly occurs during the
growing season, while CO2 release by heterotrophic processes
400 Mauna Loa
17 ppm
is more dominant over the other seasons.
T-Dep. & Anthr. Emission
CO 2 Concentration C (ppm)
Only T-Dependance
380 Only Anthr. Emission
420 35
360
400
CO 2 Concentration (ppm)
340 30
Air Temperature (°C)
320 380
25
300 360
280 20
340
260
1880 1900 1920 1940 1960 1980 2000 2020 15
320
Year CO2-ML
T-Air
300 10
Figure 8. Calculated CO2 concentration with temperature-dependent 1958 1968 1978 1988 1998 2008 2018
emission and absorption (Green). Compared against the observed record of
Year
CO2 from Mauna Loa (Blue Diamonds). Simulation without anthropogenic
emissions (Magenta), and only human activities (Blue). Figure 9. Monthly time series of measured CO2 concentration at Mauna Loa
(Magenta Diamonds) and air temperature record at Hawaii (Blue Triangles).
The difference between both curves results from the human
activities. These graphs evidently show that, based on (23), the However, apparently also local effects have a direct
anthropogenic contribution to the observed CO2 increase over influence on this record. Figure 9 shows also the monthly
the last 150 years is significantly less than the natural averaged air temperature at Hawaii (Blue Triangles) with
influence. So, as an average over the period 2007- 2016 the seasonal variations of 3 - 4°C (NOAA [26]). Almost
anthropogenic emissions were contributing not more than synchronous changes are found for the sea surface
4.3% to the total concentration of 393 ppm and thus, their temperature (NOAA [27]). The CO2 concentration follows
fraction to the atmospheric increase since 1750 of 113 ppm is these temperature variations with a delay of 6 - 7 months (see
not more than 17 ppm or 15%. The dominating contribution also Salby [7]).
with 85% is determined by natural influences, in Figure 8
420
represented as difference of the Magenta Graph to the 280
ppm grid-line. 400
CO2 Concentration (ppm)
The pure anthropogenic contribution to the atmospheric 380
concentration, which would result without temperature
360
effects, is shown by the Blue Graph on a constant background
of 280 ppm. With a residence time of τR0 = 3 yr human 340
emissions cannot contribute more than 14.5 ppm, and with an
increasingτR over the Industrial Era due to the temperature
320 CO2-Measurement at ML
CO2-Simulation
τR0 = 3 yr
influence it will slightly increase to 17 ppm, as displayed by 300
1958 1968 1978 1988 1998 2008 2018
the difference between the Green and Magenta Graphs (see Year
red arrow). At equilibrium the relative contribution of human
Figure 10. Monthly CO2 concentration integrated from the balance equation
activities to the total CO2 concentration is always determined
with temperature-dependent emission and absorption and an initial residence
by the anthropogenic to the total emission rate, independent of time of 3 years (Blue Triangles). Compared against the observed record of
the actual residence time (Eq.(23); Harde [6], Eq.(14)). CO2 from Mauna Loa (Magenta Diamonds).
Note, a simulation without anthropogenic emissions, but
slightly increased temperature coefficients (βτ = 0.48 yr/°C or A calculation with human emissions included and using the
βe = 13.3 ppm/yr/°C) lifts the Magenta curve to coincide modulated air temperature anomaly ∆T(t) at Hawaii (NOAA
almost exactly with the Green graph. Thus, the observed [26]) is shown in Figure 10 (Blue Diamonds). This excellent147 Hermann Harde: What Humans Contribute to Atmospheric CO2: Comparison of Carbon Cycle Models with Observations
agreement with the monthly Mauna Loa CO2 measurements time scale ensures a sufficiently long cumulation time of the
(Magenta Diamonds) is obtained by applying a linear response molecules in the atmosphere to attain a concentration level,
of the natural emissions to the modulated temperature which is in agreement with the observations. But it looks quite
anomaly, and assuming a residence time with an initial value dubious that 280 ppm, equivalent to the environmental
of τR0 = 3 yr and an averaged slightly nonlinear temperature fraction, are exchanged with extraneous reservoirs within 3-4
increase ∆T1.5(t), which accounts for the nonlinear response of yr, and for about 45% of additional human emissions an
oceanic emissions and the uptake of CO2 (see Subsection 5.6). accumulation over thousands of years in the atmosphere is
It should be mentioned that the averaged air temperature at assumed.
Hawaii is distinguished by a quite linear increase over time. Effectively represents an 'adjustment' time τA nothing more
Therefore, different to Figure 8 also smaller deviations at than an amplification factor for the anthropogenic emission
about 1970 are completely disappearing. rate to fit with the observations. This is obvious for the
A detailed analysis of the Mauna Loa curve (Salby [7, 10, approach described in subsection 3.3 (see Eqs.(18) and (19)),
11]) and independent cross-correlation investigations of where the integrated net flux is proportional to eA(t) and τA.
thermally induced emission (Humlum et al. [28]) indicate that But implicitly this is also concealed in the other two schemes.
the actual absorption time of 3-4 yr, as derived from (9) and In the case of a constant airborne fraction the 'adjustment'
based on the IPCC's own estimates, may even be significantly time for the fraction ∆eA = AF⋅ eA(t), cumulating in the
shorter, as short as only 8–12 months, this at least over the atmosphere, is even infinite. Under such conditions already
vegetation growths' periods on land and in oceans, but also in any additional constant emission contributes to a linear
areas such as the North Atlantic with cold downwelling increase of the concentration, whereas any changes in the
waters. Under such conditions, in the same way as the emission rate only slightly affect the further shape of this
residence time is getting shorter, the total emission rate gets increase. In such case - with an infinite lifetime of additionally
larger (generally the most uncertain parameter of the guessed emitted molecules in the atmosphere and a given emission rate
rates). As the admixture of human generated CO2 is given by for FFE from CDIAC [4] and for LUC from Le Quéré et al. [2]
the percentage of anthropogenic to total emissions, also this (see Figure 2) - AF is now the only free parameter controlling
fraction further decreases. So, with an absorption time of τR0 = the size and steepness of the concentration growth rate (see
1 yr and a total emission rate of eT = 298 ppm/yr the (14)).
anthropogenic emissions of 4.7 ppm/yr do not contribute more From a simple balance of the increasing concentration and
than 1.6% or 6 ppm to the atmospheric CO2. However, for a the total emissions we derive a value for AF of 42%. A
more conservative assessment and in agreement with the realistic model then should reproduce the observations with
IPCC's estimates (AR5 [1], Chap.6-Fig. 6.1) we further this airborne fraction. But our previous simulations (see
emanate from conditions as derived from the simulations of Figure 4) showed that this does not fit in size and shape. The
Figures 8 and 10 with τR0 = 3 yr. discrepancy would even further increase, when additional
natural emissions due to a globally increasing temperature
5. Discussion have to be considered. Good consistency can only be found
with a reduced anthropogenic emission rate and a further
All presented schemes for simulating the atmospheric CO2 adapted AF.
concentration are based on the balance equation considering In the more elaborate Bern Model not only one, but even
the fluxes from extraneous reservoirs to the atmosphere and five new time scales are introduced. This is expressed by the
vice versa. However, as widely used in the literature, the response function with its five decay times (see (15)). While
approaches in Section 3 restrict these fluxes on anthropogenic the last term in (15) is similar to the decay described by the
emission-absorption cycles, whereas natural emissions and residence time τR, the others shall represent the limited uptake
their uptake are supposed to be the same since 270 years, and by different extraneous reservoirs with different time
thus, any changes in these fluxes are simply disregarded in the constants, one also infinite. A simulation with this response
total balance. In addition, two of these approaches use a function, which is equivalent with a time dependent airborne
unilateral balance for this cycle, only controlled by the fraction, reproduces quite well the general trend of the
influxes and independent of the actual atmospheric increasing concentration (see Figure 6), but in direct analogy
concentration. These deficits have some fatal consequences in to 3.1 and 3.3 satisfactory agreement with the free-air
the further interpretation of the carbon cycle. measurements at Mauna Loa is only obtained when reducing
the official anthropogenic emissions and neglecting any
5.1. New Time Scale additional natural emissions.
Sole consideration of anthropogenic fluxes is identical with 5.2. First Order Absorption Process
the introduction of a new time scale for the uptake of man-
made emissions (see subsection 3.4). Since these emissions Approaches 3.1 and 3.2 use a quite exceptional definition
and also their changes are more than one order of magnitude for the in- and outfluxes between the atmosphere and adjacent
too small to explain directly the observed concentration reservoirs. The respective absorption rates are considered to
changes over recent years, carbon-cycle models just introduce be independent of the actual atmospheric concentration,
an additional buffer factor, the 'adjustment' time. Such new instead they are supposed to scale in direct proportion to theEarth Sciences 2019; 8(3): 139-159 148
emission rate either with fixed or time variable airborne prevails as long as its concentration C or the difference
fraction. As long as this emission is not zero, the atmospheric remains nonzero, i.e., indefinitely.
concentration further increases, independent of its actual Different to subsections 3.1 and 3.2 approach 3.3 already
level; and also at constant emissions the system never reaches emanates from a first order absorption process, but it is also
steady state. restricted only to anthropogenic concentration changes.
However, when such unusual correlation between emission Basically an 'ansatz' in (22), third case, and considering
and absorption rates would really exist, this cannot only be changes relative to some reference concentration is correct,
restricted to anthropogenic emissions and switched off for when this also includes natural variations over the considered
native emissions. Due to the equivalence principle it should be time period. But the fundamental flaw in 3.3 is to introduce a
valid for both. Also for times before 1750 the absorption new, independent absorption constant, the adjustment time,
process cannot have been completely different to that over the for the uptake of the additional emissions instead of using the
Industrial Era or was suddenly changing with the first same absorption process, which already controls more than
anthropogenic emissions. 95% of the carbon cycle, and this - due to physical causalities -
The dramatic consequences when applying the Bern Model at pre- industrial times in the same manner as over the
to the total emissions are illustrated in Figure 11. This would Industrial Era.
result in an exploding atmospheric CO2 concentration (Green
Line) up to levels found 500 Mio. yr ago, and it would never 5.3. Environment as a Net Sink
allow steady state conditions as supposed before 1750. In From the observations of the atmospheric concentration and
average such an increase over the last 270 yr is equivalent to estimates of anthropogenic emissions it is widely inferred that
an AF = 35%. not natural but anthropogenic origin is responsible for the
10000 increasing atmospheric CO2. Writing the global atmospheric
Mauna Loa carbon budget in the form (see e.g., Cawley [22])
B-M: e_N+e_A
CO 2 Concentration C (ppm)
8000 B-M: e_A - 0.18 ppm/yr
dC
− e A ( t ) = e N − aT < 0 , (25)
dt
6000
it is obvious that the net environmental flux, eN - aT can
4000 quite well be assessed without needing to know the absolute
magnitudes of eN or a T, quantities which on their parts are
2000 highly uncertain. Since the concentration changes dC/dt are
smaller than the anthropogenic emission rate, the left side
0 of (25) is negative and thus, the environmental uptake aT
1750 1800 1850 1900 1950 2000 must be larger than the natural emissions eN. From this
Year correct statement that the environment has acted as a net
Figure 11. Simulation of the CO2 concentration based on the Bern Model sink throughout the Industrial Era, however, often wrong
assuming the total emissions (Green). Also shown is a calculation for only conclusions are derived that nature cannot be the reason for
anthropogenic emissions (Green Crosses). Compared against the observed any observed CO2 increase.
record of CO2 from Mauna Loa (Blue Diamonds). For a moment let us assume eN may be the emission rate
at which the system was in balance, and eA may represent an
An uptake process only scaling with the emission rate and
additional rate of human or native emissions or of both. In
not the concentration looks completely unrealistic (see also
reality and in all discussed models with airborne fraction or
subsection 3.4). It must be dismissed, even when the
with first order uptake the concentration growth rate
simulation for the anthropogenic emissions alone (Green
develops slower than these additional emissions and thus,
Crosses) pretends good agreement with the Mauna Loa
a T gets larger than eN. So, with both sides of (25) getting
observations (Blue Diamonds).
negative this only means that with additional emissions,
A balance which only adds up net emissions, and denies an
native or humans, nature also acts as a further increasing
increasing absorption rate with inclining atmospheric
sink (compared to a previous equilibrium). As long as any
concentration, is in contradiction to real observations and
arbitrary fraction of human emission is involved, the
hurts fundamental physical laws. CO2 is not a noble gas,
environment is always a net sink. This is true per definition,
which indifferently accumulates in an open compartment after
since up to now no artificial uptake exists. But this does not
an emission, but it is dissolved in oceans and converted via
say anything about any additional native emissions over the
photosynthesis to organic molecules. This uptake obeys a first
Industrial Era, since emission and uptake are largely
order absorption process and scales with the actual
independent processes and the absorption does not impede
concentration or the difference to an external reservoir 1 . It
nature from increasing its own emissions.
A similar strange logic is used by Richardson [29], who
1
Diffusion processes which act proportional to the concentration difference
between two reservoirs, can be assumed to consist of an outflux proportional to the
atmospheric concentration Ca and an influx proportional to the concentration of the reservoir Cr.149 Hermann Harde: What Humans Contribute to Atmospheric CO2: Comparison of Carbon Cycle Models with Observations
considers mean values of the net atmospheric accumulation reservoirs on atmospheric CO2, details of other extraneous
= 1.7 ppm/yr and of the human emissions = reservoirs of carbon are entirely irrelevant. This feature of the
eA(t) = 3 ppm/yr in a balance governing physics is not only powerful, but fortunate.
Concerning carbonate chemistry, it is noteworthy that, in
dC / dt − dC A / dt = dC N / dt < 0 , (26) the Earth’s distant past, CO2 is thought to have been almost
2000% as great as its present concentration (e.g., Royer et.
in which with = eA(t) a priori any anthropogenic al. [30]). Most of that was absorbed by the oceans, in which
absorptions are embezzled. From this relation it is also carbon today vastly exceeds that in the atmosphere.
inferred that the average natural contribution has According to the IPCC, even in modern times the oceans
been to remove CO2 from the atmosphere, this with the same account for 40% of overall absorption of CO2 (AR5 [1],
wrong conclusion as Cawley that the long term trend of rising Fig.6.1). In relation to other sinks, their absorption of CO2
CO2 could not be explained by natural causes. This argument is clearly not limited (see Appendix A). Of that 40%, over
is disproved with Figures 8 and 10. The fact that the the Industrial Era anthropogenic CO2 represents less than
environment has acted as a net sink throughout the Industrial 1%. Contrasting with that minor perturbation in absorption
Era is a consequence of a dynamic absorption rate, which is is oceanic emission of CO2. Through upwelling of
only controlled by the total CO2 concentration C = CN + CA. carbon-enriched water, the oceans significantly enhance
So, also with additional native emissions and/or temperature natural emission of CO2 (Zhang [31]).
changes in the absorptivity the total uptake always tries - with Different to our approach, which takes into account
some time delay - to compensate for the total emissions which, human and also naturally varying emissions and
of course, also include the anthropogenic fraction. In other absorptions, the models in Section 3 emanate from such a
words: Since nature cannot distinguish between native and simple and apparently flawed description that over
human emissions, nature is always a net sink as long as human thousands of years CO2 was circulating like an inert gas in a
emissions are not zero. Thus, except for shorter temporary closed system, and only with the industrial revolution this
events like volcanic activities the environment will generally closed cycle came out of control due to the small injections
act as a net sink even in the presence of increasing natural by human emissions.
emissions.
To equate in (26) exclusively with human 5.5. Different Time Constants
emissions violates conservation of mass. Only when replacing
by , eq.(26) satisfies the Conservation The different time scales introduced with the models in
Law, and when additionally replacing by eq.(26) converts to (23). uptake of atmospheric CO2 molecules by the extraneous
Again we emphasize that a separate treatment of the native reservoirs. From physical principles it is impossible that an
and human cycle with their respective concentrations CA and absorption process would differentiate between naturally and
CN is possible if and only if no contributions are missing and anthropogenically emitted molecules. The temporal
the two balances are linked together in one rate equation with absorption or sequestration - except for smallest corrections
only one unitary residence time. due to isotopic effects - is for all molecules identical.
The absorption also cannot decline unexpectedly by more
5.4. Too Simple Model than one order of magnitude with the begin of the Industrial
Era or because of an additional emission rate of a few %.
Often climate scientists argue that changes of CO2 in the Observations show that no noticeable saturation over recent
atmosphere cannot be understood without considering years could be found (Appendix A).
changes in extraneous systems (see e.g., AR5 [1], Chap.6; Oceans and continents consist of an endless number of
Köhler et al. [8]), and they characterize the Conservation Law sources and sinks for CO2 which act parallel, emitting CO2
as a flawed 1-box description - because, a single balance into the atmosphere and also absorbing it again. In the same
equation would not account for details in other reservoirs. In way as the different emission rates add up to a total emission,
particular, they refer to carbonate chemistry in the ocean, the absorption rates with individual absorptivities αi - and
where CO2 is mostly converted to bicarbonate ions. As only each of them scaling proportional to the actual CO2
about 1% remains in the form of dissolved CO2, they argue concentration - add up to a total uptake as a collective effect
that only this small fraction could be exchanged with the
atmosphere. Due to this so-called Revelle effect, carbonate aT = α1C + α 2C + ... + α N C . (27)
chemistry would sharply limit oceanic uptake of = (α1 + α 2 + ... + α N ) ⋅ C = α R ⋅ C
anthropogenic CO2.
In regard to understanding changes of CO2 in the Collective absorption thus leads to exponential decay of
atmosphere, changes in extraneous systems are only perturbation CO2 at a single rate
qualifiedly of interest. The governing law of CO2 in the
atmosphere (4) and in more elaborate form (23) is self α R = 1 / τ R = α1 + α 2 + ... + α N . (28)
contained. With the inclusion of the surface fluxes eT(t) and
aT(t) = C /τR(t), which account for influences of the adjacent This decay rate is faster than the rate of any individual sinkEarth Sciences 2019; 8(3): 139-159 150
and it prevails as long as its concentration C or its difference to as the main drivers for the observed CO2 increase in the
external reservoirs remains nonzero (see: Harde [6]; Salby atmosphere and also for the continuous climate changes over
[11]). the past and present times.
The above behavior is a consequence of the Conservation The various mechanisms, along with their dependence on
Law and in contrast to the Bern Model, where decay proceeds temperature and other environmental properties, could not
at multiple rates. A treatment of CO2 with a multiple have remained constant during the pre-industrial era. This
exponential decay obeys the following: inconsistency invalidates the fundamental assumption, that
natural emission and absorption during the pre-industrial
C = C10 e −α1t + C20 e −α 2t + ... + C N 0 e −α N t . (29) period did remain constant. Even less this is valid over the
= C1 + C2 + ... + C N Industrial Era, a period which is characterized by the IPCC as
the fastest rise in temperature over the Holocene or even the
Then differentiation gives: last interglacial.
So, the CO2 partial pressure in sea water approximately
dC
= −α1C10 e −α1t − α 2C20 e −α2t ... − α N C N 0 e −α N t changes with temperature as (pCO2)sw(T) = (pCO2)sw(T0)*
dt exp[0.0433*(T-T0)] (see: Takahashi et al. [32]) and thus, an
= −α1C1 − α 2 C2 ... − α N C N (30)
increase of 1°C causes a pressure change of about 18 µatm,
≠ −(α1 + α 2 + ... + α N ) ⋅ C which amplifies the influx and attenuates the outflux. From
observations over the North Atlantic Ocean (see, Benson et al.
At multiple decay rates the corresponding sinks operate, not [33]) it can be estimated that a pressure difference ∆pCO2
collectively, but independently. After a couple of their decay between the atmosphere and ocean of 1 µatm contributes to a
times, the fastest sinks become dormant. Overall decay then flux change of δfin ≈ 0.075 mol/m2/yr = 3.3 g/m2/yr. Therefore,
continues only via the slowest sinks, which remove CO2 with an Earth's surface of 320 Mio. km2 covered by oceans and
gradually. It is for this reason that such a treatment leaves a pressure change of ∆pCO2 = 18 µatm, under conventional
atmospheric CO2 perturbed for longer than a thousand years conditions the native influx from oceans to the atmosphere
(Figure 5). In contrast, the behavior required by the already increases by ∆fin ≈ 19 Pg/yr or 2.4 ppm/yr for an
Conservation Law decays as fast or faster than that of the average temperature incline of 1°C. An even stronger
fastest sink (see (28)). variation can be expected for the land vegetation with an
The observed decay of 14C shows that the corresponding increased decomposition and reduced uptake of CO2 at rising
absorption is determined by a single decay time and operates temperature (Lee [34]; Salby [11]).
on a time scale of only about one decade (see Figure 5). This Together this causes an incline of the atmospheric CO2 level
scale is the same for the natural carbon cycle as for the which is larger than all apparent human activities, but its
anthropogenic cycle. Therefore, it is unrealistic to differentiate contribution is completely neglected in the official accounting
between a residence time and different adjustment times. schemes.
In this context it should be noticed that due to re-emissions Also melting permafrost and emissions of volcanoes on
of 14CO2 from extraneous reservoirs the real residence time of land and under water as well as any emissions at earthquakes
14
CO2 in the atmosphere as well as that of the other are not considered. In addition, actual estimates of dark
isotopologues of CO2 can only be shorter, even shorter than a respiration suggest that under global warming conditions
decade (for details see subsection 5.7.3 and Appendix B). whole-plant respiration could be around 30% higher than
5.6. Temperature Dependence existing estimates (Huntingford et al. [35]). This longer list of
different native events and effects is completely embezzled in
According to (9) or (10) we see that with increasing the favored IPCC models.
atmospheric concentration over the Industrial Era from 280 to Equally inconsistent is the presumption that additional
400 ppm either the residence time must be increased with uptake of anthropogenic CO2, which represents less than 1%
temperature from 3 to about 4 yr, or τR is considered to be of the total over the Industrial Era, has, somehow, exceeded
constant and the total emissions were rising from 93 to about the storage capacity of oceans and other surface and
130 ppm/yr, synchronously increasing the concentration. Both sub-surface reservoirs, capacity which is orders of magnitude
these limiting cases are in agreement with a temperature greater. A reduced absorption is rather the consequence of
anomaly of about 1.2 °C over this period (see GISS [9]), when global warming than of saturation. Due to Henry's law and its
we assume the maximum temperature coefficients βτ = 0.74 temperature dependence not only the partial pressure in sea
yr/°C or βe = 24 ppm/yr/°C. However, generally both water increases, but also the solubility of CO2 in water
temperature induced natural emissions as well as temperature declines exponentially with temperature and, thus, reduces the
dependent absorptions together will dictate the inclining CO2 uptake. Often is this effect incorrectly misinterpreted as
concentration in the atmosphere. saturation caused by a limited buffer capacity and dependent
In any way, as we see from Figure 8, is the CO2 on the concentration level. But here we consider an uptake
concentration dominantly empowered by the temperature changing with temperature, as this is known for chemical
increase; with only one unique decay process not human reactions, where the balance is controlled by temperature.
activities but almost only natural impacts have to be identified How strongly the biological pump (see Appendix A) andYou can also read