Atmospheric Environment - Contents lists available at ScienceDirect - IIASA PURE
←
→
Page content transcription
If your browser does not render page correctly, please read the page content below
Atmospheric Environment 253 (2021) 118377
Contents lists available at ScienceDirect
Atmospheric Environment
journal homepage: http://www.elsevier.com/locate/atmosenv
Airborne nitrogen deposition to the Baltic Sea: Past trends, source
allocation and future projections
Michael Gauss a, *, Jerzy Bartnicki b, Jukka-Pekka Jalkanen c, Agnes Nyiri a, Heiko Klein a,
Hilde Fagerli a, Zbigniew Klimont d
a
Norwegian Meteorological Institute, P.O. Box 43, Blindern, 0313 Oslo, Norway
b
Institute of Meteorology and Water Management, National Research Institute, Podleśna 61, 01-673 Warsaw, Poland
c
Finnish Meteorological Institute, P.O. Box 503, 00101 Helsinki, Finland
d
International Institute for Applied Systems Analysis (IIASA), 2361 Laxenburg, Austria
H I G H L I G H T S
• Airborne nitrogen deposition to the Baltic Sea has decreased since the 1990s, and this trend is projected to continue.
• Germany, Poland, and Denmark are the main contributors to nitrogen deposition to the Baltic Sea.
• Agriculture and transport are the main contributing sectors to nitrogen deposition to the Baltic Sea.
• Agreed emission abatement will lead to large reductions in oxidized nitrogen deposition to the Baltic Sea by 2030.
• Reductions in ammonia deposition by 2030 will be smaller, reflecting the smaller decrease in ammonia emissions by 2030.
A R T I C L E I N F O A B S T R A C T
Keywords: Despite significant reductions in nitrogen emissions achieved in Europe during the last three decades, eutro
Nitrogen emissions phication remains an environmental concern in the Baltic Sea basin. Recently, a number of comprehensive
Atmospheric transport modelling studies have been conducted for the HELCOM Commission to inform the 2021 update of the Baltic Sea
Airborne nitrogen deposition
Action Plan. The calculations have focused on trends in airborne nitrogen deposition to the Baltic Sea and its nine
Baltic sea
Source allocation
sub-basins during the 2000–2017 period, the identification and ranking of the main contributors to deposition, as
well as future projections for 2030, assuming compliance with the Gothenburg Protocol and the EU NEC
Directive. This paper synthesizes the main results from these studies and puts them into the context of maximum
allowable nutrient inputs to the Baltic Sea.
According to our results, the airborne annual deposition to the Baltic Sea in 2017 amounted to 122.6 Gg(N) of
oxidized nitrogen and 105.3 Gg(N) of reduced nitrogen, corresponding to a decrease since 2000 by, respectively,
39% and 11%. In order to filter out the large inter-annual variability due to meteorology and to better reflect trends
in emissions, weather-normalized depositions of nitrogen have been calculated as well, according to which the
decreases since 2000 amount to 35%, 7% and 25% for oxidized, reduced and total nitrogen, respectively.
In 2017, Germany, Poland and Denmark were the most important contributors to airborne deposition of total
(oxidized + reduced) nitrogen to the Baltic Sea. Agriculture contributed most to reduced nitrogen deposition, while
the transport sector contributed most to oxidized nitrogen deposition. Agriculture in Germany was the single-most
important contributor to nitrogen deposition to the Baltic Sea in 2017 (accounting for about 15% of the total), but
there are numerous other important sectoral contributions. Emissions of nitrogen from the nine HELCOM Con
tracting Parties contributed 49%, 76% and 61% to oxidized, reduced and total nitrogen deposition, respectively.
Assuming full compliance with the EU NEC Directive and the Gothenburg Protocol, significant further re
ductions in nitrogen deposition can be achieved by 2030, down to an annual deposition of 72.7 Gg(N) and 84.7
Gg(N) of oxidized and reduced nitrogen, respectively.
* Corresponding author.
E-mail address: michael.gauss@met.no (M. Gauss).
https://doi.org/10.1016/j.atmosenv.2021.118377
Received 8 November 2020; Received in revised form 8 March 2021; Accepted 23 March 2021
Available online 30 March 2021
1352-2310/© 2021 The Author(s). Published by Elsevier Ltd. This is an open access article under the CC BY license (http://creativecommons.org/licenses/by/4.0/).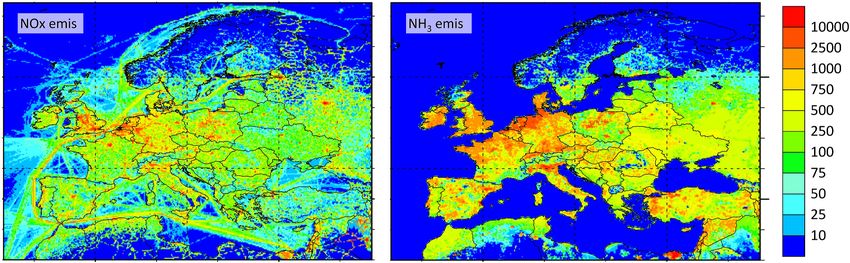
M. Gauss et al. Atmospheric Environment 253 (2021) 118377
1. Introduction kilometres (Simpson et al., 2011), until it is deposited either through dry
deposition (direct uptake on terrestrial or aquatic surfaces through
While nitrogen is generally considered as the primary limiting sedimentation, interception, and diffusion processes) or wet deposition
nutrient for phytoplankton in marine ecosystems (Howarth, 1998; (absorption into droplets followed by precipitation). Nitrogen deposi
Howarth and Marino, 2006), there are thresholds above which nutrient tion estimates cannot be directly assessed over large areas because of a
loads exceed the capacity for assimilation of nutrient-enhanced pro lack of measurements, especially of the dry deposition component
duction and degradation of water-quality occurs (Paerl, 1995; Diaz and (Simpson et al., 2011), which is why atmospheric composition and
Rosenberg, 2008; Voss et al., 2011). This can result in negative envi transport models are commonly used for this purpose (e.g. Asman et al.,
ronmental impacts such as toxic algal blooms, oxygen deficiency, loss of 1988; Hertel et al., 2003; Langner et al., 2009; Geels et al., 2012;
habitats and biodiversity, and decreases in harvestable fish resources Simpson et al., 2014; Claremar et al., 2017; Bartnicki et al., 2018).
(Rabalais, 2002). EMEP MSC-W (Meteorological Synthesizing Centre – West of EMEP,
Deposition of nitrogen remains a threat to biodiversity in Europe, the European Monitoring and Evaluation Programme under the LRTAP
including also ecosystems in the Baltic Sea region (Posch, 2018; Repka Convention) calculates airborne depositions of nitrogen to the Baltic Sea
et al., 2021). In particular in the Baltic Sea, eutrophication caused by routinely every year and provides these data to HELCOM in order to
increased input of the nutrients phosphorus and nitrogen is a major underpin environmental policy making at the regional level (e.g. Bart
environmental concern (Andersen et al., 2009; Ruoho-Airola et al., nicki and Fagerli, 2008; Bartnicki et al., 2011; 2017). In addition, con
2012; HELCOM, 2018). The majority of nutrient inputs are due to tributions from each HELCOM country2 to the Baltic Sea and each of its
anthropogenic activities on land and at sea and enter the Baltic Sea sub-basins are calculated. These numbers are then combined by the
either as waterborne inputs or as atmospheric (airborne) deposition working groups of HELCOM with data on waterborne input, to allow for
(Svendsen et al., 2015). an assessment of compliance with the MAI. Simply put, further re
The Baltic Marine Environment Protection Commission – also known ductions in nitrogen deposition are necessary as long as the MAI are
as the Helsinki Commission (HELCOM) – is an intergovernmental or exceeded.
ganization and a regional sea convention in the Baltic Sea area, con In addition to this annual routine work, two projects were accom
sisting of ten Contracting Parties, namely Denmark, Estonia, the plished in 2020 by EMEP MSC-W to assess contributions from different
European Union, Finland, Germany, Latvia, Lithuania, Poland, Russia1 emission sectors (road transport, power generation, etc.) and to estimate
and Sweden. The HELCOM Copenhagen Ministerial Declaration of 2013 potential benefits to be gained by 2030 from full compliance with the
on taking further policy action to implement the Baltic Sea Action Plan Gothenburg Protocol and the EU NEC Directive. These projects were
(BSAP) reconfirmed the need of reaching a good environmental status timely in regard to the update of the BSAP (HELCOM, 2020), which shall
for the Baltic Sea. The declaration includes nutrient reduction targets, be adopted at the HELCOM Ministerial Meeting in autumn 2021.
and therefore also addresses airborne nitrogen input to the Baltic Sea. While studies of nitrogen deposition to the Baltic Sea have been
The Declaration sets targets on both water- and airborne inputs. performed earlier, we provide in this paper, based on the three projects
Maximum Allowable Inputs (MAI) of nutrients indicate the maximal mentioned above and to our knowledge for the first time, a coherent
level of inputs of water- and airborne phosphorus and nitrogen to Baltic description of past trends, present status, and future projections in one
Sea sub-basins that can be allowed to fulfil the targets for a non- go, applying the same computational method and a consistent multi-
eutrophied sea (HELCOM, 2013). The amount of phosphorus being year set of new high-quality input data on emissions and meteorology.
deposited to marine areas from the atmosphere is in general considered The methods and input data used in these projects are described in
small in relation to other loads (Krom et al., 2004), but can contribute to Section 2. The status of nitrogen deposition to the Baltic Sea in 2017 and
fertilization of phytoplankton in the Baltic Sea especially during summer trends since the year 2000 are described in Section 3, while in Section 4
(Rolff et al., 2008; Berthold et al., 2019). The focus of the present paper we present the results from the source allocation study. The focus will be
is on airborne deposition of nitrogen, but for further information on on the policy-relevant question as to which countries and which emis
eutrophication by phosphorus in the Baltic Sea, the reader is referred to sion sectors contribute most to nitrogen deposition to the Baltic Sea and
the publications of Savchuk (2005; 2018), Rolff et al. (2008), Ruo to what degree these results vary among different sub-basins. The future
ho-Airola et al. (2012), Gustafsson et al. (2012), and Berthold et al. projection presented in Sector 5 will give hints as to how large a
(2019). reduction in nitrogen deposition to the Baltic Sea can be achieved by
The relevant policy to control emissions of nitrogen oxides and 2030 through compliance with the Gothenburg Protocol and/or agreed
ammonia to the atmosphere on regional scales is set in the framework of national emission ceilings. Conclusions and remarks on future work are
the UN ECE Convention on Long-Range Transboundary Air Pollution given in Section 6.
(LRTAP Convention). Under this Convention, the Gothenburg Protocol
(UN ECE, 2019) states that nitrogen oxide emissions in 2020 should be 2. Methods and input data
reduced by between 18% and 56% in 31 countries, with respect to 2005
annual emissions. Ammonia emissions should also be reduced, but by All results presented in this paper are based on calculations using a
smaller percentages (1%–24%). In the European Union, the Gothenburg state-of-the-art chemistry transport model, taking best available data on
Protocol is implemented by the EU NEC (National Emission Ceilings) emissions and meteorology as input. This section describes the model,
Directive 2016/2284/EU (EU, 2016), which sets 2020 and 2030 emis the required input data, and the methods to diagnose nitrogen deposi
sion reduction commitments for various air pollutants, including nitro tion and its sources.
gen oxides and ammonia. However, it is worth noting that in the case of
ammonia, the commitments set for 2030 are much stricter than the 2.1. The EMEP MSC-W model
Gothenburg Protocol reductions that were set for 2020.
Nitrogen is emitted from a large number of natural and anthropo The EMEP MSC-W model (hereafter referred to as the ‘EMEP model’)
genic sources (Galloway et al., 2004) and can be transported in the at is a 3-D Eulerian chemistry transport model (CTM) developed at EMEP
mosphere over long distances of up to hundreds or thousands of MSC-W under the Framework of the LRTAP Convention. The EMEP
1 2
Throughout this paper we use the short names ‘Russia’, ‘Czechia’, and ‘UK’ By ‘HELCOM countries’ we mean in this paper the nine countries that are
to refer to the Russian Federation, the Czech Republic, and the United Kingdom Contracting Parties to the Helsinki Commission. The ‘HELCOM country’ and
of Great Britain and Northern Ireland, respectively. ‘HELCOM Contracting Party’ are used as synonyms.
2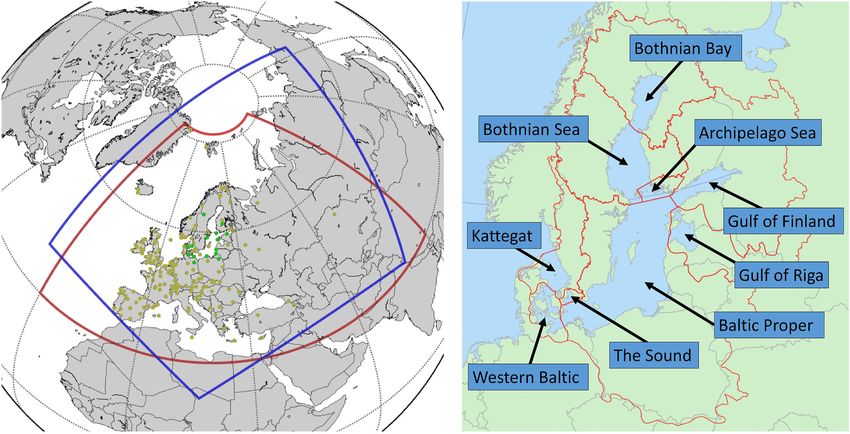
M. Gauss et al. Atmospheric Environment 253 (2021) 118377
model has traditionally been aimed at simulations of acidification, the projects described in this paper. The longitude-latitude domain is
eutrophication and air quality over Europe, to underpin air quality most common at EMEP MSC-W and was used to calculate the status for
policy decisions (e.g. the Gothenburg Protocol), and has undergone 2017, the trend simulations and the country-wise source allocation
continuous development for several decades in response to evolving (Sections 3 and 4), while for the sector-wise source allocation as well as
scientific knowledge and increasing computer power. The EMEP model the future projections we opted for the polar-stereographic domain
integrates comprehensive atmospheric chemistry in several hundred (Sections 4 and 5). That domain is covered by a somewhat coarser model
reactions involving hundreds of chemical species in the gas phase and grid and thus allows for the large number of simulations required for this
particle phase. The model was described in detail by Simpson et al. kind of assessment. Nevertheless, it is ensured in all experiments that the
(2012). Model updates since then, leading to version rv4.33 which was Baltic Sea basin, as well as all areas that are relevant to nitrogen depo
used in all calculations presented in this paper, have been described in sition in the Baltic Sea, are fully covered by the model domain and are
later EMEP Status reports (Simpson et al., 2019 and references therein). sufficiently far away from the model boundaries. The resolution in
In most applications, the model is driven by meteorological data from which the model was run will be specified per experiment in the
the ECWMF IFS (European Centre for Medium-Range Weather Forecasts respective Sections below.
– Integrated Forecast System). Land-use data are taken from the CORINE Fig. 1 also shows the location of the nine sub-basins of the Baltic Sea,
land-cover maps (de Smet and Hettelingh, 2001), the Stockholm Envi which will be in the focus of this study. Abbreviations and areas of these
ronment Institute at York (SEIY, which has more detail on agricultural sub-basins are listed in Table 1.
land-cover), the Global Land Cover (GLC2000) database (JRC, 2003),
and the Community Land Model (Oleson et al., 2010; Lawrence et al., 2.1.2. Parameterization of depositions
2011). More details about this can be found in Simpson et al. (2017). Here we only briefly describe the parameterization of nitrogen
For better transparency, but also to foster a larger user community, deposition, which is vital to the studies presented in this paper. For a
the EMEP model has for several years been publicly available as Open more detailed account the reader is referred to Simpson et al. (2012) and
Source code at https://github.com/metno/emep-ctm. the description of updates in Simpson et al. (2017; 2018). As acidifica
tion and eutrophication were among the main motivations for the cre
2.1.1. Model geometry ation of the EMEP Programme in the late 1970s, the EMEP model has a
The horizontal resolution of the EMEP model can be chosen between long tradition of calculating depositions.
about 5 km and 100 km, depending on the purpose of the study, the Briefly summarized, dry deposition in the EMEP model is based on
availability of necessary input data (meteorology, emissions, land-use, the so-called resistance approach, according to which the dry deposition
vegetation, etc.) and computer power. 20 vertical levels are used from flux of gas i to ground can be expressed as:
the surface to 100 hPa (about 30 km altitude), defined as sigma co
F i = − vi *Ci
ordinates. The lowest layer is about 45 m thick.
The EMEP model is an offline CTM, meaning that meteorology is not
where vi = deposition velocity and Ci = concentration of gas i, and the
computed online by the model but read in from other sources. In all
deposition velocity is calculated as:
calculations presented in this paper, 3-hourly data from the ECWMF IFS
/( )
version cy40r1 have been used. Horizontal resolutions between about 5 vi = 1 ka + kbi + kci
and 50 km have been applied, balancing accuracy and feasibility, as will
be further specified in the respective sections. where ka = aerodynamic resistance, kib = quasi-laminar layer resistance
The model domain and resolution can be chosen from small regional
to gas i, and kic = surface (canopy) resistance to gas i. All these
domains up to global coverage. Fig. 1 shows the model domains used in
Fig. 1. Left: EMEP model domains. Red outline: Longitude latitude grid covering the geographic area between 30◦ N and 82◦ N and 30◦ W-90◦ E used for the status and
trend studies of Sections 3 and 4; blue outline: polar-stereographic grid used for the source-receptor and future simulations of Sections 4 and 5. Sites measuring
nitrogen components are indicated by dots (green: HELCOM sites, yellow: all other sites). Right: The nine sub-basins of the Baltic Sea and their catchment areas. (For
interpretation of the references to colour in this figure legend, the reader is referred to the Web version of this article.)
3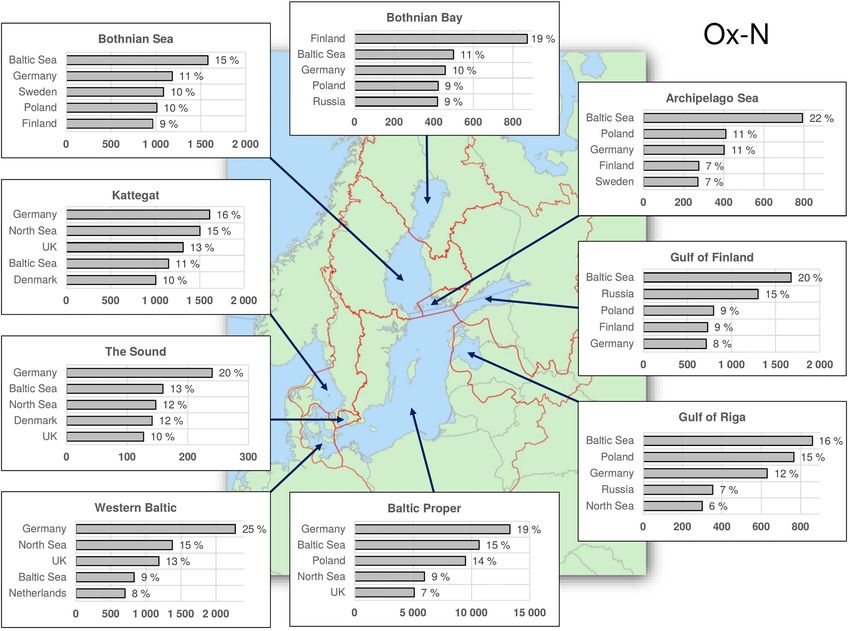
M. Gauss et al. Atmospheric Environment 253 (2021) 118377
Table 1 precipitation. Dry deposition is available only from idealized and local
The sub-basins of the Baltic Sea for which atmospheric nitrogen depositions are experiments in field campaigns or under laboratory conditions. Our
calculated, listed in alphabetical order, along with abbreviations, areas, and parameterization is based on laboratory measurements, and can be
their percentages of the entire Baltic Sea area. The Baltic Sea, abbreviated as evaluated indirectly by comparison of air concentrations of nitrogen
BAS, is the sum of the nine sub-basins defined by HELCOM and shown in the map compounds at as many stations as possible.
of Fig. 1.
To focus more on the Baltic Sea region we show in Fig. 2 comparisons
Sub-basin Abbreviation Area in km2 Percentage of daily time series of wet deposition of ammonium and nitrate with
Archipelago Sea ARC 13405 3.2% observations at HELCOM stations in Germany, Poland and Sweden in the
Baltic Proper BAP 209258 50.1% year 2017. Given the complexity of modelling wet deposition, and also
Bothnian Bay BOB 36249 8.7% its dependence on modelled precipitation (taken from the ECWMF IFS
Bothnian Sea BOS 65397 15.7%
model in this study), the performance can be considered as satisfactory.
Gulf of Finland GUF 29998 7.2%
Gulf of Riga GUR 18646 4.5% However, biases and correlations vary greatly from station to station.
Kattegat KAT 23659 5.7% Complete comparisons, also for other years and at non-HELCOM mea
The Sound SOU 2328 0.6% surement stations are available in online documents published in
Western Baltic WEB 18647 4.5%
connection with the annual status reports of EMEP (e.g., Gauss et al.,
Baltic Sea BAS 417587 100%
2017; 2018; 2019 for results for 2015, 2016 and 2017, respectively).
For a comparison between the EMEP model and other models the
coefficients are calculated online in the model, based on meteorological reader is referred to Karl et al. (2019) who focused on the impact of ship
data, best available land-use/vegetation data and soil moisture. The emissions on air quality, and to the publication of Vivanco et al. (2018,
particulate nitrogen species in the EMEP model that are subject to dry their Figs. 2 and 3) who also included the EMEP model in a so-called
deposition are fine nitrate (diameters up to 2.5 μm) and coarse nitrate ensemble of ‘better-performing models’ to calculate exceedances of
(diameters between 2.5 and 10 μm), as well as ammonium. The gaseous empirical critical loads for nitrogen. In particular, for wet deposition of
nitrogen species subject to dry deposition are NO2, HNO2, HNO3, PAN reduced nitrogen and for gaseous ammonia the biases of the EMEP
(=peroxyacyl nitrate/CH3COO2NO2), MPAN (= peroxymethacryloyl model were found to be very low. Nevertheless, it is clear that un
nitrate/CH2C(CH3)C(O)OONO2) and ammonia (NH3). certainties in modelling nitrogen deposition remain, as they depend on a
For wet deposition, in-cloud and sub-cloud scavenging of gases and large number of physical and chemical processes. However, when
particles are considered (release after evaporation of rain droplets is not assessing trends or when ranking emission sources by their contribution
included). Wet deposition depends strongly on precipitation, which is to nitrogen deposition, which is the focus of this paper, we assume that
taken from the meteorological data (ECMWF IFS in this study) and the errors due to model formulation affect all years and contributions
solubility of the species deposited. Both gaseous and particulate nitrogen similarly so that the main conclusions from this study should be rather
species are scavenged in the EMEP model according to their wet scav robust.
enging ratios and collection efficiencies as listed in Simpson et al. (2012,
their Table S20). 2.2. Emissions of nitrogen oxides and ammonia
2.1.3. Model evaluation Emissions are the most important input to the model, and it has to be
The EMEP model is regularly evaluated against measurements from ensured that all the main sources of nitrogen oxides and ammonia in the
the EMEP Programme and the EEA database in the framework of EMEP model domain are included. For calculations done within the
numerous research projects and operational services (e.g. Copernicus LRTAP Convention, or related conventions and commissions such as
Atmosphere Monitoring Serviceng ServiceCopernicus Atmospheric HELCOM, we normally use data provided by the EMEP Centre on
Monitoring Service or AeroCom). An evaluation of nitrogen species as Emission Inventories and Projections (CEIP), which are based on offi
modelled for the year 2017, against hourly and daily data from the cially reported data from EMEP countries (Parties to the LRTAP
EMEP measurement network for the same year, was published online by Convention) and harmonized and gap-filled by emission experts at CEIP.
Gauss et al. (2019, their Table 2.1 and accompanying figures), from
which we summarize the most relevant results here. The EMEP model 2.2.1. Emissions in 2017
version evaluated by Gauss et al. (2019) was the same as used for the For the calculations for 2017 we have used gridded emission data as
studies presented in this paper, and the horizontal resolution was provided by CEIP in June 2019 (based on officially reported emissions to
0.1◦ ×0.1◦ . As dry deposition cannot easily be measured, monitoring CEIP as of February 2019). Fig. 3 shows the percentage shares of
usually addresses concentrations in precipitation, along with wet depo different industrial sectors to each HELCOM country’s total emissions of
sition per unit area which is the product of concentration in precipita nitrogen oxides (‘NOx’ = NO and NO2) and ammonia, while the spatial
tion and the amount of precipitation itself. distribution of emissions is displayed in Fig. 4.
Concentration in precipitation depends on the air concentrations of Road transport is the major contributor to NOx emissions, but there
the species and its solubility in water. For reduced nitrogen, we have are also other important contributors, such as power generation, in
measurements of ammonium (NH4+ ) concentrations in precipitation dustry, and in some countries agriculture. With respect to ammonia
from 51 EMEP measurement stations in 2017. The spatial correlation emissions, agriculture dominates the picture completely, contributing
coefficient is 0.57 and the bias is slightly positive (+11%). For oxidized more than 80% of the total in all the nine HELCOM countries. Only the
nitrogen we have measurements of nitrate (NO−3 ) concentrations in ‘industry’ and ‘other stationary combustion’ sectors make additional
precipitation from 53 EMEP measurement stations. The spatial corre non-negligible contributions in some countries.
lation coefficient is 0.79 and the bias is slightly negative (− 9%). Pre Land-based emissions of NOx are largely correlated with population
cipitation based on input from the ECMWF IFS model has a slightly density as traffic mainly occurs in populated areas and industry is
positive bias (8%) and is well correlated with observations (R = 0.78). located nearby. Outside these hotspots, major roads and ship tracks can
Wet deposition of reduced nitrogen is overestimated by 17%, while wet be discerned in the left panel of Fig. 4. Ammonia on the other hand,
deposition of oxidized nitrogen is almost free of bias (− 1%). The positive mainly emitted by agriculture, is more evenly distributed as the main
bias in precipitation explains at least partly why the bias of wet depo fraction of emissions occurs in rural areas.
sition is slightly more positive (in the case of reduced nitrogen) or less To better illustrate the importance of different emitters, the bar
negative (in the case of oxidized nitrogen) than that of concentration in charts in Fig. 5 sort the main emitting countries by their annual total
anthropogenic emissions. Countries with large populations naturally
4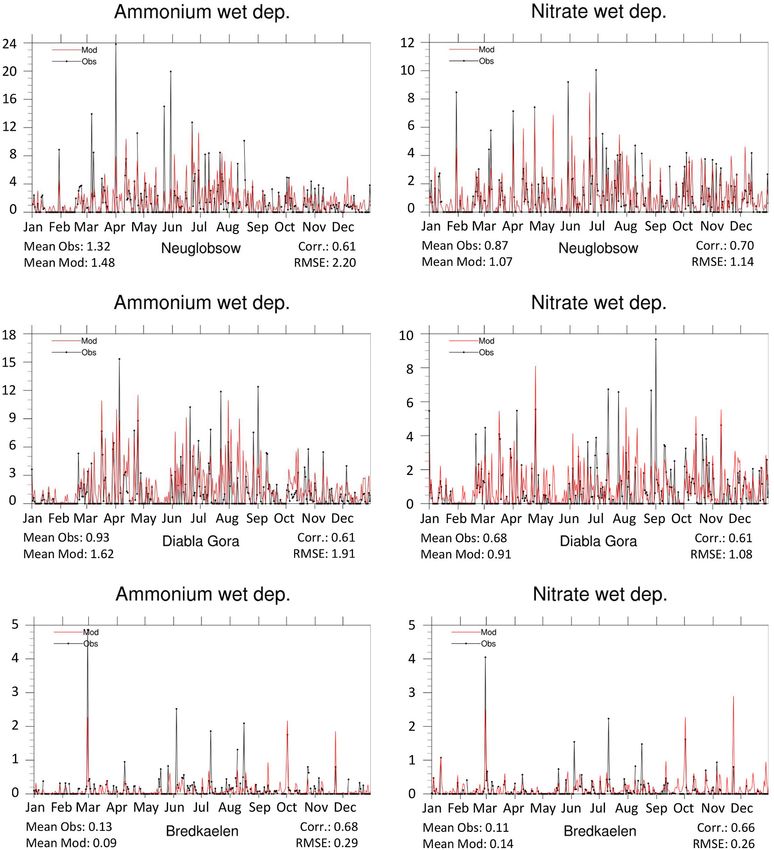
M. Gauss et al. Atmospheric Environment 253 (2021) 118377
Fig. 2. Model evaluation of the EMEP model for time series of daily modelled and observed wet deposition of nitrogen for the year 2017 at HELCOM measurement
stations in Germany (Neuglobsow 53◦ 10′ N/013◦ 02′ E), Poland (Diabla Gora 54◦ 09′ N/022◦ 04′ E) and Sweden (Bredkaelen 63◦ 51′ N/015◦ 20′ E). Unit: mg(N) m− 2
day− 1. Large peaks are usually related to heavy-precipitation events.
feature among the top emitters listed in Fig. 5. However, as will become nitrogen to the Baltic Sea.
clear in later sections, a country’s effect on nitrogen deposition to the
Baltic Sea also depends on its geographic extent, its location with respect 2.2.2. Emission trends from 2000 to 2017
to the Baltic Sea, the lifetime of the chemical species in question, and An important policy question is how emissions have evolved over the
meteorological conditions. past, in response to policy decisions in the frame of national legislation
In 2017, the total emission of ammonia over the entire EMEP model or multilateral agreements, such as the EU Air Quality Directives, the
domain (10600 Gg(N)) was larger than that of oxidized nitrogen (7889 Gothenburg Protocol, or – in the case of international shipping – regu
Gg(N)), but the deposition was largest for oxidized nitrogen in most of lations by the IMO (International Maritime Organization). In 2019, CEIP
the nine sub-basins, and over the Baltic Sea as a whole, as will be provided emission data for modelling, based on the 2019 resubmission
described in Section 3. of detailed emission data from EMEP countries for the entire 2000–2017
Natural/biogenic emissions of nitrogen, for example from lightning trend period - quality assured, gap-filled and gridded by experts. This
and soils, are not part of the EMEP reporting to CEIP. Nevertheless, the was just in time for the comprehensive trend calculations (Section 3.2),
EMEP model calculates these emissions based on meteorology and soil/ to be conducted within the HELCOM projects in support of the 2021
water properties, so that these contributions are included in the results update of the BSAP.
on depositions (Section 3). Integrated over the entire EMEP model As shown in Fig. 6, total NOx emissions from the nine HELCOM
domain, these emissions amount to about 2% and 4% of the anthropo countries have decreased from 2000 to 2017, while total ammonia
genic source of ammonia emissions and oxidized nitrogen emissions, emissions have increased slightly. Considering all countries within the
respectively. Ammonia emissions from the Baltic Sea were not included EMEP model domain, NOx emissions have decreased from 2000 to 2017
in these calculations, as they would not represent a net source of although there is a slight increase during the later years of the period
5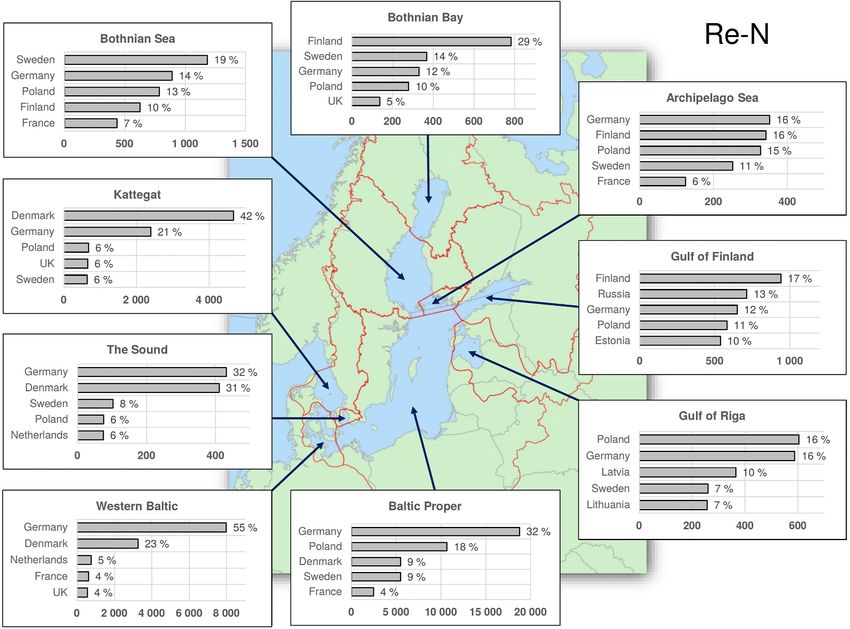
M. Gauss et al. Atmospheric Environment 253 (2021) 118377
Fig. 3. Percentage contribution from different sectors to each HELCOM country’s emission of oxidized and reduced nitrogen in 2017. The sectors are based on the
GNFR System (Gridded Nomenclature For Reporting) used by EMEP since 2017. More information about the GNFR sectors, and which processes they include, can be
found on the web pages of the EMEP Centre CEIP (https://www.ceip.at/reporting-instructions, see e.g. Annex 1 to the 2014 Guidelines for Estimating and Reporting
Emission Data). Legend of the figure: Agriculture = emissions from livestock and other processes (GNFR Sectors K + L); Transport = aviation (landing/take-off), road
traffic, off-road traffic, and inland shipping (GNFR Sectors F + G + H + I); Power = public power generation (GNFR Sector A); OtherComb = other stationary
combustion (GNFR Sector C); Other: all other sources (GNFR Sectors B + D + E + J + M).
Fig. 4. Emissions of nitrogen oxides (NOx) and ammonia (NH3) in the year 2017 as provided by CEIP for use in the EMEP model. The grid resolution is 0.1◦ ×0.1◦ .
Unit: mg(N) m− 2 yr− 1.
(mainly due to countries in the far east of the domain, which are less from the selected country or sector are. We reduce emissions from the
relevant to nitrogen deposition to the Baltic Sea). NOx emissions from selected source by 15% only - in order to stay within the linear regime of
ship traffic on the Baltic Sea are important as they are collocated with the involved physical and chemical processes in the atmosphere - and
the receptor area, i.e. the Baltic Sea basin. Over the 2000 to 2017 period then scale the difference by 100 divided by 15. In practice, emissions are
there has been a clear reduction in these emissions. Ammonia emissions reduced for one of five chemical species at a time, namely for SOx
summed over the whole model domain have been increasing over the (oxides of sulphur), NOx, NH3, PM (particulate matter) and VOC (vol
period, and much more than within the HELCOM area. atile organic compounds). Thus, we perform 5 × n model runs in total
Trends in NOx and ammonia emissions resolved for each country (where n is the number of considered sources), in addition to the base
separately, and as used for the trend study presented in Section 3.2, can run. For each source, the 5 differences (related to the 5 chemical species)
be found in the EMEP Status report 1/2019 (EMEP, 2019, their with respect to the base run are summed up in order to mimic the full
Tables B:3 to B:6). contribution from the source. This method has been used for many years
In 2017, all HELCOM countries together accounted for approxi in the EMEP MSC-W work for the LRTAP Convention. For more details
mately 22% of all NOx emissions within the EMEP domain, and for 19% on source-receptor relationships, including the Baltic Sea, also with
of all ammonia emissions. Emissions from ship traffic on the Baltic Sea respect to other chemical components the reader is referred to the
accounted for 1% of total nitrogen oxides emissions from all EMEP annual EMEP Status reports (e.g. EMEP, 2020; their appendix C).
sources. There are no ammonia emissions from ship traffic. Ideally, the sum of the contributions from all sources calculated in this
way should correspond to the total amount of pollutant (or deposition)
in the receptor area. When perturbing emissions by only 15%, and given
2.3. Perturbation method and normalization
the quasi-linearity of processes controlling nitrogen deposition, this is
almost the case, but not exactly (deviations can be up to about 5%).
To assess the contribution of an emission source (e.g. one country or
Therefore, we scale each calculated contribution by an equal factor
one industrial sector) to concentrations or depositions in a given re
requiring that the sum of all contributions be equal to the total deposi
ceptor area (e.g. the Baltic Sea), we use a perturbation method. Essen
tion calculated in the most accurate realization we have available for the
tially, this consists of performing two model runs - one with all emissions
year in question. In the case of 2017 this is the simulation that was done
included (base run), and the other one with emissions from a selected
for the EMEP Status report 1/2019 (EMEP, 2019) on 0.1◦ ×0.1◦
country or sector removed (perturbation run). The difference between
resolution.
these two simulations is then a measure of how important the emissions
6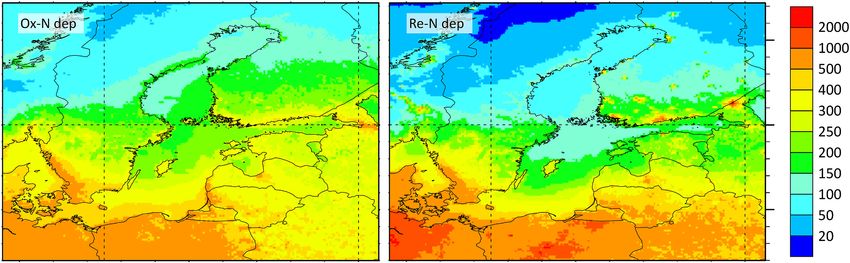
M. Gauss et al. Atmospheric Environment 253 (2021) 118377
Fig. 5. Ranked list of emitters of nitrogen oxides and ammonia in 2017. Only emission sources contributing more than 1% to nitrogen deposition to the Baltic Sea
basin are shown. Emissions from HELCOM Contracting Parties are marked in black. The numbers given here for Russia, which is not fully covered by the EMEP model
domain, include only emissions within the domain (outlined in red in Fig. 1). ‘North Sea’ and ‘Baltic Sea’ represent emissions from shipping in these sea areas. Unit:
Gg(N) yr− 1.
∑
S
Dj = Cij *Ei + BIC (1)
i=1
where S is the total number of emission sources, and BIC represents
the influence from the Boundary and Initial Conditions, i.e. how much
pollution comes from outside the model domain, and how much pollu
tion was already present at the beginning of the model simulation
(usually 1st January of the year in question). As far as air concentrations
and depositions to the Baltic Sea are concerned, BIC is usually very small
for short-lived components such as oxidized nitrogen, and negligible in
the case of reduced nitrogen species.
The transfer coefficients Cij , as defined above, depend on meteoro
logical conditions and thus vary from year to year, and so does BIC
(which in addition depends on emissions outside the model domain).
Transfer coefficients are computationally expensive to obtain, but have
been archived from detailed EMEP MSC-W source-receptor calculations
done almost every year since the 1990s.
We define the weather-normalized deposition DNjn in receptor area j
Fig. 6. Annual emissions of nitrogen oxides (blue) and ammonia (red) from all for year n as the median over the depositions calculated with transfer
EMEP sources (dashed lines, left vertical axis), from HELCOM sources (solid y
coefficients Cij for all years y for which transfer coefficients are avail
lines, left vertical axis) and from the ship emissions on the Baltic Sea (bars, right
able. For example, when using transfer coefficients from all years within
vertical axis) in the period 2000–2017, based on emission data provided by
CEIP for modelling. Note that ships emit nitrogen only in the form of NOx (not
the 1995 to 2017 period we write
ammonia). Unit: Gg(N) yr− 1. (For interpretation of the references to colour in {
∑S
}
⃒
this figure legend, the reader is referred to the Web version of this article.) DN n = median
j Cy *En + BICy ⃒ y = 1995, …, 2017
ij i (2)
i=1
Source-receptor relationships change over the years, not only
where Eni is the annual emission in source country i in the year n, for
because of changes in emissions but also due to inter-annual variability
which the normalized deposition is calculated. In addition to the me
of meteorology. Some years are more favourable to nitrogen-deposition
dian, the minimum (or maximum) depositions can be calculated, to
than others, and this also depends on the source and receptor areas in
identify which year’s meteorology would be the least (or most)
question. In order to filter out meteorological variability we calculate
favourable to deposition.
weather-normalized depositions. Basically we ask what the deposition
We define the actual deposition for the year n as
would be with one year’s emission but with another year’s meteorology.
For this we use transfer coefficients calculated annually by EMEP MSC- ∑
S
W. Transfer coefficients Cij , as defined in the EMEP context, are a Dnj = Cijn *Ein + BICn (3)
measure of how much of the annual emission Ei from a source country i
i=1
is deposited during the course of the year within the receptor area j. The Simply put, Dnj is the deposition for year n, as calculated with the
annual deposition Dj within a receptor area j is thus expressed as emission data and meteorological data for year n. Time series of actual
7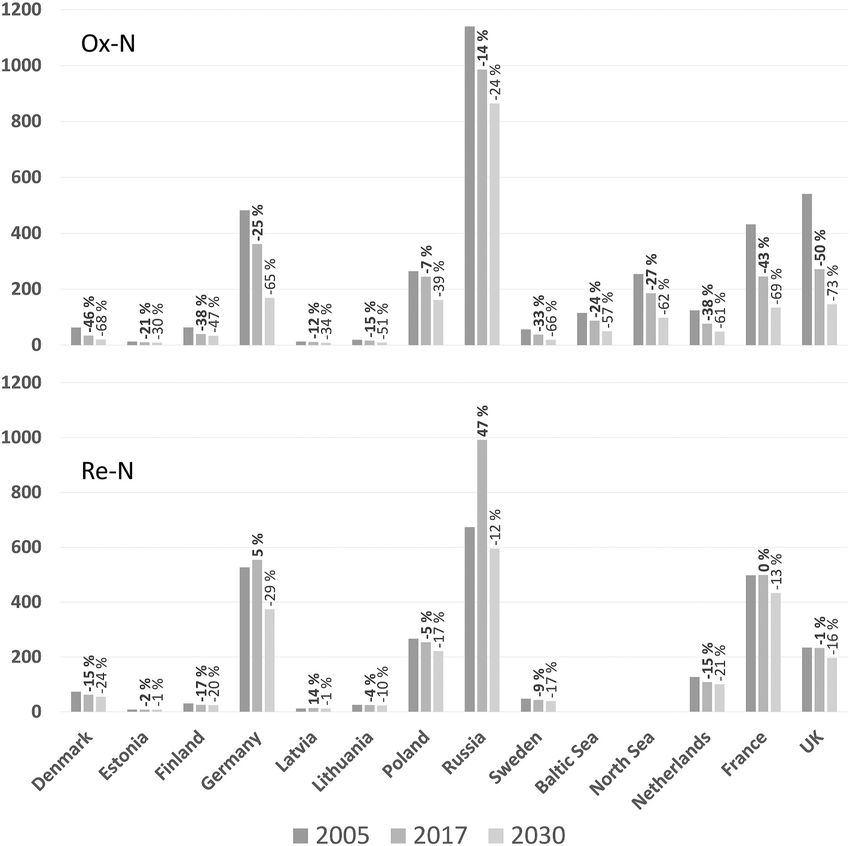
M. Gauss et al. Atmospheric Environment 253 (2021) 118377
depositions can thus be considered as the model’s closest approximation there are sharp gradients along the coasts despite significant NOx
to reality, i.e. to what the annual depositions really amounted to over the emissions occurring also over sea areas.
years of the trend period. Time series of normalized depositions, on the The total actual deposition in 2017 in the Baltic Sea amounted to
other hand, are more policy-relevant as they are based on ‘average’ 122.6 Gg(N) yr− 1, 105.3 Gg(N) yr− 1, and 227.9 Gg(N) yr− 1 for oxidized,
meteorology and thus better reflect changes in emissions over the years. reduced and total nitrogen, respectively. The weather-normalized
In the remainder of this paper, we will use the term ‘deposition’ for numbers for 2017 are 121.6 Gg(N), 101.0 Gg(N) yr− 1, and 222.9 Gg
actual deposition as defined in equation (3). When reporting normalized (N) yr− 1. The reason why the number for normalized deposition of total
depositions instead we will state this explicitly. All normalizations in nitrogen is not exactly the sum of the oxidized and reduced depositions
this paper have been done with transfer coefficients of the years is that the median of the sum of two sets is not necessarily equal to the
1995–2017, as exemplified in equation (2). sum of the medians of the two sets.
As receptor areas we consider the entire Baltic Sea and its nine sub- Deposition values for separate sub-basins will be given as part of the
basins as defined by HELCOM (see Fig. 1). As we regularly do in our trend analysis in the next section.
work for the LRTAP Convention, we report depositions of oxidized ni
trogen (including NO, NO2, HNO3 and particulate nitrates) and reduced
nitrogen species (mainly gaseous ammonia and particulate ammonium) 3.2. Trends from 2000 to 2017
separately because they are dominated by different emission sources
(see Section 2.2.1) and therefore call for different policy measures. A number of policy measures (e.g. EU NEC Directive, IMO regula
tions) have led to reductions in total nitrogen emissions (Section 2.2.2)
and thus to improvements in terms of total nitrogen deposition to the
3. Deposition of nitrogen
Baltic Sea over the last two to three decades. To inform policy decision
makers, it is important to quantify the benefits of already implemented
Source-receptor calculations are computationally demanding and
measures. For HELCOM, multi-year trends are calculated annually and
thus constitute a time-consuming effort. At the time the model was set
updated whenever new emission data become available from CEIP. The
up and all the necessary input data were collected, the latest available
last update of this kind occurred in 2019 when countries reported new
emission data were the ones valid for 2017 (as submitted to CEIP by
emission data for historical years back to the year 2000 and CEIP
February 2019). 2017 is therefore taken as ‘present-day’ in this paper.
quality-assured and gridded the data for use in the EMEP model. Time
For the trend period 2000 to 2017 (Section 3.2) the emission data set
series of actual depositions of oxidized and reduced nitrogen to the
submitted in 2019 is still the most recent one provided by CEIP and is
entire Baltic Sea basin are shown in Fig. 8. Also shown are the weather-
unlikely to be updated before 2021. For all calculations presented in this
normalized values, as well as the minimum and maximum values, as
section, the EMEP model was run on 0.1◦ ×0.1◦ resolution and the
defined in Section 2.3.
domain outlined in red in Fig. 1.
For all the years shown in Fig. 8, depositions of oxidized nitrogen are
clearly higher than those of reduced nitrogen, in spite of the larger
3.1. Status in 2017 emissions for reduced nitrogen. This reflects the longer lifetime (and
thus longer transport distance) of oxidized nitrogen species, but also the
To illustrate the horizontal distribution of deposition, maps of de proximity of international shipping on the Baltic Sea as a strong source
positions of oxidized and reduced nitrogen in the EMEP domain are of oxidized nitrogen only. However, the difference between these de
shown in Fig. 7 for the Baltic Sea and surrounding areas in 2017. As positions is getting smaller towards the end of the period. The deposition
oxidized and reduced nitrogen species have a relatively short lifetime in of oxidized nitrogen has declined from 201.3 Gg(N) yr− 1 in 2000 to
the atmosphere, most emissions are deposited close to the source areas. 122.6 Gg(N) yr− 1 in 2017, which translates into a 39% reduction over
Especially the lifetime of reduced nitrogen is rather short so that that period, while the reduction is much less pronounced for the depo
large amounts of ammonia emitted by countries on the continent do not sition of reduced nitrogen, with 119.0 Gg(N) yr− 1 deposited in 2000
reach the Baltic Sea at all. Oxidized nitrogen, on the other hand, has a versus 105.3 Gg(N) yr− 1 in 2017 (i.e. 11% less).
longer lifetime and thus has a longer transport distance, and this is also The actual deposition of total nitrogen (sum of oxidized and reduced
reflected in the Figure by a somewhat smoother distribution of oxidized deposition), is slowly declining in the selected period, by nearly 25%
nitrogen deposition. Maps showing the ratio between oxidized and from 2000 to 2017. However, the strong variation in annual deposition
reduced nitrogen deposition for all of Europe are published in the recent from year to year is clearly revealed in Fig. 8. As this type of variation is
EMEP Status report by Jonson et al. (2020; their Fig. 9.4). Nitrogen practically not present in the emissions of nitrogen oxides and ammonia
deposition is more efficient on land areas than on the sea, which is (Fig. 6), it is likely caused by varying meteorological conditions, and
confirmed in particular by the panel for oxidized nitrogen deposition as most importantly by precipitation controlling wet deposition.
Fig. 7. Depositions of nitrogen oxides (left) and ammonia (right) in the year 2017, as calculated by the EMEP model for the Baltic Sea and its surroundings. Grid
resolution: 0.1◦ ×0.1◦ . Unit: mg(N) m− 2 yr− 1.
8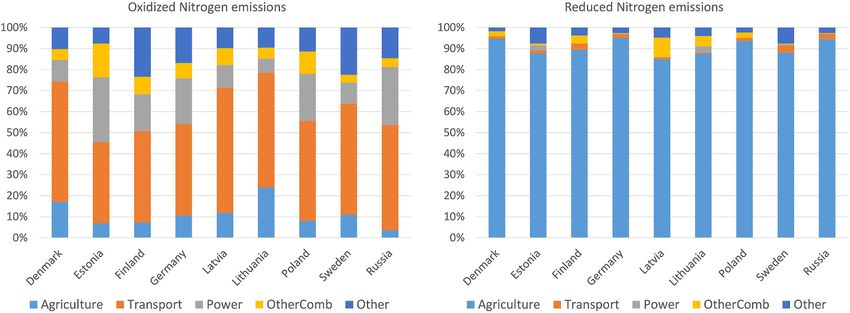
M. Gauss et al. Atmospheric Environment 253 (2021) 118377
4.2), thereby reducing long-range transport out of the source regions. A
proper analysis would need to consider seasonal variations as well as the
spatial distribution of emissions and precipitation within source coun
tries and is beyond the scope of this paper.
Fortunately, inter-annual variability due to meteorology can be
effectively filtered out by the normalization procedure explained in
Section 2.3, using meteorological data from the 1995 to 2017 period.
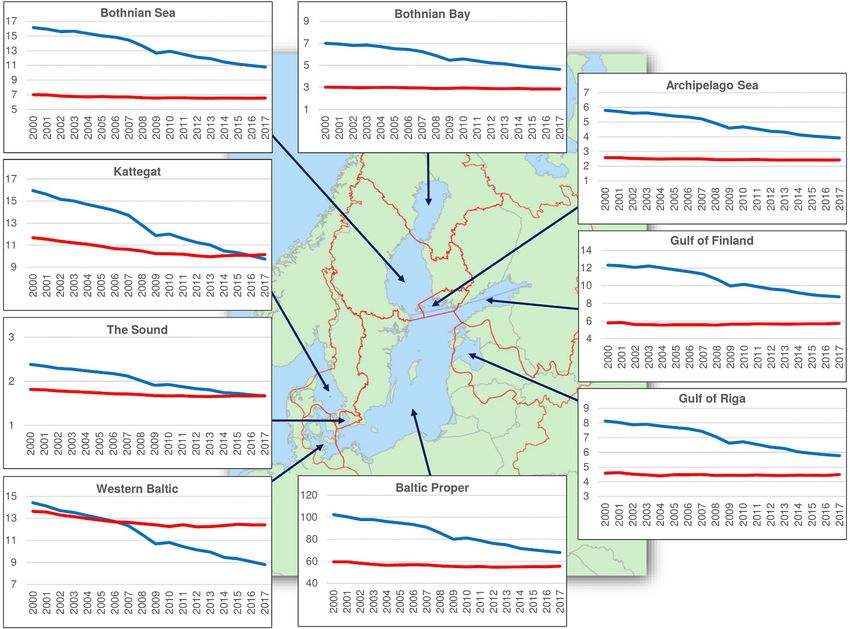
According to our calculations, normalized deposition of oxidized nitro
gen to the Baltic Sea declined by 35% and normalized deposition of
reduced nitrogen declined by 7% in the period 2000 to 2017. At first
sight, the deposition trends (shown in Fig. 8) do not appear fully
consistent with the emission trends (Fig. 6). For example, depositions of
oxidized nitrogen have declined faster than emissions, and while emis
sions of ammonia have increased slightly, its deposition has decreased.
In order to reconcile these trends one has to go into more geographical
detail. According to the emission data, reductions in NOx emissions are
more pronounced in countries and emission sources that are located
Fig. 8. Time series of depositions of oxidized (blue) and reduced (red) nitrogen upwind or closer to the Baltic Sea and thus more important for de
to the entire Baltic Sea basin during the period 2000–2017. Unit: Gg(N) yr− 1. positions to the Baltic Sea. This is the case, for example, for Denmark,
Actual, normalized, maximum and minimum values are shown (for methods Finland, Sweden and Germany, but also the strong decrease in NOx
and definitions see Section 2.3). Note that the vertical axis does not start at emissions from Baltic Sea shipping has to be mentioned in this context.
zero; thus the long-term trends and year-to-year variability may appear larger Concerning reduced nitrogen, as already mentioned in Section 2.2.2, the
than they are. (For interpretation of the references to colour in this figure main reason for the increase in ammonia emissions seen over the total
legend, the reader is referred to the Web version of this article.) EMEP domain is mainly related to countries and emission sources in the
far east of the domain, i.e. far away from the Baltic Sea. Among HELCOM
In order to illustrate the importance of wet versus dry deposition, countries, increases in ammonia emissions from 2000 to 2017 have
Fig. 9 shows wet and dry depositions of total nitrogen separately. Wet occurred predominantly downwind of the Baltic Sea (most notably
deposition is considerably larger than dry deposition in all years of the Russia), while countries located upwind to the Baltic Sea have reduced
trend period, with a ratio that is relatively stable, varying between 2.6 their ammonia emissions over the period (e.g. Denmark and Sweden) or
(in 2005) and 3.4 (in 2001 and 2012). The dominance of wet deposition increased them only slightly (e.g. Germany). Emission trends per
over dry deposition makes total deposition of nitrogen particularly country are not shown in this paper but can be viewed online in the
sensitive to precipitation, which varies significantly from year to year in HELCOM Baltic Sea Environmental Fact Sheet 2019 on nitrogen emis
the Baltic Sea (e.g. Rutgersson et al., 2002). For easier judgement, we sions (Gauss, 2019).
have included the annual precipitation to the Baltic Sea in the Figure, as The geographic variability in normalized deposition trends is illus
it explains, at least to some degree, the inter-annual variation in nitrogen trated in Fig. 10, which shows time series for the nine sub-basins of the
deposition. We note, however, that the correlation between wet depo Baltic Sea in the period 2000–2017. Normalized deposition of oxidized
sition and precipitation in the Baltic Sea is far from perfect (r = 0.27), as nitrogen is declining in all sub-basins between 2000 and 2017, but the
deposition of nitrogen to the Baltic Sea also depends on precipitation in reductions vary, from 29.1% in the Gulf of Finland to 39.0% in the
the source areas (e.g. coastal regions on land), variations in emissions, Western Baltic. The situation is different in case of normalized reduced
and long-range transport through the atmosphere. For example, wet nitrogen deposition, which is rather flat during the 2000–2017 period in
deposition was smaller in 2001 than in the previous year although most sub-basins. Nevertheless, normalized deposition of reduced nitro
precipitation in the Baltic Sea was larger. It turns out that in this case, gen is slightly lower in 2017 than in 2000 in all sub-basins, with de
annual precipitation was larger also in Germany and Poland, which are creases in the range 1.0–13.1%. It is generally lower than that of
the main source regions to nitrogen deposition to the Baltic See (Section oxidized nitrogen except for the three westernmost basins (Kattegat, The
Sound, Western Baltic) in the later years of the period. Some disconti
nuities seen in the curves for oxidized nitrogen deposition around 2008
and 2009 are related to abrupt emission changes due to the financial
crisis, which, however, did not alter the long-term trend in any of the
sub-basins. In all sub-basins, the ratio between reduced and oxidized
nitrogen deposition is systematically increasing during the period
2000–2017, as NOx emissions decline faster than ammonia emissions.
In Table 2, actual (non-normalized) depositions of total nitrogen in
the nine sub-basins and the entire Baltic Sea are listed for the entire
trend period, showing a clear downward trend in all sub-basins. For
context, the Maximum Allowable Inputs (MAI) are shown (HELCOM,
2013) along with the waterborne input and its percentage of the total
input. Numbers on waterborne input for the trend period until 2017 are
accessible online in the HELCOM Baltic Sea Environmental Fact Sheet
2020 on waterborne nitrogen and phosphorus inputs and water flow to
the Baltic Sea 1995–2018 (Svendsen and Gustafsson, 2020). Waterborne
input (mainly through river inflow) is in general much larger than
airborne deposition, but airborne deposition occurs at the surface where
Fig. 9. Time series of wet (black) and dry (grey) depositions to the Baltic Sea phytoplankton activity is greatest. Furthermore, the sum of all inputs in
basin during the period 2000–2017. Unit: Gg(N) yr− 1, left vertical axis. The 2017 actually exceeded the MAI for several of the sub-basins (BAP, GUF,
grey curve depicts the annual precipitation averaged over the Baltic Sea basin GUR) and for the Baltic Sea as a whole (BAS), which is why further
in each year of the trend period. Unit: mm yr− 1, right vertical axis. action is still needed and source allocation studies (next section) are
9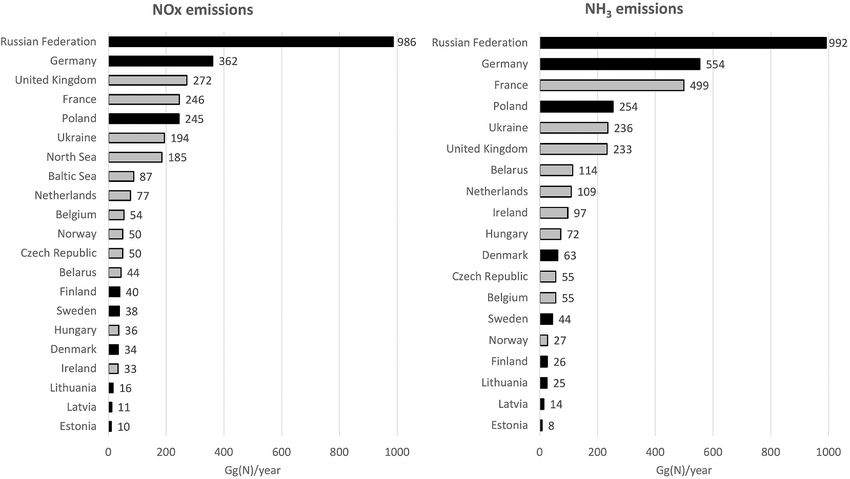
M. Gauss et al. Atmospheric Environment 253 (2021) 118377
Fig. 10. Time series of normalized depositions of oxidized (blue) and reduced (red) nitrogen to the nine sub-basins of the Baltic Sea in the period 2000–2017. Unit:
Gg(N) yr− 1. Note that the vertical axes do not start at zero; trends and year-to-year variability may thus appear larger than they are. (For interpretation of the
references to colour in this figure legend, the reader is referred to the Web version of this article.)
relevant to support appropriate policy measures. and further analysed for HELCOM with focus on the Baltic Sea and its
In the context of eutrophication, the deposition of phosphorus is sub-basins. The calculation was done on 0.3◦ longitude × 0.2◦ latitude3
much smaller than that of nitrogen in quantitative terms. After a peak horizontal resolution and the model domain outlined in red in Fig. 1.
around 1980, waterborne phosphorus deposition has been decreasing
(Gustafsson et al., 2012, their Fig. 2c) and is currently estimated at
4.1. Main contributing countries and emission sectors
roughly 28 Gg(P) yr− 1 to the whole Baltic Sea (HELCOM, 2019, their
Table 4), while there is very little information on airborne deposition of
Due to the high computational cost of source-receptor calculations,
phosphorus. Based on the few measurements available in the Baltic Sea
transfer coefficients calculated by the EMEP model by sector are not
region, annually fixed and uniform rates of between 5 mg(P) m− 2 yr− 1
available for other years than 2017, and it was therefore not possible to
(HELCOM, 2019) and 15 mg(P) m− 2 yr− 1 (Ruoho-Airola et al., 2012 and
weather-normalize contributions by sector. For consistency, we did not
references therein) have been suggested. The HELCOM estimate would
weather-normalize the contributions by country either; thus the results
translate into a total input of about 2 Gg(P) yr− 1 to the whole Baltic Sea
in this section are actual (not weather-normalized) depositions for the
(representing less than 10% of the total input of phosphorous to the
year 2017, which means that they are based on emissions and meteo
Baltic Sea) and has been used in HELCOM (2019) for the entire trend
rological data of 2017.
period 2000–2017.
In Fig. 11 we present the ranking of contributing sources to oxidized,
reduced and total (oxidized + reduced) nitrogen deposition to the Baltic
4. Source allocation budgets in 2017
Source-receptor calculations have been performed by EMEP MSC-W, 3
The EMEP domain covers mainly mid to high latitudes so that lines of
using the perturbation method described in Section 2.3, to quantify longitude are more densely spaced than lines of latitude. 0.3◦ longitude × 0.2◦
contributions from different countries and emission sectors to airborne latitude ensures that the grid cells do not deviate too much from square shapes.
nitrogen deposition. The results presented in this section are based on The resolution of the status run (0.1◦ ×0.1◦ ) would hardly be affordable in the
the source-receptor calculation for 2017 which was done in connection case of source receptor calculations as these in the EMEP setup require about
with the EMEP Status report 1/2019 (EMEP, 2019, their Appendix C) 250 annual model runs (=5 × n, where n = 50 is the number of Parties to the
LRTAP convention).
10M. Gauss et al. Atmospheric Environment 253 (2021) 118377
Table 2
Total (oxidized + reduced) nitrogen depositions in the nine sub-basins and the entire Baltic Sea (BAS) from 2000 to 2017, as calculated by the EMEP model. The
waterborne (=riverine and direct) input for 2017 (’2017wb’) as reported by Svendsen and Gustafsson (2020) as well as the Maximum Allowable Inputs (MAI) are
included in the table as well. In the context of waterborne inputs and MAI, the sub-basin ARC is usually considered as a part of BOS, while SOU and WEB are combined
into the Danish Straits (DS), which is why only one number is given for the pairs of sub-basins ARC + BOS and SOU + WEB (see Fig. 1). Green shading means that the
total (airborne + waterborne) input of nitrogen in 2017 was below MAI, while red colour shading means it was above. Unit: Gg(N) yr− 1. The numbers in the last row
indicate the percentage of waterborne input within total input of nitrogen, averaged over the 2000–2017 period (together with its standard deviation).
Year Sub-basin Baltic Sea
ARC BOS BAP BOB GUF GUR KAT SOU WEB
2000 10.1 30.5 171 12.7 19.3 12.4 31.9 3.5 29.1 320
2001 8.6 23.2 162 10.0 17.5 12.0 26.8 3.2 26.7 290
2002 7.0 18.9 151 8.1 15.1 10.1 24.6 3.0 25.9 264
2003 7.8 22.0 144 9.7 17.5 10.6 25.6 2.9 24.6 265
2004 7.1 18.2 143 8.4 17.3 10.8 23.9 2.9 26.1 258
2005 7.3 20.9 143 10.5 16.4 10.6 24.7 2.7 24.7 261
2006 7.9 22.6 159 9.0 16.1 11.0 27.9 3.1 27.5 284
2007 7.4 18.3 145 8.3 17.5 11.3 21.2 2.8 23.3 255
2008 7.8 20.1 148 8.6 19.2 12.0 23.4 2.7 24.1 266
2009 6.8 18.8 134 7.9 14.3 9.6 23.3 2.7 23.8 241
2010 7.4 21.9 144 9.4 16.9 10.6 20.5 2.4 22.3 255
2011 7.4 20.4 139 8.9 16.2 10.6 23.0 2.6 23.6 251
2012 8.5 22.5 148 10.1 17.6 11.7 23.7 2.7 23.7 269
2013 7.0 15.7 126 6.9 15.9 9.5 20.0 2.4 22.1 226
2014 6.7 19.5 133 8.1 14.5 9.0 24.0 2.6 24.3 241
2015 6.2 17.2 135 8.1 14.6 9.6 22.9 2.8 26.1 242
2016 5.5 16.9 115 7.2 13.7 8.0 20.4 2.3 23.4 212
2017 5.9 16.7 128 7.2 13.9 9.0 21.3 2.6 23.7 228
2017wb 41.9 365 48.5 109 109 45.6 38.1 756
MAI 79.4 325 57.6 102 88.4 74.0 66.0 792
wb-% 65±3 65±5 85±3 87±2 88±3 68±3 56±5 72±3
Sea basin in 2017. Contributions are shown in absolute values and as oxidized nitrogen deposition, but still, contributions from France, the
percentages of total deposition. Only top-10 contributors are shown in UK and The Netherlands feature among the top-10, with shares of 5%,
the bar charts. The combined contributions from all remaining sources 4% and 4%, respectively.
(‘Others’) are relatively small, 19% and 13% for oxidized and reduced Finally, as far as total nitrogen deposition is concerned, Germany is
nitrogen, respectively. the number one source (23%), followed by Poland and Denmark
Emissions from Germany, Baltic Sea shipping and Poland are the contributing 12% and 9%, respectively. There is an important contri
main contributing sources to oxidized nitrogen deposition, accounting bution from ship traffic on the Baltic Sea (8%). The top-10 sources are
for 17%, 15% and 12%, respectively. The absolute contribution from responsible for 81% of the airborne nitrogen deposition in 2017, HEL
Baltic Sea shipping is 18.2 Gg(N) yr− 1, which agrees very well with the COM Contracting Parties together contribute 61%, and all EU (EU-28)
value recently calculated by Raudsepp et al. (2019) with the CMAQ sources 78%.
model, i.e. 20.3 Gg(N) yr− 1 for the year 2012 (when ship emissions of Besides country rankings, an interesting policy question is which
NOx were slightly higher than in 2017). Among the HELCOM Con industrial sectors are mainly responsible for nitrogen deposition to the
tracting Parties, in addition to Germany and Poland, four other countries Baltic Sea. Table 3 summarizes the results for 2017, considering the
are among the top-10 contributors: Denmark and Sweden (5% each), entire Baltic Sea basin as the receptor area. As stated above, the actual
Russia (4%) and Finland (3%). Altogether, HELCOM nitrogen sources deposition of total nitrogen from the atmosphere to the Baltic Sea
contributed 49% to oxidized nitrogen deposition to the Baltic Sea basin amounted to 227.9 Gg(N), according to EMEP model results. Half of this
in 2017, while the contribution from all nitrogen sources within the deposition was due to the agricultural sector, while emissions from
European Union (EU-284) was 66%. A significant contribution to transport made the second largest contribution (34%).
oxidized nitrogen deposition comes from ship traffic in general, not only Agriculture is the single most important factor in most countries’
from the Baltic Sea (15%), but also from a more distant source area – the contributions, although its importance diminishes for countries that are
North Sea (9%). Besides North Sea shipping, contributions from other far away from the Baltic Sea. This is because reduced nitrogen species
distant EMEP sources are important for oxidized nitrogen deposition – have a shorter lifetime compared to oxidized nitrogen so that main
for example, the UK (8%) and The Netherlands (4%). sources of NOx, in particular Transport, play a relatively larger role for
In the case of reduced nitrogen deposition, Germany (31%) is the countries far away or downwind of the Baltic Sea. As emissions from
dominant contribution, followed by Poland and Denmark (14% each), Baltic Sea and North Sea shipping are assigned to Transport emissions
Sweden (8%) and France (5%). All other sources each contribute less only, that sector stands for 100% of the BAS and NOS contributions.
than 5%. The contribution from all HELCOM sources in this case is 80 Gg Table 3 also lists the percentage of each country’s total emission that
(N) yr− 1 which corresponds to 61% of the total deposition of reduced is deposited to the Baltic Sea. This percentage tends to be larger for
nitrogen to the Baltic Sea. This contribution is higher than in case of countries and regions that are located upwind of (or close to) the Baltic
oxidized nitrogen deposition. Also, the contribution from all sources Sea. Although wind direction is highly variable in space of time, it is
located in the European Union (EU-28) is very high, accounting for 97.7 predominantly eastward in an annual mean context.
Gg(N) yr− 1, corresponding to 93% of the total deposition of reduced Interestingly, only about one fifth of Baltic Sea ship emissions are
nitrogen to the Baltic Sea. Due to the shorter lifetime of reduced nitrogen deposited to the Baltic Sea, despite their proximity. Ships emit only
species the role of distant sources is slightly smaller than in the case of oxidized nitrogen which has a longer lifetime towards deposition than
reduced nitrogen. A relatively large fraction of that nitrogen is thus
deposited in countries downwind of the Baltic Sea. Noteworthy is also
4 the small fraction (0.4%) of Russia’s emissions that get deposited to the
In 2017, the UK was still a member of the European Union. The numbers in
this paper thus apply for EU-28. Baltic Sea. Russia is located downwind of the Baltic Sea and covers a
11You can also read