Comparing syngeneic and autochthonous models of breast cancer to identify tumor immune components that correlate with response to immunotherapy in ...
←
→
Page content transcription
If your browser does not render page correctly, please read the page content below
Lal et al. Breast Cancer Research   (2021) 23:83
https://doi.org/10.1186/s13058-021-01448-1

 RESEARCH ARTICLE                                                                                                                                   Open Access

Comparing syngeneic and autochthonous
models of breast cancer to identify tumor
immune components that correlate with
response to immunotherapy in breast
cancer
Jessica Castrillon Lal1,2,3†, Madeline G. Townsend1,2,4†, Anita K. Mehta1,2, Madisson Oliwa1,2,4, Eric Miller5,
Alaba Sotayo2, Emily Cheney1,2, Elizabeth A. Mittendorf1,2,4,6,7, Anthony Letai2,7 and Jennifer L. Guerriero1,2,4,6,7*

  Abstract
  Background: The heterogeneity of the breast tumor microenvironment (TME) may contribute to the lack of
  durable responses to immune checkpoint blockade (ICB); however, mouse models to test this are currently lacking.
  Proper selection and use of preclinical models are necessary for rigorous, preclinical studies to rapidly move
  laboratory findings into the clinic.
  Methods: Three versions of a common syngeneic model derived from the MMTV-PyMT autochthonous model were
  generated by inoculating 1E6, 1E5, or 1E4 cells derived from the MMTV-PyMT mouse into wildtype recipient mice. To
  elucidate how tumor latency and TME heterogeneity contribute to ICB resistance, comprehensive characterization of
  the TME using quantitative flow-cytometry and RNA expression analysis (NanoString) was performed. Subsequently,
  response to ICB was tested. These procedures were repeated using the EMT6 breast cancer model.
  Results: The 3 syngeneic versions of the MMTV-PyMT model had vastly different TMEs that correlated to ICB response.
  The number of cells used to generate syngeneic tumors significantly influenced tumor latency, infiltrating leukocyte
  populations, and response to ICB. These results were confirmed using the EMT6 breast cancer model. Compared to the
  MMTV-PyMT autochthonous model, all 3 MMTV-PyMT syngeneic models had significantly more tumor-infiltrating
  lymphocytes (TILs; CD3+, CD4+, and CD8+) and higher proportions of PD-L1-positive myeloid cells, whereas the MMTV-
  PyMT autochthonous model had the highest frequency of myeloid cells out of total leukocytes. Increased TILs
  correlated with response to anti-PD-L1 and anti-CTLA-4 therapy, but PD-L1expression on tumor cells or PD-1
  expression of T cells did not.

* Correspondence: JGuerriero@bwh.harvard.edu
†
 Jessica Castrillon Lal and Madeline G. Townsend contributed equally to this
work.
1
 Breast Tumor Immunology Laboratory, Susan F. Smith Center for Women’s
Cancers, Dana-Farber Cancer Institute, Boston, MA, USA
2
 Department of Medical Oncology, Dana-Farber Cancer Institute, 450
Brookline Avenue, Boston, MA 02215, USA
Full list of author information is available at the end of the article

                                        © The Author(s). 2021 Open Access This article is licensed under a Creative Commons Attribution 4.0 International License,
                                        which permits use, sharing, adaptation, distribution and reproduction in any medium or format, as long as you give
                                        appropriate credit to the original author(s) and the source, provide a link to the Creative Commons licence, and indicate if
                                        changes were made. The images or other third party material in this article are included in the article's Creative Commons
                                        licence, unless indicated otherwise in a credit line to the material. If material is not included in the article's Creative Commons
                                        licence and your intended use is not permitted by statutory regulation or exceeds the permitted use, you will need to obtain
                                        permission directly from the copyright holder. To view a copy of this licence, visit http://creativecommons.org/licenses/by/4.0/.
                                        The Creative Commons Public Domain Dedication waiver (http://creativecommons.org/publicdomain/zero/1.0/) applies to the
                                        data made available in this article, unless otherwise stated in a credit line to the data.
Lal et al. Breast Cancer Research (2021) 23:83 Page 2 of 24 Conclusions: These studies reveal that tumor cell number correlates with tumor latency, TME, and response to ICB. ICB-sensitive and resistant syngeneic breast cancer models were identified, in which the 1E4 syngeneic model was most resistant to ICB. Given the lack of benefit from ICB in breast cancer, identifying robust murine models presented here provides the opportunity to further interrogate the TME for breast cancer treatment and provide novel insights into therapeutic combinations to overcome ICB resistance. Keywords: Breast cancer, Immunotherapy, Immune checkpoint blockade, Syngeneic tumor models, Preclinical mouse models, Jessica Castrillon Lal and Madeline G. Townsend contributed equally to this work Background combination has been FDA approved for melanoma The success of immune checkpoint blockade (ICB) in [26], renal cell carcinoma [27], non-small cell lung can- various human cancer types has stimulated interest in its cer [28], and colorectal cancer [29]. use for treating breast cancer. Current therapy for breast Breast cancer has a lower mutational burden com- cancer is guided by the molecular pathology of the pared to other types of cancer, which may explain the tumor. Breast cancer is often driven by overactive hor- lack of efficacy in response to ICB [30, 31]. Despite this mone signaling (estrogen and/or progesterone receptors; generalization, triple-negative breast cancer (TNBC) has ER, PR) or amplification of growth factor response demonstrated some benefit from ICB therapy, albeit not (HER2) and treated with endocrine therapy or HER2- achieving the response rates demonstrated in melanoma targeted agents. Alternatively, patients can also be and lung cancer. While pembrolizumab (anti-PD-1) treated with classical therapies such as chemotherapy showed promising activity as a single agent against ad- and/or radiation [1–4]. After initial treatment for early- vanced or metastatic TNBC in the KEYNOTE-012 stage disease, approximately 30% of women will eventu- (NCT01848834) and KEYNOTE-086 (NCT02447003) ally develop recurrent advanced or metastatic disease clinical trials, in the randomized, Phase III KEYNOTE- [5]. Almost all who develop metastatic breast cancer will 119 (NCT02555657) clinical trial, there was no improve- succumb to the disease, highlighting the need for more ment in overall survival compared to single-agent effective strategies [6]. chemotherapy in metastatic TNBC [32]. Benefit from Advances in understanding tumor-host immune inter- ICB therapy has been observed in patients treated in the actions and their role in cancer progression have led to first-line setting and/or in patients whose tumors or im- novel therapeutic strategies for cancer. ICB aims to tar- mune cells express PD-L1 [33–35]. For example, in the get T cell inhibitory molecules using antibodies against PCD4989g (NCT01375842) clinical trial, evaluating ate- cytotoxic T-lymphocyte associated protein 4 (CTLA-4) zolizumab as a single agent, expression of PD-L1 on 1% and programmed cell death protein-1 (PD-1) as well as or greater of immune infiltrating cells was associated its ligand (PD-L1), which play an important role in cen- with a 12% ORR compared to 0% when there was no ex- tral and peripheral immune tolerance. ICB reinvigorates pression of PD-L1, and high levels of immune cell infil- anti-tumor immune responses by inhibiting negative in- tration (greater than 10%) were independently associated teractions between T cells and antigen-presenting cells with higher overall response rate (ORR) and overall (APCs) or tumor cells in several cancer types [7, 8]. In survival (OS) [34]. Importantly, there are two FDA- 2011, the first ICB agent, ipilimumab, a human mono- approved ICB therapies for breast cancer, the first that clonal antibody targeting CTLA-4, was approved by the came from the Phase III IMpassion130 (NCT02425891) FDA for treatment of metastatic melanoma based on clinical trial that demonstrated atezolizumab in combin- significant improvement in overall survival in a random- ation with nab-paclitaxel showed significant extension of ized, double-blinded phase III study [9]. Importantly, median disease-free overall survival compared to nab- ipilimumab has doubled 10-year survival for metastatic paclitaxel alone, from 15.5 to 25 months in patients with melanoma compared with historical data [10–12]. 1% or more PD-L1-positive immune cells, where there Antibodies targeting PD-1 and PD-L1 have also shown a was no benefit in PD-L1 negative tumors [36, 37]. More durable clinical response in melanoma, as well as renal recently, pembrolizumab, an anti-PD-1 antibody, in cell carcinoma, non-small cell lung cancer, and bladder combination with different chemotherapy agents, was cancer [13–20]. To date, such responses have led to also approved for the treatment of locally advanced or FDA approval of eight ICB therapies across more than metastatic TNBC, based on results from the KEYNOTE- 20 cancer types and two tissue-agnostic conditions 355 trial [38]. [21–23]. Because their effector pathways are distinct, The use of PD-L1 as a biomarker for ICB has been the combination of CTLA-4 and PD-1/PD-L1 therapy rigorously investigated but has raised concerns, includ- can provide an enhanced response [24, 25]. The ing a poor agreement between different antibodies as
Lal et al. Breast Cancer Research   (2021) 23:83                                                              Page 3 of 24

well as scoring between pathologists [39]. To date, there    cytotoxic T lymphocytes to activate adaptive immune re-
are 9 FDA approvals for the use of ICB based on a            sponses [48]; to alternatively activated macrophages
specific PD-L1 threshold and companion diagnostic,           (“M2”-like), which function to help with parasite clear-
with variable thresholds both within and across tumor        ance, exhibit tissue remodeling capabilities, and promote
types using several different assays, including approvals    tumor progression by recruiting T regulatory and Th2 T
at the following PD-L1 positive percentage thresholds: 1,    cell subsets lacking cytotoxic functions [49]. Tumor-
5, and 50%. In a recent meta-analysis that examined all      associated macrophages (TAMs) likely exhibit features
approvals of ICB as of April 2019, PD-L1 was predictive      of both M1- and M2-like macrophages but more often
in 28.9% of those approvals and was either not predictive    exhibit an M2-like phenotype that promotes tumor pro-
(53.3%) or not tested (17.8%) in the remaining approvals     gression and metastasis by secreting factors that regulate
[21]. This underscores the need to improve ICV efficacy      angiogenesis and recruit tumor-suppressive cells such as
biomarkers and assess what cells expressing PD-L1 are        T regulatory (Treg) cells [50, 51]. In line with the lack of
the most predictive of response. Other predictors of         clinical efficacy of ICB in breast cancer, preclinical stud-
response to ICB include the presence of immune cells.        ies have shown that MMTV-PyMT mice are resistant to
In HER2+ and TNBC tumors, immune cells have been             ICB monotherapy [45, 52, 53].
shown to correlate with better response to HER2-               With respect to ICB therapy in the clinical care of
targeted therapy and chemotherapy, respectively [40].        breast cancer patients, work is urgently needed to better
However, immune cell infiltration has been reported to       understand if immune cell infiltration, including type,
differ among each subtype of breast cancer [41]. Further     number, and/or phenotype, correlates to responses.
work to characterize the TME of breast tumors will           Understanding what factors are critical for ICB efficacy
provide more opportunities for ICB therapy in these          in breast cancer will allow careful patient selection and/
patients.                                                    or catalyze clinical development of novel therapies to
  Mouse models have been instrumental in understand-         distinguish non-responders to responders, improve re-
ing the molecular mechanisms of oncogenesis and              sponses that do occur, surmount acquired resistance to
metastasis. Translating in vivo preclinical findings to      immunotherapy, and identify biomarkers that can more
patients depends on how accurately the mouse model           accurately predict durable response. Using the right pre-
replicates histological markers, biochemical pathways,       clinical model is challenging. While the autochthonous
and genetic aberrations observed in the same human           MMTV-PyMT has been described to best represent the
tumor type [42]. In light of the advances in immunother-     human disease [43, 54, 55], there are significant financial
apy, it is now also necessary to meticulously characterize   and time constraints to using this model. Therefore, re-
the TME of preclinical mouse models. Here, we have           searchers have adopted the use of inoculating MMTV-
utilized different numbers of cell inoculum derived from     PyMT tumor cells into wild-type mice. With translation
the MMTV-PyMT autochthonous model of breast can-             to the clinic being of high priority, we sought to deter-
cer, in which the polyoma middle T (PyMT) oncogene is        mine how the autochthonous and derived syngeneic
driven by the mouse mammary tumor virus (MMTV)-              models align. To accomplish this, we generated three
LTR, to generate tumors in wild-type FVB/n mice re-          versions of MMTV-PyMT syngeneic models derived
ferred to as 1E6, 1E5, and 1E4, based on the number of       from the MMTV-PyMT autochthonous model and per-
cells injected to generate tumors. The MMTV-PyMT             formed deep immuno-phenotypic analysis and tested re-
model is representative of human breast carcinomas,          sponse to ICB. We identify poor concordance between
where several of the same signaling transduction             the 1E6 and 1E5 syngeneic models with the autochthon-
pathways that are commonly disrupted in human breast         ous model. The EMT6 breast cancer model was used as
cancer patients are seen in the MMTV-PyMT model,             a second model to validate these findings and remark-
such as the Src family, Ras, and PI3K kinase pathways        ably had a high correlation with observations made with
[43, 44]. In addition, both innate and adaptive immune       the MMTV-PyMT syngeneic models. In addition, we
cells infiltrate the tumor during tumorigenesis [45, 46].    identify biomarkers and immune mechanisms that cor-
Macrophages have been shown to play a key role in the        relate with response to ICB therapy.
development of these tumors, in which CCL2 recruits
inflammatory monocytes to facilitate breast tumor            Methods
growth and metastasis [47]. Additionally, it has been        Animal husbandry
shown that the phenotype is mediated through IL-4 ex-        All experiments used either virgin female Balb/c, NU/J,
pressing CD4+ T cells [46]. A spectrum of macrophage         FVB/NJ, or FVB/N autochthonous mice carrying the
phenotypes have been recognized, ranging from classic-       polyoma middle T (PyMT) transgene under the control
ally activated macrophages (“M1”-like) that are effective    of the mammary tumor virus (MMTV) promoter. The
in clearing intracellular pathogens and can recruit          FVB/NJ (001800), Balb/c (000651), and Nude (NU/J;
Lal et al. Breast Cancer Research   (2021) 23:83                                                          Page 4 of 24

002448) mice were purchased from Jackson laboratory.       reached 80–100 mm3. Tumors from mammary fat pad
All mice were maintained within the Dana-Farer Cancer      numbers 5 and 10 were excluded from the analysis. The
Center (DFCI), and all experiments were conducted          sum of the volumes for the MMTV-PyMT autochthon-
under The Institutional Animal Care and Use Commit-        ous tumors (1–4 and 5–9) was used and indicated as
tee (IACUC).                                               “total tumor burden.” Syngeneic mice that had tumor
                                                           measurements ranging between 80 and 100 mm3 were
Generation of syngeneic models                             enrolled in an experiment. At the indicated time points,
For each experiment, separate batches of tumors were       animals were euthanized in a CO2 chamber before per-
harvested from autochthonous MMTV-PyMT mice (re-           forming a cardiac perfusion with normal saline. The
ferred to as “inoculum”) using an established protocol     lungs and tumors were removed for analysis.
[56–59]. Late-stage MMTV-PyMT tumors were har-
vested, and tumor suspension was either immediately        Flow cytometry
injected into recipient FVB/NJ wild-type mice or frozen    Tumors were digested as described above, and single
for subsequent experiments. Each batch of inoculum         cells were re-suspended in a buffer containing 2% FBS
was simultaneously injected into wildtype mice using       and 2mM EDTA (Sigma-Aldrich cat. #E7889) diluted in
one million (1E6), one hundred thousand (1E5), or ten      phosphate-buffered saline (PBS) (Lift Technologies cat.
thousand (1E4) tumor cells. Each experiment was run        #10010-023). Zombie AquaTM Fixable Viability Kit (Bio-
using the same batch of inoculum, with 3–7 recipient       Legend cat. #423101) and anti-mouse CD16/CD32 Fc
mice per group. This entire protocol was repeated 3        gamma receptor II/III blocking antibody (Affymetrix cat.
times, starting with a new batch of inoculum for each      #14-0161) were diluted in PBS and applied to cells on
experiment. The tumor suspension was never cultured.       ice for 20 min in the dark on ice. Cells were washed and
Each experiment was performed with 2–3 different           incubated with fluorochrome-conjugated antibodies
batches of cells harvested from MMTV-PyMT mice.            (anti-mouse CD45 Alexa Fluor® 488, clone 30-F11, Bio-
FVB/NJ or nude mice were inoculated with one million       Legend cat. #103122; anti-mouse CD11b Brilliant Violet
(1E6), one hundred thousand (1E5), or ten thousand         711, clone M1/70, BioLegend cat. #101241; anti-mouse
(1E4) cells in the 4th mammary fat pad to generate syn-    CD3 Alexa Fluor® 594, clone 17A2, BioLegend cat.
geneic models. The wild-type mice were age-matched to      #100240; anti-mouse MHCII Brilliant Violet 421, clone
the autochthonous mice at 10–12 weeks of age. Balb/c       M5/114.15.2, BioLegend cat. #107631; anti-mouse F4/80
mice were implanted with either 1E6 or 1E4 EMT6            Alexa Fluor® 647, clone BM8, BioLegend cat. #123122;
tumor cells in the 4th mammary fat pad as described        anti-mouse CD11c Brilliant Violet 650, clone HL3, BD
above. Each experimental arm included 4–6 mice per         Biosciences cat. 564079; anti-mouse CD80 Brilliant
group.                                                     Violet 605, clone 16-10A1, BioLegend cat. #104729;
                                                           anti-mouse CD86 PerCP/Cy5.5, clone GL-1, BioLegend
Tumor digestion                                            cat. #105027; anti-mouse CD40 PE/Cy7, clone 3/23, Bio-
Tumors were extracted and minced and subsequently          Legend cat. #124621; anti-mouse CD206 PE, clone
blended using the gentleMACS Dissociator (Miltenyi         C068C2, BioLegend cat. #141706; anti-mouse CD8 PE/
Biotec cat. #130-093-235). MACS Miltenyi Tumor Dis-        Cy7, clone 53-6.7, BioLegend cat. #100721; anti-mouse
sociation Kit for mouse (Miltenyi Biotec cat. #130-096-    CD4 PE, clone GK1.5, BioLegend cat. #100408; anti-
730) was used for further enzymatic digestion according    mouse Ly-6G/Ly-6C (GR1) Brilliant Violet 650, clone
to the manufacturer’s protocol. Dissociated tumor cell     RB6-8C5, BioLegend cat. #108441; anti-mouse PD-1
suspensions were rinsed with RPMI Medium 1640 (Life        Brilliant Violet 421, clone 29F.1A12, BioLegend cat.
Technologies cat. # 11875-093), filtered using a 70 μm     #135217; anti-mouse PDL-1 PE, clone 10F.9G2, BioLe-
sterile EASY-strainerTM (Greiner bio-one cat. #542 070),   gend cat. #124307, anti-mouse CD-19 Brilliant Violet
and performed red blood cell lysis using RBC Lysis Solu-   605, clone 6D5, BioLegend cat #115539, anti-mouse
tion (Qiagen cat. #158904). The Mouse Tumor Cell Iso-      NK1.1 Alexa Fluor® 647, clone PK136, BioLegend cat.
lation Kit (Miltenyi Biotec: 130-110-187) was used to      #108719, anti-mouse CD31 Brilliant Violet 421, clone
remove CD45+ cells from the inoculum using the             390, BioLegend cat. #102423, anti-mouse Thy1.1 Bril-
Miltenyi Automacs following standard procedures.           liant Violet 650, clone OX-7, BioLegend cat. #202533,
                                                           anti-mouse Thy1.2 PerCP/Cy5.5, clone 53-2.1, BioLe-
Efficacy studies                                           gend cat. #140321) in the dark for an hour using the di-
Caliper measurements were used to calculate tumor vol-     lution recommended by the manufacturer. Following
umes for each mammary tumor using [(length x               staining, cells were rinsed with PBS buffer and fixed with
Width2)/2]. MMTV-PyMT mice were enrolled into a            1% paraformaldehyde for 5 min at room temperature.
study at about 80 days old and when each tumor             Afterward, cells were rinsed with PBS, re-suspended in
Lal et al. Breast Cancer Research (2021) 23:83 Page 5 of 24
PBS buffer, and placed in the dark at 4°C until analysis. was performed in Prism version 7 (Graphpad, Inc.).
Following extracellular staining, cells that obtained an P values are designated as *P < 0.05, **P < 0.01, and
intracellular stain were washed, fixed, and permeabilized ***P < 0.001.
using the Foxp3/Transcription Factor Staining Buffer Set
Kit (Affymetrix cat. #00-5523) according to the manu-
RNA isolation
facturer’s protocol. Cells were incubated with antibody
When syngeneic mouse tumors reached 100 mm3, tissue
(anti-mouse Granzyme B Alexa Fluor® 647, clone GB11,
samples were snap-frozen for later processing. Samples
BioLegend cat. #515405; anti-mouse FoxP3 PerCP/C5.5,
were also collected from autochthonous mice with a
clone R16-715 BD, Biosciences cat. #563902) overnight
total tumor burden in the range of 300–600 mm3.
in the dark at 4°C. The following day, cells were rinsed
Tumor specimens of 30 mg were used for RNA isolation
with PBS and re-suspended with PBS buffer for flow
using the RNeasy Mini Kit (Qiagen cat. #74104). β-
cytometric analysis on the BD LSRFortessa at the
Mercaptoethanol was added to Buffer RLT and subse-
Hematologic Neoplasia Flow Cytometry Core of the
quently added to each tumor sample. The tissue was
Dana-Farber Cancer Institute. Five hundred thousand to
disrupted and homogenized using a 20-gauge needle. An
two million cells were analyzed per sample per mouse
equal volume of 70% ethanol was added, transferred to a
using BD FACs Diva Software. Single-color controls
RNeasy spin column, and centrifuged for 30 s at 12,000
were included in the quality control analysis. Total num-
rpm. The flow-through was discarded. Buffer RW1 was
ber of mice used per experiment are shown in each
added to the RNeasy spin column and centrifuged at 12,
graph (1E6=15, 1E5=17, 1E4=14, Tg=16). In two in-
000 rpm for 30 s. The flow-through was discarded.
stances, there was one less sample due to technical or
Residual DNA was removed using the RNase-Free
experimental error and 1 mouse’s weight was not re-
DNase Set (Qiagen cat. #79254) according to the manu-
corded in the 1E6 group, and therefore, enumeration
facturer’s protocol. RPE was added to the RNeasy spin
calculations could not be performed and one tumor
column and centrifuged at 12,000 rpm for 30 s. This
sample in the 1E5 group failed on flow cytometry in the
step was repeated and centrifuged at the same speed for
intracellular staining panel. Otherwise, all samples were
2 min. RNeasy spin column was placed in a clean 2-ml
used for analysis. Data analysis and compensation were
collection tube. Samples were eluted with 50 ul of
performed on BD FACS Diva software. The absolute cell
RNase-free water for 1 min at 12,000 rpm. Samples were
number populations were calculated using the equation
analyzed by the nanodrop to detect concentration and
below:
260/230 ratio. RNA purity was assessed using the
%cell populationviable jviable cellsj Agilent Bioanalyzer 4200 at the Molecular Biology Core
Absolute cell population ¼
100tumor weight Facility of Dana-Farber Cancer Institute.
Student’s t tests were performed in Prism version 7
(Graphpad, Inc.), and P values are designated as *P < Immune profile gene analysis
0.05,**P < 0.01, and ***P < 0.001. All graphs show Purified RNA was isolated from murine tumors. Isolated
mean and error bars represent standard error of the RNA was submitted to the Center for Advanced
mean (s.e.m). Molecular Diagnostics core facility at Brigham and
Women’s Hospital. Gene expression analysis was
Dosing conducted using the nCounter PanCancer Immune
All in vivo experiments were treated with intraperitoneal Profiling panel which includes 770 immune-related
injections. Mice were treated twice a week with 200 ug genes and relevant controls. NanoString gene expres-
of InVivoMAb rat IgG2b isotype control, anti-keyhole sion values were normalized using the best subset of
limpet hemocyanin (clone LTF-2, BioXcell BE0090), the 40 reference genes included in the panel, as deter-
InVivoMab anti-mouse CTLA-4 (clone 9H10, BioXcell mined by the geNorm algorithm [60]. The nSolver
BE 0131), and InVivoMab anti-mouse PDL-1 (clone Advanced Analysis 2.0 software was used to perform
10F9G2, BioXcell BE0101). Mice were treated until all normalization. Pathway signatures were calculated
tumors reached 2 cm in one direction. Mouse weight by condensing biologically related groups of genes
was monitored and recorded weekly. Tumor volumes using the first principal component of their expression
were measured and plotted as mean total tumor burden data [61]. Cell type scores were calculated using the
± SEM. Significant differences in tumor fold change average log2 normalized expression of each cell type’s
were measured by a two-way analysis of variance marker genes. The cell type abundance scoring is
(ANOVA) multiple comparisons on ranks. The statistical modified from other reports [62] where strict cell type
significance of survival curves was assessed using the gene correlation-driven QC p values were determined
Kaplan-Meier log-rank analysis. All statistical analysis based on data that passed QC.Lal et al. Breast Cancer Research (2021) 23:83 Page 6 of 24 Results models (Fig. 1d,g). T cells (percent of CD3+ cells out Tumor-infiltrating leukocyte populations are significantly of total viable cells) accounted for a substantial frac- altered between the 4 murine breast cancer models tion of the CD45+ cells in the 1E6 and 1E5 syngeneic Three versions of preclinical breast cancer models models and was less robust in the 1E4 and transgenic were generated by isolating tumors from autochthon- models (Fig. 1d,h). This resulted in differences in the ous MMTV-PyMT mice, dissociating the tumors into ratio of T-cells to myeloid cells, where tumor models single-cell suspensions, referred to as inoculum, and with a shorter tumor latency had the highest T cell injecting 1E6, 1E5, or 1E4 cells into the 4th mam- ratios. The 1E6 model had 5.63 T cells for every 1 mary fat pad of wild-type FVB/NJ mice (Fig. 1a). Flow myeloid cell whereas the autochthonous model had cytometry was used to assess the composition of cells 2.01 T cells for every 1 myeloid cell (Fig. 1i). Add- in the inoculum that were injected into recipient mice itionally, a correlation was observed between tumor (Supl. Fig. 1a-b), which revealed that the cell suspen- latency and the number of T cells within the tumor sion was composed of approximately 15% CD45+ and (Fig. 1j). 85% CD45- cells (Fig. 1b). The CD45+ cells represented myeloid cells (CD11b+, CD11c+, F4/80+), T cells (CD3+), Subset characterization reveals differences in tumor T cell B cells (CD19+), and NK cells (NK1.1+; Supl. Fig. 1b) and immune populations among the 4 versions of the MMTV- the CD45- cells consisted of tumor cells as well as a small PyMT breast cancer models percent of both endothelial cells (CD31+) and fibroblasts To confirm the absolute numbers of immune cells in (Thy1.1+ and Thy1.2+; Fig. 1b). Tumor latency was dir- tumors, we determined the proportion of T cells per ectly related to the number of cells that were inoculated gram of tumor tissue as well as their frequency out of into the mammary fat pad, as inoculating fewer cells cor- CD45+ cells. The extent of T cell infiltration out of related with a longer time to reach 100 mm3 (Fig. 1c). It gram of tissue (Fig. 2a) was similar to the findings out took approximately 10, 15, and 30 days for tumors to of total viable cells (Fig. 1h), which reflects the abso- reach a volume of 80–100 mm3 in the 1E6, 1E5, and 1E4 lute increase in numbers of T cells out of all cells in models, respectively, while it took approximately 80 days the tumor. This trend was consistent with the absolute for each tumor on the autochthonous model to reach 100 numbers of CD8+ and CD4+ T cells (Fig. 2a). The dif- mm3 (Fig. 1c). ference in absolute numbers of T cells prompted fur- To test if tumor latency influences immune cell ther investigation into immune cell subpopulations infiltration or phenotype, immunophenotyping was and their respective phenotypes. Using flow cytometry, performed on tumors generated in each breast cancer T cell populations were characterized out of CD3+ model. For baseline immune profiling, tumors were cells including CD4+FoxP3+ (T regulatory cells; Tregs), harvested when they reached 100 mm3 because this is CD4+FoxP3-, and CD8+ T cells (gating strategy shown generally the size of tumors when animals are in Supl. Fig. 2a). The absolute number of CD8+ and enrolled in efficacy studies. In addition, tumors that CD4+ cells in the syngeneic models was significantly are 100 mm3 allow for immune cell analysis without higher than the autochthonous model (Fig 2a). The areas of tumor necrosis. Flow cytometry revealed a same pattern emerged when gated as a frequency out significant difference in the frequency of leukocytes of CD45+ cells (Fig. 2b). Tregs are responsible for (CD45+ cells) within the tumor as a percentage of dampening the cytotoxic T lymphocyte (CTL) re- total viable cells (Fig. 1d). Tumors with the shortest sponses and are characterized by expression of the latency (1E6 and 1E5 models) had the highest abso- transcription factor FoxP3 [63]. The Treg population lute number of infiltrating leukocytes as measured by increased in the 1E5 and 1E4 models (Fig. 3a,b), and CD45+ cells out of total viable cells (Fig. 1e, Supl. there were no changes in the frequency of CD8 T cells Fig.1c). Strikingly, in the 1E6 and 1E5 models, im- out of total CD3+ cells (Fig. 3c,e). The ratio of mune cells were the major cell type within tumors, CD4+CD3+ cells over CD8+CD3+ cells was highest in representing more than 60% of the total cells in the the 1E6 model (Fig. 3f). A different gating strategy was tumor which may represent an acute inflammatory re- used to identify the frequency of FoxP3+ cells out of sponse from the inoculation (Fig. 1e). T cells (CD3+) CD4+ T cells (Tregs) as well as the frequency of gran- and myeloid cells (CD11b+) made up the majority of zyme b (GrB)+ CD8+ T cells (cytotoxic T lymphocytes; the CD45+ cells; with less than 5% contribution from CTLs). This revealed that the 1E5 and 1E4 models other CD45+ cells (Fig. 1f–h). Myeloid cells (percent again had the highest frequency of Tregs, whereas the of CD11b+ cells out of a total of viable cells) were autochthonous model had the highest frequency of consistent in their frequency between the syngeneic GrB+CD8+ CTLs (Fig. 3g,h). This resulted in a significant models; however, the autochthonous model had sig- increase in the CTL:Treg ratio in the autochthonous nificantly fewer myeloid cells than the 1E6 and 1E5 model compared to the 1E5 and 1E4 models (Fig. 3i).
Lal et al. Breast Cancer Research    (2021) 23:83   Page 7 of 24

 Fig. 1 (See legend on next page.)
Lal et al. Breast Cancer Research    (2021) 23:83                                                                                      Page 8 of 24

 (See figure on previous page.)
 Fig. 1 The number of cancer cells inoculated in preclinical models influences tumor growth kinetics as well as the tumor microenvironment. a
 Tumors from the autochthonous MMTV-PyMT model were harvested and single-cell suspensions were generated. Cells (1E6, 1E5, or 1E4) were
 injected into the mammary fat pad of FVB/NJ wild-type mice. When the tumors reached 100 mm3, mice were randomized into an experimental
 group. b Tumor inoculum was generated on three separate days, and flow cytometry was performed to identify the cell proportions. c Tumor
 volumes were measured every 3–4 days until individual tumors reached 100 mm3; tumor volumes are plotted as average tumor burden ± SEM.
 d–j Tumors were obtained when they reached 100 mm3, and flow cytometry was performed. d Proportion of major cell types are shown. e
 Percent of CD45+ cells out of total viable cells. f–h Proportion of CD3+, CD11b+, and other CD45+ cells of total viable cells. i Ratio of CD3+ to
 CD11b+ out of viable cells. j Regression analysis of the proportion of CD3+ out of viable cells, to time for tumor to reach 100 mm3. Graphs show
 mean ±SEM from at least two independent experiments with at least three mice per group. Each data point represents an individual mouse. *P<
 0.05, **P
Lal et al. Breast Cancer Research    (2021) 23:83   Page 9 of 24

 Fig. 2 (See legend on next page.)
Lal et al. Breast Cancer Research    (2021) 23:83                                                                                     Page 10 of 24

 (See figure on previous page.)
 Fig. 2 Tumor-infiltrating leukocyte populations differ significantly in the different versions of the MMTV-PyMT breast tumor model. Tumors from
 the autochthonous MMTV-PyMT model were harvested and single-cell suspensions were generated. Cells (1E6, 1E5, or 1E4) were injected into the
 mammary fat pad of FVB/NJ wild-type mice. When the tumors reached 100 mm3, tumors were obtained and processed into a single-cell
 suspension for immunophenotyping by flow cytometry. a Analysis comparing the absolute number of lymphocytes (CD3+) and lymphocyte
 subsets (CD8+ and CD4+) per gram of tissue. b Analysis comparing the frequency of lymphocytes (CD3+) and lymphocyte subsets (CD4+ and
 CD8+) out of total CD45+ cells. c Analysis comparing the absolute number of myeloid cells (CD11b+) and myeloid cell subsets (F4/80+ and
 Gr1+CD11b+) per gram of tissue. d Analysis of myeloid cell subsets as a percent of total CD45+ cells. Graphs show mean ±SEM from at least two
 independent experiments with at least three mice per group. Each data point represents an individual mouse. Unpaired two-tailed t test. *P
Lal et al. Breast Cancer Research    (2021) 23:83                                                                                   Page 11 of 24

 Fig. 4 Myeloid immune cell subsets differ significantly between the different versions of the MMTV-PyMT breast tumor model. Tumors from the
 autochthonous MMTV-PyMT model were harvested and single-cell suspensions were generated. Cells (1E6, 1E5, or 1E4) were injected into the
 mammary fat pad of FVB/NJ wild-type mice. When tumors reached 100 mm3, tumors were obtained and processed into a single-cell suspension
 for immunophenotyping by flow cytometry. a–d Analysis of cells subsets as a percent of myeloid cells (CD11b+) include a myeloid-derived
 suppressor cells (MDSC (GR1+)), b PD-L1+F4/80+, c PD-L1– F4/80+, and d other CD11b+ populations; e Analysis of the myeloid cells subsets as a
 percent of viable cells include f analysis of PD-L1 expression on myeloid cells (CD11b+) and g cancer cells represented by CD45-. h Analysis of
 the ratio of lymphocytes expressing PD-1. i Analysis of M1-like macrophage markers, CD40+, CD80+, and CD86+ and an M2-like macrophage
 marker, CD206+, as a ratio of total myeloid cells (CD11b+, top), and mature macrophages (F4/80+, bottom). Graphs show mean ± SEM from at
 least two independent experiments with at least three mice per group. Each data point represents an individual mouse. Unpaired two-tailed t
 test. *P
Lal et al. Breast Cancer Research    (2021) 23:83   Page 12 of 24

 Fig. 5 (See legend on next page.)
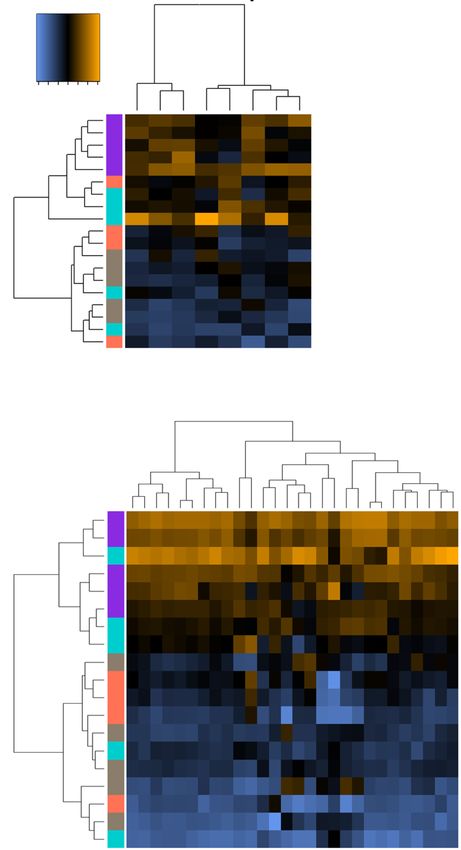
Lal et al. Breast Cancer Research       (2021) 23:83                                                                               Page 13 of 24

 (See figure on previous page.)
 Fig. 5 The different versions of the MMTV-PyMT breast tumor model have distinct immune transcriptional signatures. Tumors from the
 autochthonous MMTV-PyMT model were harvested and single-cell suspensions were generated. Cells (1E6, 1E5, or 1E4) were injected into the
 mammary fat pad of FVB/NJ wild-type mice. When tumors reached 100 mm3, tumors were obtained, and RNA was extracted from tumors to
 assess transcriptional changes. The NanoString PanCancer Immune Profiling Panel was used to analyze gene expression patterns related to the
 immune cell compartment of the tumors. a A heatmap of all cell-type scores is shown. b Quantification of cell types scores of immune cells, T
 cells, and macrophages are shown. c Hierarchically clustered heatmap showing the pathway scores across the four models. Yellow and blue
 represent upregulated and downregulated scores, respectively. d Signature scores from the following pathways are highlighted: inflammation,
 adaptive immunity, T cell function, innate immunity, dendritic cell functions, macrophage functions, MHC, and antigen processing. e Normalized
 log2 counts are shown for the following transcripts: Cd274 (PD-L1), Ctla4, Ccr2, and Ccl2. Graphs show mean ± standard deviation with 4–5 mice
 per group. Each data point represents an individual mouse. Unpaired two-tailed t test. *P
Lal et al. Breast Cancer Research     (2021) 23:83                                                                           Page 14 of 24

Table 2 List of Top 20 differential expression of immune transcripts in 1E5 versus autochthonous model
Transcript          Gene Sets                                                           Probe ID              Log2 fold change    P-value
Birc5-mRNA          Apoptosis, Cell Cycle, Cytokines & Receptors                        NM_009689.2:237       1.67                3.78E-08
Hif1a-mRNA          Apoptosis, Cancer Progression                                       NM_010431.2:1294      0.653               7.39E-08
Runx1-mRNA                                                                              NM_001111021.1:3055   -1.36               1.32E-07
Psma2-mRNA          Cancer Progression                                                  NM_008944.2:136       0.22                4.69E-07
Ltbr-mRNA           Apoptosis, TNF Superfamily                                          NM_010736.3:1962      0.30                2.77E-06
Tfe3-mRNA           Humoral                                                             NM_172472.3:2715      -0.56               3.63E-06
Tfrc-mRNA           CD molecules, Transporter Functions                                 NM_011638.3:1930      0.91                6.57E-06
Saa1-mRNA           Adhesion, Cytokines & Receptors, Innate, Macrophage Functions       NM_009117.3:351       -2.45               8.98E-06
Bax1-mRNA           Apoptosis, Transporter Functions                                    NM_007527.3:735       0.59                9.66E-06
Smad4-mRNA          Cancer Progression                                                  NM_008540.2:2885      -0.31               1.88E-05
Ccl27a-mRNA         Cytokines & Receptors                                               NM_001048179.1:265    -0.77               2.64E-05
Dusp4-mRNA          Basic Cell Functions, Innate                                        NM_176933.4:2200      1.29                3.53E-05
Mapk14-mRNA         Innate, Senescence, Transporter Functions                           NM_001168513.1:114    0.25                4.33E-05
Glycam1-mRNA        Adhesion                                                            NM_008134.2:124       -5.41               4.39E-05
Casp1-mRNA          Cytokines & Receptors, Innate, Interleukins, Microglial Functions   NM_009807.2:259       1.01                5.58E-05
Tank-mRNA           Basic Cell Functions, Innate                                        NM_011529.1:491       0.33                8.05E-05
Ctsl-mRNA           Basic Cell Functions                                                NM_009984.3:45        -0.69               8.31E-05
Jak3-mRNA           B-Cell Functions, Cytokines & Receptors, Innate, Interleukins,      NM_010589.5:145       -0.71               8.42E-05
                    T-Cell Functions
Ikzf1-mRNA          B-Cell Functions, NK Cell Functions, T-Cell Functions               NM_001025597.1:4420   -1.66               1.22E-04
Psmb7-mRNA          Basic Cell Functions                                                NM_011187.1:184       0.22                1.65E-04

increase in overall survival (Fig. 6a). The 1E5 model had                     either unsorted (original) or sorted inoculum in the 1E6
a small yet significant decrease in total tumor burden                        or 1E4 versions of the models were treated with either
with the anti-CTLA-4 monotherapy at day 14, but did                           vehicle or anti-CTLA4 plus anti-PD-L1. The unsorted
not translate to an increase in overall survival; however,                    1E6 inoculum responded to ICB but the 1E4 did not
the combination of anti-CTLA-4 plus anti-PD-L1 in-                            (Fig. 7e), as previously demonstrated (Fig. 6a). The
duced a reduction of tumor burden at 14 days that led                         sorted inoculum in the 1E6 model displayed modest yet
to improved overall survival (Fig. 6b, Supl. Fig. 7b). Both                   significant responses to ICB at day 10 but those re-
the 1E4 and the autochthonous model were resistant to                         sponses did not continue to day 14 (Fig. 7e). The fact
monotherapy as well as combination therapy (Fig. 6c-d,                        that both the sorted and unsorted 1E6 tumors displayed
Supl. Fig. 8c-d).                                                             some responses, while 1E4 sorted and unsorted tumors
  To test if initial cell density is a driver of response to                  did not suggest that while immune cells co-injected with
ICB or if residual immune cells in the inoculum account                       tumor cells may play, in part, some role in activating an
for these differences, CD45+ cells were successfully re-                      acute immune response that sensitizes the tumor to ICB,
moved from the inoculum (referred to as sorted) and                           the number of tumor cells used is also important. To
compared to the original inoculum for their growth rate                       further test if different numbers of pure cell cultures
and response to ICB (Fig. 7a–b). In the immunocompe-                          would evoke differences in tumor latency, TME and re-
tent FVB/NJ mice all three models (1E6, 1E5, and 1E4)                         sponse to ICB, 1E6, and 1E4 EMT6 tumor cells were in-
inoculated with unsorted and sorted inoculum grew at                          oculated into immunocompetent wild-type mice. As
similar rates (Fig. 7c). In nude mice, which lack a func-                     with the 1E6 MMTV-PyMT syngeneic tumors, the 1E6
tional immune system, the unsorted cells grew faster in                       EMT6 tumors demonstrated faster tumor growth com-
nude mice compared to FVB/NJ mice, as expected (Fig.                          pared to corresponding 1E4 tumors (Fig. 7f). When
7c). The nude mice reached the endpoint in a cell                             EMT6 tumors reached 100–150 mm3, mice were en-
density-dependent manner (Fig. 7d). In the FVB/n                              rolled in efficacy experiments. Similar to the 1E6
model, when tumors in the 1E6 and 1E4 versions of the                         MMTV-PyMT syngeneic tumors, the 1E6 EMT tumors
model tumors reached 100–150 mm3, mice were en-                               had a delay in progression in response to ICB, whereas
rolled into efficacy experiments. FVB/n mice bearing                          the 1E4 models were not responsive (Fig. 7g). Taken
Lal et al. Breast Cancer Research (2021) 23:83 Page 15 of 24
Table 3 List of Top 20 differential expression of immune transcripts in 1E4 versus autochthonous model
Transcript Gene Sets Probe ID Log2 fold change P-value
Glycam1-mRNA Adhesion NM_008134.2:124 -9.09 1.34E-07
Itgb4-mRNA Adhesion, CD molecules NM_001005608.2:3355 1.73 2.23E-07
Birc5-mRNA Apoptosis, Cell Cycle, Cytokines & Receptors NM_009689.2:237 1.43 2.83E-07
Saa1-mRNA Adhesion, Cytokines & Receptors, Innate, Macrophage Functions NM_009117.3:351 -3.13 5.19E-07
Il6ra-mRNA CD molecules, Chemokines & Receptors, Cytokines & Receptors, NM_010559.2:2825 -1.61 5.86E-07
Interleukins
Hif1a-mRNA Apoptosis, Cancer Progression NM_010431.2:1294 0.53 1.12E-06
Tnfrsf10b-mRNA Apoptosis, CD molecules, TNF Superfamily NM_020275.3:1625 0.93 1.40E-06
C4b-mRNA Complement Pathway, Humoral, Inflammation, Innate NM_009780.2:491 -2.51 6.68E-06
Il1rap-mRNA Cytokines & Receptors, Inflammation, Innate, Interleukins NM_008364.2:2415 0.84 7.95E-06
Cd200-mRNA CD molecules NM_010818.3:686 1.19 8.63E-06
Casp1-mRNA Cytokines & Receptors, Innate, Interleukins, Microglial Functions NM_009807.2:259 1.13 1.76E-05
Gpi1-mRNA Apoptosis, Cytokines & Receptors, Humoral NM_008155.4:1540 0.53 2.43E-05
Mif-mRNA B-Cell Functions, Cytokines & Receptors, Inflammation, Innate, NM_010798.2:373 0.62 2.84E-05
Transporter Functions
Vegfa-mRNA Apoptosis, Cytokines & Receptors, Macrophage Functions, NM_001025250.3:3015 1.78 2.85E-05
T-Cell Functions
Kit-mRNA CD molecules, Cytokines & Receptors NM_001122733.1:4275 1.06 3.52E-05
Tank-mRNA Basic Cell Functions, Innate NM_011529.1:491 0.35 4.55E-05
Lcp1-mRNA T-Cell Functions, Transporter Functions NM_001247984.1:3344 -0.59 5.19E-05
Bax-mRNA Apoptosis, Transporter Functions NM_007527.3:735 0.49 6.44E-05
Atm-mRNA Apoptosis, B-Cell Functions, Cell Cycle, Senescence NM_007499.2:5543 -0.62 7.50E-05
App-mRNA Apoptosis, Cell Cycle, Innate, Transporter Functions NM_007471.2:511 0.64 8.04E-05
together these results indicate that tumor cell numbers currently lacking. In addition, there is a critical need for
used to generate tumors correspond to tumor growth biomarkers to predict response to ICB in breast cancer.
kinetics and response to ICB in two different murine Given the substantial heterogeneity of the TME,
models. conclusions based on specific mouse models might limit
To gain insight into what may correlate with ICB generalizations, especially regarding the detailed
response, MMTV-PyMT tumors were regrouped into ei- characterization of molecular signaling mechanisms. The
ther predicted responders (1E6 and 1E5 tumors) or pre- MMTV-PyMT autochthonous model has been exten-
dicted non-responders (1E4 and autochthonous; Supl. sively characterized and is one of the few models avail-
Fig. 9a). Nanostring gene expression from predicted re- able to study Luminal B breast cancer. MMTV-PyMT
sponders and non-responders clustered by immune cell mice develop spontaneous mammary tumors that closely
score, where predicted responders had higher scores re- resemble the progression and morphology of human
lated to CD45, T cells, cytotoxic T cells, NK CD56 dim breast cancers [43, 54, 55]. Notably, gene expression
cells, macrophages, and dendritic cells (DCs; Supl. Fig. profiling has revealed that MMTV-PyMT tumors cluster
9b-c). Responders and non-responders also clustered in closely with ERα-negative “luminal” human breast can-
the pathway analysis, where the inflammation pathway cers [68], which is a gene signature similar to the
revealed significant differences between the responders luminal-AR (LAR) TNBC subtype characterized by high
and non-responders (Supl. Fig. 9d-e). This data suggests AR expression [69] and the molecular apocrine ER/PR-
that total immune cell infiltrate as well exhaustive im- negative, but AR+ tumors described prior to molecular
mune cell phenotypes may correspond to the success of subtyping [70]. The pathology of the autochthonous
ICB therapy within the context of these versions of the murine breast tumors provides numerous ways to model
MMTV-PyMT breast cancer model (Supl. Fig. 10). human breast cancer in vivo. Here, we report that the
1E6 and 1E5 corresponding syngeneic models do not re-
Discussion capitulate the autochthonous model. Our findings pre-
Mouse models are critical to the rapid and successful sented here are essential for future preclinical studies
translation of preclinical findings to the clinic yet are and translation to the clinic.Lal et al. Breast Cancer Research (2021) 23:83 Page 16 of 24 Fig. 6 (See legend on next page.)
Lal et al. Breast Cancer Research     (2021) 23:83                                                                                     Page 17 of 24

 (See figure on previous page.)
 Fig. 6 The different versions of the MMTV-PyMT syngeneic model respond differently to immune checkpoint blockade. Tumors from the
 autochthonous MMTV-PyMT model were harvested and single-cell suspensions were generated. Cells (1E6, 1E5, or 1E4) were injected into the
 mammary fat pad of FVB/NJ wild-type mice. When the tumors reached 100 mm3, mice were randomized into four treatment groups: vehicle
 (IgG2B), anti-PD-L1, anti-CTLA-4, and the combination of anti-PD-L1 and anti-CTLA-4. Tumor volumes were measured and plotted as the mean
 total tumor burden ± SEM (left) and survival analysis of mice are shown (right). Shown is a representative experiment of two individual
 experiments n=3–7/treatment groups for the 1E6 (a), 1E5 (b), 1E4 (c), and transgenic models (d). In Fig. 6d, all mice were sacrificed on the same
 day due to meeting endpoint criteria. Two-way ANOVA multiple comparisons and Gehan-Breslow-Wilcoxon tests were performed. *P
Lal et al. Breast Cancer Research    (2021) 23:83   Page 18 of 24

 Fig. 7 (See legend on next page.)
Lal et al. Breast Cancer Research    (2021) 23:83                                                                                  Page 19 of 24

 (See figure on previous page.)
 Fig. 7 Testing tumor growth kinetics and immunotherapy response in immunodeficient and EMT6 murine models. Tumors from the
 autochthonous MMTV-PyMT model were harvested and single-cell suspensions were generated. a CD45+ cells were successfully removed
 (“sorted”). b Cells (1E6, 1E5, or 1E4) were injected into the mammary fat pad of FVB/NJ wild-type or nude mice. c-d Tumor volumes were
 measured and plotted as the mean total tumor burden ± SEM and the survival of nude mice are shown (d). e When the tumors reached 100
 mm3, mice were randomized to treatment with Vehicle (IgG2B) or the combination of anti-PD-L1 plus anti-CTLA-4. f–g Babl/c mice were
 implanted with 1E6 or 1E4 tumor cells, and tumor growth kinetics (f) and response to vehicle and combination of anti-PD-L1 plus anti-CTLA-4 (g)
 were plotted. Tumor volumes were measured and plotted as the mean total tumor burden ± SEM. *P
Lal et al. Breast Cancer Research       (2021) 23:83                                                                              Page 20 of 24

Table 4 Published studies on immunotherapy response in syngeneic murine models
Reference                   Model                Tumor cells Tumor size Time to start Outcome
                                                 Inoculated (mm3)       treating (d)
Kim et al.                  4T1                  5.00E6     400        11             Tumor eradication with PD-1/CTLA-4 at day 15
PNAS 2014
                            CT26                 5.00E6     400        11             Tumor eradication with PD-1/CTLA-4 at day 15
Lian et al                  4T1                  1.00E5     Not        24             PD-L1/CD74 dual blockade reduced lung metastasis
Sci Rep 2019                                                reported
Clift et al.                4T1/EMT6             1.00E5     100-150    Not reported   PD-L1 blockade +PVHA inhibited tumor growth
Cancer Res 2019
Sun et al.                  4T1                  1.00E6     100-150    3              CTLA-4 and PD-1 blockade promoted T cell infiltration
Mol Cancer Ther 2020
Xie et al.               4T1                     5.00E6
Lal et al. Breast Cancer Research (2021) 23:83 Page 21 of 24
treatment of breast cancer. Shedding light on why the Supplemental Figure 7. Pathway analysis by NanoString. a. The heat-
ICB-sensitive models are sensitive to ICB therapy and pro- map summarizes the mRNA transcripts categorized by their respective
viding syngeneic models to study ICB resistance is a major pathway. Shown are the signature scoring differences of the syngeneic
models compared to the transgenic model. Orange represents higher
advancement for the study of immunotherapy in breast than average scores; blue represents lower than average scores. b-d. Vol-
cancer and represents a unique opportunity to further in- cano plots representing differential expression analysis of genes
terrogate biomarkers of response to ICB. expressed in the 1E6 (top), 1E5 (middle), 1E4 model (bottom) compared
to the transgenic model. Volcano plots show fold change (log2) versus
log10 p-values. False discovery rate thresholds are shown (FDRLal et al. Breast Cancer Research (2021) 23:83 Page 22 of 24
Availability of data and materials 8. Pardoll DM. The blockade of immune checkpoints in cancer
The datasets used and/or analyzed during the current study are available immunotherapy. Nat Rev Cancer. 2012;12:252–64. https://doi.org/10.1038/
from the corresponding author on reasonable request. nrc3239 PMC4856023 Nihms779907.
9. Hodi FS, O'Day SJ, McDermott DF, Weber RW, Sosman JA, Haanen JB, et al.
Improved survival with ipilimumab in patients with metastatic melanoma. N
Declarations Engl J Med. 2010;363:711–23. https://doi.org/10.1056/NEJMoa1003466
PMC3549297.
Ethics approval and consent to participate 10. Schadendorf D, Hodi FS, Robert C, Weber JS, Margolin K, Hamid O, et al.
All mice were maintained within the Dana-Farer Cancer Center (DFCI), and Pooled analysis of long-term survival data from phase II and phase III trials
all experiments were conducted under The Institutional Animal Care and Use of ipilimumab in unresectable or metastatic melanoma. J Clin Oncol. 2015;
Committee (IACUC). 33:1889–94. https://doi.org/10.1200/JCO.2014.56.2736 PMC5089162 are
found at the end of this article.
Consent for publication 11. Tsao H, Atkins MB, Sober AJ. Management of cutaneous melanoma. N Engl
n/a J Med. 2004;351(10):998–1012. https://doi.org/10.1056/NEJMra041245.
12. Lipson EJ, Drake CG. Ipilimumab: an anti-CTLA-4 antibody for metastatic
melanoma. Clin Cancer Res. 2011;17:6958–62. https://doi.org/10.1158/1078-
Competing interests 0432.CCR-11-1595 PMC3575079.
J.L.G. is a consultant for Glaxo-Smith Kline (GSK), Array BioPharma, Codagenix, 13. Brahmer JR, Tykodi SS, Chow LQ, Hwu WJ, Topalian SL, Hwu P, et al. Safety
and Verseau and receives sponsored research support from GSK, Eli Lilly, and and activity of anti-PD-L1 antibody in patients with advanced cancer. N
Array BioPharma. E.A.M has served on SABs for Astra-Zeneca/Medimmune, Engl J Med. 2012;366:2455–65. https://doi.org/10.1056/NEJMoa1200694
Celgene, Genentech, Genomic Health, Merck, Peregrine Pharmaceuticals, PMC3563263 Nihms396200.
SELLAS Lifescience, and Tapimmune and has clinical trial support to her 14. Powles T, Foreshew SJ, Shamash J, Sarwar N, Crabb S, Sahdev A, et al.
former institution (MDACC) from astra-zeneca/Medimmune, EMD-Serono, A phase Ib study investigating the combination of everolimus and
Galena Biopharma, and Genentech as well as Genentech support to a SU2C dovitinib in vascular endothelial growth factor refractory clear cell renal
grant, as well as sponsored Research Support to the laboratory from GSK cancer. Eur J Cancer. 2014;50(12):2057–64. https://doi.org/10.1016/j.ejca.2
and Eli Lilly. A.L. is a consultant for Astra-Zeneca, receives sponsored research 014.04.021.
support from Novartis, and serves on the scientific advisory board for Flash 15. Baumeister SH, Freeman GJ, Dranoff G, Sharpe AH. Coinhibitory pathways in
Therapeutics, Zentalis, and Dialectic. E.M. is an employee and stockholder of immunotherapy for cancer. Annu Rev Immunol. 2016;34(1):539–73. https://
NanoString Technologies. doi.org/10.1146/annurev-immunol-032414-112049.
16. Postow MA, Callahan MK, Wolchok JD. Immune checkpoint blockade in
Author details cancer therapy. J Clin Oncol. 1974-1982, 2015;33. https://doi.org/10.1200/
1
Breast Tumor Immunology Laboratory, Susan F. Smith Center for Women’s JCO.2014.59.4358 PMC4980573.
Cancers, Dana-Farber Cancer Institute, Boston, MA, USA. 2Department of 17. Topalian SL, Drake CG, Pardoll DM. Immune checkpoint blockade: a
Medical Oncology, Dana-Farber Cancer Institute, 450 Brookline Avenue, common denominator approach to cancer therapy. Cancer Cell. 2015;27:
Boston, MA 02215, USA. 3Genomic Medicine Institute, Lerner Research 450–61. https://doi.org/10.1016/j.ccell.2015.03.001 PMC4400238.
Institute, Cleveland Clinic, Cleveland, OH 44195, USA. 4Division of Breast 18. Vokes EE, Ready N, Felip E, Horn L, Burgio MA, Antonia SJ, et al. Nivolumab
Surgery, Department of Surgery, Brigham and Women’s Hospital, Boston, MA versus docetaxel in previously treated advanced non-small-cell lung cancer
02115, USA. 5Nanostring Technologies, Seattle, WA, USA. 6Breast Oncology (CheckMate 017 and CheckMate 057): 3-year update and outcomes in
Program, Dana-Farber/Brigham and Women’s Cancer Center, Boston, MA, patients with liver metastases. Ann Oncol. 2018;29(4):959–65. https://doi.
USA. 7Ludwig Center for Cancer Research at Harvard, Harvard Medical org/10.1093/annonc/mdy041.
School, Boston, MA, USA. 19. Antonia SJ, Villegas A, Daniel D, Vicente D, Murakami S, Hui R, et al.
Overall survival with durvalumab after chemoradiotherapy in stage III
Received: 22 July 2020 Accepted: 22 June 2021 NSCLC. N Engl J Med. 2018;379(24):2342–50. https://doi.org/10.1056/
NEJMoa1809697.
20. Overman MJ, McDermott R, Leach JL, Lonardi S, Lenz HJ, Morse MA, et al.
References Nivolumab in patients with metastatic DNA mismatch repair-deficient or
1. Waks AG, Winer EP. Breast cancer treatment: a review. Jama. 2019;321(3): microsatellite instability-high colorectal cancer (CheckMate 142): an open-
288–300. https://doi.org/10.1001/jama.2018.19323. label, multicentre, phase 2 study. Lancet Oncol. 2017;18:1182–91. https://doi.
2. Early Breast Cancer Trialists’ Collaborative Group, Davies C, Godwin J, Gray R, org/10.1016/S1470-2045(17)30422-9 PMC6207072.
Clarke M, Cutter D, et al. Relevance of breast cancer hormone receptors and 21. Davis AA, Patel VG. The role of PD-L1 expression as a predictive biomarker:
other factors to the efficacy of adjuvant tamoxifen: patient-level meta- an analysis of all US Food and Drug Administration (FDA) approvals of
analysis of randomised trials. Lancet. 2011;378:771–84. https://doi.org/10.101 immune checkpoint inhibitors. Journal for ImmunoTherapy of Cancer. 2019;
6/S0140-6736(11)60993-8 PMC3163848. 7(1):278. https://doi.org/10.1186/s40425-019-0768-9.
3. Slamon DJ, Leyland-Jones B, Shak S, Fuchs H, Paton V, Bajamonde A, et al. 22. Twomey JD, Zhang B. Cancer immunotherapy update: FDA-approved
Use of chemotherapy plus a monoclonal antibody against HER2 for checkpoint inhibitors and companion diagnostics. AAPS J. 2021;23(2):39.
metastatic breast cancer that overexpresses HER2. N Engl J Med. 2001;344: https://doi.org/10.1208/s12248-021-00574-0.
783–92. https://doi.org/10.1056/nejm200103153441101. 23. Eddy JA, Thorsson V, Lamb AE, Gibbs DL, Heimann C, Yu JX, et al. CRI iAtlas:
4. Correa C, Harris EE, Leonardi MC, Smith BD, Taghian AG, Thompson AM, an interactive portal for immuno-oncology research. F1000Res. 2020;9:1028.
et al. Accelerated partial breast irradiation: executive summary for the https://doi.org/10.12688/f1000research.25141.1 PMC7658727.
update of an ASTRO evidence-based consensus statement. Pract Radiat 24. Wolchok JD, Chiarion-Sileni V, Gonzalez R, Rutkowski P, Grob JJ, Cowey CL,
Oncol. 2017;7(2):73–9. https://doi.org/10.1016/j.prro.2016.09.007. et al. Overall survival with combined nivolumab and ipilimumab in
5. O'Shaughnessy J. Extending survival with chemotherapy in metastatic advanced melanoma. N Engl J Med. 2017;377:1345–56. https://doi.org/10.1
breast cancer. Oncologist. 2005;10(Suppl 3):20–9. https://doi.org/10.1634/ 056/NEJMoa1709684 PMC5706778.
theoncologist.10-90003-20. 25. Postow MA, Callahan MK, Wolchok JD. Immune checkpoint blockade in
6. Emens LA. Breast cancer immunotherapy: facts and hopes. Clin Cancer Res. cancer therapy. Journal of clinical oncology : official journal of the American
2018;24:511–20. https://doi.org/10.1158/1078-0432.CCR-16-3001 Society of Clinical Oncology. 2015;33(17):1974–82. https://doi.org/10.1200/
PMC5796849. JCO.2014.59.4358.
7. Das R, Verma R, Sznol M, Boddupalli CS, Gettinger SN, Kluger H, et al. 26. Larkin J, Chiarion-Sileni V, Gonzalez R, Grob JJ, Cowey CL, Lao CD, et al.
Combination therapy with anti-CTLA-4 and anti-PD-1 leads to distinct Combined nivolumab and ipilimumab or monotherapy in untreated
immunologic changes in vivo. J Immunol. 2015;194:950–9. https://doi.org/1 melanoma. N Engl J Med. 2015;373:23–34. https://doi.org/10.1056/NEJMoa1
0.4049/jimmunol.1401686 PMC4380504 NIHMS645624. 504030 PMC5698905.You can also read